catalent pharma solutions, inc. and subsidiaries and ... pharma solutions, inc. and subsidiaries and...
TRANSCRIPT
Catalent Pharma Solutions, Inc. and Subsidiaries and Predecessor Unaudited Consolidated and Combined Condensed Financial Statements As of September 30, 2007 and June 30, 2007, And for the Three Months Ended September 30, 2007 and September 30, 2006
On April 10, 2007, certain businesses of the Pharmaceutical Technologies and Services segment of Cardinal Health, Inc. (the “Acquired Businesses”) were acquired by an entity controlled by affiliates of The Blackstone Group, a global private investment and advisory firm (“Blackstone’), pursuant to a Purchase and Sale Agreement dated as of January 25, 2007. This financial report presents the consolidated financial position, results of operations and cash flows of the Acquired Businesses as a stand-alone entity, Catalent Pharma Solutions, Inc. (the “Company” or the “Successor”) and the combined financial position, results of operations and cash flows of the Acquired Businesses as a segment of Cardinal Health, Inc, (the “Predecessor”) As of the end of the period covered by this report, the Company was not subject to the reporting requirements of Section 13 or 15(d) of the Securities Exchange Act of 1934, as amended. Consequently, this report has not and will not be filed with the Securities and Exchange Commission (“SEC”). However, the Company is obligated pursuant to its senior PIK-election note and senior subordinated note indentures, dated as of April 10, 2007, to post, on its website or provide to the Trustee, financial information that the Company would be required to file with the SEC were it subject to Sections 13 or 15(d) of the Securities Exchange Act of 1934, as amended, subject to exceptions consistent with the presentation of financial information in the Offering Memorandum, dated April 4, 2007, relating to the $565,000,000 9 ½%/10¼% Senior PIK-Election Notes due 2015 and the €225,000,000 9 ¾% Senior Subordinated Notes due 2017 (the “Offering Memorandum”). This report is made available pursuant to such obligation.
“Safe Harbor” SPrivate Securities Litig
This financial report contains both hAll statements other than statements of hforward-looking statements within the mAct of 1933, as amended, and Section 211934, as amended. These forward-lookinfacts, but rather are based on assumptionmanagement in light of their experience current conditions, expected future develbe appropriate. These forward-looking stuse of statements that include phrases su“intend”, “estimate”, “plan”, “project”, “or other words or phrases with similar mour objectives, plans or goals are, or mayforward-looking statements are not guarasubject to risks and uncertainties that coubusiness decisions to differ materially frolooking statements. Risks and uncertaintindustry conditions and competition; prodesign, development, manufacture and menhance our existing or introduce new teeconomic conditions, such as interest rattechnological advances and patents attaindebt and debt service requirements that rflexibility and impose significant interesby law, we do not intend to publicly updstatements, whether as a result of new inaddition, forward-looking statements arethat could cause actual results to differ mexperience and our present expectations uncertainties include, but are not limitedMemorandum.
tatement Under the ation Reform Act of 1995
istorical and forward-looking statements. istorical fact are, or may be deemed to be, eaning of Section 27A of the Securities E of the Securities Exchange Act of g statements are not based on historical s and assessments made by our and their perception of historical trends, opments and other factors they believe to atements generally can be identified by the ch as “believe,” “expect,” “anticipate”, foresee”, “likely”, “may”, “will”, “would” eanings. Similarly, statements that describe be, forward-looking statements. Any ntees of future performance and are ld cause actual results, developments and m those contemplated by such forward-
ies include, but are not limited to general duct or other liability risk inherent in the arketing of our offerings; inability to chnology or services in a timely manner; e and currency exchange rate fluctuations; ed by competitors; and our substantial
estrict our operating and financial t and financial costs. Except as required ate or revise any forward-looking formation, future events or otherwise. In subject to certain risks and uncertainties aterially from the Company’s historical or projections. These risks and to, those described in the Offering
Non-GAAP Financial Matters
In addition to disclosing financial results that are determined in accordance with U.S. GAAP, we disclose EBITDA and Adjusted EBITDA, which are non-GAAP measures. You should not consider EBITDA or Adjusted EBITDA as an alternative to operating or net earnings, determined in accordance with U.S. GAAP, as an indicator of our operating performance, or as an alternative to cash flows from operating activities, determined in accordance with U.S. GAAP, as an indicator of cash flows, or as a measure of liquidity. EBITDA is calculated by the sum of earnings before interest, taxes, depreciation and amortization. Our credit facilities and the indentures governing our outstanding notes have certain covenants that use ratios utilizing a measure referred to as Adjusted EBITDA. The supplementary adjustments to EBITDA to derive Adjusted EBITDA may not be in accordance with current SEC practices or the rules and regulations adopted by the SEC that apply to periodic reports filed under the Securities Exchange Act of 1934. Accordingly, the SEC may require that Adjusted EBITDA be presented differently in filings made with the SEC than as presented in this release, or not be presented at all. The most directly comparable GAAP measure to EBITDA and Adjusted EBITDA is net earnings (loss). Included in this report is a reconciliation of earnings/(loss) to EBITDA and to Adjusted EBITDA. We believe EBITDA and Adjusted EBITDA are measures commonly used by investors to evaluate our performance and that of our competitors. EBITDA and Adjusted EBITDA are not presentations made in accordance with U.S. GAAP and our use of the terms EBITDA and Adjusted EBITDA varies from others in our industry. EBITDA and Adjusted EBITDA should not be considered as alternatives to net income (loss), operating income or any other performance measures derived in accordance with U.S. GAAP as measures of operating performance or operating cash flows as measures of liquidity. EBITDA and Adjusted EBITDA have important limitations as analytical tools and you should not consider them in isolation or as substitutes for analysis of our results as reported under U.S. GAAP. For example, EBITDA and Adjusted EBITDA:
• exclude certain tax payments that may represent a reduction in cash available to us;
• do not reflect any cash capital expenditure requirements for the assets being depreciated and amortized that may have to be replaced in the future; • do not reflect changes in, or cash requirements for, our working capital needs; and • do not reflect the significant interest expense, or the cash requirements necessary to service interest or principal payments, on our debt.
Financial Statement Index Unaudited Consolidated and Combined Financial Statements and Notes Condensed Statements of Operations 2 Condensed Balance Sheets 3 Condensed Statement of Changes in Equity 4 Condensed Statements of Cash Flows 5 Notes to Unaudited Consolidated and Combined Condensed Financial Statements 6 – 17 Management’s Discussion and Analysis of Financial Condition and Results of Operations
18 - 29
1
UNAUDITED CONSOLIDATED AND COMBINED CONDENSED FINANCIAL STATEMENTS AND NOTES
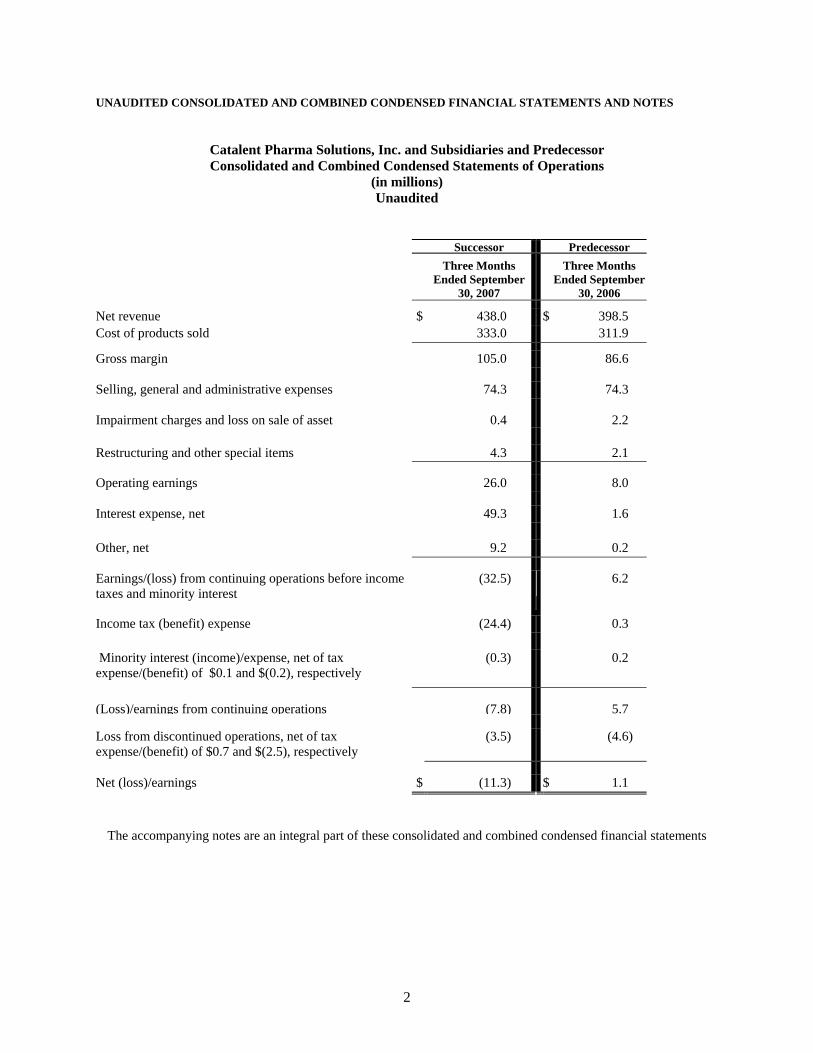
Catalent Pharma Solutions, Inc. and Subsidiaries and Predecessor Consolidated and Combined Condensed Statements of Operations
(in millions) Unaudited
Successor Predecessor
Three Months Ended September
30, 2007
Three Months Ended September
30, 2006
Net revenue $ 438.0 $ 398.5 Cost of products sold 333.0 311.9
Gross margin 105.0 86.6
Selling, general and administrative expenses 74.3 74.3
Impairment charges and loss on sale of asset 0.4 2.2 Restructuring and other special items 4.3 2.1 Operating earnings 26.0 8.0 Interest expense, net 49.3 1.6 Other, net 9.2 0.2 Earnings/(loss) from continuing operations before income taxes and minority interest
(32.5) 6.2
Income tax (benefit) expense (24.4) 0.3 Minority interest (income)/expense, net of tax expense/(benefit) of $0.1 and $(0.2), respectively
(0.3) 0.2
(Loss)/earnings from continuing operations (7.8) 5.7 Loss from discontinued operations, net of tax expense/(benefit) of $0.7 and $(2.5), respectively
(3.5) (4.6)
Net (loss)/earnings $ (11.3) $ 1.1
The accompanying notes are an integral part of these consolidated and combined condensed financial statements
2
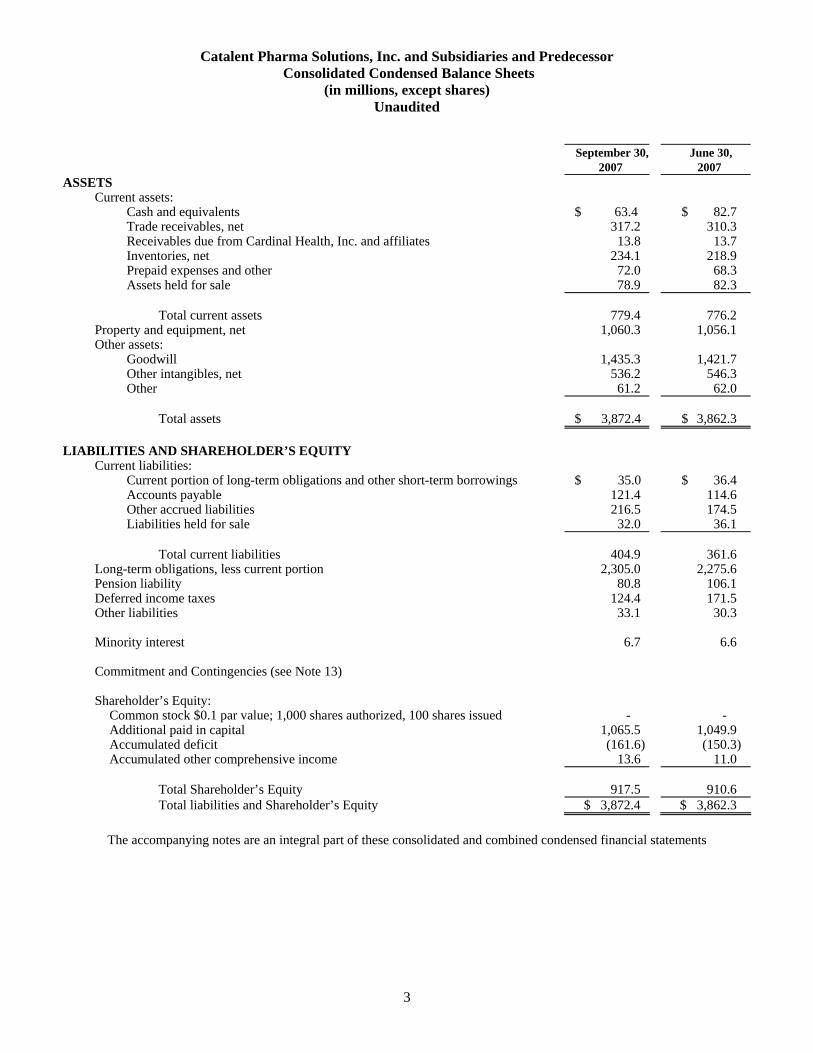
Catalent Pharma Solutions, Inc. and Subsidiaries and Predecessor Consolidated Condensed Balance Sheets
(in millions, except shares) Unaudited
September 30, 2007
June 30, 2007
ASSETS Current assets:
Cash and equivalents $ 63.4 $ 82.7 Trade receivables, net 317.2 310.3 Receivables due from Cardinal Health, Inc. and affiliates 13.8 13.7 Inventories, net 234.1 218.9 Prepaid expenses and other 72.0 68.3 Assets held for sale 78.9 82.3
Total current assets 779.4 776.2
Property and equipment, net 1,060.3 1,056.1 Other assets:
Goodwill 1,435.3 1,421.7 Other intangibles, net 536.2 546.3 Other 61.2 62.0
Total assets $ 3,872.4 $ 3,862.3
LIABILITIES AND SHAREHOLDER’S EQUITY
Current liabilities: Current portion of long-term obligations and other short-term borrowings $ 35.0 $ 36.4 Accounts payable 121.4 114.6 Other accrued liabilities 216.5 174.5 Liabilities held for sale 32.0 36.1
Total current liabilities 404.9 361.6
Long-term obligations, less current portion 2,305.0 2,275.6 Pension liability 80.8 106.1 Deferred income taxes 124.4 171.5 Other liabilities 33.1 30.3 Minority interest 6.7 6.6 Commitment and Contingencies (see Note 13) Shareholder’s Equity:
Common stock $0.1 par value; 1,000 shares authorized, 100 shares issued - - Additional paid in capital 1,065.5 1,049.9 Accumulated deficit (161.6) (150.3) Accumulated other comprehensive income 13.6 11.0
Total Shareholder’s Equity 917.5 910.6 Total liabilities and Shareholder’s Equity $ 3,872.4 $ 3,862.3
The accompanying notes are an integral part of these consolidated and combined condensed financial statements
3
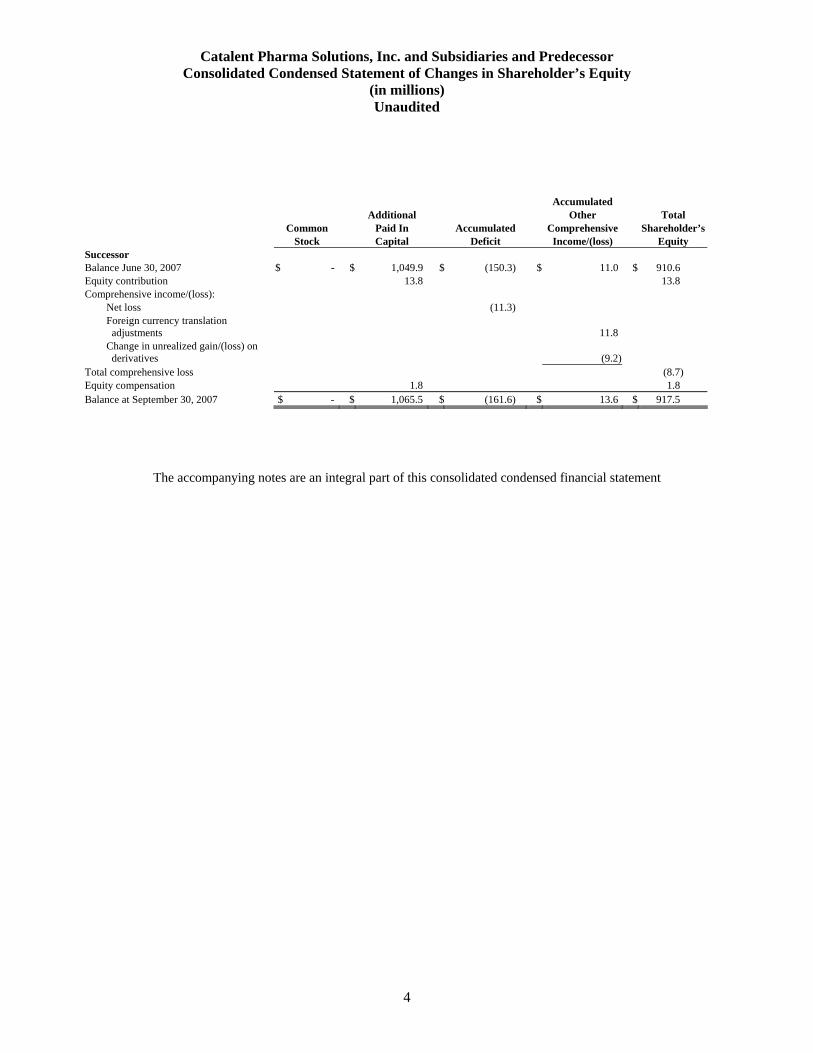
Catalent Pharma Solutions, Inc. and Subsidiaries and Predecessor Consolidated Condensed Statement of Changes in Shareholder’s Equity
(in millions) Unaudited
4
Accumulated Additional Other Total Common Paid In Accumulated Comprehensive Shareholder’s Stock Capital Deficit Income/(loss) Equity
Successor Balance June 30, 2007 $ - $ 1,049.9 $ (150.3) $ 11.0 $ 910.6 Equity contribution 13.8 13.8 Comprehensive income/(loss):
Net loss (11.3) Foreign currency translation adjustments
11.8
Change in unrealized gain/(loss) on derivatives
(9.2)
Total comprehensive loss (8.7) Equity compensation 1.8 1.8 Balance at September 30, 2007 $ - $ 1,065.5 $ (161.6) $ 13.6 $ 917.5
The accompanying notes are an integral part of this consolidated condensed financial statement
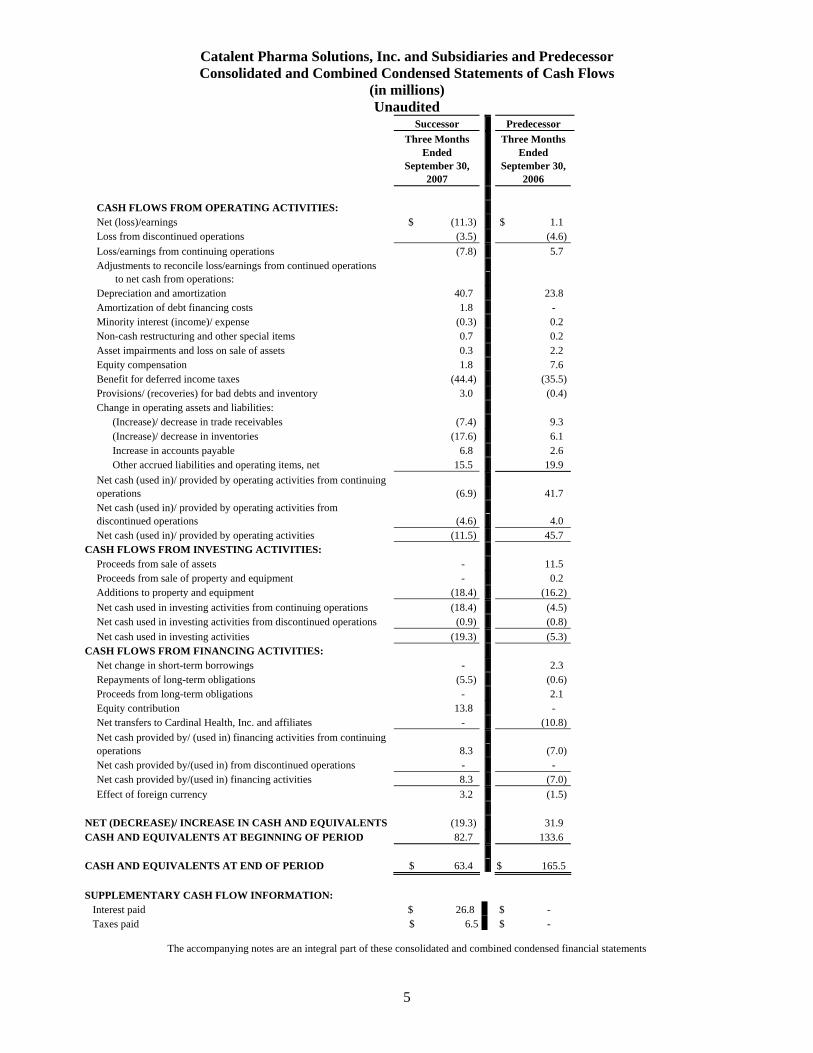
Catalent Pharma Solutions, Inc. and Subsidiaries and Predecessor Consolidated and Combined Condensed Statements of Cash Flows
(in millions) Unaudited
Successor Predecessor
Three Months Ended
September 30, 2007
Three Months Ended
September 30, 2006
CASH FLOWS FROM OPERATING ACTIVITIES: Net (loss)/earnings $ (11.3) $ 1.1 Loss from discontinued operations (3.5) (4.6) Loss/earnings from continuing operations (7.8) 5.7
Adjustments to reconcile loss/earnings from continued operations to net cash from operations:
Depreciation and amortization 40.7 23.8 Amortization of debt financing costs 1.8 - Minority interest (income)/ expense (0.3) 0.2 Non-cash restructuring and other special items 0.7 0.2 Asset impairments and loss on sale of assets 0.3 2.2 Equity compensation 1.8 7.6 Benefit for deferred income taxes (44.4) (35.5) Provisions/ (recoveries) for bad debts and inventory 3.0 (0.4) Change in operating assets and liabilities: (Increase)/ decrease in trade receivables (7.4) 9.3 (Increase)/ decrease in inventories (17.6) 6.1 Increase in accounts payable 6.8 2.6 Other accrued liabilities and operating items, net 15.5 19.9
Net cash (used in)/ provided by operating activities from continuing operations (6.9) 41.7
Net cash (used in)/ provided by operating activities from discontinued operations (4.6) 4.0
Net cash (used in)/ provided by operating activities (11.5) 45.7 CASH FLOWS FROM INVESTING ACTIVITIES: Proceeds from sale of assets - 11.5 Proceeds from sale of property and equipment - 0.2 Additions to property and equipment (18.4) (16.2) Net cash used in investing activities from continuing operations (18.4) (4.5) Net cash used in investing activities from discontinued operations (0.9) (0.8) Net cash used in investing activities (19.3) (5.3) CASH FLOWS FROM FINANCING ACTIVITIES: Net change in short-term borrowings - 2.3 Repayments of long-term obligations (5.5) (0.6) Proceeds from long-term obligations - 2.1 Equity contribution 13.8 - Net transfers to Cardinal Health, Inc. and affiliates - (10.8)
Net cash provided by/ (used in) financing activities from continuing operations 8.3 (7.0)
Net cash provided by/(used in) from discontinued operations - - Net cash provided by/(used in) financing activities 8.3 (7.0) Effect of foreign currency 3.2 (1.5) NET (DECREASE)/ INCREASE IN CASH AND EQUIVALENTS (19.3) 31.9 CASH AND EQUIVALENTS AT BEGINNING OF PERIOD 82.7 133.6
CASH AND EQUIVALENTS AT END OF PERIOD
$ 63.4 $ 165.5
SUPPLEMENTARY CASH FLOW INFORMATION: Interest paid $ 26.8 $ - Taxes paid $ 6.5 $ -
The accompanying notes are an integral part of these consolidated and combined condensed financial statements
5
Catalent Pharma Solutions, Inc. and Subsidiaries and Predecessor Notes to Consolidated and Combined Condensed Financial Statements
(in millions, except shares) Unaudited
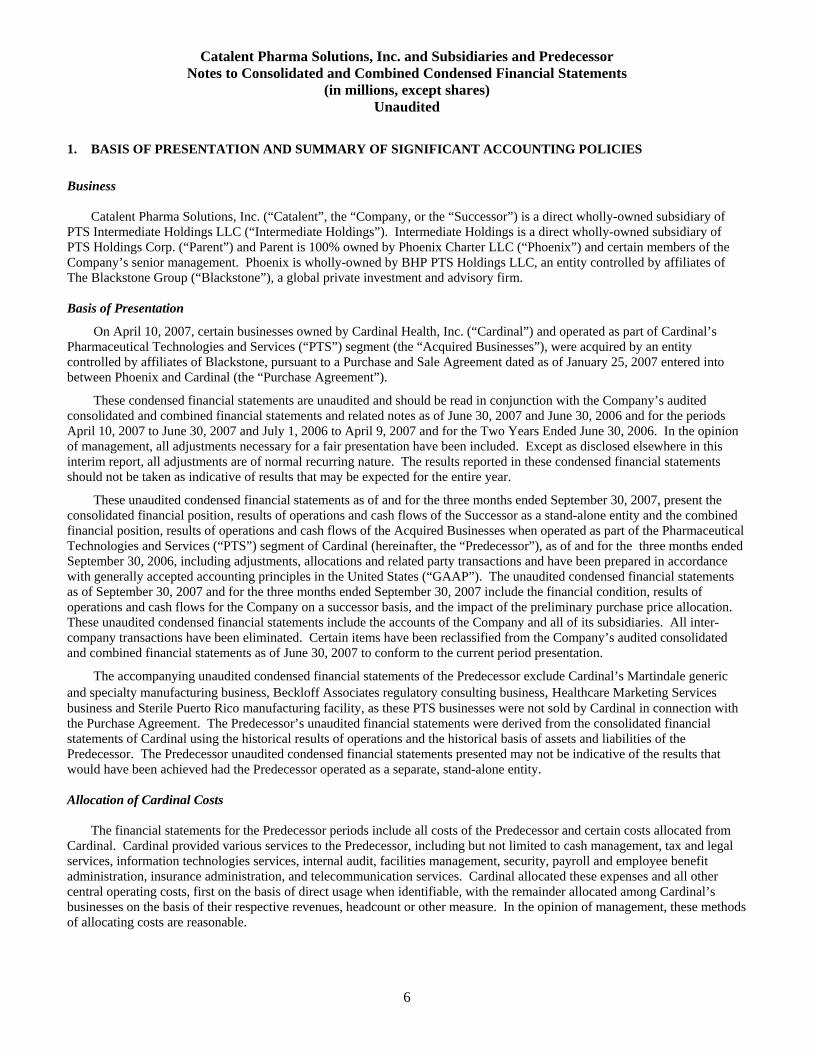
1. BASIS OF PRESENTATION AND SUMMARY OF SIGNIFICANT ACCOUNTING POLICIES
Business
Catalent Pharma Solutions, Inc. (“Catalent”, the “Company, or the “Successor”) is a direct wholly-owned subsidiary of PTS Intermediate Holdings LLC (“Intermediate Holdings”). Intermediate Holdings is a direct wholly-owned subsidiary of PTS Holdings Corp. (“Parent”) and Parent is 100% owned by Phoenix Charter LLC (“Phoenix”) and certain members of the Company’s senior management. Phoenix is wholly-owned by BHP PTS Holdings LLC, an entity controlled by affiliates of The Blackstone Group (“Blackstone”), a global private investment and advisory firm. Basis of Presentation
On April 10, 2007, certain businesses owned by Cardinal Health, Inc. (“Cardinal”) and operated as part of Cardinal’s Pharmaceutical Technologies and Services (“PTS”) segment (the “Acquired Businesses”), were acquired by an entity controlled by affiliates of Blackstone, pursuant to a Purchase and Sale Agreement dated as of January 25, 2007 entered into between Phoenix and Cardinal (the “Purchase Agreement”).
These condensed financial statements are unaudited and should be read in conjunction with the Company’s audited consolidated and combined financial statements and related notes as of June 30, 2007 and June 30, 2006 and for the periods April 10, 2007 to June 30, 2007 and July 1, 2006 to April 9, 2007 and for the Two Years Ended June 30, 2006. In the opinion of management, all adjustments necessary for a fair presentation have been included. Except as disclosed elsewhere in this interim report, all adjustments are of normal recurring nature. The results reported in these condensed financial statements should not be taken as indicative of results that may be expected for the entire year.
These unaudited condensed financial statements as of and for the three months ended September 30, 2007, present the consolidated financial position, results of operations and cash flows of the Successor as a stand-alone entity and the combined financial position, results of operations and cash flows of the Acquired Businesses when operated as part of the Pharmaceutical Technologies and Services (“PTS”) segment of Cardinal (hereinafter, the “Predecessor”), as of and for the three months ended September 30, 2006, including adjustments, allocations and related party transactions and have been prepared in accordance with generally accepted accounting principles in the United States (“GAAP”). The unaudited condensed financial statements as of September 30, 2007 and for the three months ended September 30, 2007 include the financial condition, results of operations and cash flows for the Company on a successor basis, and the impact of the preliminary purchase price allocation. These unaudited condensed financial statements include the accounts of the Company and all of its subsidiaries. All inter-company transactions have been eliminated. Certain items have been reclassified from the Company’s audited consolidated and combined financial statements as of June 30, 2007 to conform to the current period presentation.
The accompanying unaudited condensed financial statements of the Predecessor exclude Cardinal’s Martindale generic and specialty manufacturing business, Beckloff Associates regulatory consulting business, Healthcare Marketing Services business and Sterile Puerto Rico manufacturing facility, as these PTS businesses were not sold by Cardinal in connection with the Purchase Agreement. The Predecessor’s unaudited financial statements were derived from the consolidated financial statements of Cardinal using the historical results of operations and the historical basis of assets and liabilities of the Predecessor. The Predecessor unaudited condensed financial statements presented may not be indicative of the results that would have been achieved had the Predecessor operated as a separate, stand-alone entity. Allocation of Cardinal Costs
The financial statements for the Predecessor periods include all costs of the Predecessor and certain costs allocated from Cardinal. Cardinal provided various services to the Predecessor, including but not limited to cash management, tax and legal services, information technologies services, internal audit, facilities management, security, payroll and employee benefit administration, insurance administration, and telecommunication services. Cardinal allocated these expenses and all other central operating costs, first on the basis of direct usage when identifiable, with the remainder allocated among Cardinal’s businesses on the basis of their respective revenues, headcount or other measure. In the opinion of management, these methods of allocating costs are reasonable.
6
Catalent Pharma Solutions, Inc. and Subsidiaries and Predecessor Notes to Consolidated and Combined Condensed Financial Statements
(in millions, except shares) Unaudited
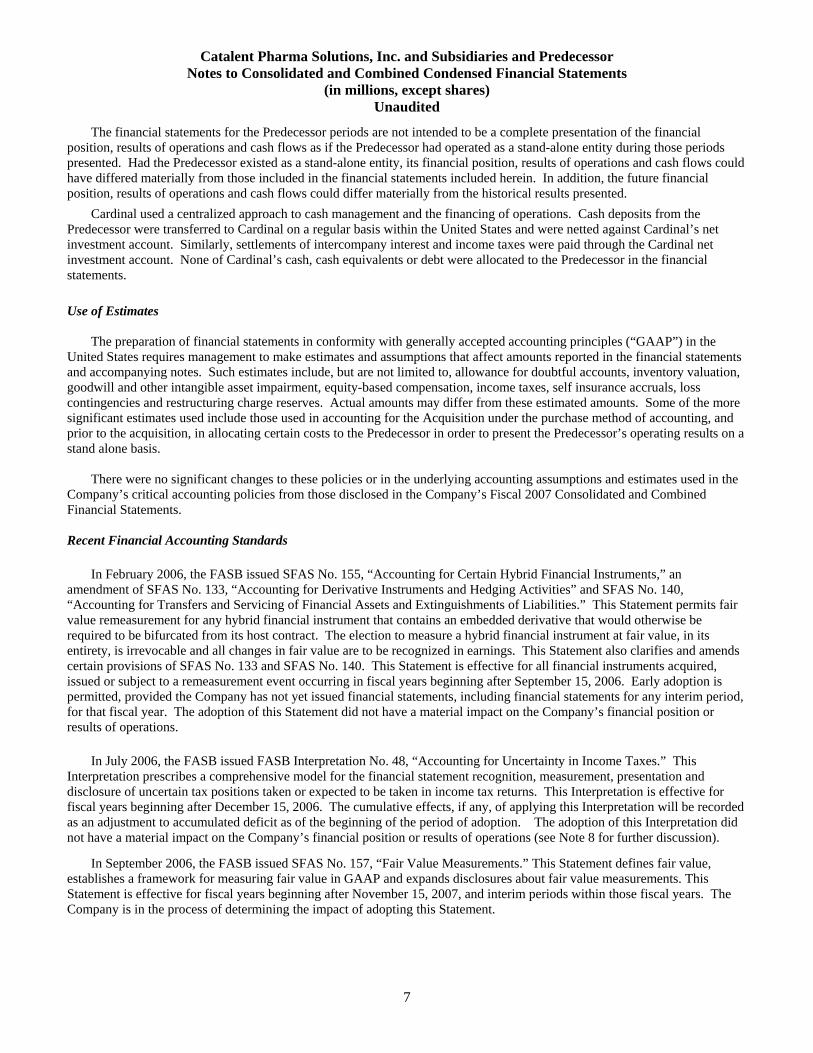
The financial statements for the Predecessor periods are not intended to be a complete presentation of the financial position, results of operations and cash flows as if the Predecessor had operated as a stand-alone entity during those periods presented. Had the Predecessor existed as a stand-alone entity, its financial position, results of operations and cash flows could have differed materially from those included in the financial statements included herein. In addition, the future financial position, results of operations and cash flows could differ materially from the historical results presented.
Cardinal used a centralized approach to cash management and the financing of operations. Cash deposits from the Predecessor were transferred to Cardinal on a regular basis within the United States and were netted against Cardinal’s net investment account. Similarly, settlements of intercompany interest and income taxes were paid through the Cardinal net investment account. None of Cardinal’s cash, cash equivalents or debt were allocated to the Predecessor in the financial statements.
Use of Estimates
The preparation of financial statements in conformity with generally accepted accounting principles (“GAAP”) in the United States requires management to make estimates and assumptions that affect amounts reported in the financial statements and accompanying notes. Such estimates include, but are not limited to, allowance for doubtful accounts, inventory valuation, goodwill and other intangible asset impairment, equity-based compensation, income taxes, self insurance accruals, loss contingencies and restructuring charge reserves. Actual amounts may differ from these estimated amounts. Some of the more significant estimates used include those used in accounting for the Acquisition under the purchase method of accounting, and prior to the acquisition, in allocating certain costs to the Predecessor in order to present the Predecessor’s operating results on a stand alone basis.
There were no significant changes to these policies or in the underlying accounting assumptions and estimates used in the Company’s critical accounting policies from those disclosed in the Company’s Fiscal 2007 Consolidated and Combined Financial Statements.
Recent Financial Accounting Standards
In February 2006, the FASB issued SFAS No. 155, “Accounting for Certain Hybrid Financial Instruments,” an amendment of SFAS No. 133, “Accounting for Derivative Instruments and Hedging Activities” and SFAS No. 140, “Accounting for Transfers and Servicing of Financial Assets and Extinguishments of Liabilities.” This Statement permits fair value remeasurement for any hybrid financial instrument that contains an embedded derivative that would otherwise be required to be bifurcated from its host contract. The election to measure a hybrid financial instrument at fair value, in its entirety, is irrevocable and all changes in fair value are to be recognized in earnings. This Statement also clarifies and amends certain provisions of SFAS No. 133 and SFAS No. 140. This Statement is effective for all financial instruments acquired, issued or subject to a remeasurement event occurring in fiscal years beginning after September 15, 2006. Early adoption is permitted, provided the Company has not yet issued financial statements, including financial statements for any interim period, for that fiscal year. The adoption of this Statement did not have a material impact on the Company’s financial position or results of operations.
In July 2006, the FASB issued FASB Interpretation No. 48, “Accounting for Uncertainty in Income Taxes.” This Interpretation prescribes a comprehensive model for the financial statement recognition, measurement, presentation and disclosure of uncertain tax positions taken or expected to be taken in income tax returns. This Interpretation is effective for fiscal years beginning after December 15, 2006. The cumulative effects, if any, of applying this Interpretation will be recorded as an adjustment to accumulated deficit as of the beginning of the period of adoption. The adoption of this Interpretation did not have a material impact on the Company’s financial position or results of operations (see Note 8 for further discussion).
In September 2006, the FASB issued SFAS No. 157, “Fair Value Measurements.” This Statement defines fair value, establishes a framework for measuring fair value in GAAP and expands disclosures about fair value measurements. This Statement is effective for fiscal years beginning after November 15, 2007, and interim periods within those fiscal years. The Company is in the process of determining the impact of adopting this Statement.
7
Catalent Pharma Solutions, Inc. and Subsidiaries and Predecessor Notes to Consolidated and Combined Condensed Financial Statements
(in millions, except shares) Unaudited
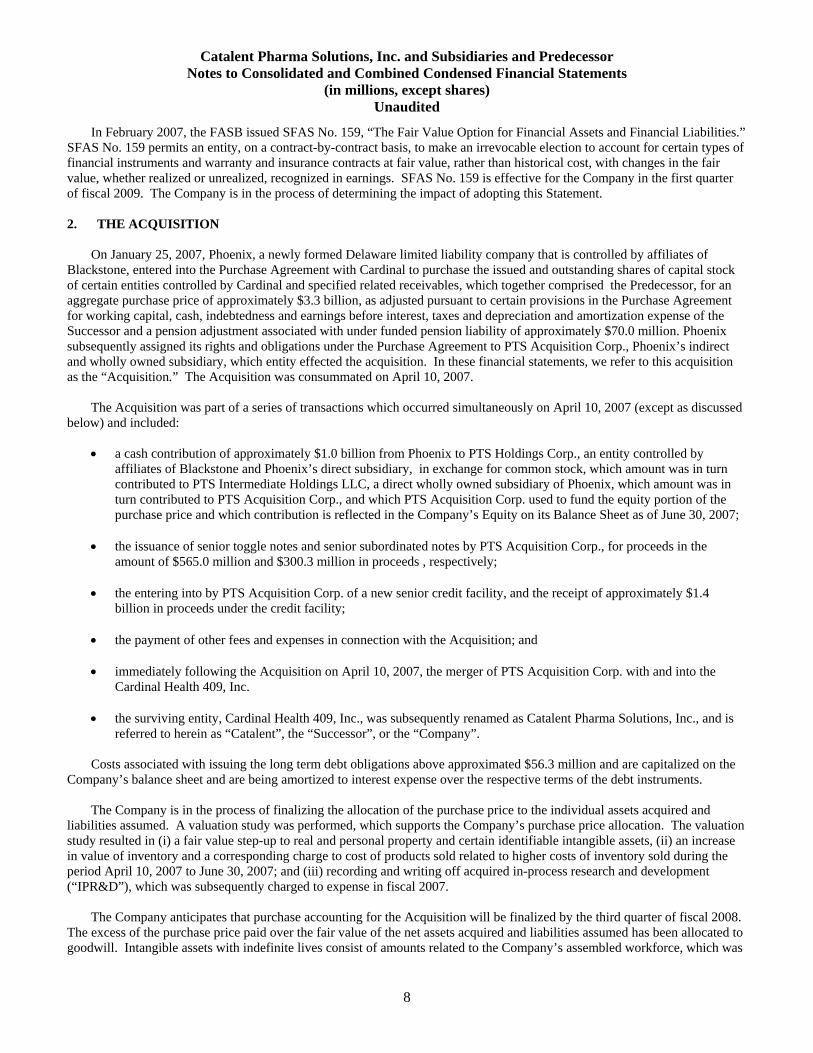
In February 2007, the FASB issued SFAS No. 159, “The Fair Value Option for Financial Assets and Financial Liabilities.” SFAS No. 159 permits an entity, on a contract-by-contract basis, to make an irrevocable election to account for certain types of financial instruments and warranty and insurance contracts at fair value, rather than historical cost, with changes in the fair value, whether realized or unrealized, recognized in earnings. SFAS No. 159 is effective for the Company in the first quarter of fiscal 2009. The Company is in the process of determining the impact of adopting this Statement. 2. THE ACQUISITION
On January 25, 2007, Phoenix, a newly formed Delaware limited liability company that is controlled by affiliates of Blackstone, entered into the Purchase Agreement with Cardinal to purchase the issued and outstanding shares of capital stock of certain entities controlled by Cardinal and specified related receivables, which together comprised the Predecessor, for an aggregate purchase price of approximately $3.3 billion, as adjusted pursuant to certain provisions in the Purchase Agreement for working capital, cash, indebtedness and earnings before interest, taxes and depreciation and amortization expense of the Successor and a pension adjustment associated with under funded pension liability of approximately $70.0 million. Phoenix subsequently assigned its rights and obligations under the Purchase Agreement to PTS Acquisition Corp., Phoenix’s indirect and wholly owned subsidiary, which entity effected the acquisition. In these financial statements, we refer to this acquisition as the “Acquisition.” The Acquisition was consummated on April 10, 2007.
The Acquisition was part of a series of transactions which occurred simultaneously on April 10, 2007 (except as discussed
below) and included:
• a cash contribution of approximately $1.0 billion from Phoenix to PTS Holdings Corp., an entity controlled by affiliates of Blackstone and Phoenix’s direct subsidiary, in exchange for common stock, which amount was in turn contributed to PTS Intermediate Holdings LLC, a direct wholly owned subsidiary of Phoenix, which amount was in turn contributed to PTS Acquisition Corp., and which PTS Acquisition Corp. used to fund the equity portion of the purchase price and which contribution is reflected in the Company’s Equity on its Balance Sheet as of June 30, 2007;
• the issuance of senior toggle notes and senior subordinated notes by PTS Acquisition Corp., for proceeds in the
amount of $565.0 million and $300.3 million in proceeds , respectively; • the entering into by PTS Acquisition Corp. of a new senior credit facility, and the receipt of approximately $1.4
billion in proceeds under the credit facility; • the payment of other fees and expenses in connection with the Acquisition; and • immediately following the Acquisition on April 10, 2007, the merger of PTS Acquisition Corp. with and into the
Cardinal Health 409, Inc. • the surviving entity, Cardinal Health 409, Inc., was subsequently renamed as Catalent Pharma Solutions, Inc., and is
referred to herein as “Catalent”, the “Successor”, or the “Company”. Costs associated with issuing the long term debt obligations above approximated $56.3 million and are capitalized on the
Company’s balance sheet and are being amortized to interest expense over the respective terms of the debt instruments. The Company is in the process of finalizing the allocation of the purchase price to the individual assets acquired and
liabilities assumed. A valuation study was performed, which supports the Company’s purchase price allocation. The valuation study resulted in (i) a fair value step-up to real and personal property and certain identifiable intangible assets, (ii) an increase in value of inventory and a corresponding charge to cost of products sold related to higher costs of inventory sold during the period April 10, 2007 to June 30, 2007; and (iii) recording and writing off acquired in-process research and development (“IPR&D”), which was subsequently charged to expense in fiscal 2007.
The Company anticipates that purchase accounting for the Acquisition will be finalized by the third quarter of fiscal 2008. The excess of the purchase price paid over the fair value of the net assets acquired and liabilities assumed has been allocated to goodwill. Intangible assets with indefinite lives consist of amounts related to the Company’s assembled workforce, which was
8
Catalent Pharma Solutions, Inc. and Subsidiaries and Predecessor Notes to Consolidated and Combined Condensed Financial Statements
(in millions, except shares) Unaudited
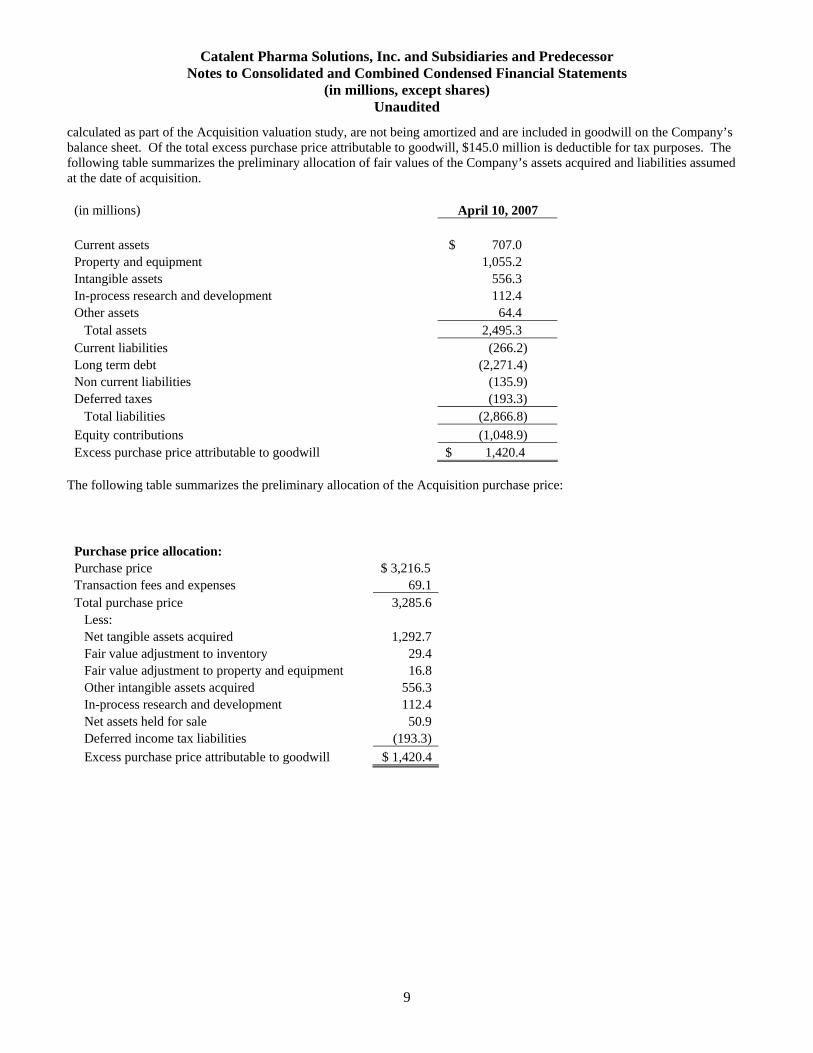
calculated as part of the Acquisition valuation study, are not being amortized and are included in goodwill on the Company’s balance sheet. Of the total excess purchase price attributable to goodwill, $145.0 million is deductible for tax purposes. The following table summarizes the preliminary allocation of fair values of the Company’s assets acquired and liabilities assumed at the date of acquisition.
(in millions) April 10, 2007 Current assets $ 707.0 Property and equipment 1,055.2 Intangible assets 556.3 In-process research and development 112.4 Other assets 64.4 Total assets 2,495.3 Current liabilities (266.2) Long term debt (2,271.4) Non current liabilities (135.9) Deferred taxes (193.3) Total liabilities (2,866.8) Equity contributions (1,048.9) Excess purchase price attributable to goodwill $ 1,420.4
The following table summarizes the preliminary allocation of the Acquisition purchase price:
Purchase price allocation:
Purchase price $ 3,216.5 Transaction fees and expenses 69.1 Total purchase price 3,285.6 Less: Net tangible assets acquired 1,292.7 Fair value adjustment to inventory 29.4 Fair value adjustment to property and equipment 16.8 Other intangible assets acquired 556.3 In-process research and development 112.4 Net assets held for sale 50.9 Deferred income tax liabilities (193.3) Excess purchase price attributable to goodwill $ 1,420.4
9
Catalent Pharma Solutions, Inc. and Subsidiaries and Predecessor Notes to Consolidated and Combined Condensed Financial Statements
(in millions, except shares) Unaudited
3. DISCONTINUED OPERATIONS AND DIVESTITURES
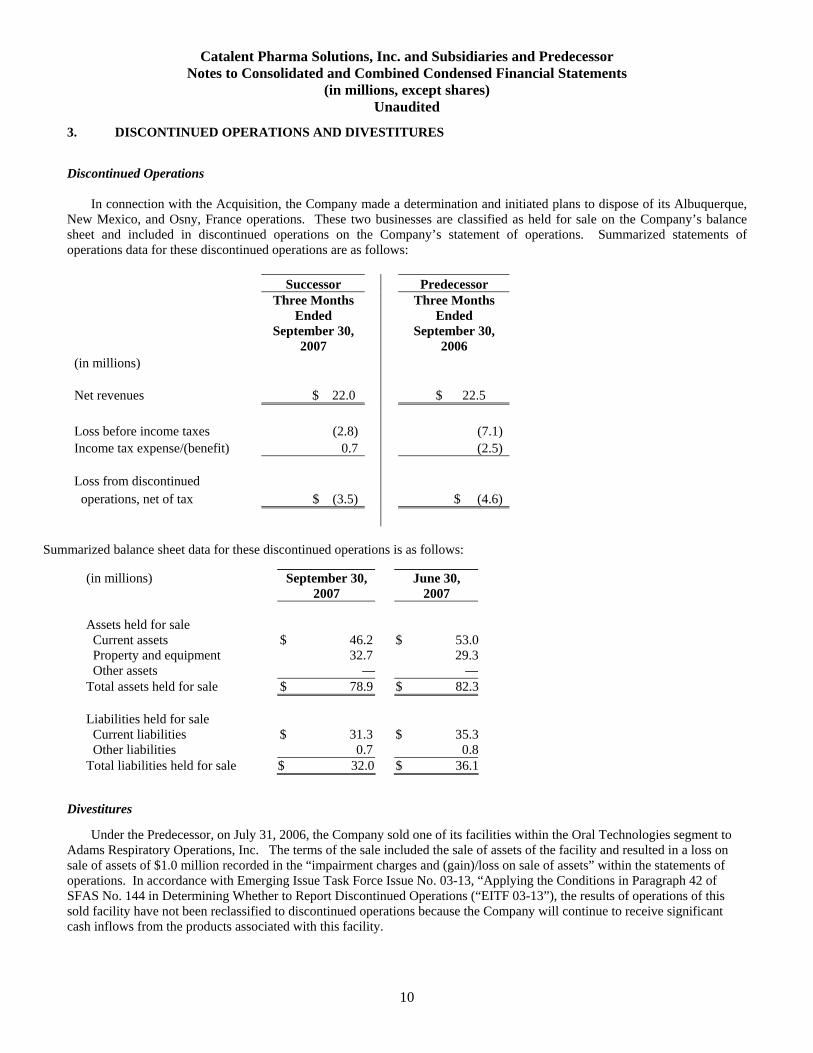
Discontinued Operations In connection with the Acquisition, the Company made a determination and initiated plans to dispose of its Albuquerque, New Mexico, and Osny, France operations. These two businesses are classified as held for sale on the Company’s balance sheet and included in discontinued operations on the Company’s statement of operations. Summarized statements of operations data for these discontinued operations are as follows:
Successor Predecessor
Three Months Ended
September 30, 2007
Three Months Ended
September 30, 2006
(in millions) Net revenues $ 22.0 $ 22.5 Loss before income taxes (2.8) (7.1) Income tax expense/(benefit) 0.7 (2.5) Loss from discontinued operations, net of tax $ (3.5) $ (4.6)
Summarized balance sheet data for these discontinued operations is as follows: (in millions) September 30,
2007 June 30,
2007 Assets held for sale Current assets $ 46.2 $ 53.0 Property and equipment 32.7 29.3 Other assets — — Total assets held for sale $ 78.9 $ 82.3 Liabilities held for sale Current liabilities $ 31.3 $ 35.3 Other liabilities 0.7 0.8 Total liabilities held for sale $ 32.0 $ 36.1
Divestitures
Under the Predecessor, on July 31, 2006, the Company sold one of its facilities within the Oral Technologies segment to Adams Respiratory Operations, Inc. The terms of the sale included the sale of assets of the facility and resulted in a loss on sale of assets of $1.0 million recorded in the “impairment charges and (gain)/loss on sale of assets” within the statements of operations. In accordance with Emerging Issue Task Force Issue No. 03-13, “Applying the Conditions in Paragraph 42 of SFAS No. 144 in Determining Whether to Report Discontinued Operations (“EITF 03-13”), the results of operations of this sold facility have not been reclassified to discontinued operations because the Company will continue to receive significant cash inflows from the products associated with this facility.
10
Catalent Pharma Solutions, Inc. and Subsidiaries and Predecessor Notes to Consolidated and Combined Condensed Financial Statements
(in millions, except shares) Unaudited
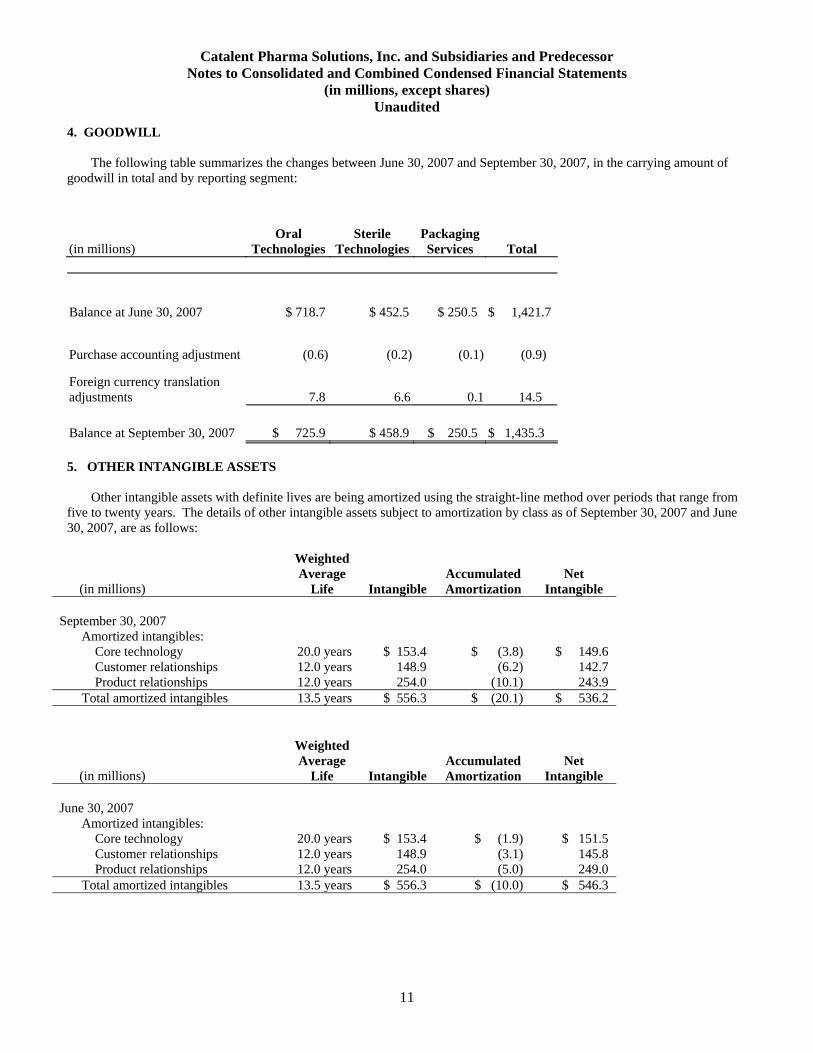
4. GOODWILL The following table summarizes the changes between June 30, 2007 and September 30, 2007, in the carrying amount of
goodwill in total and by reporting segment:
(in millions)
Oral Technologies
Sterile Technologies
PackagingServices
Total
Balance at June 30, 2007 $ 718.7
$ 452.5
$ 250.5 $ 1,421.7
Purchase accounting adjustment (0.6) (0.2) (0.1) (0.9)
Foreign currency translation adjustments 7.8 6.6 0.1 14.5
Balance at September 30, 2007 $ 725.9 $ 458.9 $ 250.5 $ 1,435.3
5. OTHER INTANGIBLE ASSETS Other intangible assets with definite lives are being amortized using the straight-line method over periods that range from
five to twenty years. The details of other intangible assets subject to amortization by class as of September 30, 2007 and June 30, 2007, are as follows:
(in millions)
Weighted Average
Life
Intangible Accumulated Amortization
Net Intangible
September 30, 2007
Amortized intangibles: Core technology 20.0 years $ 153.4 $ (3.8) $ 149.6 Customer relationships 12.0 years 148.9 (6.2) 142.7 Product relationships 12.0 years 254.0 (10.1) 243.9 Total amortized intangibles 13.5 years $ 556.3 $ (20.1) $ 536.2
(in millions)
Weighted Average
Life
Intangible Accumulated Amortization
Net Intangible
June 30, 2007
Amortized intangibles: Core technology 20.0 years $ 153.4 $ (1.9) $ 151.5 Customer relationships 12.0 years 148.9 (3.1) 145.8 Product relationships 12.0 years 254.0 (5.0) 249.0 Total amortized intangibles 13.5 years $ 556.3 $ (10.0) $ 546.3
11
Catalent Pharma Solutions, Inc. and Subsidiaries and Predecessor Notes to Consolidated and Combined Condensed Financial Statements
(in millions, except shares) Unaudited
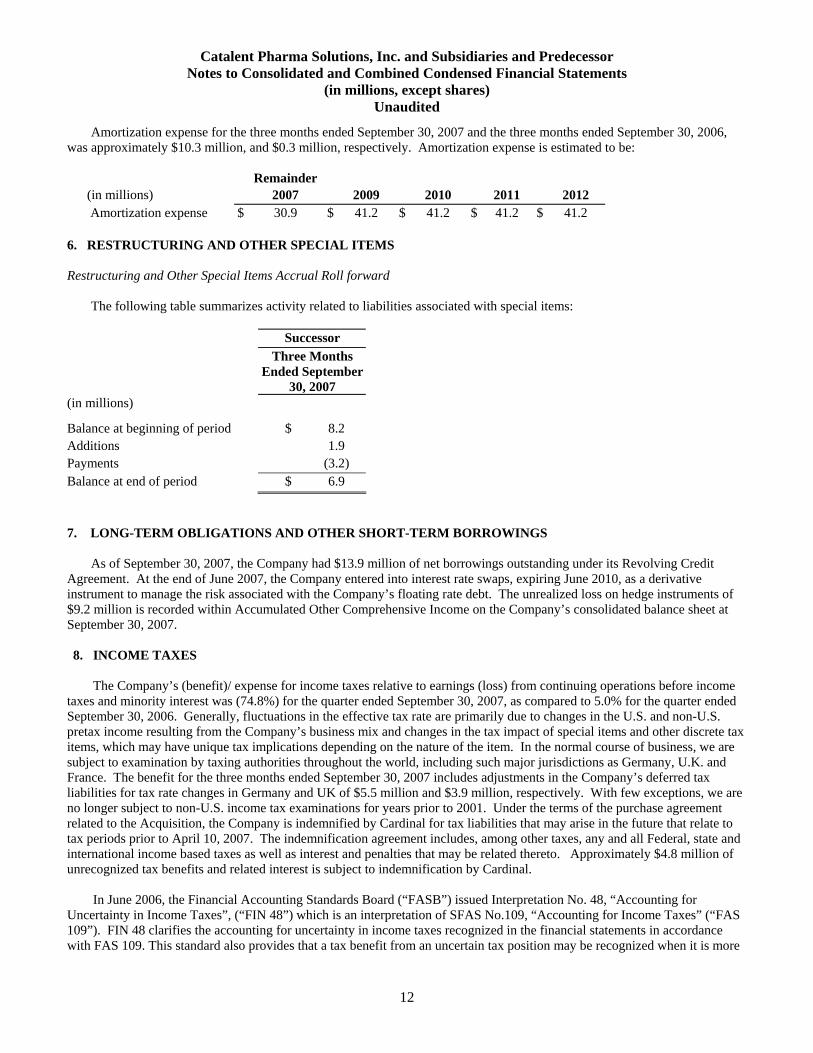
Amortization expense for the three months ended September 30, 2007 and the three months ended September 30, 2006, was approximately $10.3 million, and $0.3 million, respectively. Amortization expense is estimated to be:
Remainder (in millions) 2007 2009 2010 2011 2012
Amortization expense $ 30.9 $ 41.2 $ 41.2 $ 41.2 $ 41.2 6. RESTRUCTURING AND OTHER SPECIAL ITEMS
Restructuring and Other Special Items Accrual Roll forward The following table summarizes activity related to liabilities associated with special items: Successor Three Months
Ended September 30, 2007
(in millions)
Balance at beginning of period $ 8.2 Additions 1.9 Payments (3.2) Balance at end of period $ 6.9
7. LONG-TERM OBLIGATIONS AND OTHER SHORT-TERM BORROWINGS
As of September 30, 2007, the Company had $13.9 million of net borrowings outstanding under its Revolving Credit Agreement. At the end of June 2007, the Company entered into interest rate swaps, expiring June 2010, as a derivative instrument to manage the risk associated with the Company’s floating rate debt. The unrealized loss on hedge instruments of $9.2 million is recorded within Accumulated Other Comprehensive Income on the Company’s consolidated balance sheet at September 30, 2007. 8. INCOME TAXES
The Company’s (benefit)/ expense for income taxes relative to earnings (loss) from continuing operations before income
taxes and minority interest was (74.8%) for the quarter ended September 30, 2007, as compared to 5.0% for the quarter ended September 30, 2006. Generally, fluctuations in the effective tax rate are primarily due to changes in the U.S. and non-U.S. pretax income resulting from the Company’s business mix and changes in the tax impact of special items and other discrete tax items, which may have unique tax implications depending on the nature of the item. In the normal course of business, we are subject to examination by taxing authorities throughout the world, including such major jurisdictions as Germany, U.K. and France. The benefit for the three months ended September 30, 2007 includes adjustments in the Company’s deferred tax liabilities for tax rate changes in Germany and UK of $5.5 million and $3.9 million, respectively. With few exceptions, we are no longer subject to non-U.S. income tax examinations for years prior to 2001. Under the terms of the purchase agreement related to the Acquisition, the Company is indemnified by Cardinal for tax liabilities that may arise in the future that relate to tax periods prior to April 10, 2007. The indemnification agreement includes, among other taxes, any and all Federal, state and international income based taxes as well as interest and penalties that may be related thereto. Approximately $4.8 million of unrecognized tax benefits and related interest is subject to indemnification by Cardinal. In June 2006, the Financial Accounting Standards Board (“FASB”) issued Interpretation No. 48, “Accounting for
Uncertainty in Income Taxes”, (“FIN 48”) which is an interpretation of SFAS No.109, “Accounting for Income Taxes” (“FAS 109”). FIN 48 clarifies the accounting for uncertainty in income taxes recognized in the financial statements in accordance with FAS 109. This standard also provides that a tax benefit from an uncertain tax position may be recognized when it is more
12
Catalent Pharma Solutions, Inc. and Subsidiaries and Predecessor Notes to Consolidated and Combined Condensed Financial Statements
(in millions, except shares) Unaudited
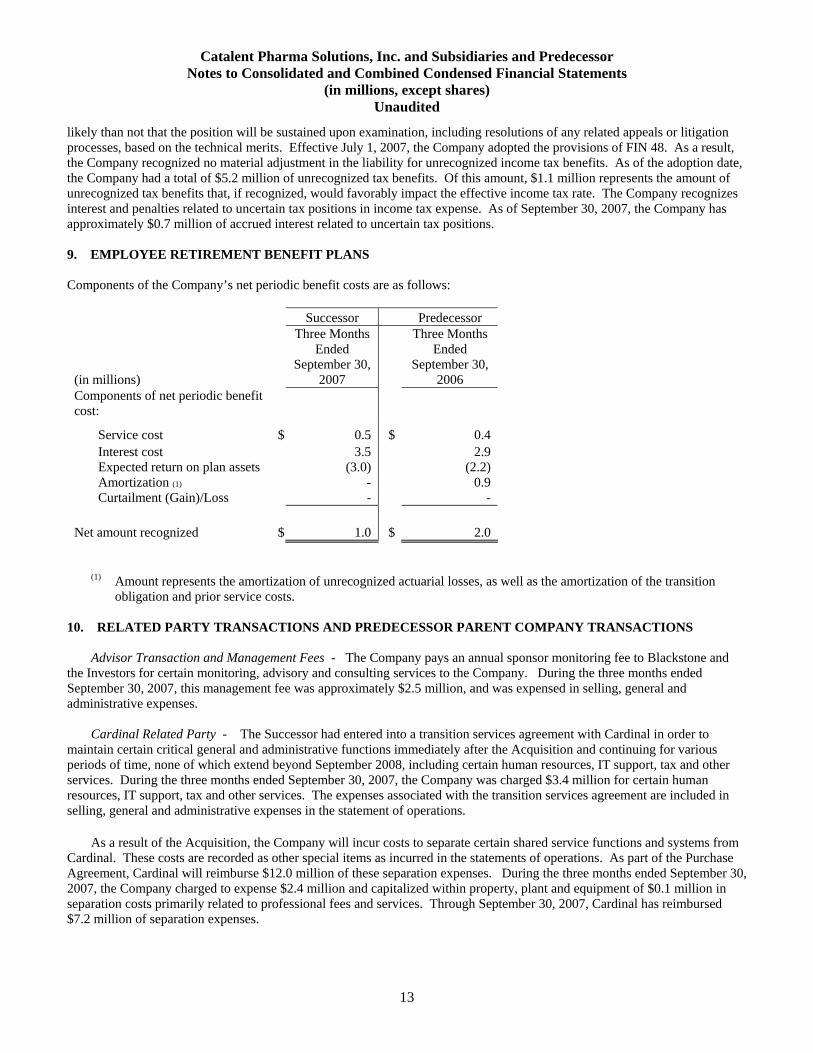
likely than not that the position will be sustained upon examination, including resolutions of any related appeals or litigation processes, based on the technical merits. Effective July 1, 2007, the Company adopted the provisions of FIN 48. As a result, the Company recognized no material adjustment in the liability for unrecognized income tax benefits. As of the adoption date, the Company had a total of $5.2 million of unrecognized tax benefits. Of this amount, $1.1 million represents the amount of unrecognized tax benefits that, if recognized, would favorably impact the effective income tax rate. The Company recognizes interest and penalties related to uncertain tax positions in income tax expense. As of September 30, 2007, the Company has approximately $0.7 million of accrued interest related to uncertain tax positions. 9. EMPLOYEE RETIREMENT BENEFIT PLANS Components of the Company’s net periodic benefit costs are as follows:
Successor Predecessor
(in millions)
Three Months Ended
September 30, 2007
Three Months Ended
September 30, 2006
Components of net periodic benefit cost:
Service cost $ 0.5 $ 0.4 Interest cost 3.5 2.9 Expected return on plan assets (3.0) (2.2) Amortization (1) - 0.9 Curtailment (Gain)/Loss - -
Net amount recognized $ 1.0 $ 2.0 (1) Amount represents the amortization of unrecognized actuarial losses, as well as the amortization of the transition
obligation and prior service costs. 10. RELATED PARTY TRANSACTIONS AND PREDECESSOR PARENT COMPANY TRANSACTIONS
Advisor Transaction and Management Fees - The Company pays an annual sponsor monitoring fee to Blackstone and the Investors for certain monitoring, advisory and consulting services to the Company. During the three months ended September 30, 2007, this management fee was approximately $2.5 million, and was expensed in selling, general and administrative expenses.
Cardinal Related Party - The Successor had entered into a transition services agreement with Cardinal in order to maintain certain critical general and administrative functions immediately after the Acquisition and continuing for various periods of time, none of which extend beyond September 2008, including certain human resources, IT support, tax and other services. During the three months ended September 30, 2007, the Company was charged $3.4 million for certain human resources, IT support, tax and other services. The expenses associated with the transition services agreement are included in selling, general and administrative expenses in the statement of operations.
As a result of the Acquisition, the Company will incur costs to separate certain shared service functions and systems from Cardinal. These costs are recorded as other special items as incurred in the statements of operations. As part of the Purchase Agreement, Cardinal will reimburse $12.0 million of these separation expenses. During the three months ended September 30, 2007, the Company charged to expense $2.4 million and capitalized within property, plant and equipment of $0.1 million in separation costs primarily related to professional fees and services. Through September 30, 2007, Cardinal has reimbursed $7.2 million of separation expenses.
13
Catalent Pharma Solutions, Inc. and Subsidiaries and Predecessor Notes to Consolidated and Combined Condensed Financial Statements
(in millions, except shares) Unaudited
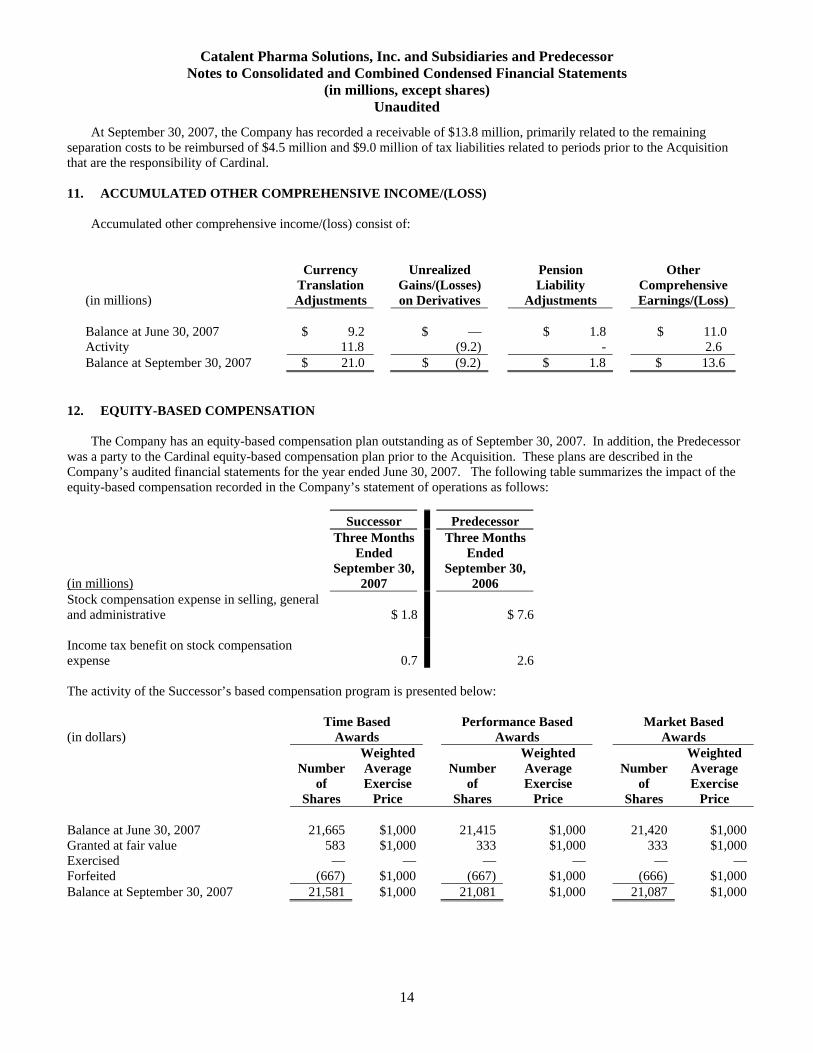
At September 30, 2007, the Company has recorded a receivable of $13.8 million, primarily related to the remaining separation costs to be reimbursed of $4.5 million and $9.0 million of tax liabilities related to periods prior to the Acquisition that are the responsibility of Cardinal. 11. ACCUMULATED OTHER COMPREHENSIVE INCOME/(LOSS)
Accumulated other comprehensive income/(loss) consist of:
(in millions)
Currency Translation Adjustments
Unrealized Gains/(Losses) on Derivatives
Pension Liability
Adjustments
Other Comprehensive Earnings/(Loss)
Balance at June 30, 2007 $ 9.2 $ — $ 1.8 $ 11.0 Activity 11.8 (9.2) - 2.6 Balance at September 30, 2007 $ 21.0 $ (9.2) $ 1.8 $ 13.6
12. EQUITY-BASED COMPENSATION
The Company has an equity-based compensation plan outstanding as of September 30, 2007. In addition, the Predecessor was a party to the Cardinal equity-based compensation plan prior to the Acquisition. These plans are described in the Company’s audited financial statements for the year ended June 30, 2007. The following table summarizes the impact of the equity-based compensation recorded in the Company’s statement of operations as follows: Successor Predecessor
(in millions)
Three Months Ended
September 30, 2007
Three Months Ended
September 30, 2006
Stock compensation expense in selling, general and administrative $ 1.8 $ 7.6 Income tax benefit on stock compensation expense 0.7 2.6 The activity of the Successor’s based compensation program is presented below:
(in dollars) Time Based
Awards Performance Based
Awards Market Based
Awards
Number of
Shares
Weighted Average Exercise
Price
Number
of Shares
Weighted Average Exercise
Price
Number
of Shares
Weighted Average Exercise
Price Balance at June 30, 2007 21,665 $1,000 21,415 $1,000 21,420 $1,000 Granted at fair value 583 $1,000 333 $1,000 333 $1,000 Exercised — — — — — — Forfeited (667) $1,000 (667) $1,000 (666) $1,000 Balance at September 30, 2007 21,581 $1,000 21,081 $1,000 21,087 $1,000
14
Catalent Pharma Solutions, Inc. and Subsidiaries and Predecessor Notes to Consolidated and Combined Condensed Financial Statements
(in millions, except shares) Unaudited
13. LEGAL PROCEEDINGS
The Company, along with several pharmaceutical companies, is involved in five product liability lawsuits relating to Amnesteem (isotretinoin), a product manufactured by us. While it is not possible to determine with any degree of certainty the ultimate outcome of these legal proceedings including determination of liability, the Company believes that it has meritorious defenses with respect to the claims asserted against it and intends to vigorously defend its position.
The Company also becomes involved from time-to-time in disputes or litigation incidental to its business, including without limitation, inclusion of certain of its subsidiaries as a potentially responsible party for environmental clean-up costs and disputes involving the loss of a customer’s active pharmaceutical ingredient incidental to the Company’s manufacturing services. The Company intends to vigorously defend itself against such disputes and litigation and does not currently believe that the outcome of any such disputes or litigation will have a material adverse effect on the Company’s financial statements. 14. SEGMENT INFORMATION
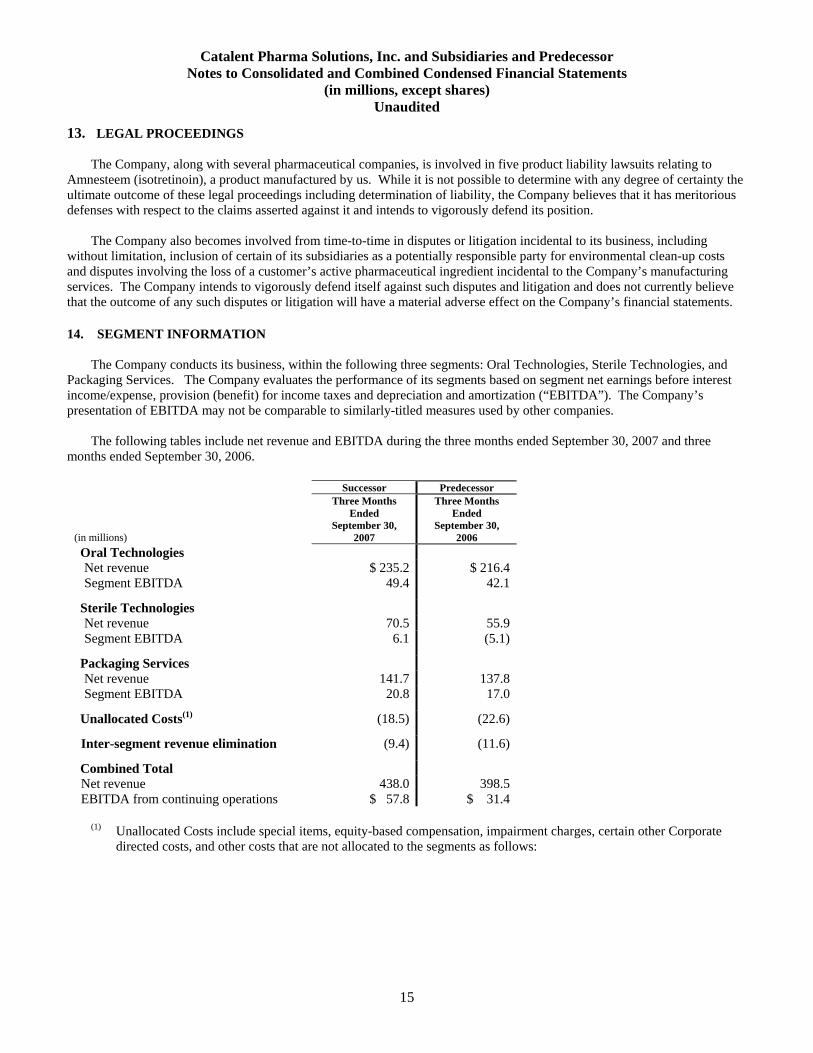
The Company conducts its business, within the following three segments: Oral Technologies, Sterile Technologies, and
Packaging Services. The Company evaluates the performance of its segments based on segment net earnings before interest income/expense, provision (benefit) for income taxes and depreciation and amortization (“EBITDA”). The Company’s presentation of EBITDA may not be comparable to similarly-titled measures used by other companies.
The following tables include net revenue and EBITDA during the three months ended September 30, 2007 and three
months ended September 30, 2006.
Successor Predecessor
Three Months
Ended Three Months
Ended
(in millions) September 30,
2007 September 30,
2006 Oral Technologies
Net revenue $ 235.2 $ 216.4 Segment EBITDA 49.4 42.1
Sterile Technologies Net revenue 70.5 55.9 Segment EBITDA 6.1 (5.1)
Packaging Services Net revenue 141.7 137.8 Segment EBITDA 20.8 17.0
Unallocated Costs(1) (18.5) (22.6)
Inter-segment revenue elimination (9.4) (11.6)
Combined Total Net revenue 438.0 398.5 EBITDA from continuing operations $ 57.8 $ 31.4
(1) Unallocated Costs include special items, equity-based compensation, impairment charges, certain other Corporate
directed costs, and other costs that are not allocated to the segments as follows:
15
Catalent Pharma Solutions, Inc. and Subsidiaries and Predecessor Notes to Consolidated and Combined Condensed Financial Statements
(in millions, except shares) Unaudited
Successor Predecessor(in millions) Three Months
Ended September 30, 2007
Three Months Ended September
30, 2006
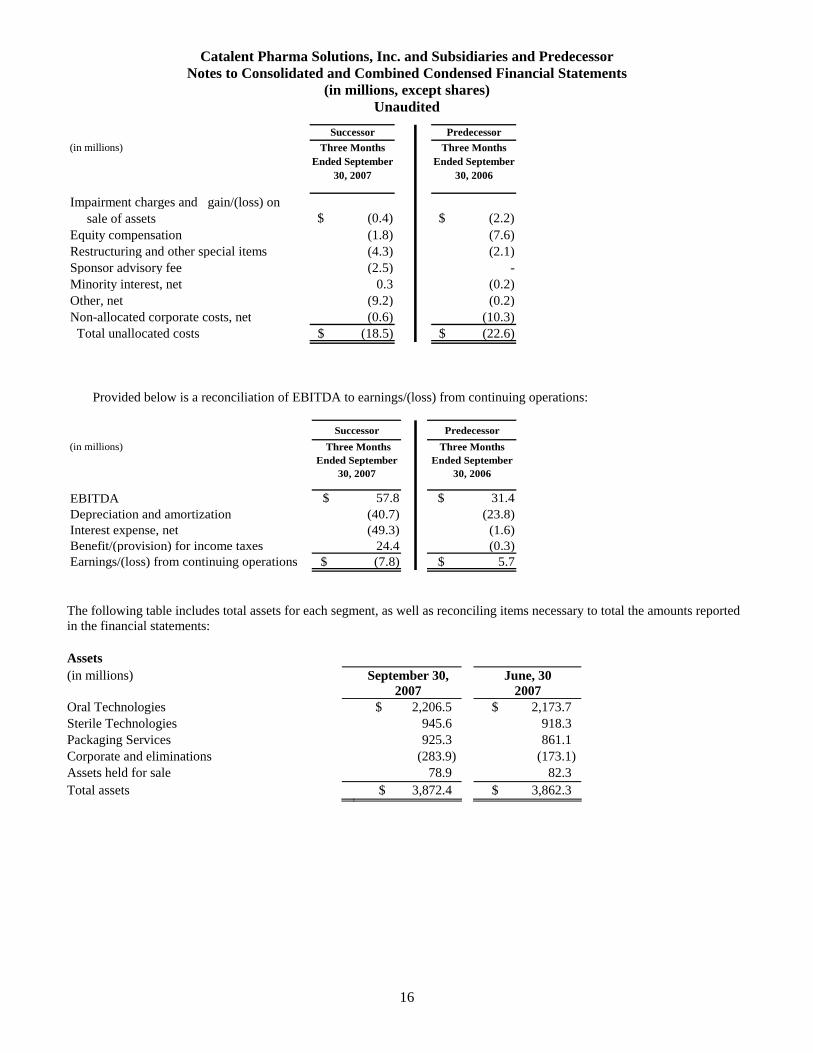
Impairment charges and gain/(loss) on sale of assetsEquity compensation (1.8) (7.6)Restructuring and other special items (4.3) (2.1)Sponsor advisory fee (2.5) - Minority interest, net 0.3 (0.2)Other, net (9.2) (0.2)Non-allocated corporate costs, net (0.6) (10.3) Total unallocated costs $ (18.5) $ (22.6)
$ (0.4) $ (2.2)
Provided below is a reconciliation of EBITDA to earnings/(loss) from continuing operations:
Successor Predecessor
(in millions) Three Months Ended September
30, 2007
Three Months Ended September
30, 2006
EBITDA $ 57.8 $ 31.4 Depreciation and amortization (40.7) (23.8)Interest expense, net (49.3) (1.6)Benefit/(provision) for income taxes 24.4 (0.3)Earnings/(loss) from continuing operations $ (7.8) $ 5.7
The following table includes total assets for each segment, as well as reconciling items necessary to total the amounts reported in the financial statements: Assets (in millions) September 30,
2007 June, 30
2007 Oral Technologies $ 2,206.5 $ 2,173.7 Sterile Technologies 945.6 918.3 Packaging Services 925.3 861.1 Corporate and eliminations (283.9) (173.1) Assets held for sale 78.9 82.3 Total assets $ 3,872.4 $ 3,862.3
16
Catalent Pharma Solutions, Inc. and Subsidiaries and Predecessor Notes to Consolidated and Combined Condensed Financial Statements
(in millions, except shares) Unaudited
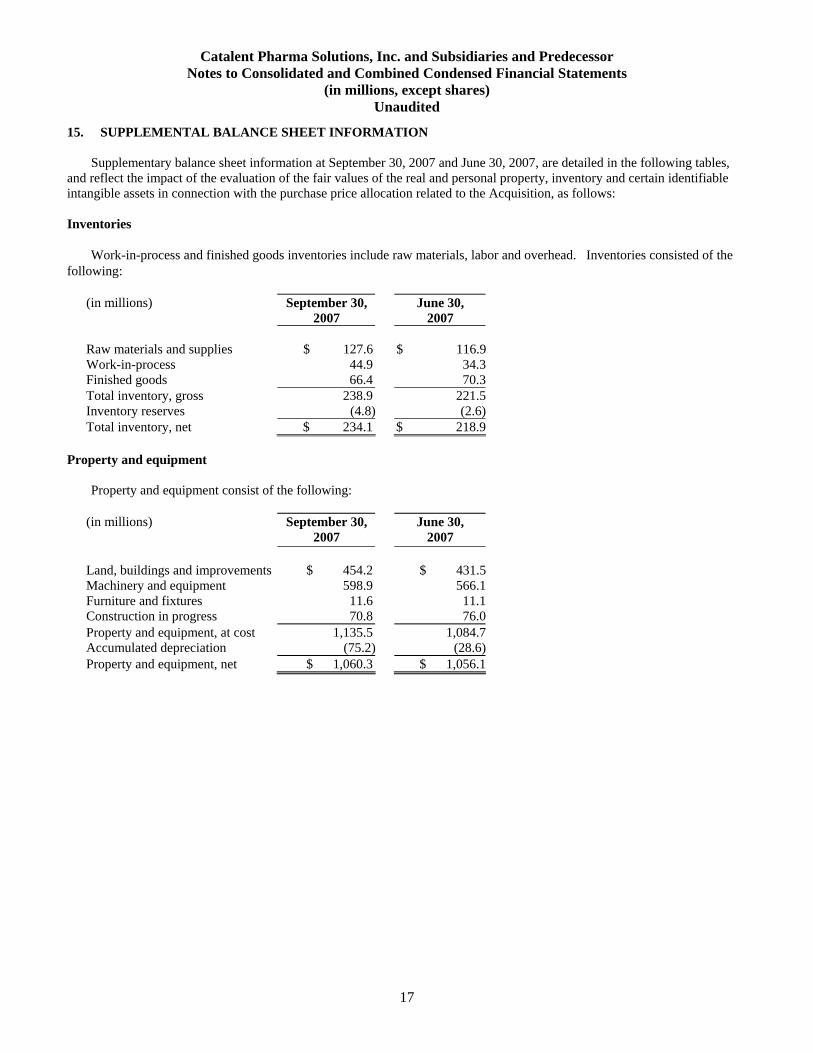
15. SUPPLEMENTAL BALANCE SHEET INFORMATION
Supplementary balance sheet information at September 30, 2007 and June 30, 2007, are detailed in the following tables, and reflect the impact of the evaluation of the fair values of the real and personal property, inventory and certain identifiable intangible assets in connection with the purchase price allocation related to the Acquisition, as follows: Inventories
Work-in-process and finished goods inventories include raw materials, labor and overhead. Inventories consisted of the following:
(in millions) September 30,
2007 June 30,
2007 Raw materials and supplies $ 127.6 $ 116.9 Work-in-process 44.9 34.3 Finished goods 66.4 70.3 Total inventory, gross 238.9 221.5 Inventory reserves (4.8) (2.6) Total inventory, net $ 234.1 $ 218.9 Property and equipment
Property and equipment consist of the following:
(in millions) September 30, 2007
June 30, 2007
Land, buildings and improvements $ 454.2 $ 431.5 Machinery and equipment 598.9 566.1 Furniture and fixtures 11.6 11.1 Construction in progress 70.8 76.0 Property and equipment, at cost 1,135.5 1,084.7 Accumulated depreciation (75.2) (28.6) Property and equipment, net $ 1,060.3 $ 1,056.1
17
MANAGEMENT’S DISCUSSION AND ANALYSIS OF FINANCIAL CONDITION AND RESULTS OF OPERATIONS
The following discussion should be read in conjunction with our Unaudited Consolidated and Combined Financial Statements and accompanying Notes thereto included elsewhere herein and with our Fiscal 2007 Consolidated and Combined Financial Statements. Unless otherwise noted, all dollar amounts are in millions. The Company
On April 10, 2007, an entity controlled by affiliates of Blackstone acquired from Cardinal Health, Inc. (“Cardinal”) certain assets and liabilities of the Pharmaceutical Technologies and Services (“PTS”) business segment of Cardinal (excluding certain businesses described in Note 1 to the Company’s Unaudited Condensed Financial Statements herein) (hereinafter collectively “Catalent Pharma Solutions, Inc.”, “Catalent”, the “Company”, or the “Successor”), pursuant to a Purchase and Sale Agreement dated as of January 25, 2007 (the “Acquisition”). The Acquisition aggregate purchase price of approximately $3.3 billion was funded with approximately $1.0 billion in cash equity contributions from a Blackstone affiliate, $1.4 billion in proceeds from the issuance of term loans under a new senior credit facility, $565.0 million in proceeds from the issuance of senior toggle notes, and $300.3 million in proceeds from the issuance of senior subordinated notes. In addition, costs associated with issuing these long-term debt obligations approximated $56.3 million and are capitalized on the Company’s balance sheet and are being amortized to interest expense over the respective terms of the debt instruments. Historical Ownership by Cardinal
We historically operated as a portion of the PTS business segment of Cardinal and not as a stand-alone company (the “Predecessor”). The combined financial statements for all periods prior to April 10, 2007 included herein reflect the operations that were acquired as part of the Acquisition and have been derived from the historical consolidated financial statements of Cardinal using the historical results of our operations and the historical basis of our assets and liabilities.
As the Predecessor, we were allocated general corporate overhead expenses from Cardinal for corporate-related functions
and corporate overhead expense. We believe the assumptions and methodologies underlying the allocations from Cardinal are reasonable. However, such expenses are not indicative of, nor is it practical or meaningful for us to estimate for all historical periods presented, the actual level of expenses that would have been incurred had we been operating as a separate, stand-alone public or private company during such periods. See Notes 1 and 11 of our June 30, 2007 Consolidated and Combined Financial Statements for further discussion of amounts charged by Cardinal.
18
Critical Accounting Policies and Estimates
The preparation of financial statements in conformity with generally accepted accounting principles (“GAAP”) in the United States requires management to make estimates and assumptions that affect amounts reported in the financial statements and accompanying notes. Actual amounts may differ from these estimated amounts. Some of the more significant estimates used include those used in accounting for the Acquisition under the purchase method of accounting, and prior to the acquisition, in allocating certain costs to the Predecessor in order to present the Predecessor’s operating results on a stand alone basis. The Company believes that the understanding of certain key accounting policies and estimates are essential in achieving more insight into the Company’s operating results and financial condition. These key accounting policies include, but are not limited to allowance for doubtful accounts, the valuation of long-lived and intangible assets, equity-based compensation, income taxes, and currency risk management.
There were no significant changes to these policies or in the underlying accounting assumptions and estimates used in the critical accounting policies from those disclosed in the Company’s Fiscal 2007 Consolidated and Combined Financial Statements.
Recent Financial Accounting Standards
In February 2006, the FASB issued SFAS No. 155, “Accounting for Certain Hybrid Financial Instruments,” an amendment of SFAS No. 133, “Accounting for Derivative Instruments and Hedging Activities” and SFAS No. 140, “Accounting for Transfers and Servicing of Financial Assets and Extinguishments of Liabilities.” This Statement permits fair value remeasurement for any hybrid financial instrument that contains an embedded derivative that would otherwise be required to be bifurcated from its host contract. The election to measure a hybrid financial instrument at fair value, in its entirety, is irrevocable and all changes in fair value are to be recognized in earnings. This Statement also clarifies and amends certain provisions of SFAS No. 133 and SFAS No. 140. This Statement is effective for all financial instruments acquired, issued or subject to a remeasurement event occurring in fiscal years beginning after September 15, 2006. Early adoption is permitted, provided the Company has not yet issued financial statements, including financial statements for any interim period, for that fiscal year. The adoption of this Statement did not have a material impact on the Company’s financial position or results of operations.
In July 2006, the FASB issued FASB Interpretation No. 48, “Accounting for Uncertainty in Income Taxes.” This Interpretation prescribes a comprehensive model for the financial statement recognition, measurement, presentation and disclosure of uncertain tax positions taken or expected to be taken in income tax returns. This Interpretation is effective for fiscal years beginning after December 15, 2006. The cumulative effects, if any, of applying this Interpretation will be recorded as an adjustment to retained earnings as of the beginning of the period of adoption. The adoption of this Interpretation did not have a material impact on the Company’s financial position or results of operations.
In September 2006, the FASB issued SFAS No. 157, “Fair Value Measurements.” This Statement defines fair value, establishes a framework for measuring fair value in GAAP and expands disclosures about fair value measurements. This Statement is effective for fiscal years beginning after November 15, 2007, and interim periods within those fiscal years. The Company is in the process of determining the impact of adopting this Statement.
In February 2007, the FASB issued SFAS No. 159, “The Fair Value Option for Financial Assets and Financial Liabilities.” SFAS No. 159 permits an entity, on a contract-by-contract basis, to make an irrevocable election to account for certain types of financial instruments and warranty and insurance contracts at fair value, rather than historical cost, with changes in the fair value, whether realized or unrealized, recognized in earnings. SFAS No. 159 is effective for the Company in the first quarter of fiscal 2009. The Company is in the process of determining the impact of adopting this Statement.
19
Results of Operations
Management measures operating performance from operating earnings to net earnings before interest expense, provision (benefit) for income taxes and depreciation and amortization (“EBITDA”). The term EBITDA is not defined under generally accepted accounting principles in the United States (“U.S. GAAP”). EDITDA is not a measure of operating income, operating performance or liquidity presented in accordance with U.S. GAAP and is subject to important limitations.
We believe that the presentation of EBITDA enhances an investor’s understanding of our financial performance. We
believe that EBITDA is a useful financial metric to assess our operating performance from period to period by excluding certain items that we believe are not representative of our core business. We also believe EBITDA is useful to assess our ability to generate cash from operations sufficient to pay taxes, to service debt and to undertake capital expenditures. We use EBITDA for business planning purposes. In addition, given the significant investments that we have made in the past in property, plant and equipment, depreciation and amortization expenses represent a meaningful portion of our cost structure. We believe that EBITDA will provide investors with a useful tool for assessing the comparability between periods of our ability to generate cash from operations sufficient to pay taxes, to service debt and to undertake capital expenditures because it eliminates depreciation and amortization expense.
SEC rules regulate the use in filings with the SEC of “non-GAAP financial measures,” such as EBITDA and segment
EBITDA that are derived on the basis of methodologies other than in accordance U.S. GAAP. We present certain non-GAAP measures in order to provide supplemental information that we consider relevant for the readers of the financial statements, and such information is not meant to replace or supersede U.S. GAAP measures. The non-U.S. GAAP measures may not be the same as similarly titled measures used by other companies.
Three Months Ended September 30, 2007 compared to The Three Months Ended September 30, 2006
The financial statements present our results for the three month period ended September 30, 2007 and on a “predecessor basis” for the three month period ended September 30, 2006, (reflecting Predecessor ownership by Cardinal). The Successor was created as a result of the Acquisition of the Predecessor’s businesses from Cardinal on April 10, 2007. See Notes 1 and 2 of the Consolidated and Combined Condensed Financial Statements for further discussion of the Acquisition.
For purpose of management’s discussion and analysis of the results of operations, we have compared the results of the
Successor for the three month period in fiscal 2008 with those of the Predecessor in the three month period in fiscal 2007. The results of the two periods are not necessarily comparable due to the change in basis of accounting resulting from the Acquisition and the change in the capital structure, which primarily impact depreciation, amortization and interest expense. The captions included within our statements of operations that are materially impacted by the change in basis of accounting include depreciation and amortization expense, gross margin, selling, general and administrative expenses and interest expense. We have disclosed the impact of the change in basis of accounting for each of these captions in the following discussion of our results of operations.
20
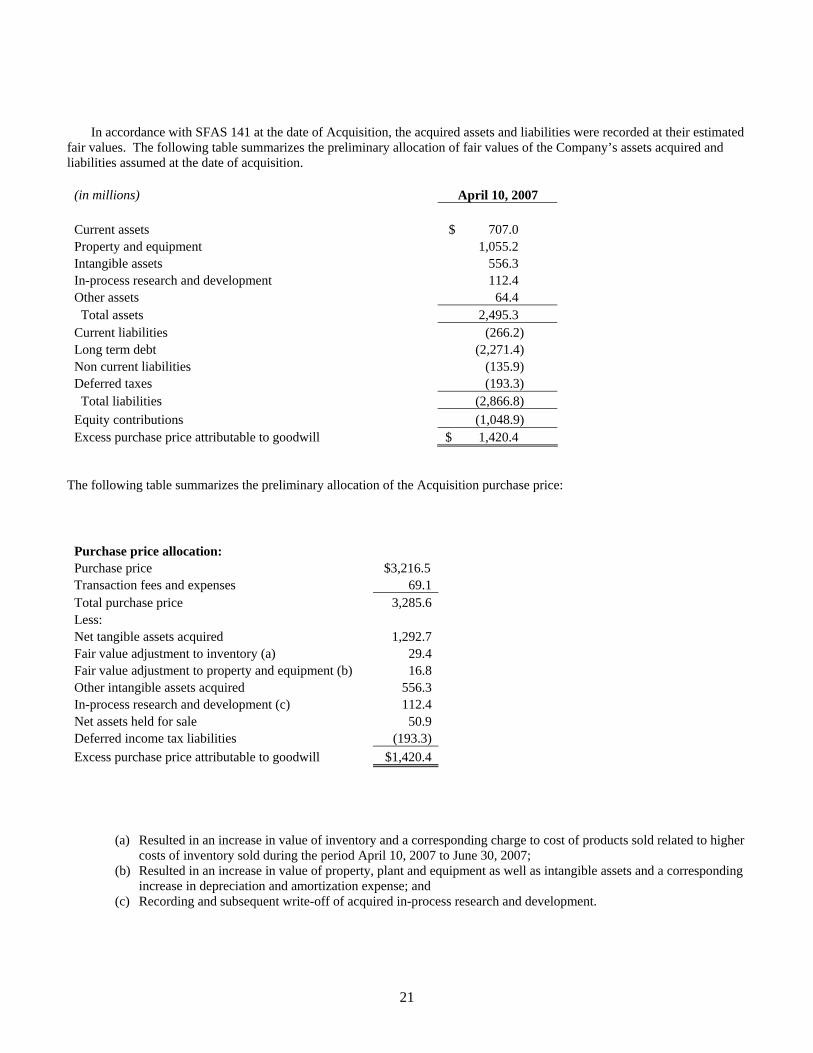
In accordance with SFAS 141 at the date of Acquisition, the acquired assets and liabilities were recorded at their estimated fair values. The following table summarizes the preliminary allocation of fair values of the Company’s assets acquired and liabilities assumed at the date of acquisition.
(in millions) April 10, 2007 Current assets $ 707.0 Property and equipment 1,055.2 Intangible assets 556.3 In-process research and development 112.4 Other assets 64.4 Total assets 2,495.3 Current liabilities (266.2) Long term debt (2,271.4) Non current liabilities (135.9) Deferred taxes (193.3) Total liabilities (2,866.8) Equity contributions (1,048.9) Excess purchase price attributable to goodwill $ 1,420.4
The following table summarizes the preliminary allocation of the Acquisition purchase price:
Purchase price allocation:
Purchase price $3,216.5 Transaction fees and expenses 69.1 Total purchase price 3,285.6 Less: Net tangible assets acquired 1,292.7 Fair value adjustment to inventory (a) 29.4 Fair value adjustment to property and equipment (b) 16.8 Other intangible assets acquired 556.3 In-process research and development (c) 112.4 Net assets held for sale 50.9 Deferred income tax liabilities (193.3) Excess purchase price attributable to goodwill $1,420.4
(a) Resulted in an increase in value of inventory and a corresponding charge to cost of products sold related to higher costs of inventory sold during the period April 10, 2007 to June 30, 2007;
(b) Resulted in an increase in value of property, plant and equipment as well as intangible assets and a corresponding increase in depreciation and amortization expense; and
(c) Recording and subsequent write-off of acquired in-process research and development.
21
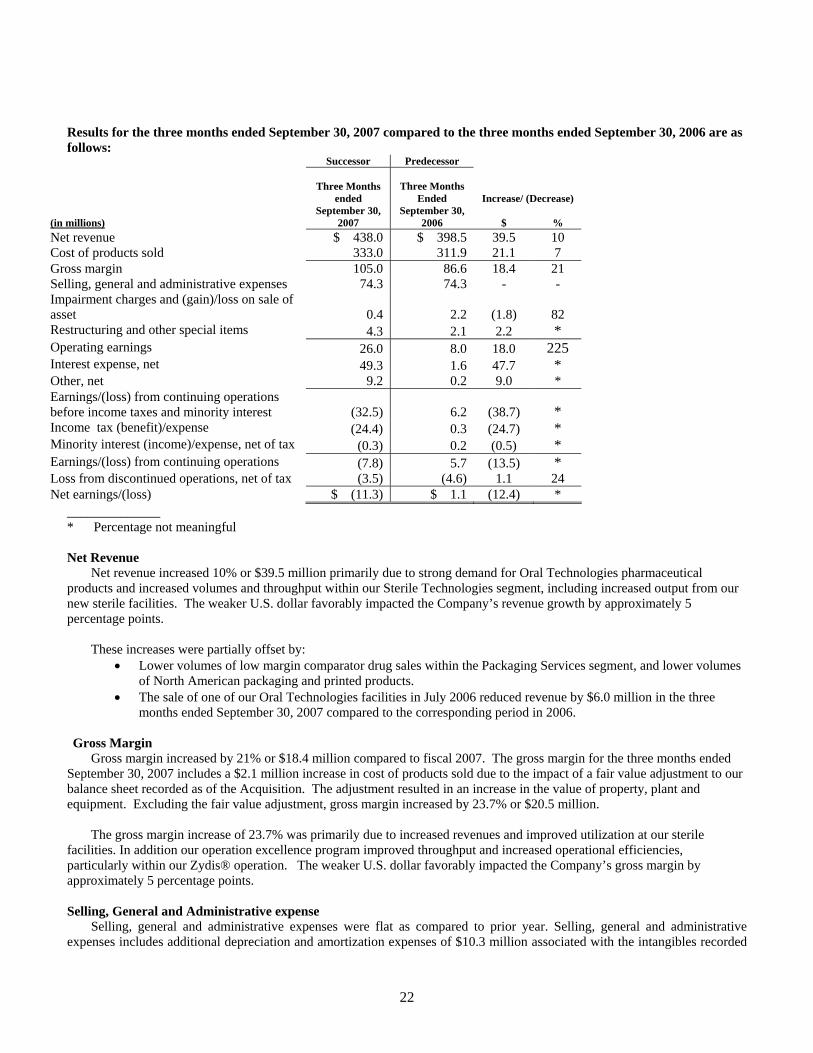
Results for the three months ended September 30, 2007 compared to the three months ended September 30, 2006 are as follows:
Successor Predecessor
Three Months
ended
Three Months
Ended Increase/ (Decrease)
(in millions)September 30,
2007 September 30,
2006 $ % Net revenue $ 438.0 $ 398.5 39.5 10 Cost of products sold 333.0 311.9 21.1 7 Gross margin 105.0 86.6 18.4 21 Selling, general and administrative expenses 74.3 74.3 - - Impairment charges and (gain)/loss on sale of asset 0.4 2.2 (1.8) 82 Restructuring and other special items 4.3 2.1 2.2 * Operating earnings 26.0 8.0 18.0 225 Interest expense, net 49.3 1.6 47.7 * Other, net 9.2 0.2 9.0 * Earnings/(loss) from continuing operations before income taxes and minority interest (32.5) 6.2 (38.7) * Income tax (benefit)/expense (24.4) 0.3 (24.7) * Minority interest (income)/expense, net of tax (0.3) 0.2 (0.5) * Earnings/(loss) from continuing operations (7.8) 5.7 (13.5) * Loss from discontinued operations, net of tax (3.5) (4.6) 1.1 24 Net earnings/(loss) $ (11.3) $ 1.1 (12.4) *
______________ * Percentage not meaningful Net Revenue
Net revenue increased 10% or $39.5 million primarily due to strong demand for Oral Technologies pharmaceutical products and increased volumes and throughput within our Sterile Technologies segment, including increased output from our new sterile facilities. The weaker U.S. dollar favorably impacted the Company’s revenue growth by approximately 5 percentage points.
These increases were partially offset by:
• Lower volumes of low margin comparator drug sales within the Packaging Services segment, and lower volumes of North American packaging and printed products.
• The sale of one of our Oral Technologies facilities in July 2006 reduced revenue by $6.0 million in the three months ended September 30, 2007 compared to the corresponding period in 2006.
Gross Margin
Gross margin increased by 21% or $18.4 million compared to fiscal 2007. The gross margin for the three months ended September 30, 2007 includes a $2.1 million increase in cost of products sold due to the impact of a fair value adjustment to our balance sheet recorded as of the Acquisition. The adjustment resulted in an increase in the value of property, plant and equipment. Excluding the fair value adjustment, gross margin increased by 23.7% or $20.5 million.
The gross margin increase of 23.7% was primarily due to increased revenues and improved utilization at our sterile
facilities. In addition our operation excellence program improved throughput and increased operational efficiencies, particularly within our Zydis® operation. The weaker U.S. dollar favorably impacted the Company’s gross margin by approximately 5 percentage points.
Selling, General and Administrative expense
Selling, general and administrative expenses were flat as compared to prior year. Selling, general and administrative expenses includes additional depreciation and amortization expenses of $10.3 million associated with the intangibles recorded
22
in connection with the Acquisition and the increase in the value of property, plant and equipment recorded as part of the Acquisition. Excluding these fair value adjustments selling, general and administrative expenses decreased $10.3 million or 13.9%, primarily due to the following:
• Higher allocation of costs by Cardinal of $6.1 million in the three months ended September 30, 2006 compared to
the stand alone costs during the three months ended September 30, 2007, • A $5.8 million reduction in equity compensation charges from the fiscal 2006 period to the fiscal 2007 period,
and • A decrease in salary costs as a result of the reduction in force that was completed in the quarter ending June 30,
2007. Offsetting these decreases were the sponsor advisory fee of $2.5 million and the adverse impact of the weaker U.S. dollar which increased selling, general and administrative expenses by approximately $1.1 million.
Impairment Charges and (Gain)/Loss on Sale of Asset
Impairment charges and (gain)/loss on sale of assets decreased by $1.8 million during the three months ended September 30 2007 compared to the three months ended September 30, 2006. During the fiscal 2007 period, we recorded an asset impairment of $1.8 million based upon a discounted cash flow analysis based upon change in our expected use of the assets related to the Sterile Technologies segment. During the fiscal 2008 period, we did not record any significant asset impairment charges.
Restructuring and Other Special Items
Restructuring and other special items increased by $2.2 million to $4.3 million for the three months ended September 30, 2007 compared to the three months ended September 30, 2006, of $2.1 million. The increased charges in fiscal 2008 primarily relate to separation costs incurred as a result of the Acquisition.
Interest Expense, net
Interest expense, net increased by $47.7 million for the three months ended September 30, 2007, primarily as a result of the interest expense on our new debt issuances used to finance the Acquisition on April 10, 2007. Other, net
Other, net increased by $9.0 million for the three months ended September 30, 2007, primarily as a result foreign currency translation expense recorded related to intercompany loans denominated in non U.S. dollar currency. As these intercompany loans are temporary loans, the impact of translating these loans to U.S. dollar equivalent is recorded in the statement of operations.
Provision/(Benefit) for Income Taxes
Our effective tax rate reflects tax benefits derived from operations outside the United States, which are generally taxed at
rates lower than the U.S. statutory rate of 35%. Our three months ended September 30, 2007 benefit for income taxes was ($24.4) million and relative to losses before income taxes of ($32.5) million. The (benefit)/ expense for income taxes relative to earnings/(loss) before income taxes, minority interest and discontinued operations was (74.8%) and 5.0% for the three months ended September 30, 2007 and September 30, 2006, respectively. Generally, fluctuations in the effective tax rate are primarily due to change in our geographic pretax income resulting from our business mix and changes in the tax impact of restructuring and other special items and other discrete tax items, which may have unique tax implications depending on the nature of the item. The benefit for the three months ended September 30, 2007, includes adjustments in the Company’s deferred tax liabilities for tax rate changes in Germany and UK of $5.5 million and $3.9 million, respectively.
23
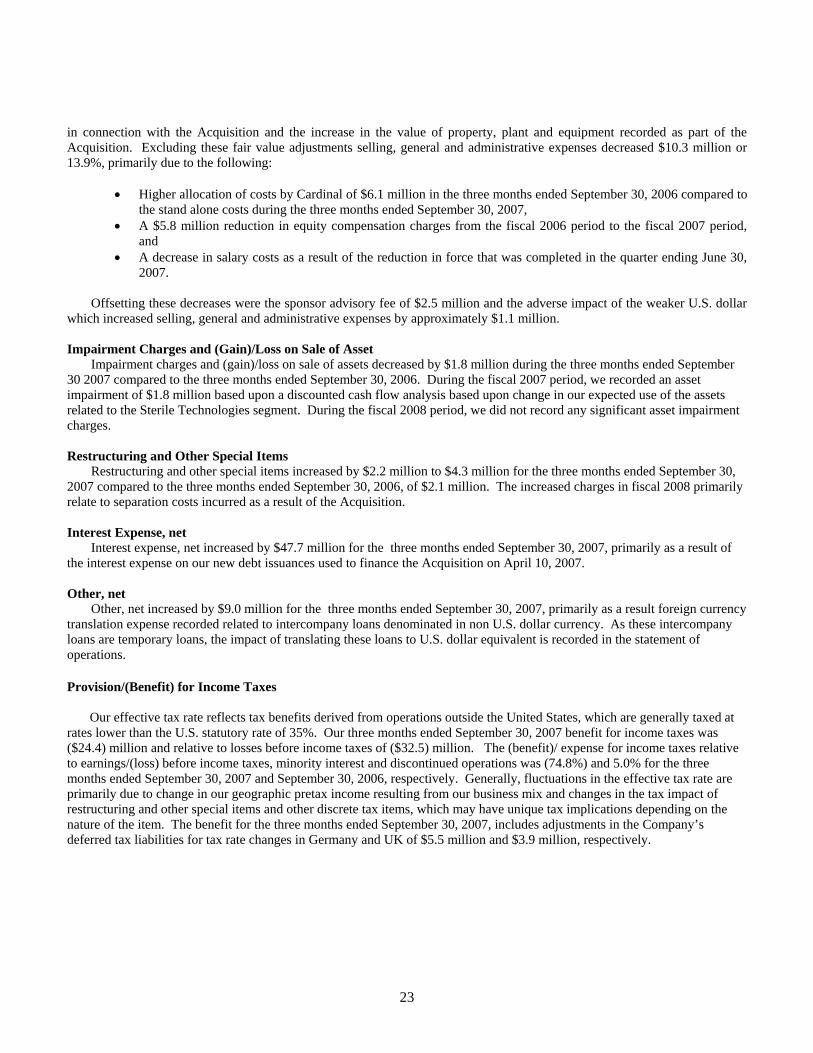
Segment Review Our results on a segment basis for the three months ended September 30, 2007 compared to the three months ended
September 30, 2006.
Successor Predecessor
Three Months
Ended
Three Months
ended Increase/ (Decrease)
(in millions) September 30,
2007 September 30,
2006 $ %
Oral Technologies Net revenue $235.2 $216.4 18.8 9 Segment EBITDA 49.4 42.1 7.3 17
Sterile Technologies Net revenue 70.5 55.9 14.6 26 Segment EBITDA 6.1 (5.1) 11.2 *
Packaging Services Net revenue 141.7 137.8 3.9 3 Segment EBITDA 20.8 17.0 3.8 22
Inter-segment revenue elimination (9.4) (11.6) 2.2 (19)
Unallocated costs (1) (18.5) (22.6) 4.1 (18)
Combined Total Net revenue 438.0 398.5 39.5 10 EBITDA from continuing operations $ 57.8 $ 31.4 26.4 84
______________ * Percentage not meaningful
(2) Unallocated costs includes special items, equity-based compensation, impairment charges, certain other Corporate directed costs, and other costs that are not allocated to the segments as follows:
Successor Predecessor Three Months
Ended Three Months
Ended September 30,
2007 September 30,
2006 Impairment charges and gain/(loss) on sale of assets $ (0.4) $ (2.2) Equity compensation (1.8) (7.6) Restructuring and other special items (4.3) (2.1) Sponsor advisory fee (2.5) - Minority interest, net 0.3 (0.2) Other, net (9.2) (0.2) Non-allocated corporate costs, net (0.6) (10.3) Total unallocated costs $ (18.5) $ (22.6)
24
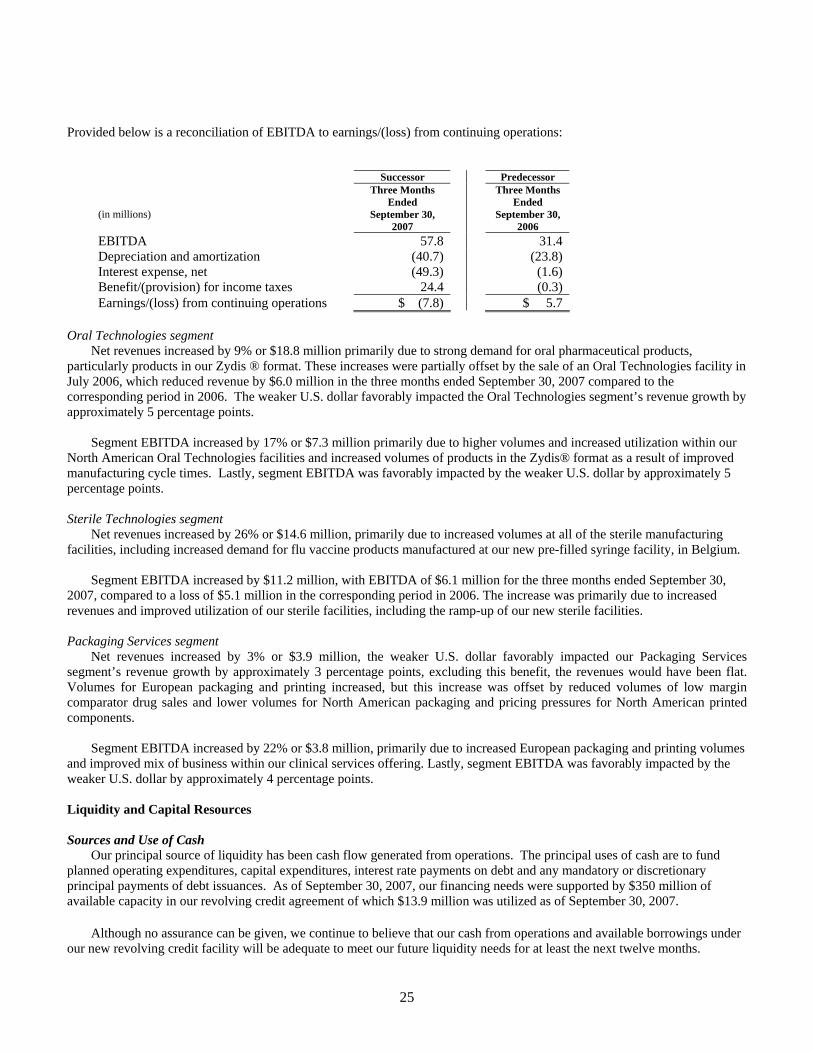
Provided below is a reconciliation of EBITDA to earnings/(loss) from continuing operations:
Successor Predecessor Three Months
Ended Three Months
Ended (in millions) September 30,
2007 September 30,
2006 EBITDA 57.8 31.4 Depreciation and amortization (40.7) (23.8) Interest expense, net (49.3) (1.6) Benefit/(provision) for income taxes 24.4 (0.3) Earnings/(loss) from continuing operations $ (7.8) $ 5.7
Oral Technologies segment
Net revenues increased by 9% or $18.8 million primarily due to strong demand for oral pharmaceutical products, particularly products in our Zydis ® format. These increases were partially offset by the sale of an Oral Technologies facility in July 2006, which reduced revenue by $6.0 million in the three months ended September 30, 2007 compared to the corresponding period in 2006. The weaker U.S. dollar favorably impacted the Oral Technologies segment’s revenue growth by approximately 5 percentage points.
Segment EBITDA increased by 17% or $7.3 million primarily due to higher volumes and increased utilization within our
North American Oral Technologies facilities and increased volumes of products in the Zydis® format as a result of improved manufacturing cycle times. Lastly, segment EBITDA was favorably impacted by the weaker U.S. dollar by approximately 5 percentage points. Sterile Technologies segment
Net revenues increased by 26% or $14.6 million, primarily due to increased volumes at all of the sterile manufacturing facilities, including increased demand for flu vaccine products manufactured at our new pre-filled syringe facility, in Belgium.
Segment EBITDA increased by $11.2 million, with EBITDA of $6.1 million for the three months ended September 30,
2007, compared to a loss of $5.1 million in the corresponding period in 2006. The increase was primarily due to increased revenues and improved utilization of our sterile facilities, including the ramp-up of our new sterile facilities.
Packaging Services segment
Net revenues increased by 3% or $3.9 million, the weaker U.S. dollar favorably impacted our Packaging Services segment’s revenue growth by approximately 3 percentage points, excluding this benefit, the revenues would have been flat. Volumes for European packaging and printing increased, but this increase was offset by reduced volumes of low margin comparator drug sales and lower volumes for North American packaging and pricing pressures for North American printed components.
Segment EBITDA increased by 22% or $3.8 million, primarily due to increased European packaging and printing volumes
and improved mix of business within our clinical services offering. Lastly, segment EBITDA was favorably impacted by the weaker U.S. dollar by approximately 4 percentage points. Liquidity and Capital Resources Sources and Use of Cash
Our principal source of liquidity has been cash flow generated from operations. The principal uses of cash are to fund planned operating expenditures, capital expenditures, interest rate payments on debt and any mandatory or discretionary principal payments of debt issuances. As of September 30, 2007, our financing needs were supported by $350 million of available capacity in our revolving credit agreement of which $13.9 million was utilized as of September 30, 2007.
Although no assurance can be given, we continue to believe that our cash from operations and available borrowings under
our new revolving credit facility will be adequate to meet our future liquidity needs for at least the next twelve months.
25
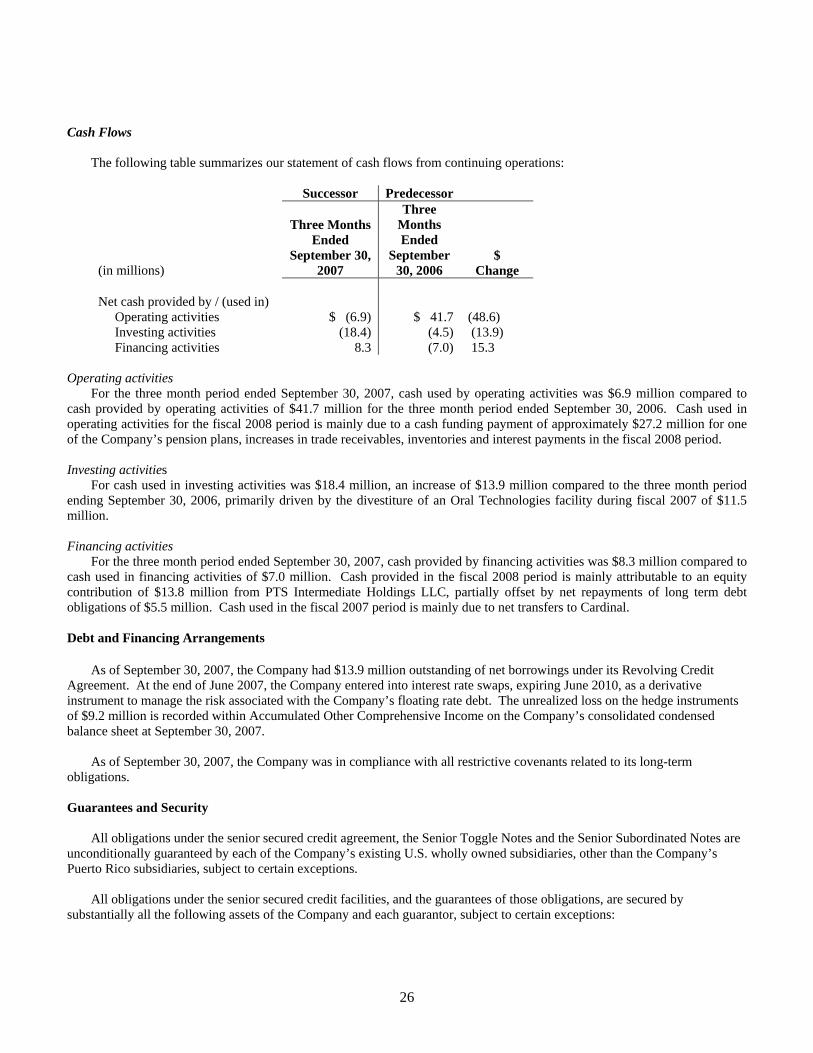
Cash Flows The following table summarizes our statement of cash flows from continuing operations:
Successor Predecessor
(in millions)
Three Months Ended
September 30, 2007
Three Months Ended
September 30, 2006
$ Change
Net cash provided by / (used in) Operating activities $ (6.9) $ 41.7 (48.6) Investing activities (18.4) (4.5) (13.9) Financing activities 8.3 (7.0) 15.3
Operating activities
For the three month period ended September 30, 2007, cash used by operating activities was $6.9 million compared to cash provided by operating activities of $41.7 million for the three month period ended September 30, 2006. Cash used in operating activities for the fiscal 2008 period is mainly due to a cash funding payment of approximately $27.2 million for one of the Company’s pension plans, increases in trade receivables, inventories and interest payments in the fiscal 2008 period. Investing activities
For cash used in investing activities was $18.4 million, an increase of $13.9 million compared to the three month period ending September 30, 2006, primarily driven by the divestiture of an Oral Technologies facility during fiscal 2007 of $11.5 million. Financing activities
For the three month period ended September 30, 2007, cash provided by financing activities was $8.3 million compared to cash used in financing activities of $7.0 million. Cash provided in the fiscal 2008 period is mainly attributable to an equity contribution of $13.8 million from PTS Intermediate Holdings LLC, partially offset by net repayments of long term debt obligations of $5.5 million. Cash used in the fiscal 2007 period is mainly due to net transfers to Cardinal. Debt and Financing Arrangements
As of September 30, 2007, the Company had $13.9 million outstanding of net borrowings under its Revolving Credit
Agreement. At the end of June 2007, the Company entered into interest rate swaps, expiring June 2010, as a derivative instrument to manage the risk associated with the Company’s floating rate debt. The unrealized loss on the hedge instruments of $9.2 million is recorded within Accumulated Other Comprehensive Income on the Company’s consolidated condensed balance sheet at September 30, 2007.
As of September 30, 2007, the Company was in compliance with all restrictive covenants related to its long-term obligations.
Guarantees and Security
All obligations under the senior secured credit agreement, the Senior Toggle Notes and the Senior Subordinated Notes are
unconditionally guaranteed by each of the Company’s existing U.S. wholly owned subsidiaries, other than the Company’s Puerto Rico subsidiaries, subject to certain exceptions.
All obligations under the senior secured credit facilities, and the guarantees of those obligations, are secured by
substantially all the following assets of the Company and each guarantor, subject to certain exceptions:
26
• A pledge of 100% of the capital stock of the Company and 100% of the equity interests directly held by Company and each guarantor in any wholly-owned material subsidiary of the Company or any guarantor (which pledge, in the case of any non-U.S. subsidiary of a U.S. subsidiary, will not include more than 65% of the voting stock of such non-U.S. subsidiary); and
• A security interest in, and mortgages on, substantially all tangible and intangible assets of Company and each guarantor, subject to certain limited exceptions.
During the three months ended September 30, 2007, our non-guarantor subsidiaries accounted for approximately $275.3 million, or approximately 63%, of our total net revenue, and approximately $36.9 million, or approximately 64%, of our total EBITDA from continuing operations of $57.8 million.
As of September 30, 2007, our non-guarantor subsidiaries accounted for approximately $1.4 billion, or 59%, of our total assets (excluding intercompany receivables and goodwill), and approximately $386.4 million, or 62%, of our total liabilities (excluding intercompany liabilities and issuer's debt of approximately $2.3 billion).
Debt Covenants
The senior secured credit agreement and the indentures governing the Senior Toggle Notes and the Senior Subordinated
Notes contain a number of covenants that, among other things, restrict, subject to certain exceptions, the Company’s (and the Company’s restricted subsidiaries’) ability to incur additional indebtedness or issue certain preferred shares; create liens on assets; engage in mergers and consolidations; sell assets; pay dividends and distributions or repurchase capital stock; engage in certain transactions with affiliates; make investments, loans or advances; make certain acquisitions; and in the case of the Company’s senior credit agreement, enter into sale and leaseback transactions; repay subordinated indebtedness, amend material agreements governing the Company’s subordinated indebtedness (including the senior subordinated notes); and change the Company’s lines of business.
Subject to certain exceptions, the senior credit agreement and the indentures governing the notes will permit the Company
and its restricted subsidiaries to incur additional indebtedness, including secured indebtedness. None of our non-U.S. subsidiaries or Puerto Rico subsidiaries are guarantors of the loans or notes.
As market conditions warrant, we and our major equityholders, including Blackstone and its affiliates, may from time to
time repurchase debt securities issued, including the notes, in privately negotiated or open market transactions, by tender or otherwise. Historical and Adjusted EBITDA
Adjusted EBITDA is based on the definitions in our indentures, is not defined under U.S. GAAP, and is subject to
important limitations. In calculating Adjusted EBITDA, we add back certain non-cash, non-recurring and other items that are included in
EBITDA and net income as required by various covenants in the indentures governing the notes. Adjusted EBITDA, among other things:
• does not include non-cash stock-based employee compensation expense and certain other non-cash charges;
• does not include cash and non-cash restructuring, severance and relocation costs incurred to realize future cost savings and enhance our operations;
• adds back minority interest expense, which represents the minority investors’ ownership of certain of our consolidated
subsidiaries and is, therefore not available to us; and
• includes estimated cost savings which have not yet been fully reflected in our results.
27
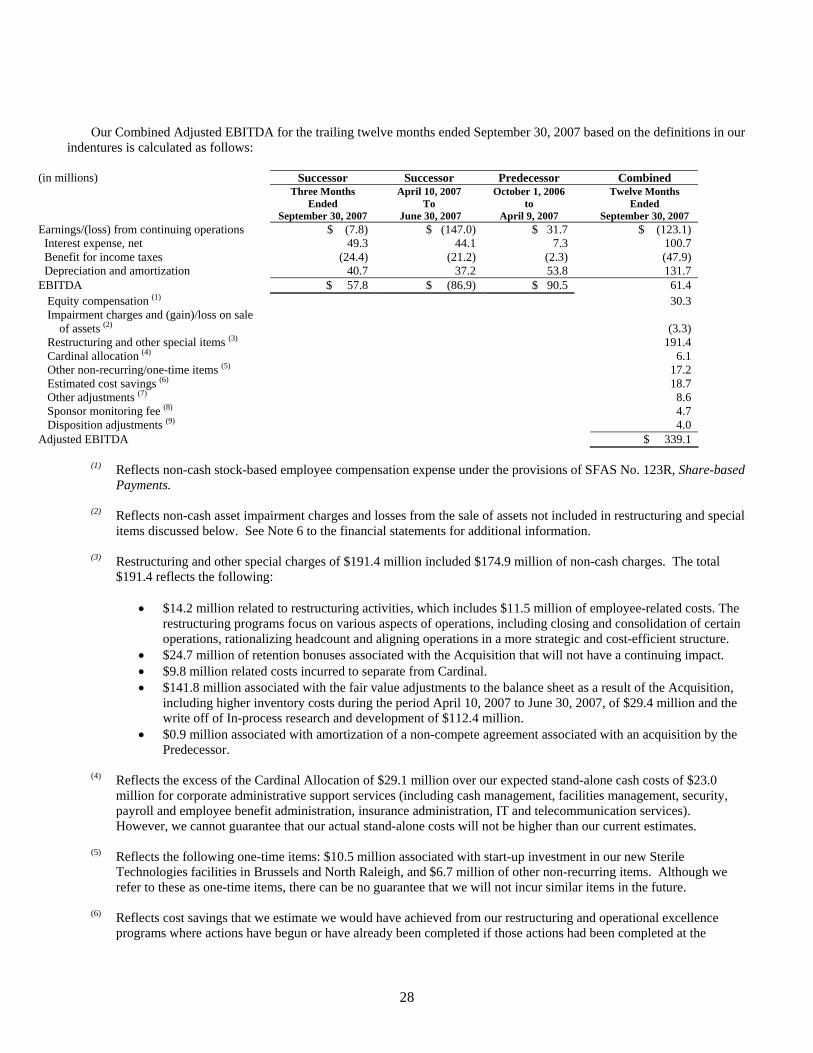
Our Combined Adjusted EBITDA for the trailing twelve months ended September 30, 2007 based on the definitions in our indentures is calculated as follows:
(in millions) Successor Successor Predecessor Combined Three Months
Ended September 30, 2007
April 10, 2007 To
June 30, 2007
October 1, 2006 to
April 9, 2007
Twelve Months Ended
September 30, 2007 Earnings/(loss) from continuing operations $ (7.8) $ (147.0) $ 31.7 $ (123.1) Interest expense, net 49.3 44.1 7.3 100.7 Benefit for income taxes (24.4) (21.2) (2.3) (47.9) Depreciation and amortization 40.7 37.2 53.8 131.7 EBITDA $ 57.8 $ (86.9) $ 90.5 61.4 Equity compensation (1) 30.3 Impairment charges and (gain)/loss on sale of assets (2)
(3.3)
Restructuring and other special items (3) 191.4 Cardinal allocation (4) 6.1 Other non-recurring/one-time items (5) 17.2 Estimated cost savings (6) 18.7 Other adjustments (7) 8.6 Sponsor monitoring fee (8) 4.7 Disposition adjustments (9) 4.0 Adjusted EBITDA $ 339.1
(1) Reflects non-cash stock-based employee compensation expense under the provisions of SFAS No. 123R, Share-based
Payments. (2) Reflects non-cash asset impairment charges and losses from the sale of assets not included in restructuring and special
items discussed below. See Note 6 to the financial statements for additional information.
(3) Restructuring and other special charges of $191.4 million included $174.9 million of non-cash charges. The total $191.4 reflects the following:
• $14.2 million related to restructuring activities, which includes $11.5 million of employee-related costs. The
restructuring programs focus on various aspects of operations, including closing and consolidation of certain operations, rationalizing headcount and aligning operations in a more strategic and cost-efficient structure.
• $24.7 million of retention bonuses associated with the Acquisition that will not have a continuing impact. • $9.8 million related costs incurred to separate from Cardinal. • $141.8 million associated with the fair value adjustments to the balance sheet as a result of the Acquisition,
including higher inventory costs during the period April 10, 2007 to June 30, 2007, of $29.4 million and the write off of In-process research and development of $112.4 million.
• $0.9 million associated with amortization of a non-compete agreement associated with an acquisition by the Predecessor.
(4) Reflects the excess of the Cardinal Allocation of $29.1 million over our expected stand-alone cash costs of $23.0
million for corporate administrative support services (including cash management, facilities management, security, payroll and employee benefit administration, insurance administration, IT and telecommunication services). However, we cannot guarantee that our actual stand-alone costs will not be higher than our current estimates.
(5) Reflects the following one-time items: $10.5 million associated with start-up investment in our new Sterile
Technologies facilities in Brussels and North Raleigh, and $6.7 million of other non-recurring items. Although we refer to these as one-time items, there can be no guarantee that we will not incur similar items in the future.
(6) Reflects cost savings that we estimate we would have achieved from our restructuring and operational excellence
programs where actions have begun or have already been completed if those actions had been completed at the
28
beginning of the period presented, including $7.8 million from headcount reductions and $10.9 million from other cost reduction initiatives. However, there is no guarantee we will be able to achieve this level of cost savings.
(7) Reflects other adjustments required in calculation our covenant compliance under the indentures governing our notes, primarily $4.1 million of minority interest expense, $1.7 million of severance and relocation costs and $0.4 million of franchise taxes in selling, general and administrative expenses. However, minority interest expense does not represent EBITDA that is available to us, and we expect to incur severance and relocation costs and franchise taxes in the future. In addition, other adjustments reflect the estimated decrease to pension and post-retirement benefits expense resulting from the elimination of amortization and deferral of unrecognized actuarial losses and prior service costs of $1.6 million associated with the purchase accounting related to the Acquisition. Lastly, other adjustments reflect the rent expense that has been eliminated of $0.8 million and replaced by comparable amounts of depreciation expense when we purchased, in January 2007, the buildings and equipment that were previously under an operating lease.
(8) Represents amount of sponsor monitoring fee. See Note 10 to the financial statements.
(9) Reflects the elimination of $4.4 million of losses from one of our facilities, which we expect to close in December
2007, offset by $0.4 million of EBITDA generated by businesses, which we sold on March 9, 2007. We have not eliminated $3.0 million of EBITDA generated by an Oral Technologies facility, which was sold to a customer in July 2006, because it is part of a larger customer relationship that is expected to continue. We cannot assure you that this customer will continue to generate the same level of cash flows as in the past.
Interest Risk Management
A portion of the debt used to finance our operations is exposed to interest rate fluctuations. We may use various hedging strategies and derivative financial instruments to create an appropriate mix of fixed and floating rate assets and liabilities. The primary interest rate exposure as of September 30, 2007 is to interest rate fluctuations in the United States and Europe, especially LIBOR and EURIBOR interest rates. We currently use interest rate swaps as the derivative instrument in these hedging strategies. The derivatives used to manage the risk associated with our floating rate debt were designated as cash flow hedges.
Currency Risk Management
Periodically we may utilize forward currency exchange contracts to manage our exposures to the variability of cash flows primarily related to the foreign exchange rate changes of future foreign currency transaction costs. In addition, from to time to time we will utilize foreign currency forward contracts to protect the value of existing foreign currency assets and liabilities. We expect to continue to evaluate hedging opportunities for foreign currency in the future. Contractual Obligations
Our future contractual obligations have not changed significantly from the amounts reported within our fiscal 2007 Consolidated and Combined Financial Statements. Any changes to our obligations related to our indebtedness are presented above within the section entitled “Debt and Financing Arrangements”. Off-Balance Sheet Arrangements
Other than operating leases, we do not have any off-balance sheet arrangements as of September 30, 2007. Quantitative and Qualitative Disclosures About Market Risk We do not believe that there has been a material change to the quantitative and qualitative market risks disclosed in our fiscal 2007 Consolidated and Combined Financial Statements.
29