holt_utility scale solar pv2
TRANSCRIPT
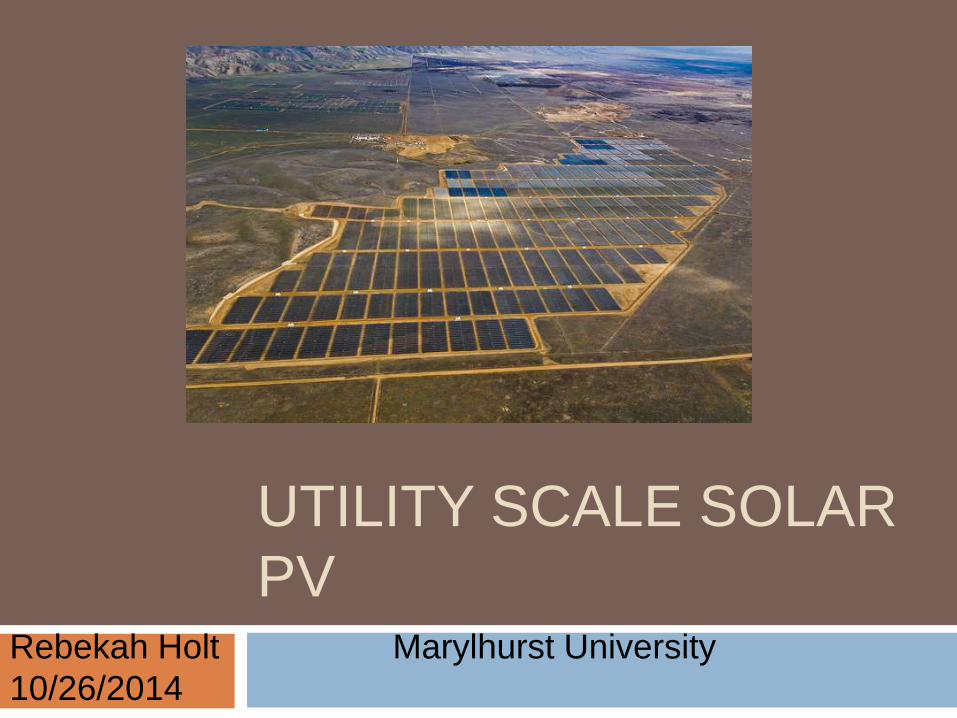
UTILITY SCALE SOLAR
PVRebekah Holt Marylhurst University
10/26/2014

Table of Contents
Definition
Technology
Availability
Potential
Considerations
Risks
Barriers
Business Case study
Q&A
References
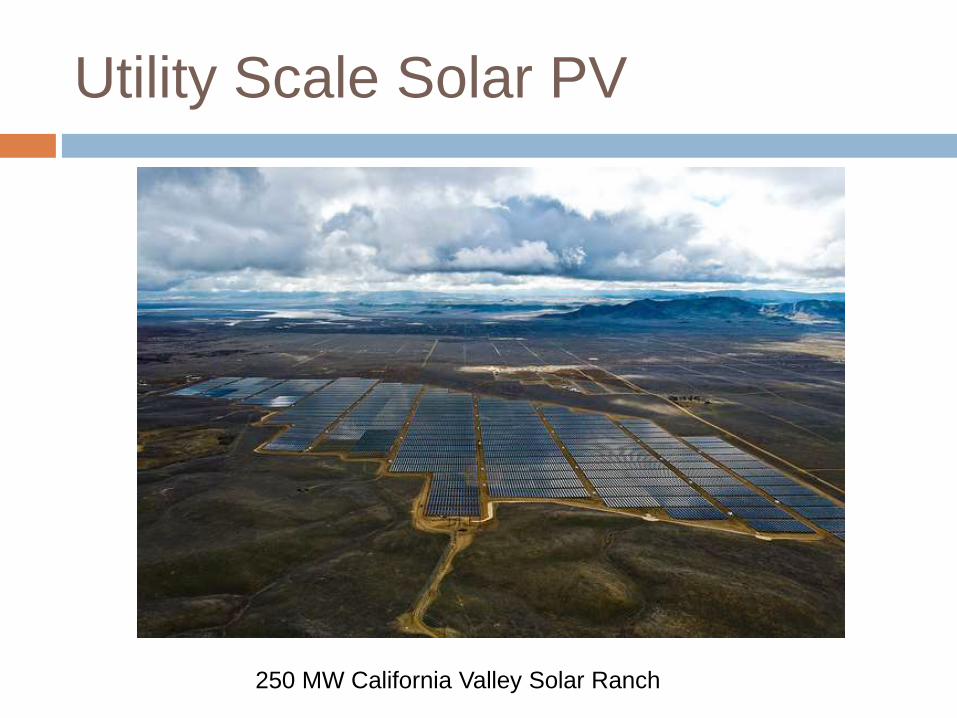
Utility Scale Solar PV
250 MW California Valley Solar Ranch
Definition
Utility-Scale solar, also known as Utility-Scale photovoltaic (PV) has been in the U.S since the 1980s
Utility-Scale PV is large-scale solar that sells its generated energy to utility companies
Utility-Scale is the fastest growing solar market, surpassing concentrating solar power (CSP).
In 2012, utility-scale PV became the largest share of newly installed energy production and is projected to continue this growth.
Utility-scale solar facilities can supply a range of power, 10 MW to over 200 MW, and generate enough electricity to power over 20,000 homes.
Definition
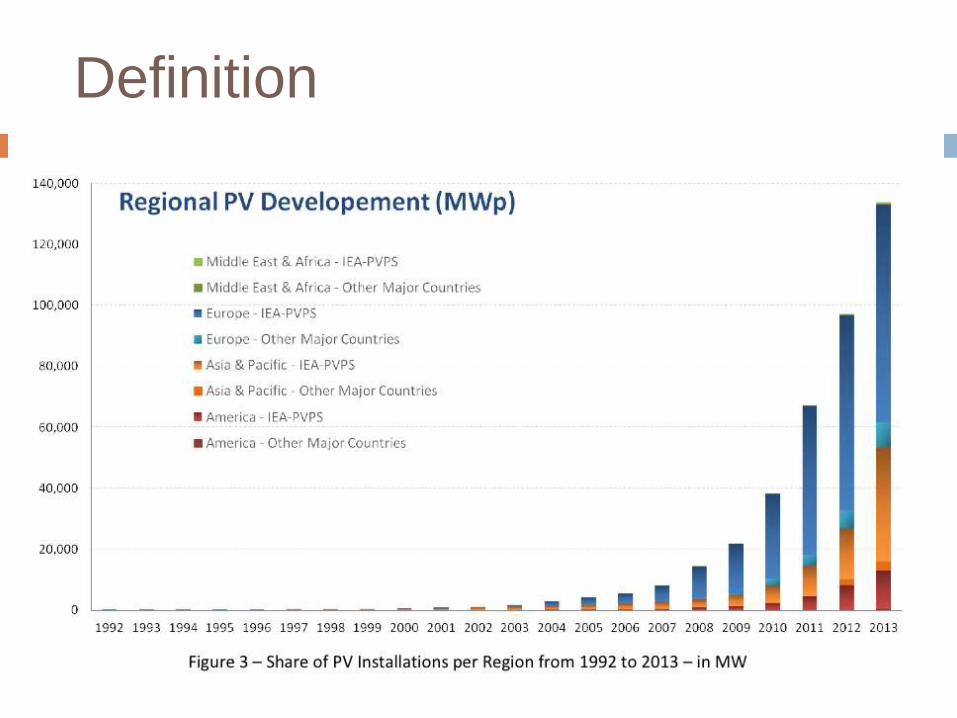
The global PV market grew to at least 36.9 GW in 2013, compared to around 29 GW in the last two years.
Asia ranks in first place in 2013 with more than 59% of the global PV market.
Asian markets experienced the highest growth (170+%) with China at an estimated 11.3 GW of installed PV systems.
The market in Europe has decreased from 22 GW in 2011 to 17 GW in 2012 and 10.3 GW in 2013. For the first time since 2003, Europe is no longer the top PV market in the world.
In 2013, Japan installed an estimated 6.9 GW, the United States an estimated 4.75 GW and Germany an estimated 3.3 GW.
Definition

Definition
There are now 15 countries globally with the ability to produce at least 1% of their electrical demand with solar PV.
By the end of 2013, 17 countries had installed a cumulative of 1 GW in PV systems.
In 2013, PV represented 0.85% of the global electrical demand and is projected to reach 1% by the end of 2014.

Technology
In 1839, Edmund Bequerel, French physicist, discovered certain materials would produce small amounts of electric current when exposed to light.
In 1905, Albert Einstein infamously described light properties and the photoelectric effect
Bell Laboratories built the first photovoltaic module in 1954.
In the 1960s, NASA began to use solar technology to provide power aboard spacecraft. Solar technology rapidly advanced with NASA’s help.
Reliability increased, costs declined.
After the 1970s, photovoltaic technology began to gain recognition as a source of power for non-space applications.
Technology
Solar panels actually comprise many, smaller
units called photovoltaic cells.
Photovoltaic simply means they convert
sunlight into electricity. Many cells linked
together make up a solar panel.
Each photovoltaic cell is basically a sandwich
made up of two slices of semi-conducting
material, usually silicon — the same stuff used
in microelectronics.
Technology
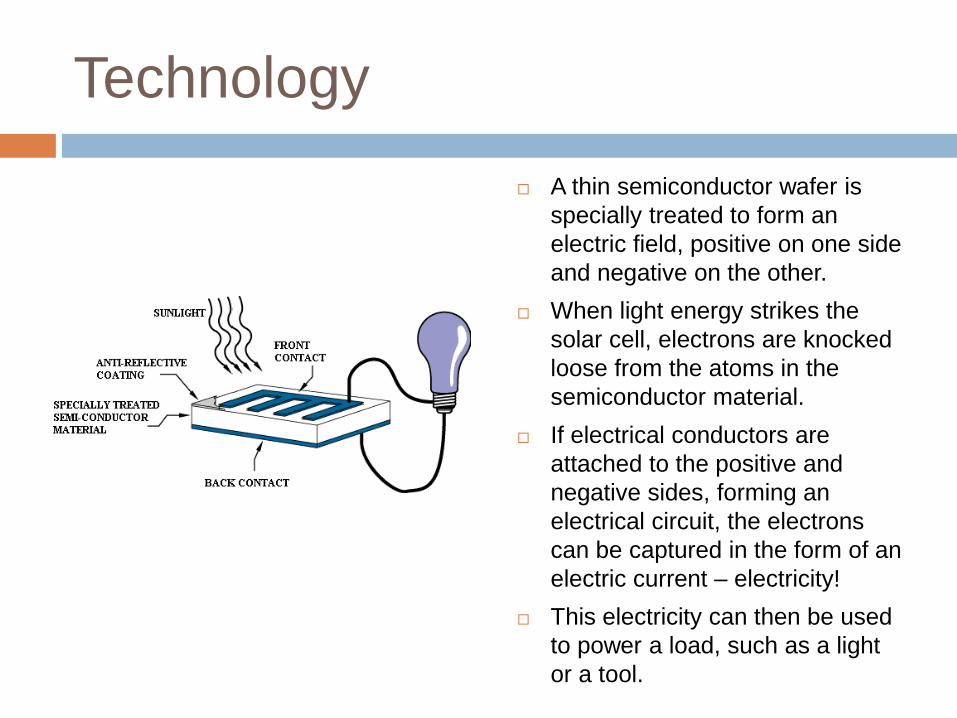
A thin semiconductor wafer is
specially treated to form an
electric field, positive on one side
and negative on the other.
When light energy strikes the
solar cell, electrons are knocked
loose from the atoms in the
semiconductor material.
If electrical conductors are
attached to the positive and
negative sides, forming an
electrical circuit, the electrons
can be captured in the form of an
electric current – electricity!
This electricity can then be used
to power a load, such as a light
or a tool.

Technology
PV cells need to establish an electric
field with opposite poles to work.
To create the field, manufacturers
"dope" silicon with other materials,
giving each slice of the sandwich a
positive or negative electrical charge.
Manufacturers seed phosphorous
into the top layer of silicon - adding
extra electrons (a negative charge) to
that layer.
The bottom layer gets a dose of
boron (a positive charge).
This creates the electric field at the
junction between the silicon layers.
Then, when a photon knocks an
electron free, the electric field will
push that electron out of the silicon
junction.
Technology
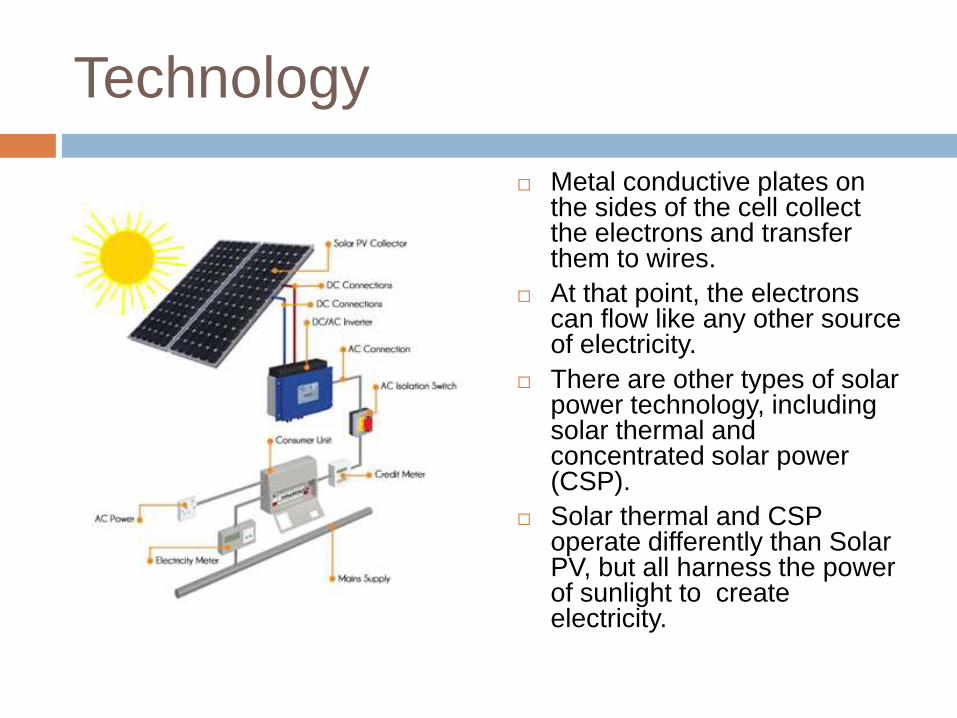
Metal conductive plates on the sides of the cell collect the electrons and transfer them to wires.
At that point, the electrons can flow like any other source of electricity.
There are other types of solar power technology, including solar thermal and concentrated solar power (CSP).
Solar thermal and CSP operate differently than Solar PV, but all harness the power of sunlight to create electricity.
Technology
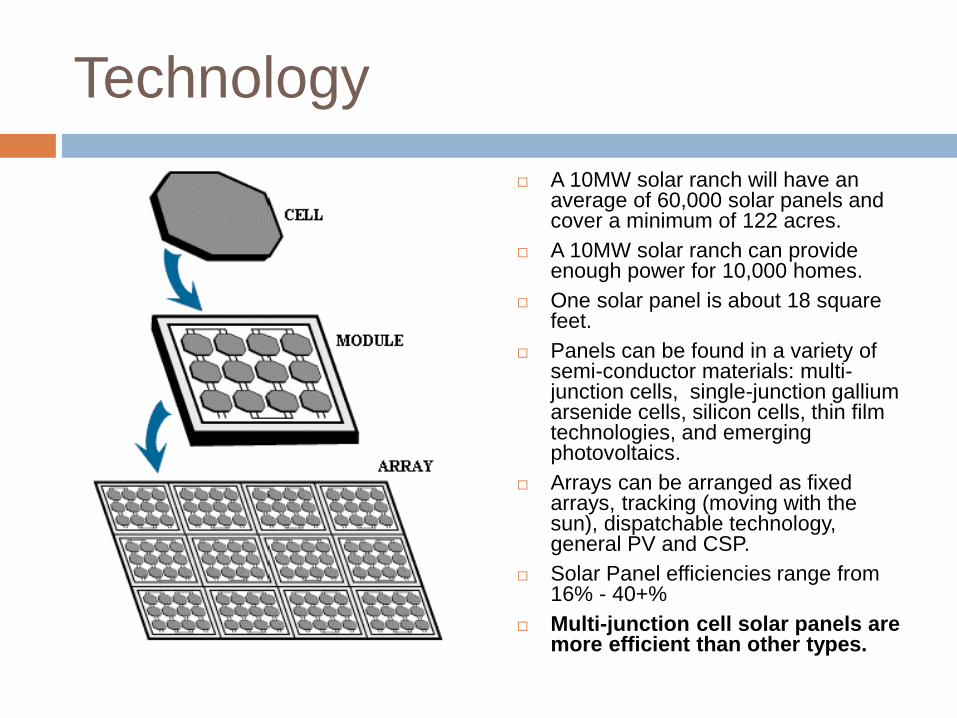
A 10MW solar ranch will have an average of 60,000 solar panels and cover a minimum of 122 acres.
A 10MW solar ranch can provide enough power for 10,000 homes.
One solar panel is about 18 square feet.
Panels can be found in a variety of semi-conductor materials: multi-junction cells, single-junction gallium arsenide cells, silicon cells, thin film technologies, and emerging photovoltaics.
Arrays can be arranged as fixed arrays, tracking (moving with the sun), dispatchable technology, general PV and CSP.
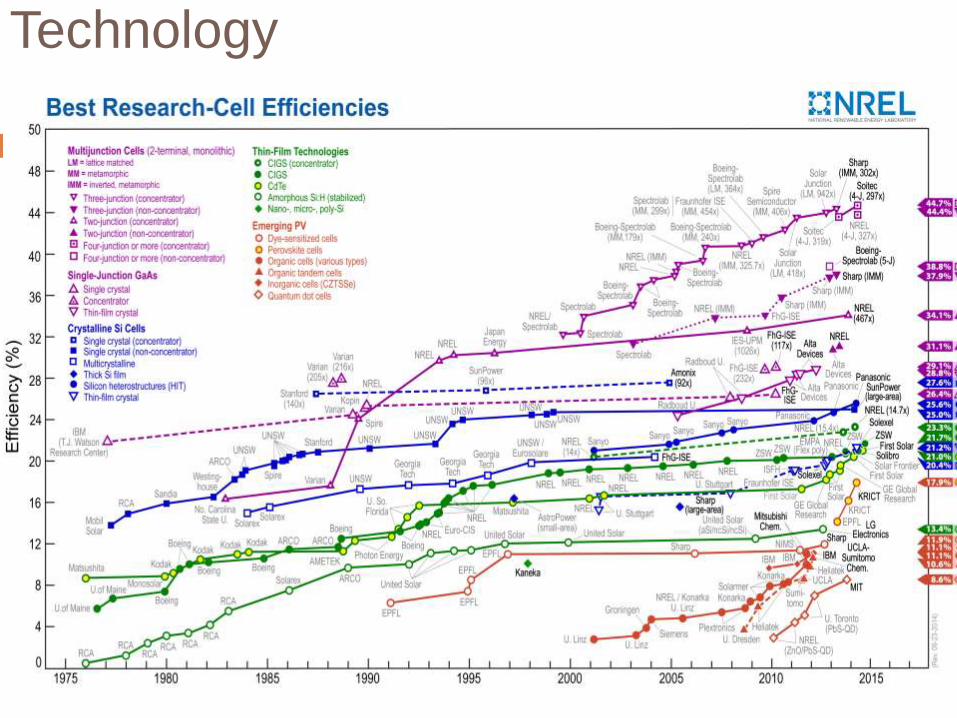
Solar Panel efficiencies range from 16% - 40+%
Multi-junction cell solar panels are more efficient than other types.
Technology
Technology
PV cell technologies are usually classified into three generations, depending on the basic material used and the level of commercial maturity.
First-generation PV systems (fully commercial) use the wafer-based crystalline silicon (c-Si) technology, either single crystalline (sc-Si) or multi-crystalline (mc-Si)
Second-generation PV systems (early market deployment) are based on thin-film PV technologies and generally include three main families: 1) amorphous (a-Si) and micromorphsilicon (a-Si/μc-Si); 2) Cadmium-Telluride (CdTe); and 3) Copper-Indium-Selenide (CIS) and Copper-Indium-Gallium-Diselenide (CIGS)
Third-generation PV systems are technologies and concepts that are still under development and are not yet widely commercialized. These technologies include concentrating PV (CPV and CSP) and organic PV cells.
Technology
Recycling Solar PV Panels:
PV modules glass, aluminum and
semiconductor materials that can be
successfully recovered and reused.
Recycling programs by First Solar, Solar World
and other companies of thin-film and silicon
modules is already taking place.

Technology
Solar PV Panel Recycling Process:
Modules are shredded, then crushed into pieces smaller than 5 mm
Semiconductor films are removed using a weak sulphuric acid and hydrogen peroxide leaching process.
Glass is separated from the liquids in a classifier.
A vibrating screen separates the glass from the ethylene vinyl acetate (EVA) pieces. The EVA is deposited onto a conveyor and collected, the glass falls through the screen into a chute where it is then rinsed.
Technology
Solar PV Panel Recycling Process (Cont.)
The glass is deposited into containers for recycling, the rinse waters are pumped to a precipitation system for metal recovery.
The metal compounds are precipitated in three stages at increasing pH using sodium hydroxide.
Precipitated solids are made into a metal rich filter cake and sent off for testing by a third party.
Metals can be utilized again for use as raw materials in new solar modules.
The process can recover 90% of the glass for use in new products and 95% of the semiconductor materials for use in new solar modules.

Availability
PV Solar availability can be found largely in the south-western to the
south-mid-western regions of the U.S
Availability
In 2013 there are many installed large
photovoltaic plants operating across the
United States, totaling more than 3000 MW.
In 2013, more than 26,000 MW of utility-scale
solar power projects were under development
in the U.S. - enough to power 4.3 million
households.

Potential
Utility Scale Solar PV projects already constructed (Yellow) and in
progress/construction (Blue)
Potential

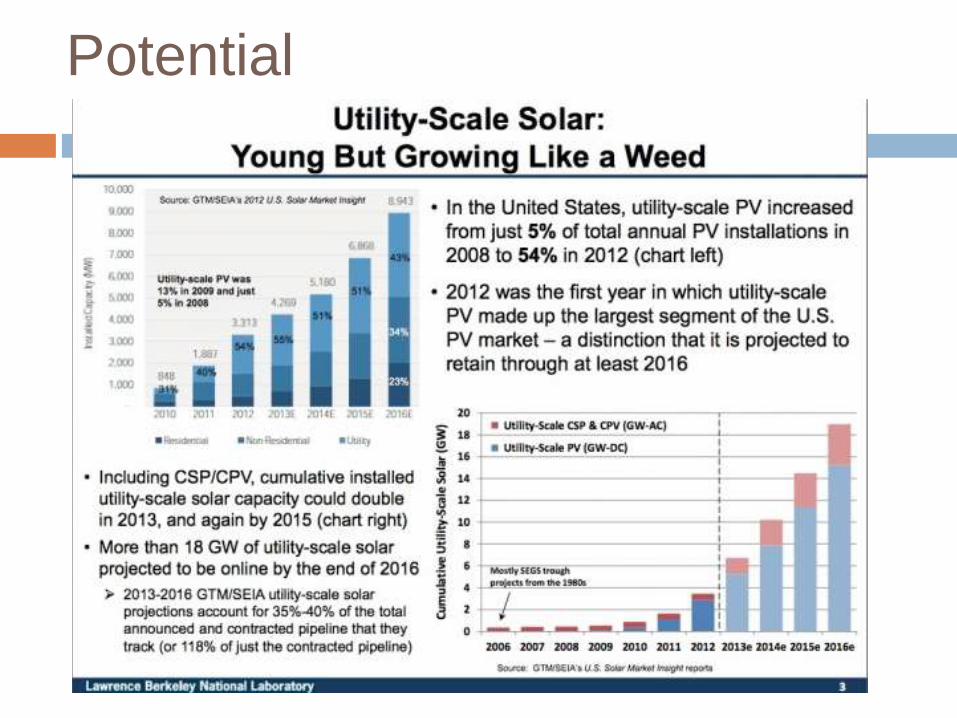
Potential
In the US, in 2008 utility-scale PV increased
from 5% of total annual PV installations to 54%
in 2012.
More than 3GW of utility-scale solar was
installed in the U.S. by 2012.
GTM Research and the Solar Energy
Industries Association projects that more than
18 GW of utility-scale solar will be installed by
the end of 2016 in the United States.
Potential
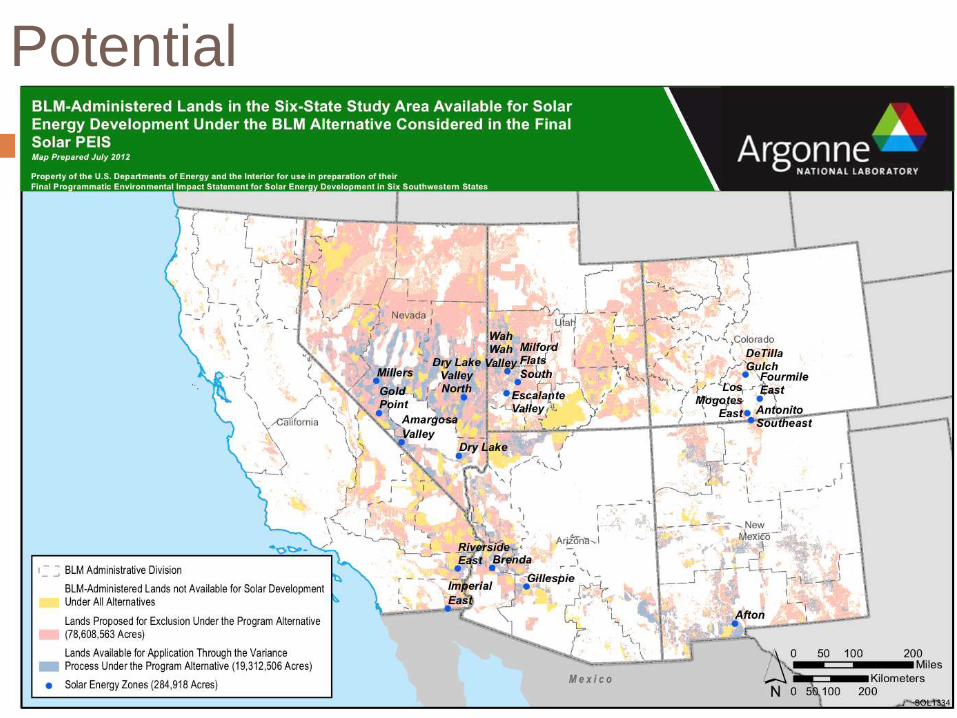
The U.S. Department of Interior has signed the
Programmic Environmental Impact Statement (PEIS) for
the development of solar on 285,000 acres of public
lands in the southwest.
The PEIS is 17 solar energy zones on public lands in six
states – Arizona, California, Colorado, Nevada, New
Mexico and Utah
These 17 solar zones have been identified as priority
areas for utility-scale solar development.
PEIS directs the development of utility-scale solar
projects to designated solar zones with an emphasis on
lower environmental impact and high clean energy
production. The PEIS will also enhance the U.S’s energy
security.

Potential
The PEIS’s goal is to permit 10GWs of renewable energy projects on public lands by 2012, develop, construct, increase and diversify domestic energy supply, deliver clean energy and create jobs.
The PEIS program is designed to be flexible so that additional solar development can be approved in 'variance' areas outside of the zones if they are needed.
However, the 17 priority zones are expected to produce an estimated 5.9 GW of energy - enough to power 1.8 million homes. If the variance zones are also developed, an estimated 23.7 GW of energy can be produced - enough power for seven million homes
Potential

Potential
Site considerations are based upon the use of and/or
the remediation of potentially contaminated sites,
brownfields, and underutilized spaces on public lands in
Arizona, California, Colorado, Nevada, New Mexico and
Utah.
Definitions for potentially contaminated sites,
brownfields and underutilized spaces are:
Potentially Contaminated Site: sites where
contamination is suspected but has not been confirmed
and sites where contamination has been identified.
Potential
Brownfield: a site that may have been contamination. With certain legal exclusions and additions, the term "brownfield site" means real property. If expanded, redeveloped, or reused, may be complicated by the presence or potential presence of a hazardous substance, pollutant, or contaminant.
Underutilized Spaces: sites that are currently inactive and can be leveraged for additional benefit, ie - abandoned parcels, parking lots, or commercial/industrial rooftops.
Potential
Some example site consideration questions are:
Is the site a landfill? If so, can solar ranch installation serve as a landfill cap and site remediation?
Is the site abandoned? Available for lease and development? Is the usable acreage for solar at site currently underutilized, inactive, or undisturbed?
Are the solar installations compatible with a site’s long-term monitoring and maintenance plan, including leachate and gas collection systems, erosion control and storm water

Potential
Do cleanup costs to redevelop site for solar
reuse meet all eligibility criteria?
Can the design and construction of the PV
system be created in parallel with
development and implementation of remedy?
Will the PV system compromise remediation
solution in place during construction or
operation phase?
Will zoning or other institutional controls limit
redevelopment for renewable energy?
Potential
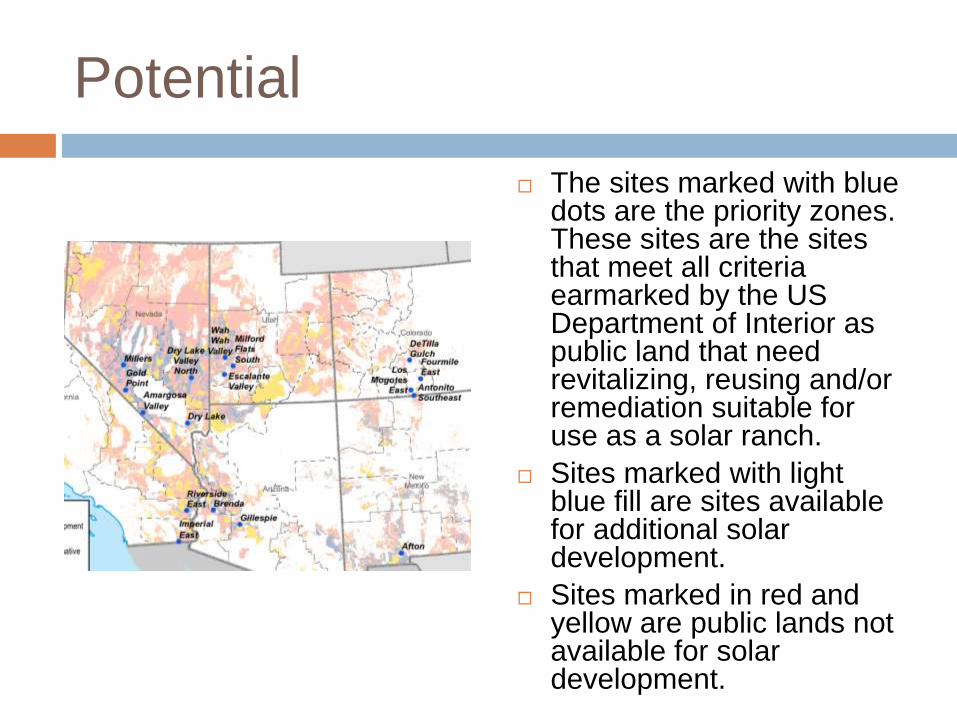
The sites marked with blue dots are the priority zones. These sites are the sites that meet all criteria earmarked by the US Department of Interior as public land that need revitalizing, reusing and/or remediation suitable for use as a solar ranch.
Sites marked with light blue fill are sites available for additional solar development.
Sites marked in red and yellow are public lands not available for solar development.
Potential
O&M Costs: O&M costs appear to be in the neighborhood of $20-$40/kWAC-year, or $10-$20/MWh.
Installation costs are down.
Cost declines are in every sector of the supply chain due to PV panel prices.
Installed project prices have fallen by nearly one-third since the 2007-2009 from $5.6/W to $3.9/W in 2012.
PNM, New Mexico's largest utility, recently filed for regulatory approval of 23 MW of thin-film PV projects to be built in 2014 at a contracted price of $2.03/W, compared to $2.29/W for 20 MW of PV currently under construction in 2013 and $4.15/W for 22.5 MW built in 2011.
Potential
Potential
Utility Scale Solar has become particularly
competitive due its energy production delivery
pricing advantage over wind (currently roughly
US$25/MWh in California)
Power purchase agreements (PPAs) have
dramatically declined, falling by US$25/MWh per
year on average.
Some of the most-recent PPAs in the western US
have seen extremely aggressive PPA prices at
US$50-60/MWh (in 2012 dollars), competitive with
wind power projects in that region.

Potential

Potential
As Utility Scale Solar PV continues to rise in
growth, the net peak load of solar generation
will shift later into the afternoon and evening
hours when the sun is not as strong.
As that happens, PV's midday peaking profile
will decrease in value. This is when storage
or improved battery technology will
become essential.
Potential
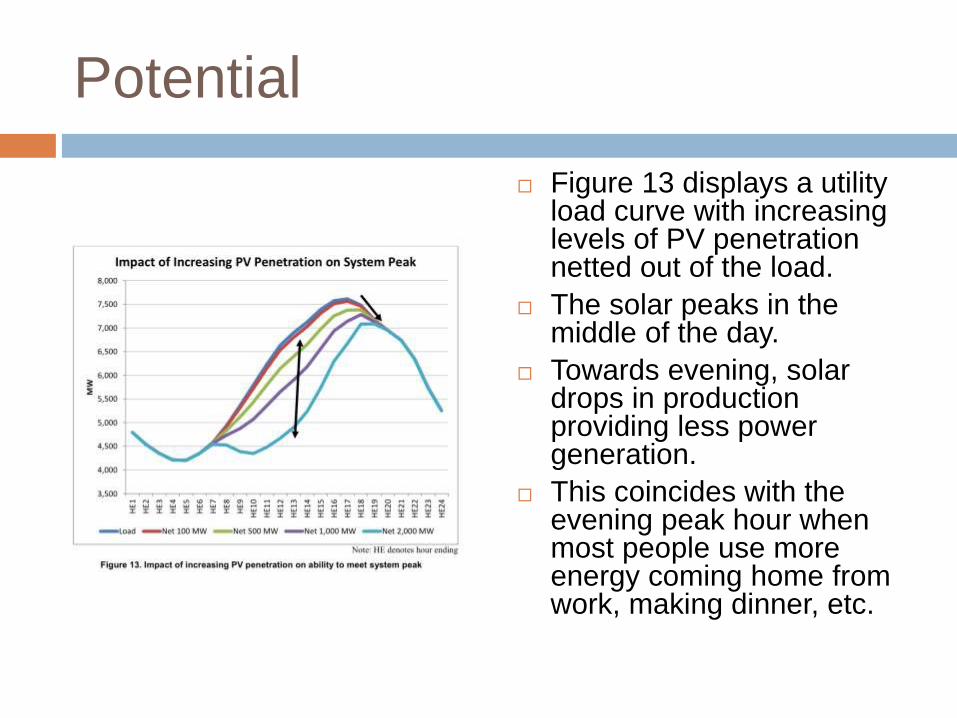
Figure 13 displays a utility load curve with increasing levels of PV penetration netted out of the load.
The solar peaks in the middle of the day.
Towards evening, solar drops in production providing less power generation.
This coincides with the evening peak hour when most people use more energy coming home from work, making dinner, etc.
Considerations
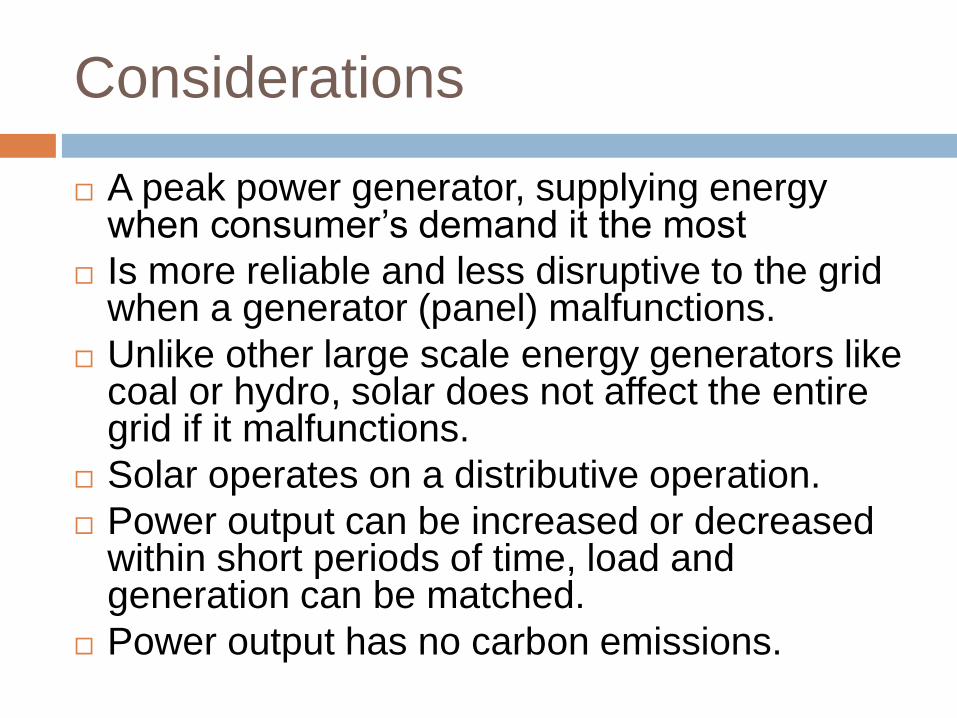
A peak power generator, supplying energy when consumer’s demand it the most
Is more reliable and less disruptive to the grid when a generator (panel) malfunctions.
Unlike other large scale energy generators like coal or hydro, solar does not affect the entire grid if it malfunctions.
Solar operates on a distributive operation.
Power output can be increased or decreased within short periods of time, load and generation can be matched.
Power output has no carbon emissions.
Considerations
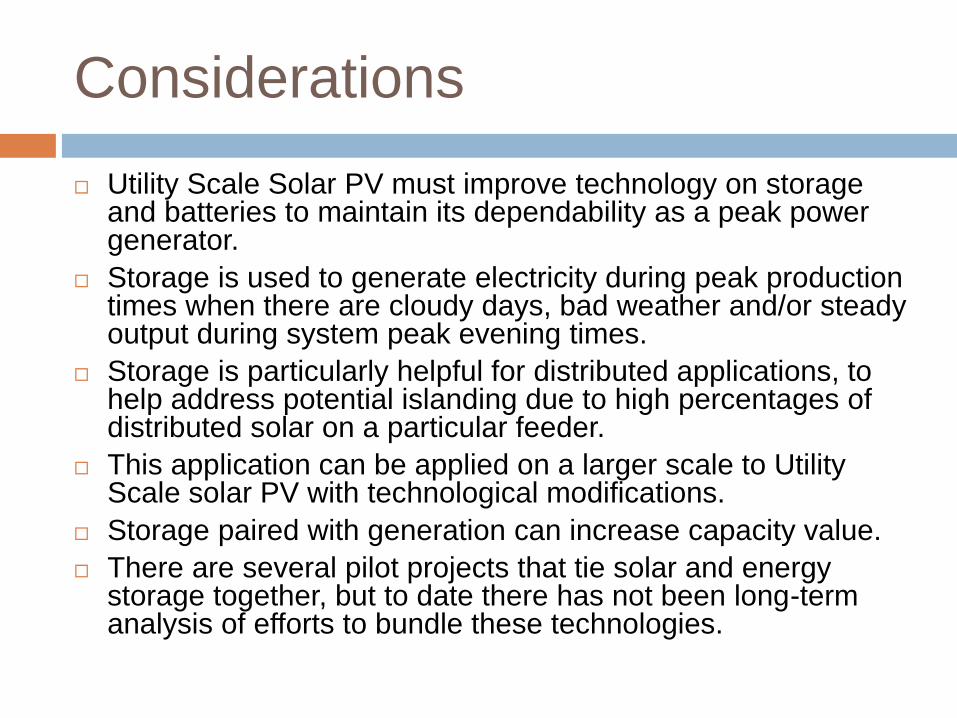
Utility Scale Solar PV must improve technology on storage and batteries to maintain its dependability as a peak power generator.
Storage is used to generate electricity during peak production times when there are cloudy days, bad weather and/or steady output during system peak evening times.
Storage is particularly helpful for distributed applications, to help address potential islanding due to high percentages of distributed solar on a particular feeder.
This application can be applied on a larger scale to Utility Scale solar PV with technological modifications.
Storage paired with generation can increase capacity value.
There are several pilot projects that tie solar and energy storage together, but to date there has not been long-term analysis of efforts to bundle these technologies.

Considerations
Facilities are less environmentally impacting than fossil fuel energy facilities.
They are more efficient, with less line losses.
Construction of solar facilities on large areas of land requires clearing and grading.
Engineering methods can be used to mitigate the environmental impacts of of soil compaction, alteration of drainage channels, increased runoff and erosion.
Clearing and grading facility sites also result in a loss of habitat and interfere with rainfall and drainage.
Facility sites could further impact endangered, rare or threatened species.
Considerations
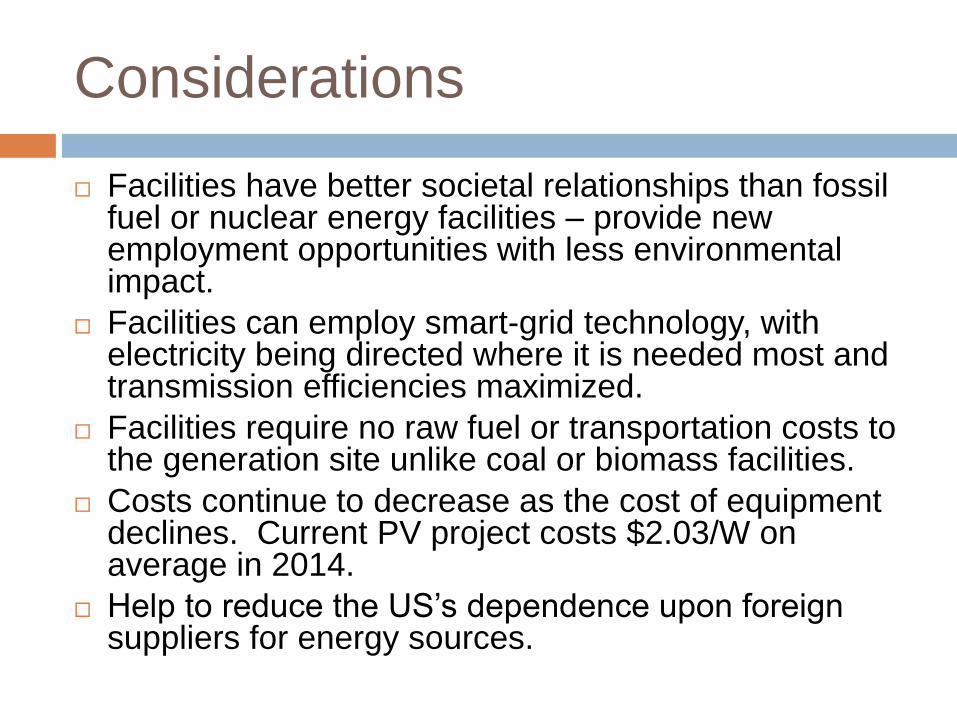
Facilities have better societal relationships than fossil fuel or nuclear energy facilities – provide new employment opportunities with less environmental impact.
Facilities can employ smart-grid technology, with electricity being directed where it is needed most and transmission efficiencies maximized.
Facilities require no raw fuel or transportation costs to the generation site unlike coal or biomass facilities.
Costs continue to decrease as the cost of equipment declines. Current PV project costs $2.03/W on average in 2014.
Help to reduce the US’s dependence upon foreign suppliers for energy sources.
Risks
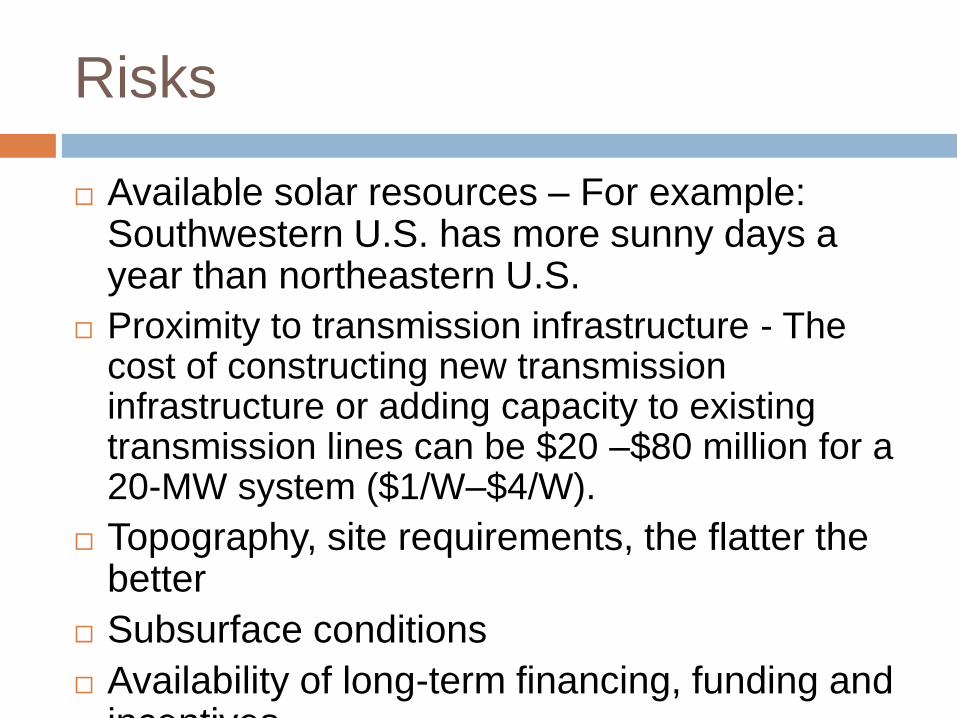
Available solar resources – For example: Southwestern U.S. has more sunny days a year than northeastern U.S.
Proximity to transmission infrastructure - The cost of constructing new transmission infrastructure or adding capacity to existing transmission lines can be $20 –$80 million for a 20-MW system ($1/W–$4/W).
Topography, site requirements, the flatter the better
Subsurface conditions
Availability of long-term financing, funding and incentives

Barriers
Permit fees and delays, ie facility siting, regulations, NIMBY, etc
Size - a continuous tract of suitable land can be difficult to acquire. Oddly shaped parcels of land can increase construction costs.
Solar facilities may interfere with existing land uses, such as grazing, military uses, and minerals production.
Solar facilities could impact the use of wilderness areas (recreation management areas, etc). Proper siting decisions must be followed to avoid land disturbance and land use impacts.
Storage has high costs, unknown valuation associated with its usage.
Availability of water for construction - any increase in water demand can strain available water resources. Use of/spills of chemicals at solar facilities (dust suppressants, dielectric fluids, herbicides, etc) could result in contamination of surface or groundwater.
Community acceptance of the facility - Communities that

Business Case Study: First
Solar, Inc. First Solar is a leading global developer of
comprehensive PV solar energy solutions.
They have installed over 8 GW mostly in utility scale PV projects. These projects are connected to electric grids and infrastructures worldwide, meeting growing energy needs and reducing fossil fuel consumption.
Their solar solutions have diversified the energy portfolio and reduced the risk of fuel-price volatility.
They have delivered a levelized cost of electricity (LCOE) that is becoming cost competitive with fossil fuels.
First Solar specializes in integrating technologies for entire solar value chain which maximizes the value of the investment while minimizing the risk for the customer.
Business Case Study: First Solar,
Inc.
First Solar offers to their customers:
Grid Integration
Plant design & Engineering
Project Development
Project Financing
Advanced PV Modules
Balance of System Technologies
A variety of Mounting Systems
Procurement & Construction Management
Operations & Maintenance
Recycling Services
Business Case Study: First
Solar, Inc.
First Solar offers structured energy products, system solutions and component technologies for Utility Scale solar facilities projects.
Structured Energy Products: First Solar develops utility scale projects, they provide a full range of capabilities to include the delivery of structured energy products that are cost competitive in the marketplace today. They have converted more PPA’s to energy than anyone else in the solar industry. They are trusted by investors, are backed by their technologies, capabilities and expertise across the entire solar value chain.

Business Case Study: First
Solar, Inc.
System Solutions: First Solar can deliver predictable PV
energy solutions that increase energy yield, reduce the
LCOE and provide stable grid integration, which results
in system solutions that maximize value and minimize risk
for our customers.
Component Technologies: First Solar leverages their
experience of engineering, constructing, and operating
utility-scale PV plants to streamline grid integration,
construction, and operations and maintenance (O&M).
Project specific factors such as the local irradiance,
weather, soil, wind, and topography will dictate the optimal
mounting solution for each project. With a single-axis
tracker technology and multiple fixed mounting solutions to
choose from, First Solar offers a variety of mounting
systems to maximize energy output, increase installation

Business Case Study: First
Solar, Inc.
First Solar provides a LCOE of between $0.07-0.15/kWh, depending on irradiance
levels, interest rates, and other factors such as development costs.
LCOE is the total cost of ownership over the plant’s life and includes factors such
as development, financing, maintenance costs and the cost of the power plant.

Business Case Study: First
Solar, Inc.
The map displays most of First Solar’s 8 GW projects across the world. First
Solar has developed, financed, engineered, constructed and is operating these
grid-connected PV power facilities

Business Case Study: First
Solar, Inc. Two examples of their many projects are:
Agua Caliente Solar Project – Arizona, U.S., the largest operational PV power plant in the world, generating 250 –290 MW for 100,000 homes. Displaces 220,000 tons of CO2annually -equivalent to taking 40,000 cars off the road. Lowest environmental impact of any PV technology, No water used for electricity generation. 5.2 million ground mounted modules developed by First Solar Inc., owned by NRG Energy, Mid American Renewables, LLC. with a PPA to Pacific Gas & Electric.
Topaz Solar Farm – San Luis Obispo, CA, will be the largest PV solar farm once it completes construction. Projected to generate 550 MW to 160,000 homes. Will displace 377,000 tons of CO2 annually – equivalent to taking 73,000 cars off the road. Lowest environmental impact of any PV technology, No water used for electricity generation. 9 million ground mounted modules developed by First Solar Inc., owned Mid American Solar with a PPA to Pacific Gas & Electric.

Business Case Study: First
Solar, Inc. Company History
1999 – 2013 First Solar was the 1st solar company to produce 1 GW in a single year, break the $1/W cost barrier, and implement a global PV module recycling program.
First Solar has world records for CdTe thin film solar module (17%) and cell (21%) efficiency [21% in 2014!]
Known for their Scaled Advanced Thin Film Module Technology
Developed world’s largest contracted solar project pipeline – which provides more than 3GW
Facilitated the financing for ~2GW (representing ~$9 billion)
Business Case Study: First
Solar, Inc. Company History (Cont.)
Developed advanced grid integration, plant control, forecasting, and energy scheduling capabilities
Currently operate more than 2GW (DC) with fleet system availability of over 99%
Integrated utility-scale solar into the global energy mix
Reducing fuel consumption and costs with PV/diesel hybrid system solutions
Delivering off-grid and energy access solutions to underserved energy markets
Providing solutions for restricted spaces and distributed solar generation
Business Case Study: First
Solar, Inc.
Improving Efficiency
First Solar’s R&D efforts are focused upon reducing cost, increasing efficiency, and strengthening solar’s position in the global energy generation portfolio.
Improving Overall Performance
First Solar’s R&D efforts have provided significant technological improvements throughout the solar value chain system to improve overall plant performance.
First Solar continues to introducing new innovative products and solutions into the global energy mix.
Business Case Study: First
Solar, Inc.
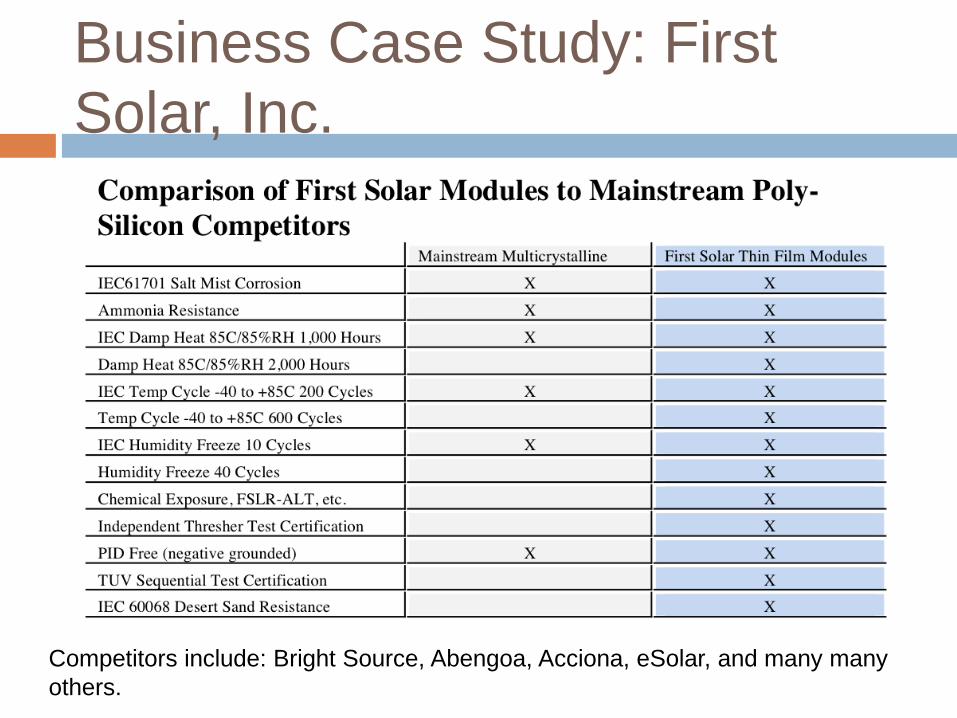
Competitors include: Bright Source, Abengoa, Acciona, eSolar, and many many
others.
Business Case Study: First
Solar, Inc. First Solar works well with all entities (government, regulatory
bodies, investors, utility companies, etc) to get their projects developed, constructed and operational.
First Solar continues to be innovative with their technologies and their company, they are not resting upon their laurels. They have running goals to continue to improve module technologies, etc.
First Solar is focused upon improving industry-leading energy densities, while simultaneously improving manufacturing metrics. Competitors are using increasingly costly materials and cell processes in order to deliver moderate performance gains for the same size facilities.
They understand that utility scale solar PV faces storage solution, NIMBY, space requirements, investment and technological issues.
Their company has expertise on all of these areas and they leverage it while continuing to push the onward progress of Utility Scale solar PV forward at the same time.

Business Case Study: First
Solar, Inc. Short Term Obstacles to First Solar:
Drop in demand for solar panels due to oversupply in the market
Long Term Obstacles to First Solar:
The use of cadmium telluride in production processes could hinder its production costs, as cadmium telluride is a highly toxic compound = limitations and barriers.
The development of more efficient, cheaper substitutes by competitors for First Solar’s low efficiency panels.
Disappearance of government subsidies and incentives. If these are taken away, First Solar’ssales can suffer.

Business Case Study: First
Solar, Inc.
To prepare for both short term & long term obstacles, First Solar needs to consider the following:
Continue to invest in R&D.
Continue to invest in quality human capital (attract and retain).
Know when to transition to a new technology.
Continue to invest in a relationship with an inverter developer to reduce installation costs for customers.
Continue to invest in relationships with government and regulatory entities.
Questions?

References
Beetz, Becky & Kaftan, Cheryl. (2012 October 15). US: Salazar signs final PEIS for solar development on public lands. PV Magazine. Retrieved from http://www.pv-magazine.com/news/details/beitrag/us--salazar-signs-final-peis-for-solar-development-on-public-lands_100008840/#axzz3FypBbCho
Bolinger, Mark & Weaver, Samantha. (2013 September). Utility-Scale solar 2012: An empirical analysis of project cost, performance, and pricing trends in the U.S. [PDF]. Retrieved from http://emp.lbl.gov/sites/all/files/lbnl-6408e_0.pdf
Carus, Felicity. (2013 November 26). We need to talk about utility scale solar. PV Tech.org. Retrieved from http://www.pv-tech.org/editors_blog/we_need_to_talk_about_utility_scale_solar
First Solar. (n.d.). About us. Retrieved from http://www.firstsolar.com/
International Energy Agency Photovoltaic Power Systems Programme (IEA-PVPS). (2014). PVPS Report Snapshot of Global PV 1992-2013. [PDF]. Retrieved from http://www.iea-pvps.org/fileadmin/dam/public/report/statistics/PVPS_report_-_A_Snapshot_of_Global_PV_-_1992-2013_-_final_3.pdf
International Renewable Energy Agency. (2012 June). Renewable energy technologies: Cost analysis series – Solar photovoltaics. Volume 1: Power Sector (Issue 4/5). [PDF]. Retrieved from http://www.irena.org/DocumentDownloads/Publications/RE_Technologies_Cost_Analysis-SOLAR_PV.pdf
Knier, Gil. (2002). How do photovoltaics work? Retrieved from http://science.nasa.gov/science-news/science-at-nasa/2002/solarcells/
References
Kunerth, Volkmar. (2010, October 7). Solar PV market: Germany versus USA. [Slides]. Retrieved from http://www.slideshare.net/kunerth/solar-utility-scale-presentation-1
MacCready, Paul. (2003 February). TEDTalk: A flight on solar wings. [Video File]. Retrieved from http://www.ted.com/talks/paul_maccready_flies_on_solar_wings?language=en
MacKay, David. (2012 March). TEDTalk: A reality check on renewables. [Video File]. Retrieved from https://www.ted.com/talks/david_mackay_a_reality_check_on_renewables#t-19396
National Renewable Energy Laboratory. (2009). Photovoltaic solar resource of the United States. [Image]. Retrieved from http://www.nrel.gov/gis/solar.html
National Renewable Energy Laboratory. (2012 February). Residential, commercial, and utility-scale photovoltaic (PV) system prices in the United States: Current drivers and cost-reduction opportunities. [PDF]. Retrieved from http://www.nrel.gov/docs/fy12osti/53347.pdf
National Renewable Energy Laboratory. (2012 April). Utility-scale concentrating solar power and photovoltaics projects: A technology and market overview. [PDF]. Retrieved from http://www.nrel.gov/docs/fy12osti/51137.pdf
National Renewable Energy Laboratory. (2013). The falling price of utility-scale solar photovoltaic (PV) projects. [Image]. Retrieved from http://energy.gov/maps/falling-price-utility-scale-solar-photovoltaic-pv-projects
References
Old Dominion Innovations. (2014 March 21). How does a solar panel work? Retrieved from http://olddominioninnovations.com/how-does-a-solar-panel-work/
Perez, R., Zweibel, K., and Hoff, T. (2011). Solar power generation in the US: Too expensive or a bargain? [PDF]. Retrieved from http://solar.gwu.edu/resources/solar-power-generation-us-too-expensive-or-bargain
REN21. (2009). Renewables global status report. [PDF]. Retrieved from http://www.unep.fr/shared/docs/publications/RE_GSR_2009_Update.pdf
REN21. (2013). Renewables global status report. [PDF]. Retrieved from http://www.ren21.net/portals/0/documents/resources/gsr/2013/gsr2013_lowres.pdf
SEIA. (n.d.). Photo Gallery. Retrieved from http://www.seia.org/research-resources/solar-means-business-2013-photo-gallery
Sterling, J., McLaren, J., Taylor, M. and Cory, K. (2013 October). Treatment of solar generation in electric utility resource planning. [PDF]. National Renewable Energy Laboratory. Retrieved from http://www.nrel.gov/docs/fy14osti/60047.pdf
U.S. Energy Information Administration. (2013 November 14). 2013 Completions of large solar thermal power plants mark technology gains. Retrieved from http://www.eia.gov/todayinenergy/detail.cfm?id=13791#tabs_SpotPriceSlider-1
World Watch Institute. (2006). American energy. Retrieved from http://www.worldwatch.org/files/pdf/AmericanEnergy.pdf