holt wealth creation principles -...
TRANSCRIPT

HOLT Wealth Creation Principles Introducing HOLT Economic Profit 0F1*June 2015 Executive Summary
The usual approach to valuing a firm is to calculate the present value (PV) of its future free cash flows. An alternative approach is to calculate the PV of its economic profits (EP). This report introduces the new HOLT Economic Profit framework and will serve as a chapter in an upcoming textbook on advances in the HOLT CFROI® framework. Economic Profit represents the economic earnings of the firm. EP is proportional to the spread between a company’s return on capital and cost of capital. If a firm earns its cost of capital, EP is zero. Growth based on investments that are below their cost of capital destroys shareholder value, and these projects should be rejected. Investment into positive spread projects creates shareholder value and should be encouraged. This report demonstrates how EP is calculated and can be used. This approach applies all the advantages of the HOLT framework to the measurement of economic profit: asset mix, project life, inflation and accounting distortions are handled identically, making HOLT EP a superior economic measure. By splitting EP into operating and acquisition goodwill components, absolute value creation can be assessed. Insights can be gained from analyzing change in EP, which can be decomposed into three parts: change in economic spread, growth and change in goodwill. Amazon is an excellent example of a firm whose increase in EP due to growth has more than compensated the loss in EP due to decreasing CFROI. Amazon is employed as an example throughout the report. Corporate boards and investors should insist on positive change in EP. A brief case study on Danaher illustrates how EP and change in EP can be used to analyze an acquisitive company. The introduction is rigorous. If you wish to get straight to the point, you can begin with the Danaher case study. Links are available in the report to jump to sections of most interest.
CFROI as a Ratio ............................................................................................ 3
Economic ROI calculation .......................................................................... 4
HOLT Economic Profit .................................................................................... 6
Using Economic Profit to measure the value of acquisitions ....................... 10
Decomposing value creation into Delta EP components ............................ 11
Case Study: Danaher Corporation .................................................................. 15
1 Revised June 15, 2015
David A. Holland Senior Advisor [email protected] Bryant Matthews Director, HOLT [email protected] 1-312-345-6187

2
Introduction The usual approach to valuing a firm is to calculate the present value of its future free cash flows to the firm’s capital providers (FCFF). A highly informative alternative is to calculate the present value of the firm’s economic profits. Although technically correct, the FCFF method has nothing to say about the quality of the cash flow. Is a high level of free cash flow a good or bad thing? The answer depends on whether the company is forsaking value creating opportunities to report higher cash flow. A company should invest its capital and available cash flow in projects that exceed their cost of capital. If value creating opportunities are unavailable, the firm should maximize cash flow and return it to shareholders via dividends or share buybacks.1F
2 As a general rule of thumb, free cash flow will be negative when asset growth is greater than the return on capital.
Cash flow rules: if g > CFROI then FCFF < 0 Value-destroying firms often make the mistake of expanding their operations to report earnings growth. They think Wall Street wants earnings growth at all cost. This misunderstanding can lead to expensive corporate mistakes. Earnings is an accounting value and cash flow is an economic one. These profitability measures are frequently conflated. It is the quality of earnings that should inform a firm’s growth strategy.
Cash from Operations Growth Option Decision
If CFROI > g, then FCFF > 0 Are projects available that exceed their cost of capital?
Yes – invest cash flow and raise additional capital if necessary. No – return the cash flow to capital providers.
If CFROI < g, then FCFF < 0 Are projects available that exceed their cost of capital?
Yes – raise additional capital No – don’t grow and consider downsizing if the firm is destroying value.
The quickest way to generate cash flow is to stop growing. The decision table indicates that this is sub-optimal if a firm has projects available which exceed the cost of capital. This choke-growth turnaround rule is only warranted for value destroyers, whose return on capital isn’t meeting the cost of capital. For them, it is wise to remember humorist Will Rogers’ adage on the first law of holes: if you find yourself in a hole, stop digging. On the flipside, potential value creation is squandered when CFOs don’t do their job of investing available cash flow and raising capital to finance projects expected to beat their cost of capital. Negative cash flow is acceptable as long as project returns are expected to exceed their cost of capital and generate positive Net Present Value (NPV) for the firm. To do otherwise is to leave money on the table. Rational shareholders prefer more value to less and the aim of the firm is to create
2 Investors prefer the most value-enhancing and tax-efficient method of cash distribution. For example, share buybacks are preferable if the company’s shares are trading at a discount to their intrinsic value. Firms loaded with dangerous levels of debt might instead use cash flow to pay down debt so that distressed investors can sleep easier at night. See Michael J. Mauboussin, and Dan Callahan. “Disbursing Cash to Shareholders: Frequently Asked Questions about Buybacks and Dividends”, Credit Suisse Global Financial Strategies, May 2014.
Rational shareholders prefer more value to less and the aim of the firm is to create the greatest possible NPV from its portfolio of present and future investments. Accounting earnings should never be confused with economic value.
3
the greatest possible NPV from its portfolio of present and future investments.2F
3 Accounting earnings should never be confused with economic value. Can the concept of value creation be communicated more comprehensively? All capital providers expect compensation. There is a charge on debt which appears on the income statement as interest expense. Operating profit has to cover interest charges and debt-equivalent charges such as operating lease expenses. If not, net income will be negative. But what about equity? There is no charge for equity on the income statement, so it appears to have no cost to the untrained eye. Economists know that there is an opportunity cost for providing equity, which should reflect the investment’s riskiness. A residual income would subtract a charge on the equity at the opportunity cost of equity from net income. The residual income is an economic profit, which differs profoundly in concept and absolute value from accounting profit. The equity charge is simply the cost of equity multiplied by the equity. The more equity required to support earnings, the greater the economic charge and lower the residual income. When analyzing the operating performance and value of industrial and service companies, it is beneficial to separate the firm’s operating and financing decisions, and to value the firm with respect to all capital providers. Financial structure is a secondary consideration in the capital budgeting process. Of primary concern is the intelligent allocation of capital and resources with the aim that all of the capital provided will create positive NPV. As Weingartner notes, “Capital budgeting represents in some respects the central problem of the firm. The complexity of the problem derives from the fact that any set of actions taken today has consequences at later times, and the opportunities available at later dates are related to decisions being implemented currently.”3F
4 The opportunity cost for the firm’s capital, which is a weighted-average of its cost of equity and debt, is the cost of capital. Value creation can be communicated by calculating economic profit (EP) and discounting future economic profits to their present value. Valuations from the FCFF and EP methods should yield equivalent results for an identical forecast.
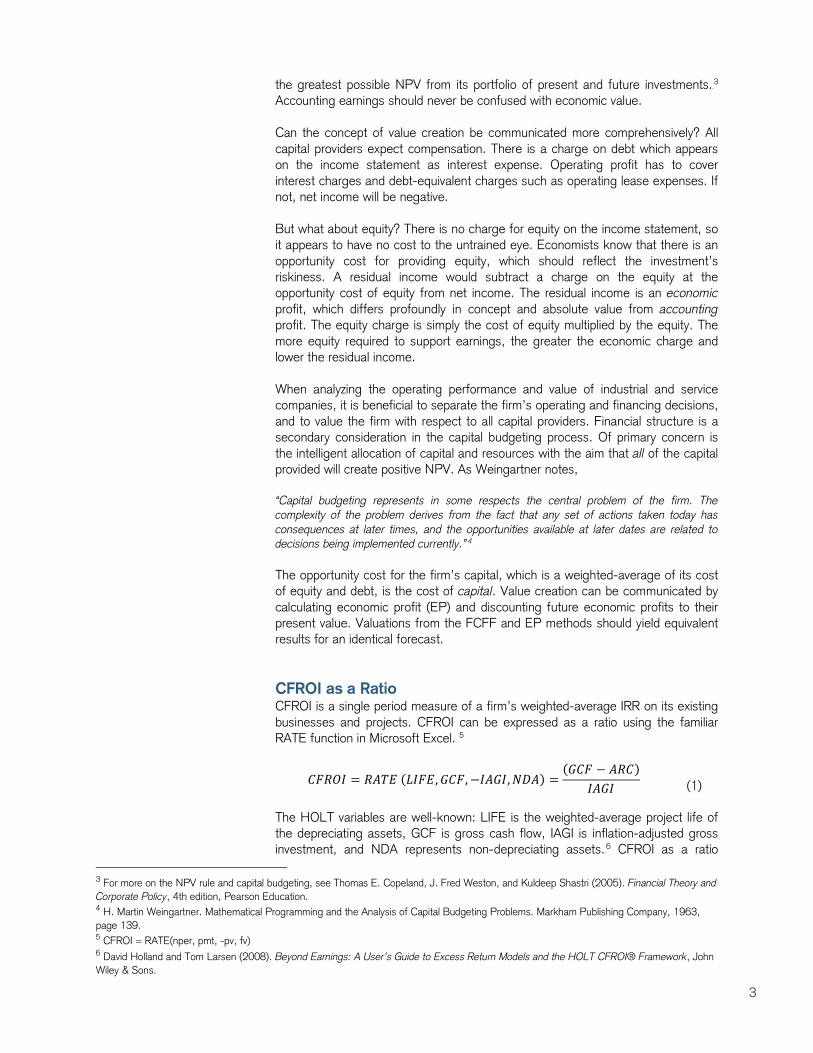
CFROI as a Ratio CFROI is a single period measure of a firm’s weighted-average IRR on its existing businesses and projects. CFROI can be expressed as a ratio using the familiar RATE function in Microsoft Excel. 4F
5
𝐶𝐶𝐶𝐶𝐶 = 𝐶𝑅𝑅𝑅 (𝐿𝐶𝐶𝑅,𝐺𝐶𝐶,−𝐶𝑅𝐺𝐶,𝑁𝑁𝑅) =(𝐺𝐶𝐶 − 𝑅𝐶𝐶)
𝐶𝑅𝐺𝐶
(1)
The HOLT variables are well-known: LIFE is the weighted-average project life of the depreciating assets, GCF is gross cash flow, IAGI is inflation-adjusted gross investment, and NDA represents non-depreciating assets.5F
6 CFROI as a ratio 3 For more on the NPV rule and capital budgeting, see Thomas E. Copeland, J. Fred Weston, and Kuldeep Shastri (2005). Financial Theory and Corporate Policy, 4th edition, Pearson Education. 4 H. Martin Weingartner. Mathematical Programming and the Analysis of Capital Budgeting Problems. Markham Publishing Company, 1963, page 139. 5 CFROI = RATE(nper, pmt, -pv, fv) 6 David Holland and Tom Larsen (2008). Beyond Earnings: A User’s Guide to Excess Return Models and the HOLT CFROI® Framework, John Wiley & Sons.

4
requires the introduction of a depreciation variable, the Asset Recovery Charge (ARC).6F
7
𝑅𝐶𝐶 = 𝑃𝑃𝑅 (RATE, LIFE, 0,−IADA) =𝐶𝑅𝑅𝑅 × 𝐶𝑅𝑁𝑅
[(1 + 𝐶𝑅𝑅𝑅)𝐿𝐿𝐿𝐿 − 1]
(2)
ARC is a depreciation annuity that represents the sinking fund charge of recovering the inflation-adjusted depreciating assets (IADA) over the project life. A lower recovery rate translates into a higher asset recovery charge. A can of worms has now been opened. What is the rate at which the depreciating assets are recovered? In a CFROI ratio calculation, there is an implicit assumption that ARC is recovered at a rate equal to the CFROI. Economists would argue that the sinking fund depreciation should be calculated at the firm’s cost of capital (or discount rate, DR) since by definition it represents the risk-adjusted opportunity cost of the capital provided.
𝑅𝐶𝐶@𝑁𝐶 = 𝑃𝑃𝑅 (DR, LIFE, 0,−IADA) =𝑁𝐶 × 𝐶𝑅𝑁𝑅
[(1 + 𝑁𝐶)𝐿𝐿𝐿𝐿 − 1]
(3)
We have maintained that a project’s NPV and the present value of its economic profits are equal. The calculation of HOLT economic profit is greatly simplified if an adjusted CFROI is defined where ARC is calculated at the firm’s discount rate. To distinguish between traditional IRR and Economic Return on Investment (EROI), in which the asset recovery charge is imputed at the IRR, we introduce Economic Depreciation. Economic Depreciation (ED) equals:
𝑅𝑁 = 𝑃𝑃𝑅 (DR, LIFE, 0,−IADA) =𝑁𝐶 × 𝐶𝑅𝑁𝑅
[(1 + 𝑁𝐶)𝐿𝐿𝐿𝐿 − 1]
(4)
ED is simply ARC calculated at the discount rate.
Economic ROI calculation
𝑅𝐶𝐶𝐶 =(𝐺𝐶𝐶 − 𝑅𝑁)
𝐶𝑅𝐺𝐶
(5)
CFROI and Economic Return on Investment (EROI) are equivalent when CFROI equals the discount rate. They are always equivalent if the asset base is comprised entirely of non-depreciating assets, e.g., net working capital and land. EROI will be less than CFROI when CFROI is greater than the discount rate, i.e., the sinking fund depreciation decreases as CFROI increases. EROI will be greater than CFROI when CFROI is less than the discount rate, i.e., the sinking fund depreciation increases as CFROI decreases. Why is EROI important? Because it is an economic measure aligned with the calculation of EP and NPV. We illustrate its significance by contrasting two mutually exclusive projects. Investment in Project A consists only of non-depreciating assets, e.g., production is outsourced, while the sole investment in Project B is in depreciating assets, e.g., in-house production.
7 David Holland, and Bryant Matthews. “CFROI as a Ratio and its DuPont Identity”, Credit Suisse HOLT, 2014.
Why is Economic ROI important? Because it is an economic measure aligned with the calculation of economic profit and net present value (NPV). For mutually exclusive projects, EROI is: • An economic measure
that takes into account risk-adjusted value
• Rank-order NPV aligned

5
Both projects have an IRR and CFROI of 10%, and would appear equally attractive to investment decision makers. NPV tells another tale! If a 6% cost of capital is assumed, the NPV of Project A is 50% higher than that of Project B, making it the clear winner in a capital budgeting exercise. In fact, Project B’s cash flow would have to increase to 277 and its IRR to 12% for the NPV of the projects to be equivalent at 168. IRR is not aligned with the NPV rule in this example.
Internal rate of return is a popular and treasured metric since it does not require an external cost of capital and all the squabbling that accompanies its quantification. NPV is a superior metric for assessing value but requires an explicit risk-adjusted discount rate. Calculation of EROI is perfectly aligned with NPV in this example. Project A has an EROI of 10% while Project B has an EROI of 8.6%. Project A is preferable using NPV or EROI. We can further illustrate differences between CFROI and EROI by varying the ratio of GCF to gross investment (IAGI) and NDA% for a typical company. The straight lines represent CFROI and the dashed lines represent EROI for GCF/IAGI ratios of 5%, 10% and 20% (GCF/IAGI is sometimes used as an ROA proxy, but it is a poor return on assets substitute). First of all, note how CFROI and EROI equal the return GCF/IAGI when all the assets are non-depreciating. The discrepancy between CFROI and EROI grows as the relative amount of depreciating assets increases. The asset replacement charge causes this discrepancy. Investors must recover the cost of the depreciating assets whereas non-depreciating assets are fully recovered at the project’s conclusion. In the CFROI calculation, when CFROI is greater than the discount rate, the replacement charge decreases as CFROI increases. This is not the case for the EROI, where depreciating assets are funded at the discount rate.
Project A Project B1,000 0
100 100 100 100 100 264 264 264 264 264
IRR = 10% IRR = 10%(1,000) (1,000)
0 year 1 year 2 year 3 year 4 year 5 year
Project A (1,000) 100 100 100 100 1,100
Project B (1,000) 264 264 264 264 264
IRRA NPVA, where dr=6%
IRRB NPVB, where dr=6%
10%
10%
$168
$111

6
A benefit of EROI is that it compresses returns toward the discount rate and has lower overall variance than CFROI for fixed asset-intensive companies. Note how there is very little difference between CFROI and EROI when they are near the discount rate, which was assumed to be 6% in this example. This example also illustrates why it is important to consider asset composition when measuring corporate profitability. Let’s conclude this section by calculating EROI for Amazon. ED is calculated at Amazon’s 2013 average real discount rate of 4.2%, which results in a charge of $5.735bn and an EROI of 11.7% versus a CFROI of 14.8%.
𝑅𝑁 (2013) = 𝑃𝑃𝑅 (4.2%, 5.3 years, 0,−$33.283bn) = $5.735𝑏𝑏
𝑅𝐶𝐶𝐶(2013) =($10.164𝑏𝑏 − $5.735𝑏𝑏)
$37.822𝑏𝑏= 11.7%
HOLT Economic Profit Economic Profit (EP) is the amount of value a firm creates over a specified period, typically annual. It is proportional to the spread between a company’s return on capital and cost of capital. If a firm is meeting its cost of capital, its EP is zero. Growth into projects below the cost of capital destroys shareholder value, and these projects should be rejected. Growth at the cost of capital is value neutral. The HOLT EP is simply the economic spread multiplied by assets if EROI is specified as the return on capital.
𝑅𝑃 = (𝑅𝐶𝐶𝐶 − 𝑁𝐶) × 𝐶𝑅𝐺𝐶 (6) Use of EROI leads to equivalent valuations from the FCFF and EP approaches. We demonstrate that the NPV and present value of economic profits are equivalent for the previous Project A and B example.
-10%
-5%
0%
5%
10%
15%
20%
25%
0% 20% 40% 60% 80% 100%
CFR
OI %
Non-Depreciating Assets %
CFROI vs EROI CFROI EROI
GCF/IAGI = 5%
GCF/IAGI = 20%
GCF/IAGI = 15%
Change in EP A crucial performance measure is change in economic profit (ΔEP). Increasing EP should be the focus of operations and acquisitions.

7
This simple example demonstrates a number of key points. First, the present value of future EP streams equals the NPV of each project’s cash flows. The EROI for Project A is equivalent to IRR and CFROI since the assets are 100% non-depreciating. The NPV of 168 is equivalent to the present value of Project A’s economic profit stream assuming a discount rate of 6%. The EROI for Project B is lower than the IRR and CFROI, indicating that this project is not as attractive as Project A. Another key point is that EROI is rank-order aligned with the lower NPV of 111, which is equivalent to the present value of Project B’s economic profits. Another way of stating EP is Economic Cash Flow (ECF) minus a capital charge (DR x IAGI). ECF is an after-tax operating profit less an economic depreciation charge.
𝑅𝑃 = 𝐺𝐶𝐶 − 𝑅𝑁 − 𝑁𝐶 × 𝐶𝑅𝐺𝐶 = 𝑅𝐶𝐶 − 𝐶𝐶𝐶𝐶𝐶𝐶𝐶 𝐶ℎ𝐶𝑎𝑎𝑎 (7)
The inflation-adjusted capital charge is the opportunity cost of using the assets, equal to the assets multiplied by the discount rate. This charge is analogous to the capital charge of invested capital multiplied by WACC in traditional approaches.7F
8 A firm can increase its economic profit by attaining greater productivity out of its assets, e.g., improved working capital management leads to a drop in assets and the capital charge. It can improve profitability by improving ECF margin and/or asset turns.
8 G.B. Stewart (1999). The Quest for Value. 2nd Edition. Harper Collins. Tim Koller, Marc Goedhart and David Wessels (2010). Valuation: Measuring and Managing the Value of Companies. 5th Edition. John Wiley & Sons.
Equivalence of NPV and the PV of EP0 1 2 3 4 5 IRR DR NPV
Project A -1,000 100 100 100 100 1,100 10.0% 6.0% 168Project B -1,000 264 264 264 264 264 10.0% 6.0% 111
Economic Profit Analysis - Project AGCF 100 100 100 100 100- ED@DR 0 0 0 0 0Economic Cash Flow 100 100 100 100 100/ IAGI 1,000 1,000 1,000 1,000 1,000= EROI 10.0% 10.0% 10.0% 10.0% 10.0%Economic Spread (EROI-DR) 4.0% 4.0% 4.0% 4.0% 4.0% PVEconomic Profit (Spread x IAGI) 40 40 40 40 40 168
Economic Profit Analysis - Project BGCF 264 264 264 264 264- ED@DR 177 177 177 177 177Economic Cash Flow 86 86 86 86 86/ IAGI 1,000 1,000 1,000 1,000 1,000= EROI 8.6% 8.6% 8.6% 8.6% 8.6%Economic Spread (EROI-DR) 2.6% 2.6% 2.6% 2.6% 2.6% PVEconomic Profit (Spread x IAGI) 26 26 26 26 26 111

8
Using (6), Amazon’s EP in 2013 was $2.833bn, which is the amount by which ECF exceeded the capital charge.
𝑅𝑃(2013) = (11.7% − 4.2%) × $37.822𝑏𝑏 = $2.833𝑏𝑏 What is the Connection between EP and Value? The level of economic profit and its sustainability are integral to a company’s intrinsic value. We established that the present value of a project’s EP and its NPV are equivalent. A general demonstration is derived in the appendix. The value of a firm equals the present value of its future EP streams and its inflation-adjusted economic net asset value (ENA). ENA equals IAGI minus the accumulated economic depreciation, and is a measure of a firm’s inflation-adjusted book value.
𝑉𝐶𝐶𝑉𝑎 = 𝑅𝑁𝑅0 + �𝑅𝑃𝑖
(1 + 𝑁𝐶)𝑖
𝑁
𝑖=1
(8)
If a firm is forecast to generate cost of capital returns, its EP will be zero, and the firm should trade at its book value. The enterprise book value is the current-dollar net assets. Firms unable to meet their cost of capital will trade at a discount to their book value, and those able to beat their cost of capital will trade at a premium. Growth and sustainability as value drivers are crystal clear in the EP framework. Firms able to grow EP via investment, margin expansion and/or asset productivity will increase shareholder value. Firms able to sustain value creating returns longer into the future and withstand the gravitational pull of fade will generate more shareholder value. A crucial performance measure, which we will investigate shortly, is the change in economic profit (ΔEP).
Income Statement
Balance Sheet
Gross Cash Flow
Inflation-adjusted Gross
Investment
Economic Depreciation
Discount Rate
Economic Cash Flow
Capital Charge
HOLT Economic Profit calculation:
Economic Profit
HOLT EP = (ECF – Capital Charge) or (EROI – DR) x IAGI

9
The Power of Simplicity: Spread, fade, and growth in an EP framework The importance of economic spread and fade can be readily shown. Consider a firm whose assets are growing at a rate g but whose profitability is fading at a rate f towards the cost of capital DR. An analytical solution exists for value.
𝑉𝐶𝐶𝑉𝑎 = 𝑅𝑁𝑅0 × �1 +(𝑅𝐶𝐶𝐶1 − 𝑁𝐶)(𝑁𝐶 − 𝑎 + 𝑓)� (9)
The impact of profitability and fade can now be evaluated. Fade is particularly value destructive! The table below, which assumes a real discount rate of 6% and real growth of 2%, shows the multiple of intrinsic value to ENA0, which is the HOLT price-to-book ratio (PBR). It is analogous to Tobin’s Q ratio.8F
9 When the forward CFROI is equal to the discount rate, the PBR remains constant at 1.0. Fade doesn’t matter, growth doesn’t create value and the firm should trade at its inflation-adjusted net asset value. The inverse of the fade rate is a measure of the expected Competitive Advantage Period (CAP). A value destroying firm with a EROI of 3% should trade at a PBR of 0.67 if it expects 20 years (5% fade rate) to recover to its cost of capital, and a significantly higher PBR of 0.94 if it only expects 2 years (50% fade rate) to recover. A stellar value creating firm with an EROI of 24% should trade at a PBR of 3.0 if its expected CAP is 20 years versus a significantly lower PBR of 1.3 for an expected CAP of 2 years. Fade happens, and its impact can be enormous. Estimated HOLT price-to-book EROI (1) 0% 3% 6% 12% 24%
Fade
Rat
e %
1% -0.20 0.40 1.00 2.20 4.60 5% 0.33 0.67 1.00 1.67 3.00 10% 0.57 0.79 1.00 1.43 2.29 25% 0.79 0.90 1.00 1.21 1.62 50% 0.89 0.94 1.00 1.11 1.33 100% 0.94 0.97 1.00 1.06 1.17
9 Economist and Nobel laureate James Tobin hypothesized (1968) that the aggregate value of all firms in the stock market was equal to their replacement cost. Equivalently, aggregate market value (V) equals replacement cost (C) = V/C, a value-to-cost multiple. HOLT price-to-book ratio is a useful V/C proxy.
Income Statement
Balance Sheet T-1
Balance Sheet T
Discount Rate
Gross Cash Flow
Total Investment Free Cash Flow
Free Cash Flow valuation:

10
Using Economic Profit to measure the value of acquisitions Thus far, we have focused on understanding the economics of operating assets. Economic profit analysis is also helpful in understanding the value of acquisitions. Acquisition goodwill, which HOLT treats as a non-operating intangible asset, can be factored into the analysis of economic profit and change in economic profit. The cumulative goodwill should be used since any premium paid represents a wealth transfer from the acquiring firm to target shareholders and is an unrecoverable cost, or penalty, to the acquiring firm’s equity investors. The penalty for control, however, isn’t indefinite if change in EP becomes the focus, since ΔEP negates sunk costs such as goodwill. Let’s begin with EP.
𝐶𝐶𝐶𝐶𝐶𝐶𝐶 𝐶ℎ𝐶𝑎𝑎𝑎 𝑜𝑏 𝐺𝑜𝑜𝐺𝐺𝐶𝐶𝐶 = 𝑁𝐶 × 𝐶𝑉𝐶𝑉𝐶𝐶𝐶𝐶𝐶𝑎 𝐺𝑜𝑜𝐺𝐺𝐶𝐶𝐶 (10)
𝑅𝑎𝐶𝑏𝑇𝐶𝑇𝐶𝐶𝑜𝑏 𝑅𝑃 = 𝐶𝐶𝑎𝑎𝐶𝐶𝐶𝑜𝑏𝑇 𝑅𝑃 + 𝐺𝑜𝑜𝐺𝐺𝐶𝐶𝐶 𝑅𝑃= (𝑅𝐶𝐶𝐶 − 𝑁𝐶) × 𝐶𝑅𝐺𝐶 − 𝑁𝐶 × 𝐺𝐺
(11)
The transaction EP includes operating EP and goodwill EP. The transaction EP for Amazon in 2013 was $2.690bn after a relatively small goodwill charge of $143m on a cumulative goodwill total of $3.384bn. 𝑅𝑎𝐶𝑏𝑇𝐶𝑇𝐶𝐶𝑜𝑏 𝑅𝑃(2013) = (11.7% − 4.2%) × $37.822𝑏𝑏 − 4.2% × $3.384𝑏𝑏
= $2.690𝑏𝑏 Amazon’s EP performance over the past decade is specified below. Operating EP swamps any charges due to goodwill. The exponential increase from $102m at the end of 2003 to $2.7bn in 2013 is extraordinary. What is the market expecting and will this trajectory continue? EP Outputs 2003 2004 2005 2006 2007 2008 2009 2010 2011 2012 2013 EP (Operations) 113 264 446 524 725 757 1,115 1,511 1,547 2,028 2,833 EP (Goodwill) -10 -9 -11 -13 -16 -36 -97 -79 -121 -165 -143 Total EP 102 254 435 511 709 720 1,018 1,432 1,425 1,862 2,690
A transaction EROI which incorporates acquisition goodwill can be defined which allows another way of stating the transaction EP.
𝑅𝑎𝐶𝑏𝑇𝐶𝑇𝐶𝐶𝑜𝑏 𝑅𝐶𝐶𝐶 =𝑅𝐶𝐶
𝐶𝑅𝐺𝐶 + 𝐺𝐺 (12)
and, rearranging (10)
(500)
0
500
1,000
1,500
2,000
2,500
3,000
2004
2005
2006
2007
2008
2009
2010
2011
2012
2013
$Mil
Economic Profit
EPOperations
EPGoodwill
Total EP

11
𝑅𝑎𝐶𝑏𝑇𝐶𝑇𝐶𝐶𝑜𝑏 𝑅𝑃 = (𝑅𝑎𝐶𝑏𝑇𝐶𝑇𝐶𝐶𝑜𝑏 𝑅𝐶𝐶𝐶 − 𝑁𝐶) × (𝐶𝑅𝐺𝐶 + 𝐺𝐺) (13)
Amazon’s transaction EROI in 2013 was 10.7% indicating that Amazon remains a value creating business if acquisition goodwill is taken into account.
𝑅𝑎𝐶𝑏𝑇𝐶𝑇𝐶𝐶𝑜𝑏 𝑅𝐶𝐶𝐶(2013) =($10.164 − $5.735𝑏𝑏)($37.822 + $3.384𝑏𝑏) = 10.7%
The higher the premium paid for an acquisition, the greater the capital charge. Economic profit can help judge whether the charge on goodwill is being offset by growth in operating EP. This can be achieved by splitting the change in economic profit into its spread, growth and goodwill components.
Decomposing value creation into Delta EP components A firm can increase its intrinsic value by generating a positive change in economic profit. ∆EP is a crucial measure of corporate performance and value creation. Annual changes in EP should be calculated and cumulative totals tallied. Bonuses of executives, division managers, project leaders and employees can be based on cumulative ΔEP over a 3 to 5 year period if shareholders want each level of the firm to be focused on value creation. Operationally, an increase in spread and growth in value creating businesses are the two major routes to achieving this goal. If acquisitions are the strategy guiding growth, then the charge on additional goodwill can be compared to the ΔEP generated from the acquired assets. If the premium paid is too high, then the economic charge on that premium will surpass the additional economic profit generated from the larger asset base. The change in EP can be calculated for any two periods but is generally calculated on an annual basis. ∆𝑅𝑃𝑖+1 = (𝑅𝐶𝐶𝐶𝑖+1 − 𝑁𝐶𝑖+1) × 𝐶𝑅𝐺𝐶𝑖+1 − (𝑅𝐶𝐶𝐶𝑖 − 𝑁𝐶𝑖) × 𝐶𝑅𝐺𝐶𝑖 (14)
For Amazon, the operating ΔEP in 2013 was $805m. ∆𝑅𝑃(2013) = (11.7% − 4.2%) × $37,822𝐶 − (12.7% − 4.9%) × $26,162𝐶
= $805𝐶 Amazon created $805m more in economic profit in 2013 than in 2012 despite its EROI dropping from 12.7% to 11.7%. Some of this increase was due to the higher risk appetite of markets, i.e., the discount rate dropped from 4.9% to 4.2%, but most of it was due to the enormous growth in assets, which was an astonishing 44.6% in nominal terms. Tremendous insight comes from decomposing the sources of value creation. Let’s see how to separate change in EP due to economic spread expansion from that due to growth. The ΔEP equation can be rewritten as the expression: (15) ∆𝑅𝑃𝑖+1 = (∆𝑅𝐶𝐶𝐶𝑖+1 − ∆𝑁𝐶𝑖+1) × 𝐶𝑅𝐺𝐶𝑖 + (𝑅𝐶𝐶𝐶𝑖+1 − 𝑁𝐶𝑖+1) × ∆𝐶𝑅𝐺𝐶𝑖+1 There are two terms that comprise the change in operating EP. The first is the improvement in EP due to economic spread expansion. The expansion comes
Value creation from expansion in economic spread
Value creation from growth and reinvestment

12
from improvement in EROI and change in the discount rate. The second term is change in EP due to growth and re-investment. If growth is zero, then this term is zero. If the spread is positive, then growth creates value. The beginning-of-year asset growth rate, g, can be used to restate the equation in an explicit manner. (16)
∆𝑅𝑃𝑖+1 = [(∆𝑅𝐶𝐶𝐶𝑖+1 − ∆𝑁𝐶𝑖+1) + (𝑅𝐶𝐶𝐶𝑖+1 − 𝑁𝐶𝑖+1) × 𝑎] × 𝐶𝑅𝐺𝐶𝑖 It is worthwhile dwelling on the economic spread component for a moment. The change in EROI is related to the operating performance of the firm. Change in EROI has a directly proportional impact on change in EP. Because HOLT employs a forward-looking, market-implied discount rate, the change in discount rate is related to market risk appetite and the firm’s non-diversifiable risk. The firm has some say over the latter, e.g., via its leverage and credit risk, but cannot control the former. This can prove unsettling since change in value is a function of the firm’s operating performance and market whims. Corporate managers and executive remuneration committees might find it preferable to settle on an absolute discount rate that remains constant to reduce the effect of market vagaries. Change in EP due to EROI and discount rate changes (change in economic spread):
∆𝑅𝑃1(𝑇𝐶𝑎𝑎𝐶𝐺) = (𝑅𝐶𝐶𝐶1 − 𝑅𝐶𝐶𝐶0 − 𝑁𝐶1 + 𝑁𝐶0) ×𝐶𝑅𝐺𝐶11 + 𝑎
(17)
The change in EP due to spread compression was -$68m in 2013 for Amazon.
∆𝑅𝑃2013(𝑇𝐶𝑎𝑎𝐶𝐺) = (11.7% − 12.7% − 4.2% + 4.9%) ×$37,822𝐶1 + 44.6%
= −$68𝐶
Amazon lost economic profit in 2013 due to economic spread compression. Did it compensate for the loss via growth? Change in EP due to growth:
∆𝑅𝑃1(𝑎𝑎𝑜𝐺𝐶ℎ) = (𝑅𝐶𝐶𝐶1 − 𝑁𝐶1) ×𝑎 × 𝐶𝑅𝐺𝐶1
1 + 𝑎 (18)
Note that the measures can be normalized by dividing by IAGI, IANA or sales. Normalization by sales results in economic profit and ΔEP margins, which are particularly insightful for asset-light companies. How much additional value did Amazon’s growth in 2013 generate?
∆𝑅𝑃2013(𝑎𝑎𝑜𝐺𝐶ℎ) = (11.7% − 4.2%) ×44.6% × $37,822𝐶
1 + 0.446= $873𝐶
Amazon created tremendous value by growing its business rather than maintaining a higher level of overall profitability. The operating ΔEP was $805m in 2013, i.e., -$68m + 873m. But how much of the growth came from acquiring assets? What about Goodwill?

13
The above analysis is based on operating returns and does not account for goodwill that may have been paid to acquire assets. Fortunately, the mathematics remain the same if we substitute Transaction EROI for EROI and IAGI plus Goodwill for Invested Capital in the equations.
𝑅𝑎 𝑅𝑃𝑖 = (𝑅𝑎 𝑅𝐶𝐶𝐶𝑖 − 𝑁𝐶𝑖) × (𝐶𝑅𝐺𝐶𝑖 + 𝐺𝐺𝑖) (19)
A highly insightful adjustment is to separate the effect of goodwill from operations using (18) and (9).
𝑅𝑎 𝑅𝑃𝑖 = (𝑅𝐶𝐶𝐶𝑖 − 𝑁𝐶𝑖) × 𝐶𝑅𝐺𝐶𝑖 − 𝑁𝐶𝑖 × 𝐺𝐺𝑖
The contribution of operations and goodwill to EP can now be easily calculated. The change in EP can also include an acquisition component.
∆𝑅𝑎 𝑅𝑃𝑖+1 = [(∆𝑅𝐶𝐶𝐶𝑖+1 − ∆𝑁𝐶𝑖+1) + (𝑅𝐶𝐶𝐶𝑖+1 − 𝑁𝐶𝑖+1)× 𝑎] × 𝐶𝑅𝐺𝐶𝑖 − 𝑁𝐶𝑖+1 × ∆𝐺𝐺𝑖+1
(20)
The goodwill term assumes that the discount rate remains constant at time i and i+1 to simplify the math. Goodwill is a sunk cost. If there is no change in the cumulative goodwill then there is no change in value due to past acquisitions. Thus we avoid penalizing future value creation for past acquisitions. This is not the case when looking at absolute EP, which has sunk costs anchored to it. What is the change in EP due to M&A goodwill? Due to change in goodwill: ∆𝑅𝑎 𝑅𝑃1(𝑃&𝑅) = −𝑁𝐶1 × ∆𝐺𝐺1 There was no material change in goodwill for Amazon in 2013, thus the charge due to change in goodwill is zero. Amazon is not averse to acquisitions. The years 2009, 2011 and 2012 are noteworthy. But the charges in these years due to increases in goodwill were drowned by increases in operating EP. Despite Amazon’s EROI falling since 2007, it has been generating impressive improvements in economic profit. Investors want more economic profit, even if it means lower profitability. The aim is maximizing the present value of all future economic profit streams. Change in EP Outputs 2003 2004 2005 2006 2007 2008 2009 2010 2011 2012 2013
Due to chg EP spread 84 135 -14 14 -112 16 16 -375 -187 -68 Due to growth 67 47 92 186 144 343 380 411 668 873 Operating chg in EP 151 182 78 201 32 358 396 36 481 805 Due to Goodwill -1 -1 -2 -2 -16 -61 -4 -31 -33 -1 Total Change in EP 150 182 76 198 16 297 392 5 448 805

14
Change in EP (ΔEP) is the metric of choice in judging how well managers are performing as stewards of invested capital. It should be a key metric in value-based incentive programs. It has the advantage that lost value from sunk costs are negated, i.e., if the sunk cost doesn’t change then change in its capital charge is zero. Investors prefer a positive change in value creation, irrespective of whether the firm is a value destroyer or value creator. The principle of value additivity informs us that any improvement in economic profit is an improvement in the firm’s NPV and intrinsic value. Multi-year ΔEP accounts that get amortized on a rolling basis are highly suitable for incentivizing company managers.
(2,000)
(1,000)
0
1,000
2,000
3,000
2004
2005
2006
2007
2008
2009
2010
2011
2012
2013
$Mil
Economic Profit
Operations
Goodwill
Total EP
15
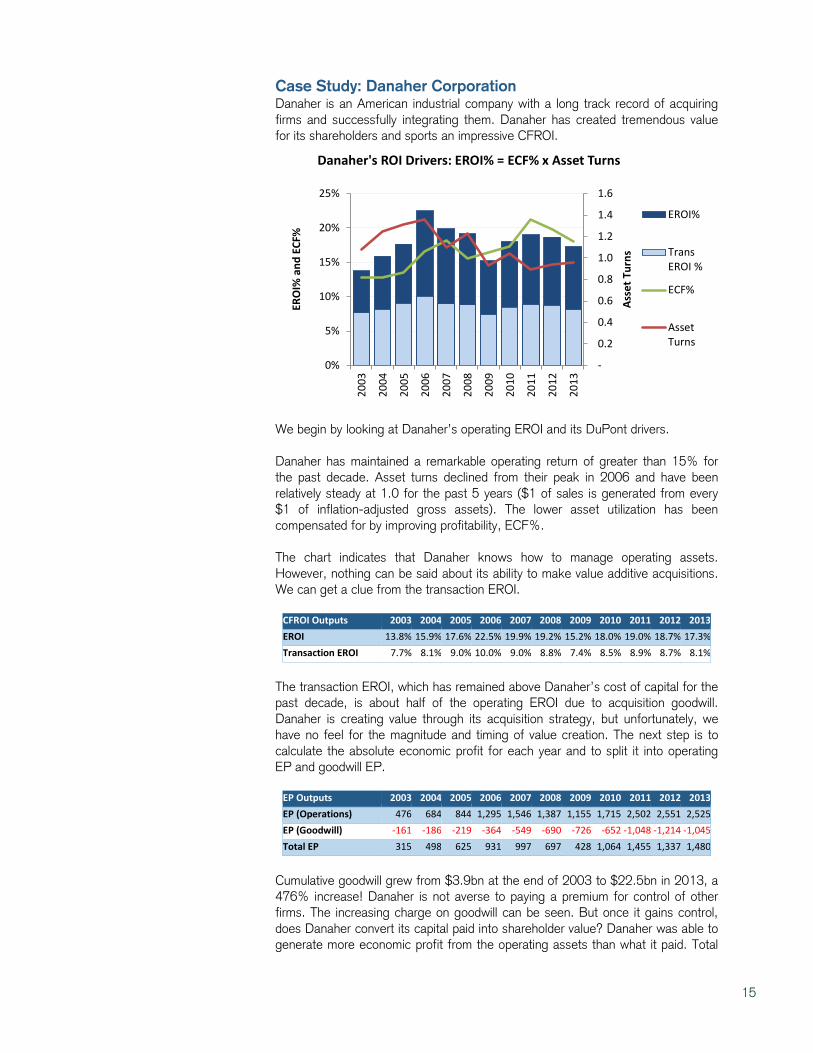
Case Study: Danaher Corporation Danaher is an American industrial company with a long track record of acquiring firms and successfully integrating them. Danaher has created tremendous value for its shareholders and sports an impressive CFROI.
We begin by looking at Danaher’s operating EROI and its DuPont drivers. Danaher has maintained a remarkable operating return of greater than 15% for the past decade. Asset turns declined from their peak in 2006 and have been relatively steady at 1.0 for the past 5 years ($1 of sales is generated from every $1 of inflation-adjusted gross assets). The lower asset utilization has been compensated for by improving profitability, ECF%. The chart indicates that Danaher knows how to manage operating assets. However, nothing can be said about its ability to make value additive acquisitions. We can get a clue from the transaction EROI.
CFROI Outputs 2003 2004 2005 2006 2007 2008 2009 2010 2011 2012 2013 EROI 13.8% 15.9% 17.6% 22.5% 19.9% 19.2% 15.2% 18.0% 19.0% 18.7% 17.3% Transaction EROI 7.7% 8.1% 9.0% 10.0% 9.0% 8.8% 7.4% 8.5% 8.9% 8.7% 8.1%
The transaction EROI, which has remained above Danaher’s cost of capital for the past decade, is about half of the operating EROI due to acquisition goodwill. Danaher is creating value through its acquisition strategy, but unfortunately, we have no feel for the magnitude and timing of value creation. The next step is to calculate the absolute economic profit for each year and to split it into operating EP and goodwill EP.
EP Outputs 2003 2004 2005 2006 2007 2008 2009 2010 2011 2012 2013 EP (Operations) 476 684 844 1,295 1,546 1,387 1,155 1,715 2,502 2,551 2,525 EP (Goodwill) -161 -186 -219 -364 -549 -690 -726 -652 -1,048 -1,214 -1,045 Total EP 315 498 625 931 997 697 428 1,064 1,455 1,337 1,480
Cumulative goodwill grew from $3.9bn at the end of 2003 to $22.5bn in 2013, a 476% increase! Danaher is not averse to paying a premium for control of other firms. The increasing charge on goodwill can be seen. But once it gains control, does Danaher convert its capital paid into shareholder value? Danaher was able to generate more economic profit from the operating assets than what it paid. Total
-
0.2
0.4
0.6
0.8
1.0
1.2
1.4
1.6
0%
5%
10%
15%
20%
25%
2003
2004
2005
2006
2007
2008
2009
2010
2011
2012
2013
Asse
t Tur
ns
ERO
I% a
nd E
CF%
Danaher's ROI Drivers: EROI% = ECF% x Asset Turns
EROI%
TransEROI %
ECF%
AssetTurns

16
EP grew from $364m at the end of 2003 to $1.5bn in 2013. Of most interest is the change in economic profit and where it is coming from.
The effects of spread, growth and goodwill are calculated. Danaher was increasing economic profit and intrinsic value until the global financial crisis of 2008/9. Significant acquisitions were made in 2006, 2007 and 2008, i.e., look at the change in EP due to goodwill line. The increase in EP due to growth more than compensated for the loss due to goodwill. It is interesting to note that the increase in EP due to growth in 2007 compensated for an increase in the goodwill charge AND a drop in spread. Change in EP Outputs 2003 2004 2005 2006 2007 2008 2009 2010 2011 2012 2013
Due to chg EP spread 132 84 270 -207 -193 -401 475 55 -137 -99 Due to growth 76 76 180 458 34 169 86 732 185 73 Operating chg in EP 208 160 451 251 -159 -232 560 787 48 -25 Due to Goodwill -48 -20 -122 -156 7 -40 -71 -316 -81 -21 Total Change in EP 161 140 328 95 -153 -272 489 471 -33 -47
5 year total chg in EP 571 139 488 631 503 609
EROI dropped to 15.2% in 2009 as a result of the global slowdown. The 2009 change in EP due to spread compression was a loss of $403m. Significant acquisitions were again made in 2011 and 2012. The change in EP due to growth in 2011 far exceeded the loss due to goodwill. Except for 2009, the 5-year cumulative change in EP has been positive. Danaher’s managers can take a bow for generating excellent operating returns and consistently creating value through acquisitions. Few firms are able to so effectively integrate acquisitions and expand shareholder value.
(2,000)
(1,000)
0
1,000
2,000
3,000
2004
2005
2006
2007
2008
2009
2010
2011
2012
2013
$Mil
Economic Profit
Operations
Goodwill
Total EP
-600
-400
-200
0
200
400
600
800
1,000
2004
2005
2006
2007
2008
2009
2010
2011
2012
2013
$Mil
Change in Economic Profit
Spread
Growth
Goodwill
Total EPChange

17
Global Market Commentary Disclaimer9F
1010F
11
References to Credit Suisse include all of the subsidiaries and affiliates of Credit Suisse AG operating under its investment banking division. For more information on our structure, please follow the attached link: https://www.credit-suisse.com/who_we_are/en/what_we_do.jsp
This material has been prepared by individual traders or sales personnel of Credit Suisse and not by Credit Suisse's research department. It is intended only to provide observations and views of these traders or sales personnel, which may be different from, or inconsistent with, the observations and views of Credit Suisse research department analysts, other Credit Suisse traders or sales personnel, or the proprietary positions of Credit Suisse. Observations and views expressed herein may be changed by the trader or sales personnel at any time without notice. Credit Suisse accepts no liability for loss arising from the use of this material.
This material does not purport to contain all of the information that an interested party may desire and, in fact, provides only a limited view of a particular market. It is not investment research, or a research recommendation, as it does not constitute substantive research or analysis. The information provided is not intended to provide a sufficient basis on which to make an investment decision and is not a personal recommendation. While it has been obtained from or based upon sources believed by the trader or sales personnel to be reliable, each of the trader or sales personnel and Credit Suisse does not represent or warrant its accuracy or completeness and is not responsible for losses or damages arising out of errors, omissions or changes in market factors.
This material is provided for informational purposes and does not constitute an invitation or offer to subscribe for or purchase any of the products or services mentioned. It is directed exclusively at Credit Suisse's market professional and institutional investor clients (e.g. QIBs) as defined by the rules of the relevant regulatory authority, and must not be forwarded or shared with retail customers or the public. It is not intended for private customers and such persons should not rely on this material. Moreover, any investment or service to which this material may relate will not be made available by Credit Suisse to such private customers.
This material may have previously been communicated to the Credit Suisse trading desk or other Credit Suisse clients. You should assume that the trading desk makes markets and/or currently maintains positions in any of the securities mentioned above. Credit Suisse may, from time to time, participate or invest in transactions with issuers of securities that participate in the markets referred to herein, perform services for or solicit business from such issuers, and/or have a position or effect transactions in the securities or derivatives thereof. Information provided on any trades executed with Credit Suisse will not constitute an official confirmation of the trade details, and all preliminary trade report information is subject to our formal written confirmation.
FOR IMPORTANT DISCLOSURES on companies covered in Credit Suisse Investment Banking Division research reports, please see www.credit-suisse.com/researchdisclosures. To obtain a copy of the most recent Credit Suisse research on any company mentioned please contact your sales representative or go to http://www.credit-suisse.com/researchandanalytics.
Past performance should not be taken as an indication or guarantee of future performance, and no representation or warranty, expressed or implied is made regarding future performance. Backtested, hypothetical or simulated performance results have inherent limitations. Simulated results are achieved by the retroactive application of a backtested model itself designed with the benefit of hindsight. The backtesting of performance differs from the actual account performance because the investment strategy may be adjusted at any time, for any reason and can continue to be changed until desired or better performance results are achieved. Alternative modeling techniques or assumptions might produce significantly different results and prove to be more appropriate. Past hypothetical backtest results are neither an indicator nor a guarantee of future returns. Actual results will vary from the analysis.
Investment principal on securities can be eroded depending on sale price or market price. In addition, there are securities on which investment principal may be eroded due to changes in redemption amounts. Care is required when investing in such instruments.
HOLT Disclaimer
The HOLT methodology does not assign ratings or a target price to a security. It is an analytical tool that involves use of a set of proprietary quantitative algorithms and warranted value calculations, collectively called the HOLT valuation model, that are consistently applied to all the companies included in its database. Third-party data (including consensus earnings estimates) are systematically translated into a number of default variables and incorporated into the algorithms available in the HOLT valuation model. The source financial statement, pricing, and earnings data provided by outside data vendors are subject to quality control and may also be adjusted to more closely measure the underlying economics of firm performance. These adjustments provide consistency when analyzing a single company across time, or analyzing multiple companies across industries or national borders. The default scenario that is produced by the HOLT valuation model establishes a warranted price for a security, and as the third-party data are updated, the warranted price may also change. The default variables may also be adjusted to produce alternative warranted prices, any of which could occur. The warranted price is an algorithmic output applied systematically across all companies based on historical levels and volatility of returns. Additional information about the HOLT methodology is available on request
CFROI, CFROE, HOLT, HOLT Lens, HOLTfolio, HOLTSelect, HS60, HS40, ValueSearch, AggreGator, Signal Flag, Forecaster, “Clarity is Confidence” and “Powered by HOLT” are trademarks or registered trademarks of Credit Suisse Group AG or its affiliates in the United States and other countries.
HOLT is a corporate performance and valuation advisory service of Credit Suisse.
© 2015 Credit Suisse Group AG and its subsidiaries and affiliates. All rights reserved.
11 For region specific disclosures, including information about applicable registrations and certain regulatory disclosures, please follow the links below: Americas: https://www.credit-suisse.com/legal/en/ib/market_commentary.jsp Europe: https://www.credit-suisse.com/legal/en/ib/europe.jsp (Credit Suisse Securities (Europe) Limited is authorised by the Prudential Regulation Authority and regulated by the Financial Conduct Authority and the Prudential Regulation Authority in the United Kingdom) Asia: https://www.credit-suisse.com/legal/en/ib/market_commentary_disclaimer_asia.jsp General investors in Japan should open the following link and read it: https://www.credit-suisse.com/jp/investment_banking/ja/disclaimer/ Please note that this is market commentary and not a research publication.