holocene hydrological reconstructions from stable …mabbott1/climate/mark/abstracts/pubs/... ·...
TRANSCRIPT

*Corresponding author. Tel.: #1-413-545-0229; fax: #1-413-545-1200.
E-mail address: [email protected] (M.B. Abbott).
Quaternary Science Reviews 19 (2000) 1801}1820
Holocene hydrological reconstructions from stable isotopes andpaleolimnology, Cordillera Real, Bolivia
Mark B. Abbott!,*, Brent B. Wolfe", RamoH n Aravena", Alexander P. Wolfe#,Geo!rey O. Seltzer$
!Department of Geosciences, Morrill Science Center Box 35820, University of Massachusetts, Amherst, MA 01003-5820, USA"Department of Earth Sciences, University of Waterloo, Waterloo, Canada ON N2L 3G1
#Institute of Arctic and Alpine Research, Campus Box 450, University of Colorado, Boulder, CO 80309-0450, USA$Department of Earth Sciences, Heroy Geology Laboratory, Syracuse University, Syracuse, NY 13244-1070, USA
Abstract
Multiproxy analyses of sediment cores from Lago Taypi Chaka Kkota (LTCK) Cordillera Real, Bolivia, provide a record of drierconditions following late Pleistocene deglaciation culminating in pronounced aridity between 6.2 and 2.3 ka B.P. Today LTCK isa glacial-fed lake that is relatively insensitive to changes in P}E because it is largely bu!ered from dry season draw-down through theyear-round supply of glacial meltwater. This was not the case during the middle to late Holocene when glaciers were absent from thewatershed. Lake-water d18O values inferred from d18O analysis of sediment cellulose range from !12.9 to !5.3& and average!8.7& between 6.2 and 2.3 ka B.P. Modern lake-water d18O from LTCK averages !14.8& which is compatible with the d18O
-8value of !14.3& for the surface sediment cellulose. Analyses of d18O from modern surface waters in 23 lakes that span the rangefrom glacial-fed to closed basin vary from !16.6 to !2.5&. This approximates the magnitude of the down-core shift in d18O
-8values in LTCK during the middle to late Holocene from !12.9 to !5.3&. Strong paleohydrologic change during the middleHolocene is also evident in diatom assemblages that consist of shallow-water, non-glacial periphytic taxa and bulk organic d13C andd15N that show increases likely resulting from degradation of lacustrine organic matter periodically exposed to subaerial conditions.Neoglaciation began after 2.3 ka B.P. as indicated by changes in the composition of the sediments, lower d18O values, and a return todiatom assemblages characteristic of the glacial sediments that formed during the Late Pleistocene. Collectively, these data indicatethat the past 2.3 ka B.P. have been the wettest interval during the Holocene. Millennial-scale shifts in the paleohydrologic record ofLTCK during the early to middle Holocene conform to other regional paleoclimatic time-series, including Lake Titicaca and NevadoSajama, and may be driven by insolation and resultant changes in atmospheric circulation and moisture supply. In contrast, anapparent 1200-year lag in the onset of wetter conditions at LTCK (2.3 ka B.P.) compared to Lake Titicaca (3.5 ka B.P.) providesevidence for variable sub-regional hydrologic response to climate change during the middle to late Holocene. ( 2000 ElsevierScience Ltd. All rights reserved.
1. Introduction
As we become increasingly aware of the internationalsigni"cance and economic importance of present andfuture climate changes, we must focus on the potentialmechanisms for both natural and anthropogenic envir-onmental change. The emphasis of most current researchis to reconstruct past temperature changes, but #uctu-ations in the precipitation}evaporation (P}E) balancehave equally important implications to society and have
recently been shown to occur over time-scales relevant tohumans (e.g. Hodell et al., 1995; Abbott et al., 1997b;Binford et al., 1997). Most important, perhaps, is thatemphasis be placed on determining when, where, andhow fast climate has varied during the Holocene whenoverall boundary conditions were similar to today. Bydocumenting the spatial and temporal pattern of Holo-cene climatic change from a network of sites in the Andeswe will be better able to forecast future changes in re-gional hydrology.
The Andean altiplano and surrounding cordillera haveexperienced major hydrological changes during the latePleistocene and Holocene as documented by a variety ofpaleoclimate records including glacial geology, pluviallakes, and cores from Lake Titicaca. Seltzer (1990, 1992)
0277-3791/00/$ - see front matter ( 2000 Elsevier Science Ltd. All rights reserved.PII: S 0 2 7 7 - 3 7 9 1 ( 0 0 ) 0 0 0 7 8 - 0
showed that deglaciation occurred rapidly during thelatest Pleistocene with no evidence for Holocene gla-ciation until relatively minor Neoglacial readvances ofless than 200 m extent. Pluvial lake studies indicate thathigh lake stands on the altiplano lasted until about 9.5 kaB.P. with no evidence of subsequent high water levels(Grosjean et al., 1995; Clayton and Clapperton, 1997).Studies of sediment cores from Lake Titicaca indicatethat the water level was at least 50 m lower 8.4 ka B.P.(Wirrmann and De Oliveira Almeida, 1987) and prob-ably as much as 100 m lower than today at this time(Seltzer et al., 1998; Cross et al., 2000). After 3.5 ka B.P.water level rose to the over#ow level with four low waterstands from 3.5 ka B.P. to present (Wirrmann and Mour-guiart, 1995; Abbott et al., 1997b; Mourguiart et al.,1998). Together, these studies indicate that the regionbecame increasingly arid from the late Pleistocene to themiddle Holocene with wetter conditions starting around4 ka B.P.
None of these climate archives, however, are continu-ous. Ice cores collected on Nevado Sajama in the westerncordillera provide continuous records and suggest thatwarm-dry conditions began at 15.5 ka B.P., but wereinterrupted by cold}wet conditions between 14.3 and11.5 ka B.P. (Thompson et al., 1998). This "nding is notconsistent with the regional record of deglaciation andpluvial lake levels which both suggest rapid deglaciationbetween 14 and 10 ka B.P. During the Holocene theSajama record suggests arid conditions from &9 to 3 kaB.P. and wetter conditions thereafter. The highresolution record from the Sajama ice core containsa tremendous amount of paleoclimate information, butinterpretation of ice core d18O results are complicatedbecause the signal incorporates changes in temperature,precipitation source, and evaporative enrichment by sub-limation (Grootes et al., 1989).
Here we present a multi-proxy study on a sedimentcore from Lago Taypi Chaka Kkota (LTCK) detailingmajor shifts in watershed hydrology during the Holocenethat are primarily driven by changes in the P}E balance.This study is an extension of preliminary work by Abbottet al. (1997a) that detailed the sedimentology of the samesite. New results described here include stable isotopemeasurements on sediment cellulose (d18O and d13C)and bulk sediment (d13C and d15N), and analysis ofdiatom assemblages. These results are compared withother paleoclimate records in the region to assess theconsistency of the emerging paleoclimate history of theregion.
Oxygen and carbon isotope analyses on the "ne-grained ((500 lm) cellulose fraction of lacustrine or-ganic matter are an e!ective tool for reconstructing hy-drological conditions and carbon pathways in lakewatersheds (e.g., MacDonald et al., 1993; Duthie et al.,1996; Wolfe et al., 1996). Aquatic plant cellulose is a par-ticularly useful substrate because its oxygen isotope com-
position is consistently enriched by 27 to 28& comparedto water and is una!ected by changes in temperature(DeNiro and Epstein, 1981; Sternberg, 1989; Yakir, 1992).Therefore, with no temperature-dependant fractionation,interpreting cellulose d18O paleorecords is more straight-forward than carbonate records. Interpretation is simpli-"ed because only two factors control the d18O signal: (1)the isotopic composition of input waters that are deter-mined by precipitation, surface runo!, and groundwaterand (2) hydrologic processes that modify the isotopiccomposition of meteoric water, such as evaporation. Ifyou can assume a purely lacustrine origin of cellulose,lake-water d18O histories can be directly inferred fromcellulose d18O and provide information on watershedhydrology. In this study we incorporate regional samp-ling and isotopic analysis of modern lake water in di!er-ent hydrologic settings as a means to interpret down-corepro"les of the cellulose-inferred lake water d18O. In addi-tion, changes in diatom #oras were used to documentdown-core changes in periphytic and glacial lake assem-blages.
2. Field area and climate
2.1. Regional climatic setting
Precipitation in the altiplano region and the surround-ing cordillera is marked by pronounced seasonalcontrasts. During the Austral summer months(December}March) a heat-induced low-pressure cellforms over the center of the South American continentthat draws moisture from the South Atlantic. At the sametime, convective activity over the altiplano associatedwith the `Bolivian Higha (Aceituno and Montecinos,1993) produces summer precipitation in the Andes ac-counting for 65 to 78% of the annual total. At the higherelevations this precipitation occurs as snow. Periodicblocking of the easterly atmospheric circulation by thewesterlies (Aceituno and Montecinos, 1993; Kessler,1988) and perturbations caused by El Nin8 o SouthernOscillation (ENSO) events (Thompson et al., 1984; Rib-stein et al., 1995; Francou et al., 1995) are conditions thatresult in unusually dry conditions on the altiplano duringthe summer. We contend that the synoptic climatic con-ditions that lead to seasonal and intra-seasonal vari-ations in e!ective moisture today on the altiplano serveas appropriate analogues for changes that may haveoccurred over longer periods during the Holocene.
The eastern cordillera of the northern Bolivian Andesis characterized as a zone of steep climatic gradientscaused by the marked gain in altitude from the AmazonBasin to mountain peaks exceeding 6000 m elevation.The result is a pronounced rain shadow, with precipita-tion decreasing east to west from '1400 mm yr~1 in thelowlands to less than 700 mm yr~1 on the altiplano
1802 M.B. Abbott et al. / Quaternary Science Reviews 19 (2000) 1801}1820

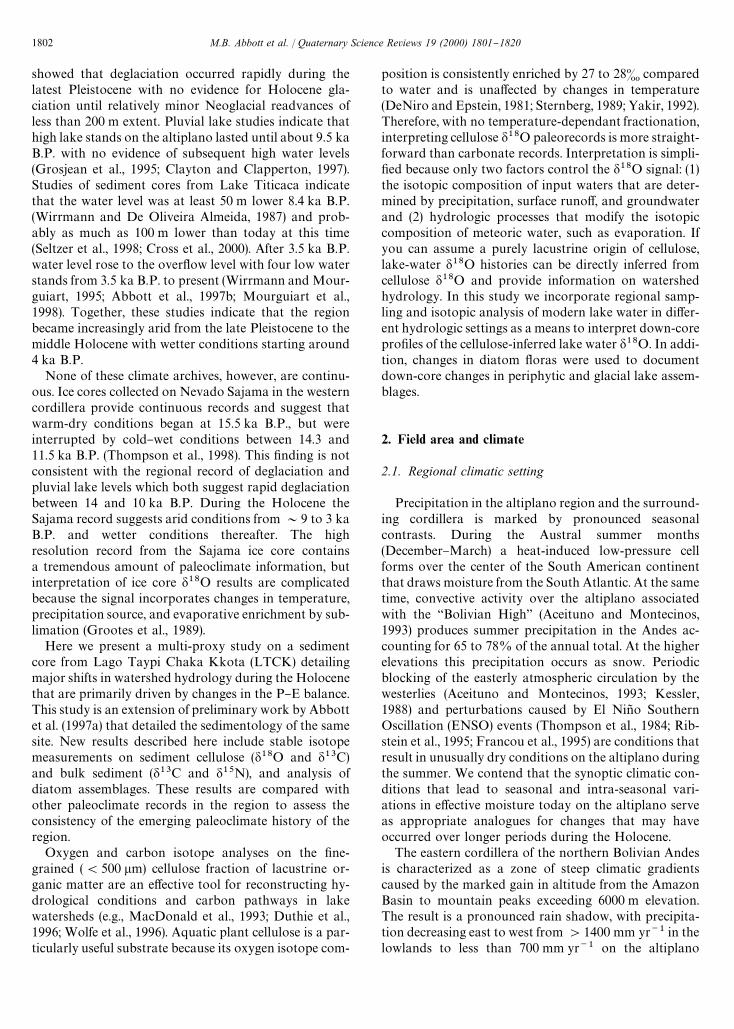
Fig. 1. Location of the study site in Bolivia. Average summer locations of the Intertropical Convergence Zone (ITCZ) during January and July areshown by the thick dashed lines. The study area in the Bolivian Andes has a summer wet season and is located at the southernmost extension of theITCZ. Shaded area represents elevations greater than 3000 m. Modern lake-water samples were collected from the Cordillera Vilcanota, Real, Tunari,and Chichas.
(Ho!man, 1975). Roche et al. (1992) estimated that thehighest peaks of the eastern Cordillera Real receive morethan 800 mm yr~1 of precipitation, whereas 50 km to thewest this decreases to less than 500 mm/yr~1. Ribstein etal. (1995) measured &900 mm of precipitation duringthe 1992}1993 hydrological year on the Zongo Glacier inthe Cordillera Real, situated 20 km to the south ofLTCK.
2.2. Late Quaternary evolution of the Rio Palcoco valley
The LTCK watershed is located at 16313@S, 68321@W inthe Rio Palcoco Valley on the western slope of theCordillera Real (Fig. 1). LTCK is situated at 4300 melevation and is lowest in a chain of three lakes. Thecirque headwalls up-valley attain 5650 m elevation andcontain a series of small alpine glaciers. Seltzer (1992)described rapid deglaciation of the Rio Palcoco valley onthe basis of a series of concordant bulk sediment14C dates obtained from the base of the organic-richsediments distributed between the headwall and 10 kmdown valley. Glaciers receded to within their Neoglaciallimits by 9.5 ka B.P. as indicated by a radiocarbon dateon peat overlying glacial silt from a bog proximal to themodern glacier terminus at 4670 m elevation (Seltzer,1992). Late Holocene glacial advances in the CordilleraReal were modest, extending less than 200 m from mod-ern termini (Gouze et al., 1986; Seltzer, 1990). This iscompatible with sedimentological evidence from LTCKthat suggests that glaciers were not present in the water-shed during the middle Holocene (Abbott et al., 1997a).
3. Methods
3.1. Coring and sediment processing
Cores were taken from the central basin of the lakewith a square-rod piston corer (Wright et al., 1984) anda piston corer designed to collect undisturbed the sedi-ment}water interface (Fisher et al., 1992). Laboratoryanalyses were focused on the upper 3 m of the 5.3 m longCore E which was recovered from the center of the lake in8.3 m of water. The lower 2.3 m of core contains inor-ganic silts similar to the basal samples of the 3 m sectiondescribed in this paper. The sediment units are labeled1}5 and described below in order of formation. A de-tailed description of the core sedimentology, physicalcharacteristics, magnetic properties, and accumulationrates of organic matter, biogenic silica, and mineral mat-ter can be found in Abbott et al. (1997a). Whole coremagnetic susceptibility was measured at 1 cm incrementsafter which cores were split, described, and photo-graphed. Magnetic susceptibility was measured witha Bartington Susceptibility Bridge, corrected for massdi!erences with bulk density measurements. Half of thecore was archived in ODP D-tubes at the University ofMassachusetts and the other half sampled for bulk den-sity, mass magnetic susceptibility, carbon concentrationby coulometry, bulk sediment stable isotopes (d13C andd15N), sediment cellulose stable isotopes (d18O andd13C), diatoms, and biogenic silica. Core lithology wasdetermined from smear-slide mineralogy and detailedinspection of sediments. Munsell color, texture,
M.B. Abbott et al. / Quaternary Science Reviews 19 (2000) 1801}1820 1803

sedimentary structures, and biogenic features were alsonoted.
3.2. Geochemical and isotopic analyses
Biogenic silica analyses were performed by time-seriesdissolution experiments (DeMaster, 1981). Total carbon(TC) and total inorganic carbon (TIC) were measuredwith a UIC Coulometric System at the LimnologicalResearch Center, University of Minnesota. Total organiccarbon (OC) was calculated by the di!erence of TC-TIC.Lake sediment subsamples for organic elemental andisotope analysis were treated with 10% HCl to removecarbonate material, rinsed repeatedly with distilledwater, lyophilized, and passed through a 500 lm sieve toremove coarse debris. Carbon and nitrogen concentra-tion and isotopic composition of this residue weredetermined on a continuous #ow-isotope ratio massspectrometer (CF-IRMS) equipped with an elementalanalyzer. Additional sample pretreatment including sol-vent extraction, bleaching, and alkaline hydrolysis re-moved non-cellulose organic constituents (Edwards etal., 1997). Cellulose carbon isotope composition wasmeasured by CF-IRMS, and CO
2gas collected by pyro-
lysis of cellulose was measured for oxygen isotope com-position using a VG Prism II mass spectrometer(Edwards et al., 1994). Oxygen and hydrogen isotopeanalyses were conducted on a series of water samplesfrom 23 alpine lakes surveyed in 1997 on a transect from14 to 193S (see Fig. 1 for locations). Water samples wereanalyzed using standard methods (Epstein and Mayeda,1953; Coleman et al., 1982). Pretreatment and analysis oflake sediment and water samples were performed at theUniversity of Waterloo. Preparation and isotopic ana-lyses of modern vegetation and surface sediment samplesfollowed similar procedures as the lake sediment pret-reatment. All lake sediment samples were analyzed at theUniversity of Waterloo while vegetation samples weremeasured at both the University of Waterloo and theUniversity of Alaska as noted in Table 3.
Results of stable isotopic analyses are reported in d-notation (d " [(R
4!.1-%/R
45!/$!3$)!!1]]1000, where
R"18O/16O, 15N/14N , 13C/12C , and 2H/1H, withrespect to the international standards for d18O (ViennaStandard Mean Ocean Water (VSMOW)), d13C (ViennaPeedee Belemnite (VPDB)), d15N (atmospheric nitrogen(AIR)), and d2H (Vienna Standard Mean Ocean Water(VSMOW)). Duplicate bulk organic and cellulose d13Cand bulk organic d15N analyses are within $0.5&,while repeated cellulose d18O analyses are within$1.0&, re#ecting both method uncertainty and sampleheterogeneity. Analytical uncertainties are $0.2 and$2.0& for d18O and d2H values of water, respectively.Stable isotope measurements on sediment cellulose dis-cussed in this paper are reported as d18O
#%--or d13C
#%--.
Likewise, stable isotope measurements on bulk sediment
are reported as d13C03'
and d15N03'
. Lake water d18O(d18O
-8) is inferred from d18O
#%--values using a cellu-
lose}water oxygen isotope fractionation factor of1.028$0.001 (Epstein et al., 1977; DeNiro and Epstein,1981).
3.3. Diatoms
Volumetric subsamples (1.0 cm3) were prepared fordiatom analysis by digestion in hot 30% H
2O
2. Diluted
aliquots of cleaned slurries were evaporated at roomtemperature onto coverslips and mounted to slides withNaphrax medium. Valve sums of 300}500 were talliedunder oil immersion (1000X) with an Olympus researchmicroscope equipped with di!erential interference con-trast optics. Raw count data were compiled into relativefrequencies to illustrate stratigraphic changes in diatomcommunities. Diatom valve concentrations were evalu-ated by the addition of a calibrated Eucalyptus spike(Wolfe, 1997). Diatom taxonomy followed primarily the#oras of Hustedt (1959), Germain (1981), Patrickand Reimer (1966, 1975), and Krammer and Lange-Be-rtalot (1986)}1991). There are many remaining enigmatictaxa, especially in the genera Gomphonema, Fragilariaand Nupela. A full taxonomic account is given inAppendix A.
The relative frequencies of dominant diatoms wereanalyzed numerically by indirect ordination using de-trended correspondence analysis (DCA; Hill and Gauch,1980), which illustrates the underlying structure of thedata set by de"ning synthetic variables (axes) to whichtaxonomic abundances exhibit unimodal responses (terBraak, 1987). The primary axes produced by DCA canfrequently be interpreted ecologically; additionally, re-current taxonomic associations can be investigated. Onlytaxa exceeding 1% relative frequency in at least onesample were used in the DCA (42 taxa). A square-roottransformation was "rst applied to the diatom frequen-cies to moderate the in#uence of the most prevalent taxa.The analysis was run under the MVSP (v. 2.1) program(Kovach, 1993).
3.4. Geochronology
Terrestrial macrofossils were not present in su$cientquantities for 14C dating. There are no carbonates in theLTCK watershed suggesting hardwater e!ects are min-imal. The contemporary radiocarbon reservoir was as-sessed by measuring the 14C activity of samples of livingsubmerged Isoetes. These results average 114% f.M. (frac-tion Modern) which, for the year A.D. 1992, is indistin-guishable from atmospheric 14C activity. This suggeststhat lake reservoir e!ects are minimal and that aquaticplants are reliable targets for 14C dating in this system.Therefore, we used Isoetes macrofossils for AMS14C measurements. Radiocarbon ages are reported with
1804 M.B. Abbott et al. / Quaternary Science Reviews 19 (2000) 1801}1820

Fig. 2. Core description, OC, and age/depth relationship for both measured and calibrated radiocarbon ages with one sigma error bars.
one sigma error as both measured (14C yr B.P.) andcalibrated ages (cal 14C yr B.P.) according to Stuiver etal. (1998), but only cal ages are discussed in the context ofthe paleo-reconstruction in order to make the LTCKrecord more directly comparable with ice core and U-series chronologies. All 14C measurements were made byaccelerator mass spectrometry (AMS) at Lawrence Liver-more National Laboratories (CAMS). An age-depthmodel has been constructed by linear interpolation of thefourteen calibrated Isoetes 14C dates (Fig. 2). Hereafter,all ages discussed are calibrated ages (cal 14C yr B.P.or ka B.P.).
4. Results
4.1. Modern surface water samples
Oxygen and hydrogen isotope ratios were measuredfor water samples from 23 lakes collected during the drywinter season along a north to south transect spanningthe Cordillera Vilcanota (143 S), Cordillera Real (163 S),Cordillera Tunari (173 S), and Cordillera Chichas (193 S)(Table 1; Fig. 1). Water samples were collected approxim-ately 20 cm below the surface in the center of the lake.These lakes are representative of di!erent hydrologicsettings, including: (1) lakes directly receiving glacial
meltwater, (2) over#owing lakes in glaciated watersheds,(3) over#owing lakes in watersheds without active gla-ciers, and (4) lakes and ponds that drop below the over-#ow level during the dry season. Results show a widerange of isotopic compositions with d18O varying be-tween !16.6 and !2.5 and d2H varying between!127 and !56& (Fig. 3).
4.2. Lithology and geochronology
Five lithostratigraphic units have been de"ned fromthe LTCK core. These are described in chronologicalorder. These units form the basis on which the otherproxies are subsequently presented (Fig. 4).
Unit 1 is characterized as a massive gray section withlow OC ((1%), low C/N ratios ((7), high silt-sizedmineral concentration ('95%), low biogenic silicavalues ((5%), high bulk density ('1 g cm~3), and highmass magnetic susceptibility (1]105 SI) (Fig. 4). Thetransition from Unit 1 into Unit 2 is identi"ed by a shiftfrom massive silts to "nely laminated sediments. Theradiocarbon age of the upper surface of the transitionfrom gray silts to organic silts is 12,720 cal 14C yr B.P.(CAMS-19243) (Table 2). The contact is di!use (6 cm)and characterized by increased OC concentration from(1 to '3%, increased C/N ratio from 6 to 8, increasedbiogenic silica from (5 to '10%, decreased dry bulk
M.B. Abbott et al. / Quaternary Science Reviews 19 (2000) 1801}1820 1805

Table 1Watershed data for lakes where modern water samples were collected
Lake Cordillera Latitude Longitude Lake elevation(m)
Headwallelevation (m)
Glacierspresent
d18O d2H
Accocanch Vilcanota 133 54@ 00A S 703 54@ 15A W 4780 5000 yes !15.0 !119Paca Cocha Vilcanota 133 54@ 38A S 713 52@ 42A W 4925 5000 yes !16.6 !124Churuyo Vilcanota 143 01@ 28A S 703 56@ 07A W 4710 5000 yes !16.5 !127Ajuyani Sorata Real 153 53@ 43A S 683 35@ 07A W 4120 4240 !9.5 !81Jankaho Real 163 04@ 25A S 683 19@ 10A W 4690 5596 yes !15.2 !115Khotia Real 163 06@ 45A S 683 20@ 22A W 4460 5589 yes !13.1 !102Unnamed Pond Real 163 07@ 40A S 683 21@ 10A W 4470 4480 !2.5 !56Khara Kkota Real 163 09@ 10A S 683 22@ 08A W 4300 5589 yes !14.6 !109Allkha Kkota Real 163 08@ 50A S 683 18@ 45A W 4510 5648 yes !15.8 !110Sora Kkota Real 163 11@ 02A S 683 20@ 40A W 4300 5650 yes !15.1 !114Taypi Chaka Kkota Real 163 12@ 10A S 683 21@ 08A W 4300 5650 yes !14.8 !112Ajwani Real 163 10@ 30A S 683 19@ 15A W 4550 5260 yes !15.2 !113Viscachani Real 163 11@ 32A S 683 07@ 24A W 4100 5300 yes !14.4 !108Sayto Tunari 173 12@ 24A S 663 22@ 33A W 4300 4820 !12.9 !98Cupetani Tunari 173 13@ 28A S 663 24@ 42A W 4400 4820 !12.6 !102Upper San Ignacio Tunari 173 14@ 40A S 663 11@ 28A W 4400 4580 !12.3 !97San Ignacio Main Tunari 173 14@ 50A S 663 11@ 45A W 4380 4580 !11.9 !97San Ignacio Pond Tunari 17314@ 52A S 663 11@ 35A W 4400 4580 !6.1 !72Mosoj Tunari 173 16@ 22A S 663 00@ 40A W 4270 4204 !9.2 !82Huallancani Tunari 173 17@ 07A S 663 00@ 50A W 4250 4204 !10.5 !88Juntutuyo Tunari 173 33@ 34A S 653 39@ 34A W 3380 3922 !4.9 !57Potosi d1 Chichas 193 38@ 20A S 653 41@ 50A W 4640 5024 !5.6 !59
density from '1 to (0.6 g cm ~3, and decreased massmagnetic susceptibility from '1]105 to (0.5]105 SI.
Unit 2 spans the time interval from 12.7 to 10.0 ka B.P.and is a "nely laminated (mm-scale) brown section withcontrast between layers alternating between faint andclear. Unlike Unit 1, this section has a clear trend fromthe base to the top characterized by increasing OC con-centration from (1 to '8%, increasing C/N ratiofrom &7 to &10, a decreasing trend in the mineralconcentration from '90 to (40%, increasing biogenicsilica from (5 to '40%, decreasing dry bulk densityfrom '1 to (0.5 g cm~3, and decreasing mass mag-netic susceptibility from '1]105 to (0.5]105 SI(Fig. 4). The transition from Unit 2 into Unit 3 occurs at9970 cal 14C yr B.P. (CAMS}10033) and is marked bya change from "nely laminated (mm-scale) to banded(cm-scale) sediments alternating between light ((5%OC) and dark layers (10% OC). The contact into the "rstlight band at the base of Unit 3 is abrupt (1 cm) andcharacterized by decreased OC concentration from '8to (4%, increased C/N ratio from 9 to 10, increasedbiogenic silica from (40 to '50%, and little change inthe already very low values of dry bulk density and massmagnetic susceptibility.
Unit 3 spans the time interval from 10.0 to 6.0 ka B.P.Unit 3 is characterized by alternating centimeter-scalebands of high ('10%) and low ((5% and lower) OCconcentration, variable C/N ratios ranging between9 and 13 with a slight increasing trend from the base to
the top, variable mineral concentration ranging from 20to '75%, high biogenic silica (generally '40%), lowbulk density ((0.4 g cm~3), and low mass magneticsusceptibility ((0.4]105 SI) (Fig. 4). The dark brownorganic-rich bands contain abundant Isoetes mega-spores. There is not a systematic change in C/N ratio,mineral concentration, or biogenic silica between thelight and dark bands, nor is there a signi"cant shift in thediatom composition or lipid biomarkers in the light anddark bands (Polissar, 1999). The transition from Unit3 into Unit 4 is identi"ed by a change from banded(cm-scale) sediments alternating between light and darklayers to a massive unit with low OC. The radiocarbonage of the lower surface of the transition from bandedorganic-rich sediments to massive gray silts is 5900 cal14C yr B.P. (CAMS-5748). The contact is di!use (7 cm)and characterized by decreased OC concentration from'10 to (2%, decreased C/N ratio from '10 to (8,no signi"cant change in biogenic silica, increased drybulk density from 0.4 to '0.5 g cm~3, and increasedmass magnetic susceptibility from 0.5 to 0.6x10⁵ SI.
Unit 4 spans the time interval from 6.0 to 2.3 ka B.P.Unit 4 is a massive gray section characterized by low OCconcentration ((2%), a trend toward lower C/N ratiosfrom &10 to &6 falling at the base of the unit, anincreasing trend in the mineral concentration from 40 to'65%, a decreasing trend in biogenic silica from &50to &30% beginning at the mid-point of the unit, anincreasing trend in dry bulk density from &0.4 to
1806 M.B. Abbott et al. / Quaternary Science Reviews 19 (2000) 1801}1820

Fig. 3. Results of d2H and d18O measurements from lake waters collected during the 1997 "eld season in the Bolivian Andes showing: (1) lakes directlyreceiving glacial meltwater plot on the MWL or just o! and have essentially the same d2H and d18O values as snow (r Cordillera Vilcanota andv Cordillera Real), (2) over#owing lakes in glaciated watersheds are generally more 18O-enriched than glacial-fed lakes (e Cordillera Vilcanota andL Cordillera Real), (3) over#owing lakes in watersheds without active glaciers are further 18O-enriched (m Cordillera Tunari), (4) lakes and ponds thatdrop below the over#ow level during the dry season are the most 18O-enriched of the lakes sampled (. Cordillera Real, n Cordillera Tunari, andh Cordillera Chichas). Rainfall (#) and snowfall (3) plot along the Meteoric Water Line (MWL) (Stimson, 1991).
'0.8 g cm~3, and an abrupt increase in mass magneticsusceptibility from (0.4]105 '1.5]105 SI at themidpoint of the unit (Fig. 4). The transition from Unit4 into 5 is marked by an abrupt change in the sedimentcharacter from massive gray silts to organic silts andradiocarbon age from 2970 cal 14C yr B.P. (CAMS-5749)to 2330 cal 14C yr B.P. (CAMS-11067). Marked changesinclude an increased OC from (1 to '5%, increasedC/N ratio from values averaging 6.8}8.0, increased bi-ogenic silica from &20 to &30%, decreased dry bulkdensity from 0.8 to 0.4 g cm~3, and decreased mass mag-netic susceptibility from '1.5]105 to (0.4]105 SI.
Unit 5 spans the time interval from 2.3 ka B.P. to thepresent. Unit 5 is a massive unit with a gradual change incolor from brown to gray at the surface. This unit ischaracterized by a decreasing trend in OC concentration
up-core, C/N ratios between 7 and 8, an increasing trendin the mineral concentration from 50 to '90%, a de-creasing trend in biogenic silica from '30 to (5%, anincreasing trend in dry bulk density from(0.4'0.7 g cm~3, and an increasing trend in massmagnetic susceptibility from (0.4]105 to '1.5]105SI) (Fig. 4). A radiocarbon age of 1340 cal 14C yr B.P.(CAMS-4980) dates the point above which mineral con-centration comprises '90% of the sediment.
4.3. d18O-8
Unit 1 is characterized by low d18O-8
values of(!14& (Fig. 5). The transition from Unit 1 into Unit2 is marked by a 3& increase in d18O
-8from !14 to
!11&. Unit 2 shows clear trends from the base to the
M.B. Abbott et al. / Quaternary Science Reviews 19 (2000) 1801}1820 1807

Fig. 4. Core data plotted on an age scale including OC, biogenic silica, C/N ratio, mineral matter, dry bulk density, and mass magnetic susceptibility.
Table 2Radiocarbon ages from LTCK, Bolivia
CAMS-d Depth (cm) Material Measured 14C Age (14C yr B.P.) Median calibrated 14C Age(Cal 14C yr B.P.)
4980 860.5 Isoetes macrofossil 1470$80 134011067 879.5 Isoetes macrofossil 2290$60 233011068 882.5 Isoetes macrofossil 2880$60 29705749 893.5 Isoetes macrofossil 3690$70 40405748 919.5 Isoetes macrofossil 5110$60 59004979 928.5 Isoetes macrofossil 5320$110 6100
10031 971 Isoetes macrofossil 6390$60 726010032 981 Isoetes macrofossil 6840$60 763010063 988.5 Isoetes macrofossil 7210$70 796010066 1011.5 Isoetes macrofossil 7960$60 881010065 1028 Isoetes macrofossil 8810$110 986010033 1054 Isoetes macrofossil 8980$70 997010064 1069.5 Isoetes macrofossil 9300$100 1024019243 1104.5 Isoetes macrofossil 10790$60 12720
top characterized by an increase in d18O-8
from &!12to &!9&. The transition from Unit 2 into Unit 3 ismarked by a 6& decrease in d18O
-8from !8 to
!14&. Unit 3 is characterized by relatively low d18O-8
values ranging from !16 to !11& with no systematicchange in the values of the d18O
-8between light and dark
bands. The transition from Unit 3 into Unit 4 is charac-terized by a &5& increase in d18O
-8from !13 to
!8&. Unit 4 has variable but generally highd18O
-8values ranging from !14 to !4&. The
transition from Unit 4 into Unit 5 is marked by anabrupt change in the sediment character and radiocar-bon age from 2970 to 2330 cal 14C yr B.P. This boundaryis marked by a 5.3& decrease in d18O
-8. Unit 5 is
characterized by relatively low d18O-8
values rangingfrom !14.3& at the surface to !10&.
4.4. d13C#%--
and d13C03'
Generally, measurements of d13C03'
and d13C#%--
fromthe same interval are correlated and d13C
03'values are
less than d13C#%--
values (Fig. 5). Unit 1 is characterizedmoderate d13C values for both d13C
#%--(!22.5&) and
d13C03'
(!22.8&). The transition from Unit 1 into Unit2 is identi"ed by a slight decrease of (1& in bothd13C
#%--and d13C
03'. Unit 2 shows clear trends from the
base to the top characterized by a slight increase of about1& for both d13C
#%--and d13C
03'. The transition from
1808 M.B. Abbott et al. / Quaternary Science Reviews 19 (2000) 1801}1820

Fig. 5. Stable isotope data plotted on an age scale including cellulose inferred d18O-8
, d13C#%--
and d13C03'
, and d15N03'
.
Unit 2 into Unit 3 is identi"ed by a slight decrease of(1& in both d13C
#%--and d13C
03'. Unit 3 is character-
ized by alternating light and dark centimeter-scale bandsof high (10% and greater) and low (5% and lower) OCconcentration. The d13C
#%--and d13C
03'values are highly
variable ranging from !26 to !23& with sedimentcellulose generally being higher. The transition from Unit3 into Unit 4 is identi"ed by a slight decrease of (1% inboth d13C
#%--and d13C
03'. Unit 4 is a massive section
characterized by both d13C#%--
and d13C03'
increasingfrom !25 to !22& with sediment cellulose beinghigher by approximately 1&. Although d13C values donot change abruptly across the transition from Unit4 into 5 both d13C
#%--and d13C
03'become increasingly
lower through time and the di!erence between sedimentcellulose and bulk sediment increases at the top of thecore. d13C values increase in the lower strata of Unit5 and then decrease towards the top of the core.
4.5. d15N03'
Bulk sediment d15N varies between values of 0 and5.4& during the Holocene (Fig. 5). Unit 1 is character-ized by a high d15N
03'value of '5&. The transition
from Unit 1 into 2 is marked by a shift to lower d15N03'
values ranging from '5 to (3&. Unit 2 has a cleartrend from the base to the top towards lower d15N
03'values ranging for from '3 to 0&. The transition fromUnit 2 into Unit 3 is identi"ed by an abrupt increase from0 to '2&. Unit 3 is characterized by alternating darkand light centimeter-scale bands of high ('10%) andlow ((5%) OC concentration. After an initial trendtoward higher d15N
03'values from 0 to '3& values
remain relatively constant ranging from 2 to 3&. Thetransition from Unit 3 into Unit 4 is identi"ed by anincrease from 3.0 to 4.5&. Unit 4 is massive sectioncharacterized by a trend toward higher d15N
03'values
ranging from &4 to &5&. The transition from Unit4 into Unit 5 is marked by a '3& decrease in d15N
03'from values averaging 5 to 2&. Unit 5 is characterized bya trend toward higher d15N
03'values from (1 to
'5&.
4.6. Diatoms
The diatom #ora in the sediments of LTCK totals 76identi"ed taxa (Appendix A). Fig. 6 shows the relativefrequencies of the 15 most abundant taxa that amount to'82% of any one sample. Four broad diatom strati-graphic zones are identi"ed. Although the four diatomstratigraphic zones broadly correlate to the "ve lithostratigraphic zones de"ned above there are notable dif-ferences. While the transitions from a glaciated water-shed to a non-glaciated catchment and back occurat approximately the same time in both the diatomand litho stratigraphic units, the middle Holoceneperiod of seasonal desiccation identi"ed in the lithostrati-graphic units, record does not appear as clearly in thediatom record. Perhaps this is because the lake desic-cated periodically throughout the early to middle Holo-cene.
The diatom record begins in the uppermost portion ofsediment Unit 1, with a #ora characterized by smallcolonial Fragilaria spp. and Aulacoseira alpigena (diatomzone 1). This assemblage persists until &11 ka B.P., atwhich time larger benthic taxa become dominant
M.B. Abbott et al. / Quaternary Science Reviews 19 (2000) 1801}1820 1809

Fig
.6.
Str
atig
raph
icse
que
nce
ofth
ere
lative
freq
uenc
ies
ofth
e15
most
abun
dan
tdi
atom
taxa
inth
eLT
CK
core
,arr
ange
dac
cord
ing
toth
eag
em
odel
ofF
ig.2.
The
four
bio
stra
tigr
aphi
czo
nes
discu
ssed
inth
ete
xtar
ede"
ned
toth
erigh
t.
1810 M.B. Abbott et al. / Quaternary Science Reviews 19 (2000) 1801}1820

Fig. 7. (A) Weight percent biogenic silica; (B) diatom valve concentrations; (C) fossil sample scores on the "rst axis of a (detrended) CorrespondenceAnalysis ordination, distinguishing lacustrine paleoenvironments according to the diatom zones illustrated in Fig. 6; and (D) taxon scores from thisordination exercise. Taxa with the highest (positive) scores in (D) are associated with glacial conditions, whereas lower scores indicate mostlyperiphytic taxa associated with lower water levels and at least occasional evaporative conditions.
co-occurrent diatoms, including several Gomphonemaspp., Cocconeis placentula var. linearis, and Epithemiaadnata (diatom zone 2). These mostly periphytic diatoms,in addition to several Achnanthes spp. and Cyclotellastelligera, become increasingly dominant after 8 ka B.P.(diatom zone 3), after which time Fragilaria spp. are onlyminor components of assemblages ((10%). However,by 2.5 ka B.P. and throughout sediment Unit 5, theFragilaria association regains importance, so that diatomzone 4 bears some resemblance to zone 1, with the excep-tions of relatively high frequencies of C. stelligera andsmall Achnanthes spp. in the former.
Diatom valve concentrations in the sediments ofLTCK exceed 108 valves cm~3 and are highest in diatomzones 2 and 3. This trend corresponds well with thebiogenic silica concentration of the sediments (Fig.7 A and B). Biogenic silica decreases more dramaticallyat the base and top of the core relative to diatom concen-trations; this is related to the small size of diatoms inthese portions of the core. Together, the absolute diatomabundance and biogenic silica trends suggest suppresseddiatom production during the late Pleistocene and thelate Holocene. The "rst two axes of Detrended Corre-spondence Analysis account for 31.4% and 9.9% of thevariance in the assemblage data. Only axis 1 results areshown (Fig. 7C and D). Diatom assemblages with highDCA axis 1 scores characterize diatom zones 1 and 4, dueto high proportions of taxa such as Fragilaria and Ach-nanthes spp., and Aulacoseira alpigena (Fig. 7D). Sampleswith the lowest DCA axis 1 scores are in zone 3, wherelarge periphytic taxa and Cyclotella stelligera dominateassemblages.
5. Discussion
5.1. Isotopic composition of modern lake water
Lake-water samples diverge from the local meteoricwater line (LMWL) as a result of the extent of evapor-ative enrichment of 18O and 2H (Fig. 3) (cf. Aravena et al.,1999). Lakes fed directly by glacial meltwater are themost depleted in 18O and 2H because water rapidlypasses through these basins without much evaporation.On the other end, of the spectrum, lakes and ponds thatannually drop below the over#ow level during the dryseason are the most enriched in 18O and 2H. The slope ofthe local evaporation line (LEL "5.1), which is prim-arily a function of relative humidity (Gon"antini, 1986),is similar to that of surface waters from closed basinselsewhere on the Bolivian and Chilean altiplano (Fritzet al., 1981). The estimated mean annual isotopic com-position of precipitation for this region is !16& ford18O and !118& for d2H as determined from theinterception of the LEL and LMWL. These values aretypical for glacial meltwater and groundwater above analtitude of 4000 m in the altiplano region (Stimson, 1991;Stimson et al., 1993; Coudrain-Ribstein et al., 1995).
The d18O and d2H data from our sampling networkindicate that lakes in the region are sensitive to variationsin P}E balance. This sensitivity is highlighted whena lake and associated catchment undergo a climaticallyinduced change in status, such as going from a glaciatedto a non-glaciated watershed or from an over#owing laketo a system that drops below the over#ow level on anannual basis. Lake depth, lake area, watershed area, and
M.B. Abbott et al. / Quaternary Science Reviews 19 (2000) 1801}1820 1811
Table 3C/N ratios and stable isotope composition of modern vegetation andsurface sediments sampled in 1994 and analyzed at the University ofAlaska at that time
InitialData
Number ofsamples
C/N d13C d15N
Aquaticvegetation
12 11.4$3.6 !24.53$2.20 4.87$1.63
Shorelinevegetation(Isoetes)
3 17.8$5.0 !26.58$0.52 4.05$1.19
Terrestrialvegetation
12 33.3$18.6 !27.51$1.33 2.16$2.17
SurfaceSediment
4 10.7$0.6 !24.85$0.22 6.57$0.35
Table 4C/N ratios and stable isotope composition of modern vegetation andsurface sediments sampled in 1997 and analyzed at the University ofWaterloo. Cellulose-inferred lake-water d18O values (cell-inf. d18O
-8)
calculated using a cellulose}water oxygen isotope fractionation factorof 1.028
C/N d18C d15N d18O#%--
cell-inf.d18O-8
Aquatic:Green algae 12.3 !22.47 5.11 14.2 !13.5Myriophyllum 10.5 !11.76 5.71 13.5 !14.1Isoetes 42.4 !22.93 3.71 17.1 !10.7
Terrestria:Puna grass 188.8 !24.85 1.19 21.9 *
Core:Top sediments 7.6 !24.93 4.69 13.3 !14.3
the presence or absence of glaciers in the catchment arefactors that in#uence lake water isotopic composition,but more intensive site-speci"c sampling is required tofully evaluate these e!ects. These preliminary data none-theless provide a useful context to identify lakes that aretoday sensitive to P}E changes and to aid in the inter-pretation of down-core cellulose d18O measurements toevaluate the paleohydrology of the lake basin.
5.2. Origin of sediment organic matter
A prerequisite for reconstructing d18O-8
history fromcellulose d18O is that the "ne-grained cellulose fractionmust be derived from an aquatic source. Both elementaland isotopic evidence suggest that this is the case for theLTCK sediments. The C/N ratio of bulk organic samplesfrom the sediment core range between 6 and 13 (Fig. 4),consistent with values measured on modern submergedaquatic vegetation from the lake (11.4$3.6; Table 3).The C/N ratios are higher for samples of Isoetes(17.8$5.0) that were collected along the margin of thelake which is exposed to subaerial conditions during thedry season. The C/N ratio for modern terrestrial vegeta-tion average 33.3$18.6, which is considerably higherthan those of aquatic plants.
Cellulose-inferred d18O-8
values obtained from theuppermost sediments of the LTCK core (!14.3&) andmodern submerged aquatic vegetation, green algae(!13.5&) and Myriophyllum (!14.1&), correspondwell with the measured lake water d18O value of!14.8& (Tables 1 and 4). The agreement suggests thatthe observed cellulose-water oxygen isotope fractiona-tion factor of 1.028$0.001 applies not only to temperateand Arctic aquatic cellulose (e.g. Edwards and McAn-drews, 1989; Duthie et al., 1996; Edwards et al., 1996;Wolfe and Edwards, 1997), but also to tropical aquaticcellulose in alpine settings, even though others have useda smaller fractionation factor (Aucour et al., 1993; Beun-ing et al., 1997). The higher cellulose-inferred d18O
-8
value obtained from Isoetes (!10.7&; Table 4) is likelydue to additional isotopic enrichment caused by evapot-ranspiration, because this sample was collected from themargin of the lake zone where the plant is not continu-ously submerged during the dry season. The e!ects ofevapotranspiration are also clearly evident in the cellu-lose d18O value of #21.9& determined on puna grass,a terrestrial plant (Table 4). Given the limitations of thissmall data set, green algae appears to be a signi"cantsource of organic matter to the o!shore (500 lm frac-tion in at least the most recent lake sediments, given thestrongly 13C-enriched signature of Myriophyllum relativeto the surface sediments (Table 4).
5.3. Late-glacial and holocene paleohydrology
If we assume an aquatic source for the "ne-grainedcellulose for the whole length of the LTCK sedimentrecord, further interpretation of the d18O
-8pro"le re-
quires separating the isotopic composition of water sup-plied to the lake integrating the isotopic signature ofsurface water, groundwater, and precipitation from hy-drologic factors that subsequently modify the isotopicratio, primarily evaporative enrichment. To investigatethe long-term oxygen isotope history of precipitation(d18O
1) in the region we compared the data from LTCK
with the ice core d18O record for the past 15 ka B.P.obtained from Nevado Sajama (Thompson et al., 1998),located on the western edge of Bolivian altiplano(18306@S, 68353@W, 6542 m; Fig. 1).
The Sajama ice core record shows a rapid 18O-de-pletion of about 6& from !15 to !21% at 14 ka B.P.Thompson et al. (1998) interpret this trend as a changefrom a warm-dry period, culminating at 14.3 ka B.P., toa cold}wet phase similar to the North Atlantic YoungerDryas. However, the '2.5 m of inorganic sediments inLTCK Unit 1 (deposited prior to 12.7 ka B.P. and not
1812 M.B. Abbott et al. / Quaternary Science Reviews 19 (2000) 1801}1820
shown in the "gures) are dominated by silt-sized mineralmatter typical of modern glacier-fed lakes in the Cordi-llera Real, suggesting that the watershed was undergoingdeglaciation. The single 18O-depleted lake-water value of!14.7% from this interval is consistent with modernlakes that are over#owing and have glaciers in the water-shed (Fig. 3). Likewise, the sparse diatom assemblagesdominated by Aulacoseira alpigena and Fragilaria sppare also similar to the modern lake sediment which isin#uenced by active glaciers in the catchment. Rapiddeglaciation beginning prior to 13.8 ka B.P. is alsodocumented in three other lakes from our regional studyspanning the latitudes of 163S to 203S (Lagunas Ajuyani,San Ignacio, and PotosmH ) and in several other studiesalong the eastern Cordillera (Mercer and Palacios, 1978;Seltzer, 1990, 1992). The evidence provided for regionaldeglaciation is inconsistent with the deglacial climaticreversal proposed by Thompson et al. (1998) spanningthe period between &14.0 and 11.5 ka B.P. Modelingstudies by Hostetler and Giorgi (1992) illustrated theimpact a large pluvial lake system has on regional cli-mate. We speculate one possible explanation for thedecrease in d18O values in the ice core may be in part theresult of local dilution of atmospheric precipitation with18O-depleted vapor derived from the formation ofpluvial lakes on the altiplano during deglaciation in theeastern cordillera.
The beginning of the Holocene in the Sajama ice coreis marked by an enrichment in 18O of 4 to about !17%at 11.5 ka B.P. suggesting either rapid warming (Thom-pson et al., 1998) or the draw-down of pluvial lakes onthe altiplano that had previously been a major source forisotopically light precipitation. LTCK Unit 2 sediments(13.1 and 10 ka B.P.) are characterized by higher OC andbiogenic silica concentration (Fig. 4) consistent with in-creased lacustrine productivity as glaciers retreated upvalley, reduced meltwater in#ux, and stabilized slopeswith the establishment of terrestrial vegetation (Abbott etal., 1997a). Although the diatom taxa typical of glaciallyin#uenced limnological conditions are present through-out Unit 2, the #ora begins to diversify after 11 ka B.P.,suggesting progressive ecological changes during thetransition towards non-glacial conditions (Fig. 7). Theincrease in cellulose-inferred lake water d18O values from!12.2 to !8.2% between 11.9 and 10.9 ka B.P. maytherefore re#ect drier conditions and increased evapor-ation associated with late Pleistocene ! early Holocenewarming and/or a reduction in glacial meltwater supplydue to warming and increased aridity.
Ice core d18O values from the Sajama ice core remainat about !17$1& during the Holocene (Fig. 8), sim-ilar to modern mean annual d18O
1(Fig. 4). Evidently,
climatic variation during the Holocene is not stronglyre#ected in centennial-scale d18O
1as recorded in the
Sajama ice core record. This suggests that variations inthe Holocene LTCK d18O
-8record are largely decoupled
from changes in d18O1
and supports our interpretationthat the observed shifts in d18O
-8are primarily driven by
evaporative enrichment and not a shift in the source ofthe precipitation.
After 10.9 ka B.P., d18O-8
returns to lower valuescharacteristic of glacier-fed lakes and remains relativelydepleted in 18O until 6 ka B.P. (the duration of Unit 3).However, sedimentological evidence suggests that lake-level was variable with multi-decadal to century-scaleperiods of low water -levels resulting from a general trendof increased aridity that began in the early Holocene(Abbott et al., 1997a). Diatom assemblages aretransitional until 8.5 ka B.P. and then are dominated byshallow-water periphytic forms that are not associatedwith proglacial conditions (Figs. 6 and 7). The diatomdata support the sedimentological data, collectively sug-gesting that glaciers were absent from the watershedduring this interval. Several possible explanations canaccount for the apparent discrepancy between the 18O-depleted results and data from other proxies. First, C/Nratios increase during this interval, possibly suggestingan increase in the contribution of terrestrial organicmatter to the lake. However, modern d18O data froma major potential terrestrial source, puna grass, is en-riched in 18O relative to aquatic sources of organic mat-ter (Table 3) and its isotopic signature would likely havebeen even higher during this arid interval because ofincreased evapotranspiration. Second, melting of relic icefrom shrinking cirque and rock glaciers may have con-tributed isotopically light meltwater to LTCK. Although,this most certainly occurred for some period followingregional deglaciation, it seems unlikely that this canentirely explain the isotopically low d18O values endur-ing for 4000 years. Third, the relative contribution ofsnowmelt depleted in 18O to LTCK increased relative tosummer rainfall, as a result of increased melting, eventhough the total annual precipitation declined. Thesnowpack may have melted completely on a seasonalbasis during this interval and stored as groundwater,o!setting the isotopic e!ects of evaporative enrichmentof lake water in LTCK, given that seasonal variations inprecipitation d18O presently vary by more than 16%(Thompson et al., 1998).
Between 6.2 and 2.3 ka B.P., sedimentological evidenceindicates LTCK Unit 4 was deposited in a shallow lakethat desiccated seasonally (Abbott et al., 1997a). Thediatom content of these sediments continues to be dom-inated by shallow-water non-glacial periphytic taxa (Fig.6). Subaerial exposure resulted in the oxidation of or-ganic matter and produced a marked unconformity be-tween 2.9 and 2.3 ka B.P. Cellulose-inferred d18O
-8values are variable, but relatively high during most of thisinterval, averaging !8.4&. This is within the range ofmodern lakes that drop to below their over#ow levelsduring the dry season (Fig. 3). Both groundwater andcatchment-derived inputs to the lake were likely reduced.
M.B. Abbott et al. / Quaternary Science Reviews 19 (2000) 1801}1820 1813

Fig
.8.
Sum
mar
ydi
agra
mco
mpar
ing:
(A)t
he
d18O
-8an
ddia
tom
DC
Ash
ow
ing
glac
ialv
s.non
-gla
cial
condi
tionsfrom
theL
TC
Kre
cord
,(B
)wat
er-lev
el#uc
tuat
ionsin
Lak
eTitic
aca
(Wirrm
ann
and
De
Oliv
eira
Alm
eida,
1987
;Wirrm
ann
etal
.,19
92;W
irrm
ann
and
Mou
rgui
art,
1995
;Abbo
ttet
al.,
1997
b;M
ourg
uiar
tet
al.,
1998
),(C
)the
d18O
and
dust
reco
rdsfrom
Nev
ado
Saja
ma
(Thom
pso
net
al.,
1998
),(D
)Jan
uar
yan
dJu
lyin
sola
tion
at203S
(Ber
ger,
1978
a,b;
Ber
geran
dLoutr
e,19
91),
(E)g
laci
alhisto
ry(S
eltz
er,1
990,
1992
),an
d(F
)plu
vial
lake
s(S
erva
ntan
dFont
es,1
978;
Gro
sjea
n,19
94;
Gro
sjea
net
al.,
1995
;C
layt
on
and
Cla
pper
ton,
1997
).R
adio
carb
onag
esfrom
pre
viou
sst
udi
esw
ere
calibr
ated
toca
lenda
rye
ars
for
com
par
ison
oftim
esc
ales
.
1814 M.B. Abbott et al. / Quaternary Science Reviews 19 (2000) 1801}1820

Snowmelt in#uxes may have also declined substantiallyat this time, contributing to strong 18O-enrichment in thelake sediment cellulose record. Lake water 18O-enrich-ment precedes the decline in OC near the transition fromUnit 3 to Unit 4 by about 300 yr (Figs. 4 and 5), indicat-ing that during the initial stages of this most arid intervallake level may have dropped, but did not completelydesiccate on a seasonal basis. A single 18O-depleted valueof !13.6% around 3.9 ka B.P. may suggest an episodeof reduced aridity or increased snowmelt in#ux spanninga century or less.
After 2.3 ka B.P., sediments of LTCK Unit 5 showa marked increase in organic matter concentration (Fig.4) suggesting that LTCK rose to the over#ow level. Anincrease in mineral matter beginning in the lower strataof Unit 5 and culminating at 1.4 ka B.P. suggests theonset of glaciation in the LTCK watershed began at2.3 ka B.P. and probably reached modern conditionsaround 1.4 ka B.P. (Fig. 4). Several of the diatom taxathat characterized late-glacial sediments regain import-ance by 2.3 ka B.P., underscoring an overall #oristicsimilarity between late-glacial and late Holocene assem-blages, both of which are associated with glacial in#ow tothe lake. Values of d18O
-8average !13.5% during this
interval (Fig. 5), consistent with the return of glacialmeltwater in#ux.
5.4. Paleohydrological inyuence on lake carbon andnitrogen cycling
Systematic variations in d13C03'
, d13C#%--
and d15N03'
conform to the stratigraphic units of LTCK (Fig. 5)suggesting a strong linkage between these isotopic signa-tures, nutrient cycling, and hydrological conditions. Al-though interpretation of these records is necessarilyspeculative, given the many factors and processes thatcan contribute to carbon and nitrogen isotope trends inlake sediments (see Collister and Hayes, 1991; Talbot andJohannessen, 1992; Hodell and Schelske, 1998; Wolfe etal., 1999), reconstruction of the LTCK carbon and nitro-gen cycling can be partially constrained within thepaleohydrological framework described in the previoussection.
The carbon isotope composition of aquatic organicmatter is primarily determined by the d13C of lake waterdissolved inorganic carbon (DIC), which is in#uenced byisotopic exchange with atmospheric CO
2, input of DIC
from the catchment, 13C-enrichment deriving from pref-erential uptake of 12C by phytoplankton during photo-synthesis, recycling of 13C-depleted carbon from thedecay of organic matter in the water column and bottomsediments, and CO
2evasion under the low atmospheric
pressure at a 4300 m elevation. Isotopic fractionationbetween the carbon source and the organic substratetypically results in a kinetic isotopic shift on the order of!20& in organic matter synthesized by C
3plants,
although this value can vary considerably depending onthe concentration of dissolved CO
2, HCO~
3uptake, and
temperature (Hollander and McKenzie, 1991; Aravenaet al., 1992).
Variables that in#uence the nitrogen isotope composi-tion of aquatic organic matter include the isotopicsignature of available nitrogen reservoirs used byphytoplankton, nitrogen isotope fractionation, andtransformations in the water column and sediments, suchas denitri"cation and ammonia volatilization, which leadto 15N-enrichment of the residual dissolved inorganicnitrogen (DIN) pool. Strong kinetic e!ects can occurduring nitrate and ammonium assimilation, althoughisotopic fractionation may not be signi"cant in environ-ments where DIN is limiting or during "xation of atmo-spheric N
2(Fogel and Cifuentes, 1993; Goericke et al.,
1994; Franc7 ois et al., 1996).In the lower part of the LTCK sediment record spann-
ing Units 1 and 2, d13C03'
and d13C#%--
values increase byabout 1% whereas d15N values decrease by about 3%.Increased primary productivity, as suggested by in-creased OC and biogenic SiO
2concentration (Fig. 4),
likely account for the carbon isotope trend owing tophotosynthesis-driven 13C-enrichment of DIC and/or re-duced carbon isotope fractionation caused by a decliningdissolved CO
2concentration. Variations in lake produc-
tivity commonly provide the dominant signal preservedin the d13C of lacustrine organic matter (e.g. McKenzie,1985; Schelske and Hodell, 1991; Meyers et al., 1993).A similar increase in the d15N
03'record might be ex-
pected due to selective uptake of 14N which would haveled to 15N-enrichment of residual DIN. This is not thecase, probably because nitrogen is limiting during timesof high productivity in the oligotrophic system leading toan increase in the abundance of N-"xing algae, whosed15N values tend to closely re#ect that of atmosphericN
2(i.e. 0%; Collister and Hayes, 1991).
Unit 3 is characterized by #uctuating, but overall highvalues for carbon, nitrogen, and biogenic silica sugges-ting higher lake productivity relative to Unit 2 (Fig. 4).However, d13C
03'and d13C
#%--values are lower probably
because of the in#uence of 13C-depleted soil-derived DICsupplied to the lake via snowmelt, groundwater, and/oroverland #ow. Hydrologic dilution of photosyntheti-cally-driven 13C-enrichment in lake sediments has re-cently been documented in several other studies (Aravenaet al., 1992; Wolfe et al., 1996, 1999, 2000), underscoringthe importance of understanding the paleohydrologicalrecord for the interpretation of lake sediment carbonisotope pro"les. Similarly, the increase in d15N
03'may
also re#ect increased DIN availability derived from hy-drologic input and a corresponding decline in N-"xers.Preferential loss of some N may have also contributed tothe increase in d15N values, as suggested by the increasein C/N values, which appears to be inconsistent with anincrease in terrestrial organic matter.
M.B. Abbott et al. / Quaternary Science Reviews 19 (2000) 1801}1820 1815

Oxidation of organic matter in Unit 4, caused by lowlake-levels and subaerial exposure, is evident in the lowconcentrations of C and N (Fig. 4). Lipid biomarkercomposition and abundance suggests poor preservationof organic material over this interval (Polissar, 1999).Both d13C
03'and d15N
03'become more positive in this
unit, likely because of preferential microbial breakdownof organic constituents containing weaker 12C and14N bonds. Similar degradational changes in d13C andd15N have been observed in water column pro"les ofsuspended marine sediment (Saino and Hatori, 1980;Altabet and McCarthy, 1986), blue-green algal mats (Be-hrens and Frishman, 1971) and peat (Macko et al., 1991).Notably, d13C
#%--shows less signi"cant changes com-
pared to d13C03'
, suggesting that the carbon isotopevalues in the cellulose fraction are not as strongly in-#uenced by diagenetic alterations.
At about 2.3 ka B.P., increasing lake levels resulted ina brief return to nutrient conditions that appear similarto those identi"ed for Unit 2, namely 13C-enrichmentresulting from increased lake productivity, and 15N-de-pletion caused by an increase in abundance of N
2-"xers.
The re-establishment of alpine glaciers in the catchmentresulted in a meltwater-dominated system by about1.4 ka B.P., with attendant changes towards lowerd13C
03'and d13C
#%--values, and higher d15N
03'. These
changes are possibly related to in#uxes of soil-derived13C-depleted DIC, and an increase in DIN supply, re-spectively.
5.5. Regional paleorecords and insolation forcing
Overall, the regional paleoclimate signal appears to beconsistent over century to millennial timescales acrossthe altiplano. Fig. 8 summarizes the results from a seriesof records including LTCK, Lake Titicaca, Sajama,pluvial lakes on the altiplano, and the glacial history ofthe region.
Numerous studies on Lake Titicaca document water-level #uctuations during the Holocene and are generallyconsistent with the record from LTCK. Water levels inLake Titicaca were between 50 and 85 m lower duringthe early and middle Holocene (Wirrmann and De Ol-iveira Almeida, 1987; Seltzer et al., 1998) when glacierswere absent in the LTCK watershed. Mourguiart et al.(1998) document a period of #ooding at &8.8 ka B.P.and a dry event at &6.1 ka B.P. noted by arrows in Fig.8. The #ooding at &8.8 ka B.P. occurred just after, orpossibly during, the onset of more d18O-depleted lakewater values in LTCK suggesting the onset of slightlywetter conditions after a very arid period during deglaci-ation. The dry event in Lake Titicaca at &6.1 ka B.P.occurred at the onset of the period of seasonal desicca-tion in LTCK between 6.1 and 2.3 ka B.P. (Fig. 8). Waterlevels rose to near the over#ow level in Lake Titicacaaround 3.5 ka B.P. (Mourguiart, 1990; Wirrmann et al.,
1992; Wirrmann and Mourguiart, 1995; Abbott et al.,1997b; Mourguiart et al., 1998), however LTCK con-tinued to desiccate on a seasonal basis until 2.3 ka B.P.This discrepancy suggests conditions became wetter inthe northern reaches of the Lake Titicaca watershedprior to 3.5 ka B.P. while the southernmost section re-mained dry. A single d18O measurement from LTCK at3.8 ka B.P. is depleted relative to the other data fromUnit 4 suggesting a wet phase of short duration aroundthis time. A marked lowstand in Lake Titicaca between2.4 and 2.2 ka B.P. culminated around the onset of wetterconditions and the return of glaciers to the LTCK water-shed after 2.3 ka B.P.
The dust record from the Sajama ice core contains fournotable events indicated by arrows in Fig. 8 between 5.55and 2.35 ka B.P. that occurred during the period whenLTCK desiccated on a seasonal basis. The source of thedust is likely from the salt #ats between 18 and 213S,suggesting this arid period was a regional phenomenon.Interestingly, the most recent of these dust events occur-red at 2.35 ka B.P., just prior to the onset of wetterconditions in the LTCK watershed, and after the onset ofhigher water levels in Lake Titicaca.
Late Pleistocene glaciation in the region culminatedbetween 16.7 and 14.0 ka B.P. followed by deglaciationbetween 14.0 and 11.2 ka B.P. (Seltzer, 1990, 1992). Thereis no evidence for early or middle Holocene glaciation.Neoglaciation occurred after 2.3 ka in LTCK andLaguna Viscachani, also in the Cordillera Real (Seltzer,1990; Abbott et al., 1997a).
The record from pluvial lakes in the region roughlytracks that of the glacial history. Dates for the Tauca highlake phase range from 16.2 to 13.4 ka B.P. (Clayton andClapperton, 1997) or to 12.3 ka B.P. (Grosjean et al., 1995).A second high lake phase, the Coipasa event, occurredbetween 10.5 and 9.5 ka B.P. (Sylvestre et al., 1999). Themagnitude of the second event was considerably smallerand of shorter duration. Both the record of the glacialhistory and the pluvial lakes indicate arid conditions in theregion after the last local glacial maximum at approxim-ately 16.2 ka B.P. (Clayton and Clapperton, 1997).
We hypothesized previously that lower summer in-solation during the early and middle Holocene resultedin decreased summer precipitation and arid conditionson the altiplano (Abbott et al., 1997a; Martin et al., 1997;Seltzer et al., 2000). Likewise, increased winter insolationappears to have resulted in enhanced melting duringwinter months. We contend that during the Holocene,when boundary conditions were not a!ected by changesin global ice volume or #uctuating sea level, millennial-scale shifts in the monthly distribution of insolationdrove changes in the P}E balance across the equatorialregion. For example, during the middle Holocene, whensummer (January) insolation at 203S was 4}6% lowerrelative to present, a marked dry phase occurredthat resulted in a '50 m lowering of Lake Titicaca
1816 M.B. Abbott et al. / Quaternary Science Reviews 19 (2000) 1801}1820

(Wirrmann and Fernando De Oliveira, 1987; Seltzer etal., 1998; Cross et al., 2000). At the same time, alpineglaciers disappeared from catchments lower than 5500 m(Abbott et al., 1997a). Corroborating evidence comesfrom the northern hemisphere tropics, where middle Holo-cene winter insolation (January) at 103N was 4 to 6%greater than today, resulting in conditions wetter than anyother period in the past 12 ka (Hodell et al., 1991).
During the late Holocene, water levels in Lake Titicacarecord an overall rising trend with renewed cirque glacieractivity in the Cordillera Real. Accumulation on Sajamaincreased concomitantly (Thompson et al., 1998). Wetterperiods apparently result from enhanced convectiondriven by increased summer insolation. Greater precipi-tation likely resulted from increased seasonality resultingin warmer summers and cooler winters and increasedsea-level pressure over the ocean and decreased sea-levelpressure over land, resulting in increased water-vaportransport over the continent. Increased summer precipi-tation coupled with increased summer cloudiness anddecreased winter insolation therefore result in an increasein the net P}E balance. This is supported by the work ofFrancou et al. (1995) and Ribstein et al. (1995) that showsincrease in modern-day meltwater production from theZongo Glacier during years with lower precipitation,since reduced cloud cover results in increased incidentsolar radiation, causing warmer temperatures and en-hanced ablation. In contrast, years with higher precipita-tion have more cloud cover and lower incident radiation,leading to cooler temperatures and lower melting rates.Kull and Grosjean (1998) show the importance of albedochanges to climate illustrating that clearly other factorsare important in#uences on precipitation.
6. Conclusions
The implication of this multiproxy investigation is thatHolocene environmental conditions in the CordilleraReal were highly dynamic on centennial to millennialtime-scales. Concordant isotopic and biological proxies,including down-core variability of cellulose-inferredd18o
-8values on the order of 10&, indicate that funda-
mental changes in paleohydrological regimes occurredseveral times during the Holocene. Comparison of theLTCK record with other paleoclimate records in theregion illustrates a consistent overall pattern of aridityfrom the late glacial through the middle Holocene. Thee!ect of changing insolation patterns on precipitationappears to govern broadly the late glacial and middleHolocene aridity at the regional scale, but does notexplain the century-scale variability that demonstrablyexists. Furthermore, there is a notable discrepancy be-tween the timing of water level rise in Lake Titicacaaround 3.5 ka B.P and the onset of wetter conditions inthe LTCK watershed at 2.3 ka B.P. This suggests wetter
conditions occurred in the northern reaches of theTiticaca watershed "rst resulting in rising water levels inLake Titicaca while LTCK continued to desiccate sea-sonally. Finally, we note that the last 2.3 ka has been thewettest period during the Holocene on the altiplano andadjacent cordillera, resulting in the re-inception and sub-sequent growth of alpine glaciers. This is an especiallyimportant point, given the high sensitivity of the regionto climatically induced hydrological changes, a rapidlygrowing population, and limited water resources, espe-cially during the winter dry season, when glacialmeltwater is an important source of water for municipaluse and electrical production.
Acknowledgements
We thank Donald Rodbell and Pratigya Polissar fortheir assistance in the "eld and Bruce Finney for hisanalyses of vegetation and sediment samples. We thankLonnie Thompson for supplying the data from theSajama ice core. Emi Ito and Platt Bradbury workedvery hard to help us revise an earlier manuscript, anddeserve special thanks. This research was funded by NSFgrant ATM-9632267 to M.B. Abbott and ATM-9613991to G.O. Seltzer.
Appendix A. Diatoms identi5ed from the LTCK core.
Achnanthes hungarica Grun.Achnanthes kuelbsii Lange-BertalotAchnanthes lanceolata (BreH b.) Grun.Achnanthes laterostrata Hust.Achnanthes levanderi Hust.Achnanthes minutissima KuK tz.Achnanthes minutissima var. macrocephala Hust.Achnanthes montana KrasskeAchnanthes peragalli Brun and HeH ribaudAchnanthes rossi Hust.Achnanthes saccula CarterAchnanthes spp.Amphora libyca Ehr.Amphora perpusilla Grun.Aulacoseira alpigena (Grun.) KrammerBrachysira vitrea (Grun.) Ross in HartleyBrachysira zellensis (Grun.) Round and MannCocconeis diminuta Pant.Cocconeis placentula var. lineata (Ehr.) VanH.Craticula halophila (Grun. ex VanH.) MannCyclotella stelligera (Cleve and Grun. in Cleve) VanH.Cymbella aznis KuK tz.Cymbella angustata (W.Sm.) CleveCymbella cistula (Ehr. in Hempr. and Ehr.) KirchnerCymbella gracilis (Rabh.) CleveCymbella minuta Hilse ex Rabh.Denticula kuetzingii Grun.
M.B. Abbott et al. / Quaternary Science Reviews 19 (2000) 1801}1820 1817

Diploneis ovalis (Hilse) CleveEpithemia adnata (KuK tz.) BreH b.Eunotia hexaglyphis Ehr.Eunotia incisa Greg.Eunotia naegelii MigulaEunotia pectinalis var. ventricosa Grun.Eunotia pectinalis var. minor (Grun.) Rabh.Eunotia spp.Fragilaria capucina Desmaz.Fragilaria construens var. venter (Ehr.) Grun.Fragilaria leptostauron (Ehr.) Hust.Fragilaria microstriata MarciniakFragilaria pinnata Ehr.Fragilaria pinnata var. lancettula (Schumann) Hust.Fragilaria virescens RalfsGomphonema acuminatum Ehr.Gomphonema dichotonum KuK tz.Gomphonema gracile Ehr.Gomphonema parvulum KuK tz.Gomphonema pumilum (Grun.) Reichardt andLange-BertalotGomphonema spp.Krasskella kriegeriana (Krasske) Ross and SimsNavicula atomus (KuK tz.) Grun.Navicula capitata var. hungarica (Grun.) RossNavicula cryptotenella Lange-BertalotNavicula gastrum (Ehr.) KuK tz.Navicula mutica KuK tz.Navicula pseudoscutiformis Hust.Navicula pupula KuK tz.Navicula radiosa KuK tz.Navicula rhynchocephala KuK tz.Navicula schoenfeldii Hust.Navicula spp.Nitzschia amphibia Grun.Nitzschia dissipata (KuK tz.) Grun.Nitzschia gracilis HantzschNitzschia hantzschiana Rabh.Nitzschia romana Grun.Nizschia frustulum (KuK tz.) Grun.Nupela spp.Pinnularia abaujensis (Pant.) RossPinnularia borealis Ehr.Rhopalodia gibba (Ehr.) O. MuK llerStauroneis anceps Ehr.Surirella ovalis BreH b.Surirella ovata KuK tz.Synedra parasitica (W.Sm.) Hust.Synedra ulna Ehr.Synedra spp.
References
Abbott, M.B., Seltzer, G.O., Kelts, K.R., Southon, J., 1997a. HolocenePaleohydrology of the Tropical Andes from Lake Records. Quater-nary Research 47, 70}80.
Abbott, M.B., Binford, M.W., Brenner, M., Kelts, K.R., 1997b. A 350014C yr high-resolution record of lake level changes in Lake Titicaca,Bolivia/Peru. Quaternary Research 47, 169}180.
Aceituno, P., Montecinos, A. 1993. Circulation anomalies associatedwith dry and wet periods in the South American Altiplano, FourthInternational Conference on Southern Hemisphere Meteorologyand Oceanography, American Meteorological Society, pp. 330}331.
Altabet, M.A., McCarthy, J.J., 1986. Vertical patterns in 15N naturalabundance in PON from the surface waters of warm-core rings.Journal of Marine Research 44, 185}201.
Aravena, R., Warner, B.G., MacDonald, G.M., Hanf, K.I., 1992. Car-bon isotopic compositions of lake sediments in relations to lakeproductivity and radiocarbon dating. Quaternary Research 37,333}345.
Aravena, R., Suzuki, O., Pena, H., Pollastri, A., Fuenzalida, H., Grilli,A., 1999. Isotopic composition and origin of the precipitation inNorthern Chile. Applied Geochemistry 14, 89}100.
Aucour, A.M., Hillaire-Marcel, C., Bonne"lle, R., 1993. A 30,000 yearrecord of 13C and 18O changes in organic matter from an equatorialpeatbog. In: Swart, P.K., Lohmann, K.C., McKenzie, J., Savin, S.(Eds.), Climate change in continental Isotopic Records, Vol. 78.American Geophysical Union Geophysical Monograph, pp.343}351.
Behrens, E.W., Frishman, S.A., 1971. Stable carbon isotopes in blue-green algal mats. Journal of Geology 79, 95}100.
Berger, A., 1978a. Long-term variations of daily insolation and Quater-nary climatic changes. Journal of Atmospheric Science 35,2362}2367.
Berger, A. 1978b. A simple algorithm to compute long term variationsof daily or monthly insolation. Contribution No. 18, UniversiteHCatholique de Louvian, Institut d'Astronomie et de Geophysique,G. Lemaitre, Louvian-la-Neuve, B-1348 Belgique.
Berger, A., Loutre, M.F., 1991. Insolation values for the climate of thelast 10 million years. Quaternary Science Reviews 10, 297}317.
Beuning, K.R.M., Kelts, K., Ito, E., Johnson, T.C., 1997. Paleohydrol-ogy of Lake Victoria, East Africa, inferred from 18O/16O ratios insediment cellulose. Geology 25, 1083}1086.
Binford, M.W., Kolata, A.L., Brenner, M., Janusek, J., Abbott, M.B.,Curtis, J., 1997. Climate variation and the rise and fall of an Andeancivilization. Quaternary Research 47, 171}186.
Clayton, J.D., Clapperton, C.M., 1997. Broad synchrony of alate-glacial glacier advance and the highstand of paleolake Taucain the Bolivian Altiplano. Journal of Quaternary Science 12,169}182.
Coleman, M.L., Shepherd, T.J., Durham, J.J., Rouse, J.E., Moore, G.R.,1982. Reduction of water with zinc for hydrogen isotope analysis.Analytical Chemistry 54, 993}995.
Collister, J.W., Hayes, J.M., 1991. A preliminary study of the carbonand nitrogen isotope biogeochemistry of lacustrine sedimentaryrocks from the Green River Formation, Wyoming, Utah and Col-orado. United States Geological Survey Bulletin, 1973-A-G,C1}C16.
Coudrain-Ribstein, A., Prats, B., Quintanilla, J., Zuppi, G.M., Cahuaya,D., 1995. Salinidad del recurso hidrico subterraneo del AltiplanoCentral. Bull. Inst. Fr. Studes Andines 24, 483}493.
Cross, S.L., Baker, P.A., Seltzer, G.O., Fritz, S.C., Dunbar, R.B., 2000.A new estimate of the Holocene lowstand level of Lake Titicaca,implications for tropical paleohydrology. The Holocene 10, 21}32.
DeMaster, D.J., 1981. The supply and accumulation of silica in themarine environment. Geochemica et Cosmochimica Acta 45,1715}1732.
DeNiro, M.J., Epstein, S., 1981. Isotopic composition of cellulose fromaquatic organisms. Geochemica et Cosmochimica Acta 42, 495}506.
Duthie, H.C., Yang, J.R., Edwards, T.W.D., Wolfe, B.B., Warner, B.G.,1996. Hamilton Harbor, Ontario: 8300 years of limnological andenvironmental change inferred from microfossil and isotopic analy-sis. Journal of Paleolimnology 15, 79}97.
1818 M.B. Abbott et al. / Quaternary Science Reviews 19 (2000) 1801}1820

Edwards, T.W.D., Buhay, W.M., Elgood, R.J., Jiang, H.B., 1994. Animproved nickel-tube pyrolysis method for oxygen isotope analysisof organic matter and water. Chemical Geology (Isotope Geosci-ence Section) 114, 179}183.
Edwards, T.W.D., Elgood, R.J., Wolfe, B.B., 1997. Cellulose extractionfrom lake sediments for 18O/16O and 13C/12C analysis. In: Environ-mental Isotope Laboratory Technical Procedure 28.0. University ofWaterloo, Waterloo, 4 pp.
Edwards, T.W.D., McAndrews, J.H., 1989. Paleohydrology of a Cana-dian Shield lake inferred from 18O in sediment cellulose. CanadianJournal of Earth Sciences 26, 1850}1859.
Edwards, T.W.D., Wolfe, B.B., MacDonald, G.M., 1996. In#uence ofchanging atmospheric circulation on precipitation 18O-temperaturerelations in Canada during the Holocene. Quaternary Research 46,211}218.
Epstein, S., Mayeda, T.K., 1953. Variations in the 18O/16O ratio innatural waters. Geochimica et Cosmochimica Acta 4, 213.
Epstein, S., Thompson, P., Yapp, C.J., 1977. Oxygen and hydrogenisotopic ratios in plant cellulose. Science 198, 1209}1215.
Fisher, M.M., Brenner, M., Reddy, K.R., 1992. A simple, inexpensivepiston corer for collecting undisturbed sediment/water interfacepro"les. Journal of Paleolimnology 7, 157}161.
Fogel, M.L., Cifuentes, L.A., 1993. Isotope fractionation during pri-mary production. In: Engel, M.H., Macko, S.A. (Eds.), OrganicGeochemistry. Plenum Press, New York, pp. 73}98.
Franc7 ois, R., Pilskaln, C.H., Altabet, M.A., 1996. Seasonal variation inthe nitrogen isotopic composition of sediment trap materials col-lected in Lake Malawi. In: Johnson, T.C., Odada, E.O. (Eds.), TheLimnology, Climatology and Palaeoclimatology of the East AfricanLakes. Gordon and Breach, Amsterdam, pp. 241}250.
Francou, B., Ribstein, P., Saravia, R., Tiriau, E., 1995. Monthlybalance and water discharge of an inter-tropical glacier: ZongoGlacier, Cordillera Real, Bolivia 163S. Journal of Glaciology 41,61}67.
Fritz, P., Suzuki, O., Silva, C., Salati, E., 1981. Isotope Hydrology ofgroundwaters in the Pampa del Tamarugal, Chile. Journal of Hy-drology 53, 161}184.
Germain, H., 1981. Flore des diatomeH es, eaux douces et sauma( tres duMassif Armoricain et des contreH es voisines d'Europe occidentale.SocieH teH Nouvelle des ED ditions BoubeH e, Paris, 444 pp.
Goericke, R., Montoya, J.P., Fry, B., 1994. Physiology and isotopicfractionation in algae and cyanobacteria. In: Lajtha, K., Michener,R.H. (Eds.), Stable Isotopes in Ecology and Environmental Science.Blackwell, Oxford, pp. 187}221.
Gon"antini, R., 1986. Environmental isotopes in lake studies. In: Fritz,P., Fontes, J.C. (Eds.), Handbook of Environmental Isotope Geo-chemistry, Vol. 2. Elsevier, New York, USA, pp. 113}168.
Gouze, P., Argollo, J., Saliege, J.-F., Servant, M., 1986. InterpreH tationpaleH oclimatique des oscillations des glaciers au cours des 20 derniersmilleH naires dans les reH gions tropicales: exemple des AndesBoliviennes. Comptes Rendus de L'AcadeHmie des Sciences Paris,SeH rie II 303, 219}223.
Grootes, P.M., Stuiver, M., Thompson, L.G., Mosley-Thompson, E.,1989. Oxygen isotope changes in tropical ice. Quelccaya, Peru.Journal of Geophysical Research 94, 1187}1194.
Grosjean, M., 1994. Paleohydrology of the Laguna LejmHa (north ChileanAltiplano) and climatic implications for late-glacial times.Palaeogeography, Palaeoclimatology, Palaeoecology 109, 89}100.
Grosjean, M., Geyh, M.A., Messerli, B., Schotterer, U., 1995. Late-glacial and early Holocene lake sediments, ground-water formationand climate in the Atacama Altiplano 22}243S. Journal of Paleolim-nology 14, 241}252.
Hill, M.O., Gauch, H.G., 1980. Detrended Correspondence Analysis: animproved ordination technique. Vegetatio 42, 47}58.
Hodell, D.A., Curtis, J.H., Jones, G.A., Higuera-Gundy, A., Brenner, M.,Binford, M.W., Dorsey, K.T., 1991. Reconstruction of Caribbeanclimate change over the past 10,500 years. Nature 352, 790}793.
Hodell, D.A., Curtis, J.H., Brenner, M., 1995. Possible role of climate inthe collapse of Classic Maya civilization. Nature 375, 391}394.
Hodell, D.A., Schelske, C.L., 1998. Production, sedimentation, isotopiccomposition of organic matter in Lake Ontario. Limnology andOceanography 43, 200}214.
Ho!man, J.A.J. 1975. Climatic Atlas of South America. World Me-teorological Organization, Ginebra, Hungary.
Hollander, D.J., McKenzie, J.A., 1991. CO2
control on carbon-isotopefractionation during aqueous photosynthesis: a paleo-pCO
2ba-
rometer. Geology 19, 929}932.Hostetler, S.W., Giorgi, F., 1992. Use of a regional atmospheric
model to simulate lake-atmosphere feedbacks associated with Pleis-tocene Lakes Lahontan and Bonneville. Climate Dynamics 7,39}44.
Hustedt, F., 1959. Die Kieselalgen Deutschlands, OG sterreichs und derSchweiz, Teil II.. In: Rabenhorst, T. (Ed.), Kryptogamen-Flora vonDeutschland. OG sterreich und der Schweizg. Academische Verlags-gesellschaft, Leipzig, 845 pp.
Kessler, A., 1988. Die Schwankungen des Wasserhaushaltes desuK damerikanischen Altiplano und das Weltklima v. Jahrbuch derGeographischen Gesellschaft zu Hannover 139}159.
Kovach, (1993). MVSP Plus Version 2.1 users' manual addendum.Kovach Computing Services, Aberystwyth, U.K, pp 16.
Krammer, K., Lange-Bertalot, H., 1986}1991. Bacillariophyceae 1 Teil:Naviculaceae, 876 pp. (1986); 2 Teil: Bacillariaceae, Epithemiaceae,Surirellaceae, 596 pp. (1988); 3 Teil: Centrales, Fragilariaceae, Eu-notiaceae, 576 pp. (1991a); 4 Teil: Achnanthaceae, Kritische ErgaK n-zungen zu Navicula (Lineolatae) und GomphonemaGesamtliteraturverzeichnis, 437 pp. (1991b) In: Ettl, H., Gerlo!, H.,Heynig H., Mollenhauer D. (Eds.), SuK bwasser#ora von Mit-teleuropa 2/1}4. Gustav Fischer, Stuttgart.
Kull, C., Grosjean, M., 1998. Albedo change, Milankovitch forcing, lateQuaternary climate changes in the central Andes. Climate Dynam-ics 14, 871}881.
MacDonald, G.M., Edwards, T.W.D., Moser, K.A., Pienitz, R., Smol,J.P., 1993. Rapid response of treeline vegetation and lakes to pastclimate warming. Nature 361, 243}246.
Macko, S.A., Engel, M.H., Hartley, G., Hatcher, P., Helleur, R., Jack-man, P., Silfer, J.A., 1991. Isotopic compositions of individualcarbohydrates as indicators of early diagenesis of organic matter inpeats. Chemical Geology 93, 147}161.
Martin, L., Bertaux, J., Correge, T., Ledru, M.P., Mourguiart, P.,Sifeddine, A., Soubies, F., Wirrmann, D., Sugiro, K., Turcq, B., 1997.Astronomical forcing of contrasting changes in Tropical SouthAmerica between 12,400 and 8800 cal yr B.P. Quaternary Research47, 117}122.
McKenzie, J.A., 1985. Carbon isotopes and productivity in the lacus-trine and marine environment. In: Stumm, W. (Ed.), ChemicalProcesses in Lakes. Toronto, Wiley, pp. 99}118.
Mercer, J.H., Palacios, O., 1978. Radiocarbon dating of the last gla-ciation in Peru. Geology 5, 600}604.
Meyers, P.A., Takemura, K., Horie, S., 1993. Reinterpretation of LateQuaternary sediment chronology of Lake Biwa, Japan, from cor-relation with marine glacial-interglacial cycles. Quaternary Re-search 39, 154}162.
Mourguiart, P., 1990. Une approche nouvelle du probleme poseH par lesreconstrutions des paleH oniveaux lacustres: utilisation d'une fonctionde transfert baseH e sur les faunes d'ostracodes. GeH odynamique 5,151}166.
Mourguiart, P., Correge, T., Wirrmann, D., Argollo, J., Montenegro,M.E., Pourchet, M., Carbonel, P., 1998. Holocene paleohydrologyof Lake Titicaca estimated from an ostracod-based transferfunction. Palaeogeography Palaeoclimatology Palaeoecology 143,51}72.
Patrick, R., Reimer, C.W., 1966. The Diatoms of the United Statesexclusive of Alaska and Hawaii. Academy of Natural Sciences ofPhiladelphia Monograph 13, Vol. 1. 688 pp.
M.B. Abbott et al. / Quaternary Science Reviews 19 (2000) 1801}1820 1819
Patrick, R., Reimer, C.W., 1975. The Diatoms of the United Statesexclusive of Alaska and Hawaii. Academy of Natural Sciences ofPhiladelphia Monograph 13, Vol. 2 Part 1. 213 pp.
Polissar, P.J., 1999. Lipid biomarker, elemental and isotopic evidencefor lacustrine organic matter preservation and source: Lago TaypiChaka Kkota, Bolivia. Masters Thesis, University of Mass-achusetts.
Ribstein, P., Tiriau, E., Francou, B., Saravia, R., 1995. Tropical climateand glacier hydrology: a case study in Bolivia. Journal of Hydrology165, 221}234.
Roche, M.A., Bourges, J.C., Mattos, R., 1992. Climatology and hydrol-ogy of the Lake Titicaca basin. In: Dejoux, C., Iltis, A. (Eds.), LakeTiticaca: a Synthesis of Limnological Knowledge. Kluwer AcademicPublishers, Boston, pp. 63}83.
Saino, T., Hatori, A., 1980. 15N natural abundance in oceanic sus-pended particle matter. Nature 283, 752}754.
Schelske, C.L., Hodell, D.A., 1991. Recent changes in productivity andclimate of Lake Ontario detected by isotopic analysis of sediments.Limnology and Oceanography 36, 961}975.
Seltzer, G.O., 1990. Recent glacial history and paleoclimate of thePeruvian-Bolivian Andes. Quaternary Science Reviews 9, 137}152.
Seltzer, G.O., 1992. Late Quaternary glaciation of the Cordillera Real,Bolivia. Quaternary Science Reviews 7, 87}98.
Seltzer, G.O., Cross, S., Baker, P., Dunbar, R., Fritz, S., 1998. High-resolution seismic re#ection pro"les from Lake Titicaca,Peru/Bolivia: evidence for Holocene aridity in the tropical Andes.Geology 26, 167}170.
Seltzer, G.O., Rodbell, D.T., Burns, S., 2000. Isotopic evidence for lateQuaternary climatic change in tropical South America. Geology 28,35}38.
Servant, M., Fontes, J.-C., 1978. Les lacs quaternaires des hauts pla-teaux des Andes Boliviennes: premieres interpretations paleoc-limatiques. Cahiers ORSTOM, Serie Geologie 10, 9}23.
Sternberg, L.S.L., 1989. Oxygen and hydrogen isotope ratios in plantcellulose; mechanisms and applications. In: Rundel, P.W., Ehlerin-ger, J.R., Nagy, K.A. (Eds.), Stable Isotopes in Ecological Research.Springer, New York, pp. 124}141.
Stimson, J., 1991. Isotopic and geochemical evolution of groundwaters inCochabamba Valley, Bolivia. Masters Thesis, University of Waterloo.
Stimson, J., Frape, S.K., Drimmie, R.J., Rudolph, D.L., 1993. Causes ofgroundwater salinization in a low-lying area of Cochabamba,Bolivia. In: Isotope Techniques in Studying Past and Current En-vironmental Changes in the Hydrosphere and the Atmosphere.Proceeding of an International Symposium, IAEA-SM-329, pp.185}198.
Stuiver, M., Reimer, P.J., Bard, E., Beck, J.W., Burr, G.S., Hughen, K.A.,Kromer, B., McCormac, F.G., v. d. Plicht, J., Spurk, M., 1998.INTCAL98 Radiocarbon age calibration 24,000-0 cal BP.Radiocarbon 40, 1041}1083.
Sylvestre, F., Servant, M., Servant-Vildary, S., Causse, C., Fournier, M.,Ybert, J.P., 1999. Lake-level chronology on the southern BolivianAltiplano (183}233S) during late-glacial time and the early Holo-cene. Quaternary Research 51, 54}66.
Talbot, M.R., Johannessen, T., 1992. A high resolution paleoclimaticrecord for the last 27,500 years in tropical West Africa from thecarbon and nitrogen isotopic composition of lacustrine organicmatter. Earth and Planetary Science Letters 110, 23}37.
ter Braak, C.J.F., 1987. Ordination. In: Jongman, R.H.G., terBraak, C.J.F., VanTongeren, O.F.R (Eds.), Data Analysisi inCommunity and Landscape Ecology. Pudoc, Wageningen, pp.91}173.
Thompson, L.G., Mosley-Thompson, E., Morales, B., 1984. El Nin8 oSouthern Oscillation events recorded in the stratigraphy of thetropical Quelccaya ice cap, Peru. Science 226, 50}53.
Thompson, L.G., Davis, M.E., Mosley-Thompson, E., Sowers, T.A.,Henderson, K.A., Zagorodnov, V.S., Lin, P.-N., Mikhalenko, V.N.,Campen, R.K., Bolzan, J.F., Cole-Dai, J., Francou, B., 1998.A 25,000-year tropical climate history from Bolivian ice cores.Science 282, 1858}1864.
Wirrmann, D., Fernando De Oliveira Almeida, L., 1987. Low Holocenelevel (7700 to 3650 years ago) of Lake Titicaca (Bolivia).Palaeogeography, Palaeoclimatology, Palaeoecology 59, 315}323.
Wirrmann, D., Mourguiart, P., 1995. Late Quaternary spatio-temporallimnological variations in the Altiplano of Bolivia and Peru. Quat-ernary Research 43, 344}354.
Wirrmann, J.P., Ybert, J.P., Mourguiart, P., 1992. A 20,000 yearspaleohydrological record from Lake Titicaca. In: Dejoux, C., Iltis,A. (Eds.), Lake Titicacaa Synthesis of Limnological Knowledge.Kluwer Academic Publishers, Boston, pp. 40}48.
Wolfe, A.P., 1997. On diatom concentrations in lake sediments: re-sults of an inter-laboratory comparison and other experimentsperformed on a uniform sample. Journal of Paleolimnology 18,61}66.
Wolfe, B.B., Edwards, T.W.D., 1997. Hydrologic control on the oxy-gen-isotope relation between sediment cellulose and lake water,western Taimyr Peninsula, Russia: implications for the use of sur-face-sediment calibrations in paleolimnology. Journal of Paleolim-nology 18, 283}291.
Wolfe, B.B., Edwards, T.W.D., Aravena, R., 1999. Changes in carbonand nitrogen cycling regimes during tree-line retreat recorded in theisotopic content of lacustrine organic matter, western Taimyr Pen-insula Russia. The Holocene 9, 215}222.
Wolfe, B.B., Edwards, T.W.D., Aravena, R., MacDonald, G.M., 1996.Rapid Holocene hydrologic change along boreal treeline revealedby d13C and d18O in organic lake sediments. Northwest Territories,Canada. Journal of Paleolimnology 15, 171}181.
Wolfe, B.B., Edwards, T.W.D., Duthie, H.C., 2000. A 6000-year recordof interaction between Hamilton Harbour and Lake Ontario:quantitative assessment of recent hydrologic disturbance using13C in lake sediment cellulose. Aquatic Ecosystem Health andManagement 3, 47}54.
Wright, H.E., Mann, D.H., Glaser, P.H., 1984. Piston corers for peatand lake sediments. Ecology 65, 657}659.
Yakir, D., 1992. Variations in the natural abundance of oxygen 18 anddeuterium in plant carbohydrates. Plant Cell Environment 15,1005}1020.
1820 M.B. Abbott et al. / Quaternary Science Reviews 19 (2000) 1801}1820