holistic approach to monitoring
TRANSCRIPT

Thank you to our Sponsors
A Holistic Approach to MonitoringMelanie Cey – Yardi Systems Inc.
Media Sponsor:

@melaniemj
Systems Analyst in DevOps (Web Operations) @ Yardi
• 5 years Programming• 3.5 years Team Lead/Project Manager• 4 years Systems Administration/Analysis

Because
• Customers should not alert you to failure• Business metrics matter• When something fails you need enough info to know why• Agile teams release frequently• No one can afford to be reactive

When you release code…

Monitoring Cycles

Definition: What to measure
• Business Metrics & Events- Login/logout- Sign up, buy something- Sent email
• System Events, Performance and Utilization Metrics- Web Service Call details (counter / time taken)- Deployments- Cache system (e.g. Redis or other) hits / misses- Environment performance
• Failure Metrics- Exceptions, segregated by type / app / server of origin- Number and type of errors that reached customers

Code Collection

Code Collection – Add / Refine Stats
• Developer Friendly Platform- Stats need to be able to be added ‘without permission’- Create own dashboards- Tools with APIs- Build client library for sending stats
Code Collection – Graphite
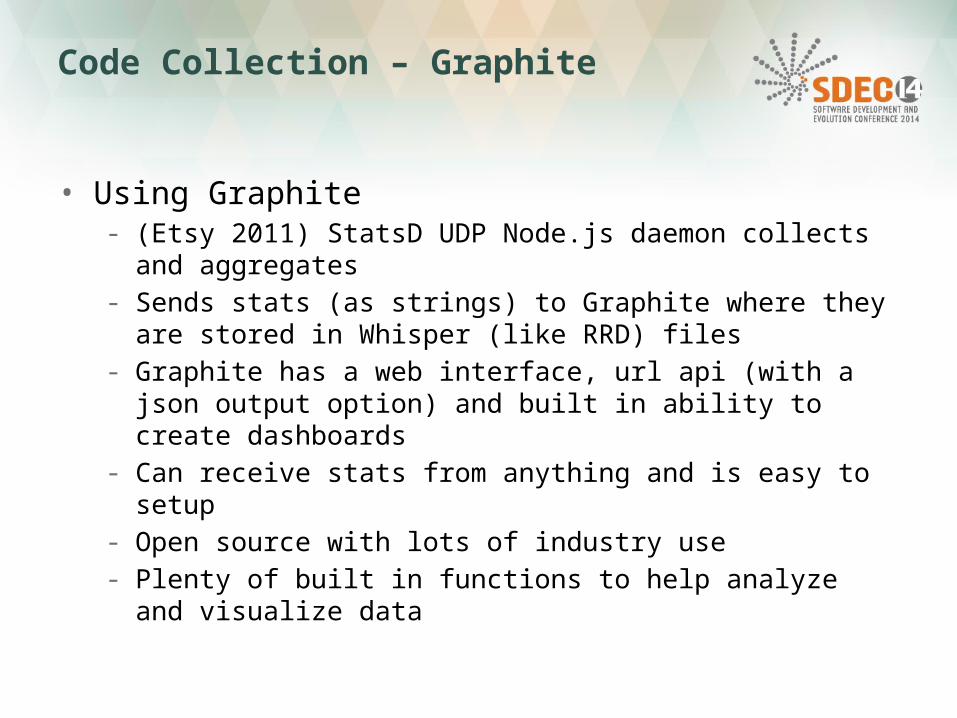
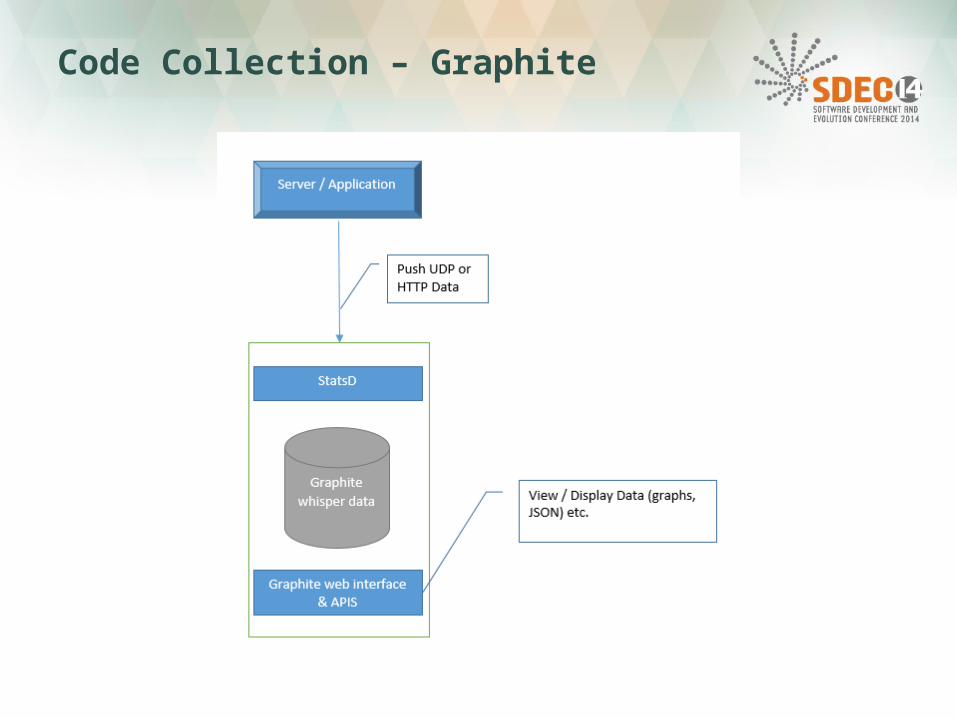
• Using Graphite- (Etsy 2011) StatsD UDP Node.js daemon collects and
aggregates- Sends stats (as strings) to Graphite where they are stored in
Whisper (like RRD) files- Graphite has a web interface, url api (with a json output option)
and built in ability to create dashboards- Can receive stats from anything and is easy to setup- Open source with lots of industry use- Plenty of built in functions to help analyze and visualize data
Code Collection – Graphite

Code Collection – Add / Refine Stats

Code Collection – Graphite Samples

Code Collection – Logging
• Metrics – what and when• Logging – how and why
Code Collection – Add / Refine Logging
• Why Log and what to log?- Log when you record a statistic
• Logging Best Practices- Log locally- Don’t log to your production database server- Don’t fail if you can’t log- Log in GMT- Keep your logs, ship them to a central location- Aggregate recent data in real time if you can- Log more than you think you need to- Use a parse friendly format

Environment Collection

Environment Collection
• Operating Systems- CPU, Free Memory, Paging, I/O ms speeds, network utilization
• Database Management Systems- Transactions, blocks
• Application Containers- Memory utilization, IIS requests current & queued, restarts,
cache statistics etc.

Visualization

Visualization
• Types of Dashboards- Feature based- Resource based (server or container)- Performance- Anomaly detection- Correlation- Root Cause Analysis- “Overview”

Visualization – Tasseo
• https://github.com/obfuscurity/tasseo

Visualization – Cubism
• https://github.com/square/cubism

Visualization – Cubism
• https://github.com/square/cubism
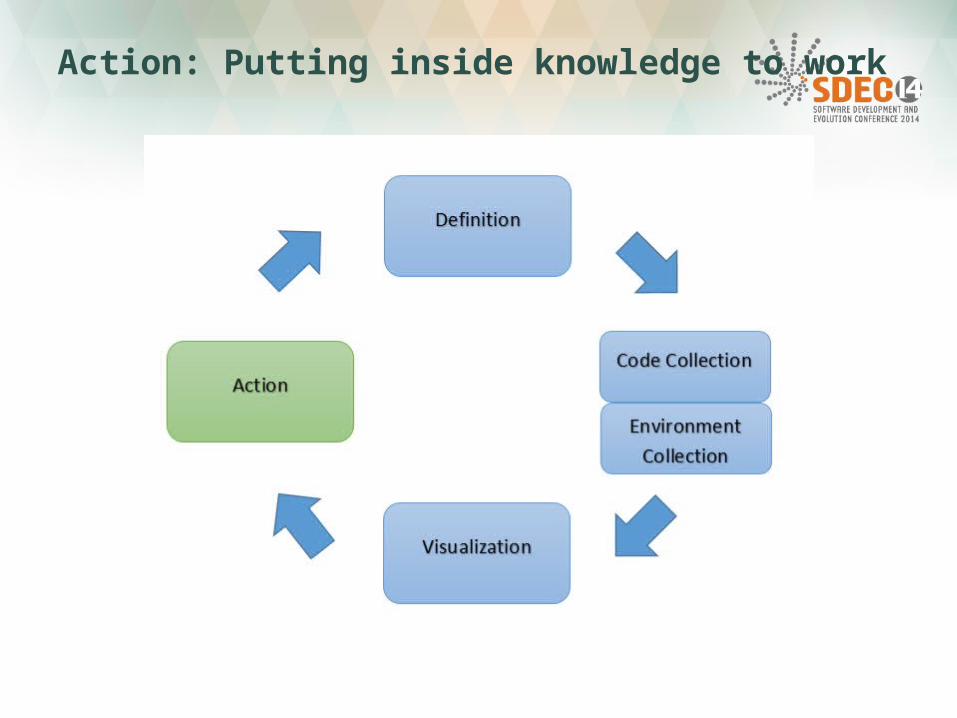
Action: Putting inside knowledge to work

Action
• Useful dashboards help create useful alerts• Add / refine anomaly detection & alerting• Know your own boundaries• A fuzzy threshold is better than no threshold• Attach graphs to alerts
• Exploit failures- Add an alerts after RCA- Theorize other possible causes or conditions

Monitoring Cycles
More?
• http://graphite.readthedocs.org/en/latest/ • http://codeascraft.com/ • http://vimeo.com/monitorama • Twitter #devops #monitoringlove• https://github.com/monitoringsucks • http://www.opsschool.org/en/latest/
