hm sultan qaboos bin said, sultan of oman€¦ · mr. hani bin dawood bin hamdan al baharani mr....
TRANSCRIPT

HM Sultan Qaboos Bin Said, Sultan of Oman


Oman Fisheries Co. S.A.O.G
Twentyfirst Annual Report2009 - 2010

INDEX Page
Members of the Board of Directors, Executive Committee and Internal Audit Committee i
Chairman’s Report ii-iii
Report of the Shareholders of Factual Findings iv
Report on Corporate Governance v-x
Report of the auditors 1
Consolidated and parent company income statement 2
Consolidated and parent company financial position 3
Consolidated and parent company statement of changes in equity 4
Consolidated and parent company cash flow statement 5
Notes to the consolidated financial statements 6 – 32
Oman Fisheries Co. S.A.O.G

i
Oman Fisheries Co. S.A.O.G
Members of the Board of DirectorsSheikh Mohammed bin Hamad bin Ali al Masrouri Chairman
Mr. Saleh bin Nasser bin Juma al Araimi Deputy Chairman
Mr. Abdul Ameer bin Said bin Mohammed Director
Sheikh. Salah bin Hilal bin Naser al Mawali Director
Mr. Hani bin Dawood bin Hamdan al Baharani Director
Dr. Saud bin Hamood bin Ahmed al Habsi Director
Mr. Qais bin Mahmood bin Abdalla al Khonji Director
Mr. Musalam Amer al Ammri Director
Executive CommitteeMr. Saleh bin Nasser bin Juma al Araimi Chairman
Sheikh Salah bin Hilal bin Naser al Mawali Director
Mr. Hani bin Dawood bin Hamdan al Baharani Director
Dr. Saud bin Hamood bin Ahmed al Habsi Director
Mr. Qais bin Mahmood bin Abdalla al Khonji Director
Internal Audit CommitteeMr. Abdul Amir bin Said bin Mohammed Chairman
Sheikh Salah bin Hilal bin Naser al Mawali Member
Mr. Hani bin Dawood bin Hamdan al Baharani Member
Mr. Said Al Rashid Al Rawahi General Manager
Company Address P.O. Box 2900, Code : 112
Auditors PricewaterhouseCoopers

ii
CHAIRMAN REPORT
Dear Shareholders,
On behalf of myself and Board of Directors of Oman Fisheries Co. SAOG on occasion of Annual General Meeting I have pleasure to present Annual Report of your company for the financial year ended 31st March, 2010 along with Corporate Governance report. The summary of the financial result of the company is as follows:
1. Financial Results:
This year company had achieved total sales of RO 11.830 Million as compared to RO 10.856 Million of previous year which is more by 9%.
As a result of the improvement in the Company’s operation and controlling the expenses, the Company had achieved operational profit of RO 447,225 compared with operational loss of RO 274,486 of previous year.
We had achieved net profit during the financial year 2009 – 2010 of RO 1.485 Million as compared to the net loss of RO 1.634 of the previous year.
As a result of efforts of the Management during this financial year your company had achieved turnover of 16,029 MT as compared to the last year turnover of 14,185 MT which is more by 13%.
Muscat Security Market index at the beginning of the year was 4,628 and it increased to 6,697 at the end of the year. Because of this growth, portfolio of the company which was managed by Bank Muscat and Vision Investment Services had also gone up. During this financial year company had achieved gain of RO 644,512 through investment in Muscat Security Market.
The Management of the company is trying their level best to distribute dividend to Shareholders during this financial year. As per the rules and regulations of Capital Market Authority first company has to set off previous year losses, only after that if any balance is remaining then Company can able to distribute dividend to Shareholders. After setting off losses the remaining balance is not enough to distribute dividend hence during this year your company is unable to declare any dividend.
2. Future Outlook:
The company is searching new ways for catching fish to subsidize the banned of Trawler. The company had purchased 4 coastal fishing boats which had started operation from May 2010, and in the case of succession of those boats, the company will do its role in promoting these types of boats to local fishermen.
Moreover the Company had prepared 5 year’s plan for purchasing and operating coastal fishing boats, which will enable it - God willing - from the exploitation of quota granted under the concession agreement and will seek during the ten-year plan, deliberate Omanisation fleet for fishing vessels. Company had planned to sell maximum catch from these boats in the local market either through direct sales or through company’s vehicles or through opening fish shops in all the regions of Sultanate mainly to support Government effort’s to make fish available in the interior region.
Oman Fisheries Co. S.A.O.G

iii
The company is about to finish feasibility study for some projects and we hope that we are going to implement them during this financial year. The projects are as follows:
Buying and operating coastal fishing boats in Oman as per the approval of Ministry of Fisheries.
Supporting local fishermen by signing medium term agreements with the company.
Expansion of Value Added Plant of Buraimi.
5 year’s Business Plan for accelerated growth of the company; Management had already prepared Business
Plan and it will be reviewed by Executive Committee very soon then it will be presented to the Board of Directors for their approval. We hope that we will implement this from October 2010.
Acknowledgement and Appreciation:
I take this opportunity to thank all the Ministers and Government sectors for their support to the activities of the company in particular, I would thank Ministry of Fisheries Wealth headed by H.E. Sheikh Mohammed bin Ali al Qathabi for his continuous support for the company in fisheries sectors.
On behalf of the Board of Directors and Management of the Company, I wish to acknowledge and express the sincere gratitude to His Majesty Sultan Qaboos Bin Said for his wise leadership and in support of the economic development and prosperity of the Country.
May Allah guide us all to keep steps on the right path and crown our efforts with success.
Mohammed bin Hamad bin Ali al Masrouri
Chairman
v
REPORT ON CORPORATE GOVERNANCE
The Company has implemented the code of Corporate Governance during the financial year issued by the Capital Market Authorities.
1. Company Philosophy on Code of Corporate Governance
The Company has always believed in fair business and corporate practices while dealing with Shareholders,
Employees, Customers, Creditors and Others. The Company is prompt in discharging its statutory obligations
and duties. The Company is maintaining policies, procedures and systems for the purposes to ensure the fair
and timely release of information about the Company.
The Board of Directors (“the Board”) has had adequate representation of the qualified, Non-executive and
Independent Directors. The Board has constituted various Committees of directors from time to time for the
matters which require special attention. The Board has adequately empowered the Executive Management on
all day-to-day matters, subject to the overall authority vested in the Board. The Directors attending the Board
and Committee meetings and actively participate in their proceedings. The Company lays strong emphasis on
audit and internal controls, having regard to the nature of the company’s business and has introduced suitable
checks and balances to ensure sound integrity of the operations. The Company also lays a very high emphasis
on total compliance with the various laws and regulations of the Country.
2. Board of Directors
As per the Article 19 of Articles of Association of the Company the strength of the Board is eight Directors,
and all of them are Non executive and Independent among them 6 Directors are elected by shareholders during
the AGM and 2 directors are appointed by resolution from the Cabinet.
The primary functions of the Company’s Board of directors in general include amongst others the following:
To approve business and financial policies to meet the objectives of the Company and enhance shareholders
value.
Review and approve the Company’s annual budget / plans and monitoring corporate performance against
the budget.
Approve and implement the disclosure policy in compliance with regulatory requirements.
Ensure compliance with regulatory requirements, policies, procedures and laws.
Nominating members of subcommittees and defining their roles, responsibilities and authorities.
Evaluate and appoint senior management executives.
Review effectiveness of systems and procedure of internal controls.
Constantly monitor and oversee the Corporation’s financial position, adherence to reporting standards and
policy of public disclosure of material information.
To facilitate proper governance, the Company’s management places before the Board, at least, the minimum
information as required by Article 4 of the Code of Corporate Governance.
The current Board of directors as on 31st March 2010 consists of 8 members, six of them were elected on 23rd
June 2009 and other two were appointed by the Cabinet and the details of them is as follows:

vi
REPORT ON CORPORATE GOVERNANCE
Composition of the Board of Directors:
Name of the Director DesignateCategory, basis & Capacity of
Membership
Sheikh Mohammed bin Hamad bin Ali al Masrouri ChairmanNon – Executive, Independent & In
Personal Capacity
Mr. Saleh bin Nasser bin Juma al Araimi Deputy ChairmanNon – Executive, Independent & In
Personal Capacity
Sheikh Salah bin Hilal bin Naser al Mawali DirectorNon – Executive, Independent & In
Personal Capacity
Mr. Abdul Ameer bin Said bin Mohammed DirectorNon – Executive, Independent & In
Personal Capacity
Mr. Hani Bin Dawood Bin Hamdan Al Baharani DirectorNon – Executive, Independent &
Nominee of Ministry of Finance.
Dr. Saud Bin Hamood Bin Ahmed Al-Habsi DirectorNon – Executive, Independent &
Nominee of Ministry of Fisheries Wealth.
Mr. Qais bin Mahmood bin Abdalla al Khonji DirectorNon – Executive, Independent & In
Personal Capacity
Mr. Musalam Amer Al - Ammri DirectorNon – Executive, Independent & In
Personal Capacity
Number of Meetings held and Dates of the meeting:
Meeting
DescriptionName of Directors / Members Designation Date of holding Meeting
Board of Directors
Meeting
All Directors 25th May 2009
23rd June 2009
14th September 2009
31st October 2009
24th January 2010
15th March, 2010.
Internal Audit
Committee
Meeting
Mr. Abdul Amir bin Said Mohammed
Sheikh Salah Bin Hilal Bin Naser Al Mawali
Mr. Qais bin Mahmood bin Abdalla al Khonji #
Mr. Hani Bin Dawood Bin Hamdan Al Baharani #
– Chairman
– Deputy
Chairman
26th April, 2009
23rd May 2009
28th July 2009
20th October 2009
17th January 2010.
Executive
Committee
Meeting
Mr. Saleh bin Nasser bin Juma al Araimi
Sheikh Salah bin Hilal bin Naser al Mawali
Dr. Saud Bin Hamood Bin Ahmed Al-Habsi
Mr. Hani Bin Dawood Bin Hamdan Al Baharani
Mr. Qais bin Mahmood bin Abdalla al Khonji
Mr. Musalam Amer Al - Ammri
– Chairman 17th August 2009
18th October 2009
15th November 2009
8th March 2010.
# Mr. Qais bin Mahmood bin Abdalla al Khonji is transferred from Audit Committee to the Executive Committee from 23rd June 2009 and Mr. Hani bin Dawood bin Hamdan Al Baharani is appointed in his place.
vii
REPORT ON CORPORATE GOVERNANCE
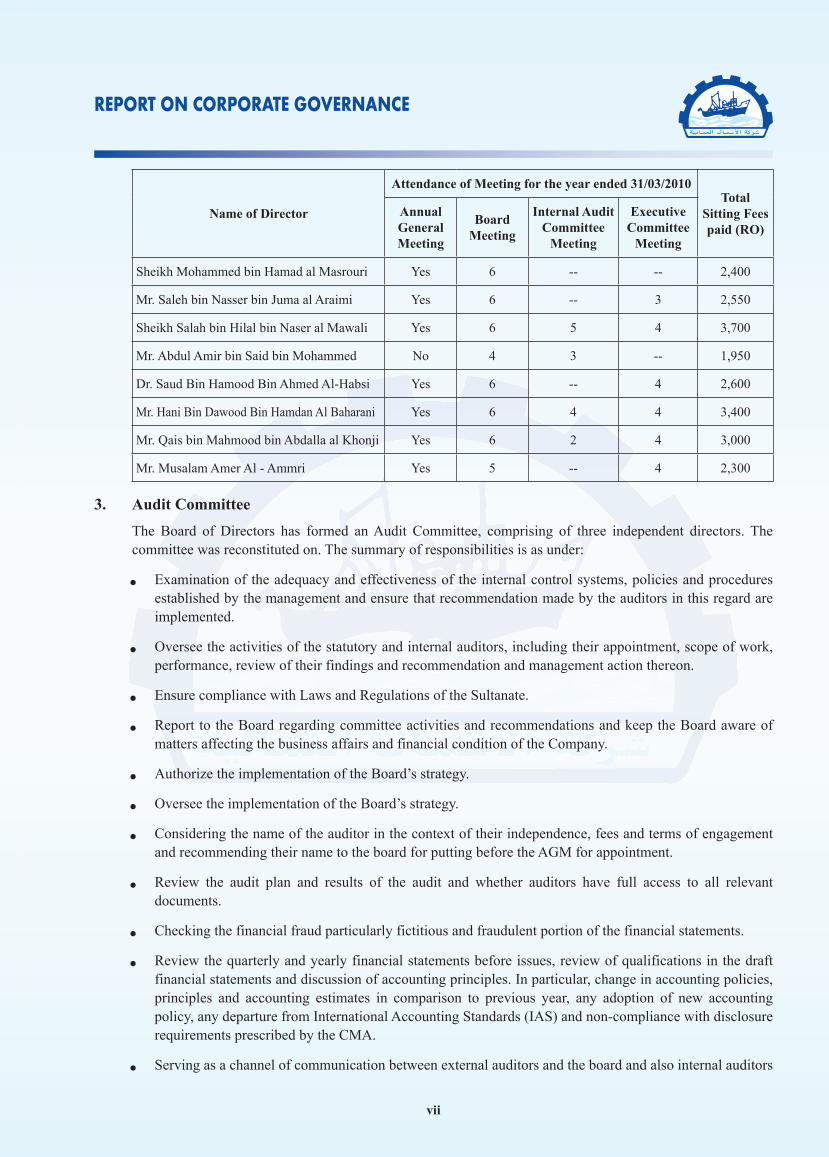
Name of Director
Attendance of Meeting for the year ended 31/03/2010Total
Sitting Fees paid (RO)
Annual General Meeting
Board Meeting
Internal Audit Committee
Meeting
Executive Committee
Meeting
Sheikh Mohammed bin Hamad al Masrouri Yes 6 -- -- 2,400
Mr. Saleh bin Nasser bin Juma al Araimi Yes 6 -- 3 2,550
Sheikh Salah bin Hilal bin Naser al Mawali Yes 6 5 4 3,700
Mr. Abdul Amir bin Said bin Mohammed No 4 3 -- 1,950
Dr. Saud Bin Hamood Bin Ahmed Al-Habsi Yes 6 -- 4 2,600
Mr. Hani Bin Dawood Bin Hamdan Al Baharani Yes 6 4 4 3,400
Mr. Qais bin Mahmood bin Abdalla al Khonji Yes 6 2 4 3,000
Mr. Musalam Amer Al - Ammri Yes 5 -- 4 2,300
3. Audit Committee
The Board of Directors has formed an Audit Committee, comprising of three independent directors. The committee was reconstituted on. The summary of responsibilities is as under:
Examination of the adequacy and effectiveness of the internal control systems, policies and procedures
established by the management and ensure that recommendation made by the auditors in this regard are implemented.
Oversee the activities of the statutory and internal auditors, including their appointment, scope of work,
performance, review of their findings and recommendation and management action thereon.
Ensure compliance with Laws and Regulations of the Sultanate.
Report to the Board regarding committee activities and recommendations and keep the Board aware of
matters affecting the business affairs and financial condition of the Company.
Authorize the implementation of the Board’s strategy.
Oversee the implementation of the Board’s strategy.
Considering the name of the auditor in the context of their independence, fees and terms of engagement
and recommending their name to the board for putting before the AGM for appointment.
Review the audit plan and results of the audit and whether auditors have full access to all relevant
documents.
Checking the financial fraud particularly fictitious and fraudulent portion of the financial statements.
Review the quarterly and yearly financial statements before issues, review of qualifications in the draft
financial statements and discussion of accounting principles. In particular, change in accounting policies, principles and accounting estimates in comparison to previous year, any adoption of new accounting policy, any departure from International Accounting Standards (IAS) and non-compliance with disclosure requirements prescribed by the CMA.
Serving as a channel of communication between external auditors and the board and also internal auditors

viii
REPORT ON CORPORATE GOVERNANCE
and the board.
Reviewing risk management policies and looking into the reasons of defaults in payment obligations of
the company.
Reviewing the specific transactions with related parties for making suitable recommendations to the board
and setting rules for entering the small values transactions with related parties without obtaining the prior approval of audit committee and the board.
4. Executive Committee
The Board Executive Committee, which comprises of 6 directors, is chaired by the Dy. Chairman to the Board of Directors and meets as and when required. The objective of the Executive Committee is to discharge responsibilities on behalf of the board in deciding on specific and any other matters. The Executive Committee also reviews and recommends to the Board of Directors the annual budget of the Company.
5. Appointment of General Manager
Further to the news published in the Muscat Securities Market site on 25th January 2010 regarding the appointment of General Manager of the company, the Board of Directors decided on 24th January 2010 to appoint Mr. Said Rashid Al Rawahi as General Manager of the company.
6. Remuneration Matters
a) Sitting Fees of RO 21,900 was paid to the directors during the year. The Board of Directors has proposed R.O. 13,994 (P.Y RO. NIL) as Directors remuneration.
The top six senior executives of the Company have received a total amount of R.O. 101,020.
The above includes salary, benefits, bonuses, gratuity, etc.
b) There are no incentives payable to the above based on performance criteria.
c) Consolidated audit fees payable for the financial year 2009-2010 will be RO. 8500.
7. Details of Non-Compliance by the Company.
The company fails to publish initial un audited results for the year 2007 – 08 and because of that Capital Market Authority had charged fine of RO 1250/- which was duly paid by the company. During this year company had already published initial unaudited financial result.
8. Means of Communication with the Shareholders
a) Quarterly results are published in Arabic and English local newspaper and the Shareholders are notified that the detailed accounts will be sent to any Shareholder who requests the same.
b) Annual Reports containing the audited financial statements together with the Chairman’s Report, Related Party Transactions and invitation to attend the AGM are sent by registered post to all shareholders.
c) Management Discussion and Analysis Report is a part of this Annual Report.
d) The company has its own website and the information relating to the Company products and facilities are posted on the website for all interested parties. The company’s website is www.omanfisheries.com
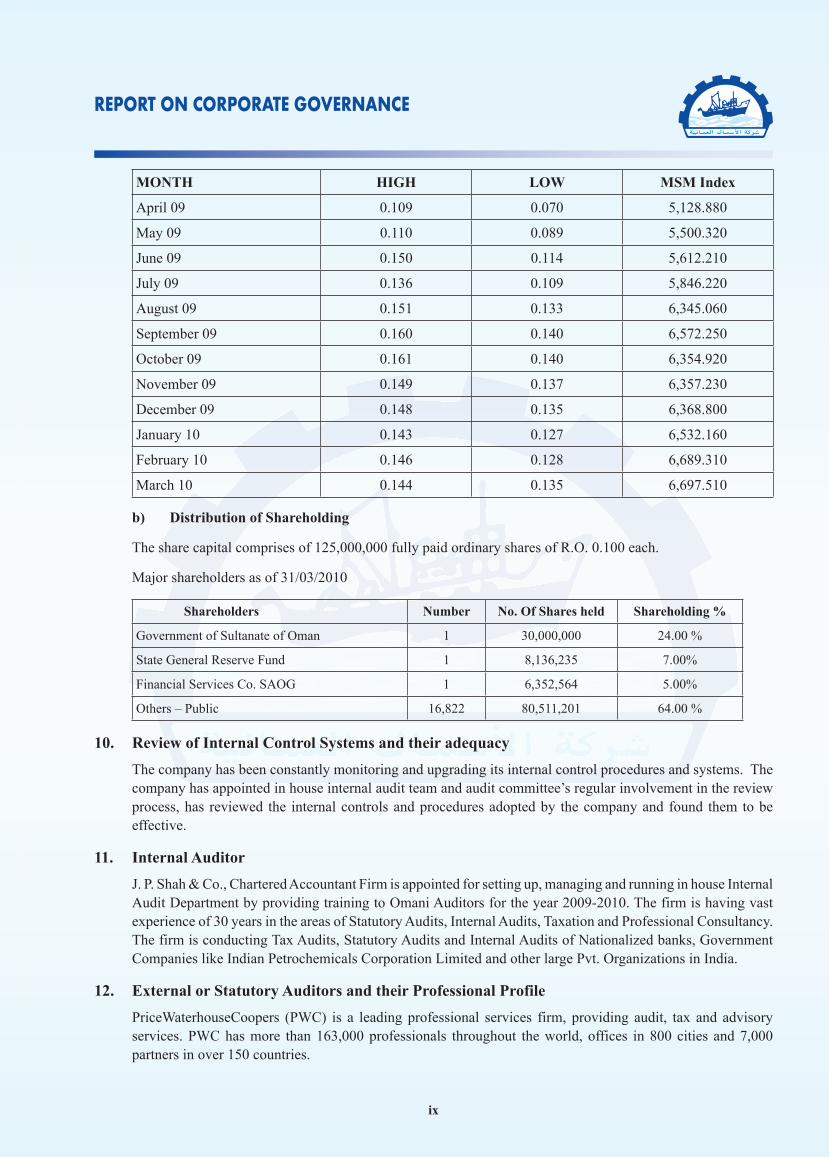
9. Market Data
a) The following table depicts the high, and low of company’s share traded during the financial year ended 31st March 2010 with month end general index.
ix
REPORT ON CORPORATE GOVERNANCE
MONTH HIGH LOW MSM Index
April 09 0.109 0.070 5,128.880
May 09 0.110 0.089 5,500.320
June 09 0.150 0.114 5,612.210
July 09 0.136 0.109 5,846.220
August 09 0.151 0.133 6,345.060
September 09 0.160 0.140 6,572.250
October 09 0.161 0.140 6,354.920
November 09 0.149 0.137 6,357.230
December 09 0.148 0.135 6,368.800
January 10 0.143 0.127 6,532.160
February 10 0.146 0.128 6,689.310
March 10 0.144 0.135 6,697.510
b) Distribution of Shareholding
The share capital comprises of 125,000,000 fully paid ordinary shares of R.O. 0.100 each.
Major shareholders as of 31/03/2010
Shareholders Number No. Of Shares held Shareholding %
Government of Sultanate of Oman 1 30,000,000 24.00 %
State General Reserve Fund 1 8,136,235 7.00%
Financial Services Co. SAOG 1 6,352,564 5.00%
Others – Public 16,822 80,511,201 64.00 %
10. Review of Internal Control Systems and their adequacy
The company has been constantly monitoring and upgrading its internal control procedures and systems. The company has appointed in house internal audit team and audit committee’s regular involvement in the review process, has reviewed the internal controls and procedures adopted by the company and found them to be effective.
11. Internal Auditor
J. P. Shah & Co., Chartered Accountant Firm is appointed for setting up, managing and running in house Internal Audit Department by providing training to Omani Auditors for the year 2009-2010. The firm is having vast experience of 30 years in the areas of Statutory Audits, Internal Audits, Taxation and Professional Consultancy. The firm is conducting Tax Audits, Statutory Audits and Internal Audits of Nationalized banks, Government Companies like Indian Petrochemicals Corporation Limited and other large Pvt. Organizations in India.
12. External or Statutory Auditors and their Professional Profile
PriceWaterhouseCoopers (PWC) is a leading professional services firm, providing audit, tax and advisory services. PWC has more than 163,000 professionals throughout the world, offices in 800 cities and 7,000 partners in over 150 countries.
x
REPORT ON CORPORATE GOVERNANCE
PWC in the Middle East and South Asia employs more than 4,000 professional and have offices in 15 countries.
The Oman practices of PWC were established in 1974. PWC Oman currently has a staff compliment in audit, tax and advisory services in excess of 100, including 5 partners. PWC Oman is accredited by the Capital Market Authorities to audit Omani listed companies.
13. Legal consultant
M/s Yassir Al Salami & Associates is a noted local legal consultant who employs qualified professional lawyers and was appointed as our retainer legal consultants for pursuing the company’s legal matters.
14. Acknowledgment
The Board of Directors acknowledges confirmation of:
Its responsibility for the preparation of the financial statements in accordance with the applicable standards
and rules.
Review of the efficiency and adequacy of internal control systems of the Company and that it compliance
with internal rules and regulations
There are no material matters effects the continuation of the Company and its ability to continue its
operation during the next financial year.
For OMAN FISHERIES CO SAOG For OMAN FISHERIES CO SAOG
AUTHORISED SIGNATORY AUTHORISED SIGNATORY

2
CONSOLIDATED AND PARENT COMPANY STATEMENT OF
COMPREHENSIVE INCOME
For the year ended 31 March 2010
Group Parent company
2010 2009 2010 2009
Note RO RO RO RO
Sales 6 11,829,840 10,855,668 11,812,729 10,846,329
Insurance claims for property, plant and equipment
4 199,440 146,935 199,440 146,935
Loss on sale of property, plant and equipment
4 (120,355) (1,427) (120,355) (1,427)
Other income 49,317 70,068 46,630 70,068
11,958,242 11,071,244 11,938,444 11,061,905
Cost of goods sold 7 (7,662,259) (7,553,191) (7,662,259) (7,553,191)
Staff costs 8 (1,185,611) (1,173,724) (1,171,624) (1,170,449)
Other operating expenses 9 (1,979,910) (1,924,964) (1,979,049) (1,897,730)
Fishing levy (405,607) (247,481) (405,607) (247,481)
Depreciation 15 (226,888) (267,874) (226,845) (267,811)
Contribution to Fisheries Research Fund
(50,712) (30,935) (50,712) (30,935)
Impairment of property, plant and equipment
15 - (147,561) - (147,561)
Operating profit/(loss) 447,255 (274,486) 442,348 (253,253)
Investment income/(loss) 10 644,512 (1,770,501) 644,512 (1,770,501)
Foreign exchange gain 11 33,293 788 33,293 788
Interest expense 12 (2,568) (8,233) (2,568) (8,233)
Interest income 12 469,102 435,638 469,102 435,638
Finance income - net 466,534 427,405 466,534 427,405
Profit/(loss) before taxation 1,591,594 (1,616,794) 1,586,687 (1,595,561)
Taxation 13 (106,921) (17,393) (106,921) (17,393)
Profit/(loss) and total comprehensive income/(loss) for the year
1,484,673 (1,634,187) 1,479,766 (1,612,954)
Earning/(loss) per share 14 0.012 (0.013) 0.012 (0.013)
The notes on pages 6 to 33 form an integral part of these financial statements.
Report of the Auditors - Page 1

3
CONSOLIDATED AND PARENT COMPANY STATEMENT OF
FINANCIAL POSITION
At 31 March 2009
Group Parent company2010 2009 2010 2009
Note RO RO RO ROASSETSNon-current assetsProperty, plant and equipment 15 863,317 824,879 863,291 824,810Investment in subsidiary 16 - - 15,750 15,750Due from subsidiary 31(b) - - 54,382 -Held to maturity financial assets 17 1,105,073 1,637,581 1,105,073 1,637,581Fixed deposits 22 6,981,947 5,666,027 6,981,947 5,666,027Deferred tax asset 27 19,874 5,665 19,874 5,665
8,970,211 8,134,152 9,040,317 8,149,833Current assets Held to maturity financial assets 17 1,502,141 - 1,502,141 -Inventories 18 1,377,144 1,656,633 1,377,144 1,656,633Trade and other receivables 20 1,694,510 1,579,565 1,745,875 1,682,303Financial assets at fair value through profit or loss 21 2,109,378 1,389,100 2,109,378 1,389,100Short term deposits 22 500,000 1,538,104 500,000 1,538,104Cash and cash equivalents 22 576,644 792,007 554,308 775,844
7,759,817 6,955,409 7,788,846 7,041,984Total assets 16,730,028 15,089,561 16,829,163 15,191,817
EQUITY Capital and reserves Share capital 23 12,500,000 12,500,000 12,500,000 12,500,000Legal reserve 24 3,008,442 2,859,975 3,007,952 2,859,975Capital reserve 25 29,269 29,269 29,269 29,269Retained earnings/(accumulated losses) 87,037 (1,249,169) 189,587 (1,142,202)Total equity 15,624,748 14,140,075 15,726,808 14,247,042
LIABILITIES Non-current liabilities End of service benefits 26 163,481 155,549 161,658 155,113
Current liabilities Trade and other payables 28 786,926 729,466 785,824 725,191Taxation 13 154,873 64,471 154,873 64,471
941,799 793,937 940,697 789,662Total liabilities 1,105,280 949,486 1,102,355 944,775Total equity and liabilities 16,730,028 15,089,561 16,829,163 15,191,817Net assets per share 29 0.125 0.113 0.126 0.114
The financial statements were approved and authorized for issue by the Board of Directors on 22 May 2010 and were signed on their behalf by:
MOHAMMED BIN HAMAD AL MASROURI SALEH BIN NASSER BIN JUMA Al ARAIMI
CHAIRMAN DEPUTY CHAIRMAN
Report of the Auditors – page 1

4
CONSOLIDATED AND PARENT COMPANY STATEMENT OF CHANGES IN EQUITY
For the year ended 31 March 2010
Group
NoteShare capital
RO
Legal reserve
RO
Capitalreserve
RO
Retained earnings/
(accumulated losses)
RO
TotalRO
Balance at 1 April 2008 12,500,000 2,859,975 29,269 1,635,028 17,024,272
Comprehensive income
Loss for the year - - - (1,634,187) (1,634,187)
Transaction with owners:
Dividend paid - - - (1,250,010) (1,250,010)
Balance at 31 March 2009 12,500,000 2,859,975 29,269 (1,249,169) 14,140,075
Balance at 1 April 2009 12,500,000 2,859,975 29,269 (1,249,169) 14,140,075
Comprehensive income
Profit for the year - - - 1,484,673 1,484,673
Transaction with owners:
Transfer to legal reserve 24 - 148,467 - (148,467) -
Balance at 31 March 2010 12,500,000 3,008,442 29,269 87,037 15,624,748
Parent Company
Note
Share capital
RO
Legal reserve
RO
Capitalreserve
RO
Retained earnings/
(accumulated losses)
ROTotalRO
Balance at 1 April 2008 12,500,000 2,859,975 29,269 1,720,762 17,110,006
Comprehensive income
Loss for the year - - - (1,612,954) (1,612,954)
Transaction with owners:
Dividend paid - - - (1,250,010) (1,250,010)
Balance at 31 March 2009 12,500,000 2,859,975 29,269 (1,142,202) 14,247,042
Balance at 1 April 2009 12,500,000 2,859,975 29,269 (1,142,202) 14,247,042
Comprehensive income
Profit for the year - - - 1,479,766 1,479,766
Transaction with owners:
Transfer to legal reserve 24 - 147,977 - (147,977) -
Balance at 31 March 2010 12,500,000 3,007,952 29,269 189,587 15,726,808
The notes on pages 6 to 33 form an integral part of these financial statements.
Report of the Auditors – page 1

5
Note Group Parent company
2010 2009 2010 2009
Operating activities RO RO RO RO
Cash generated from/(used in) operations 30 1,166,156 (273,994) 1,159,983 (245,339)
Interest paid (2,568) (8,233) (2,568) (8,233)
Interest received 345,927 432,827 345,927 432,827
Tax paid (30,728) - (30,728) -
Net cash from operating activities 1,478,787 150,600 1,472,614 179,255
Investing activities
Purchase of property, plant and equipment 15 (395,771) (79,309) (395,771) (79,309)
Proceeds from disposal of property, plant and equipment 30,000 - 30,000 -
Purchase of investments (1,744,680) (1,825,120) (1,744,680) (1,825,120)
Proceeds from sale of investments 1,609,378 907,177 1,609,378 907,177
Dividend received 59,536 109,584 59,536 109,584
(Decrease)/ increase in bank deposits (277,816) 1,898,232 (277,816) 1,898,232
Investment in held to maturity financial assets (974,797) - (974,797) -
Held to maturity financial assets matured - 500,000 - 500,000
Net cash (used in)/from investing activities (1,694,150) 1,510,564 (1,694,150) 1,510,564
Financing activities
Dividend paid - (1,250,010) - (1,250,010)
Net change in cash and cash equivalents (215,363) 411,154 (221,536) 439,809
Cash and cash equivalents at beginning of year 792,007 380,853 775,844 336,035
Cash and cash equivalents at end of year 576,644 792,007 554,308 775,844
The notes on pages 6 to 33 form an integral part of these financial statements.
Report of the Auditors – page 1.
CONSOLIDATED AND PARENT COMPANY STATEMENT
OF CASH FLOWS
For the year ended 31 March 2010
6
NOTES TO THE CONSOLIDATED FINANCIAL STATEMENTS
For the year ended 31 March 2010
1 Legal status and principal activities
Oman Fisheries CO. SAOG (“the company” or “the Parent Company”) is an Omani Joint Stock Company registered under the Commercial Companies Law of Oman. The principal activities of the Company are the procurement, processing and sale of fresh, frozen and coated fish, fishing and the sale of fishing rights.
On 27 August 2005, the company incorporated a company in UAE, Oman Fisheries Co. FZE with an initial registered share capital of RO 15,750. Oman Fisheries Co. FZE (“the Subsidiary”) registered in United Arab Emirates as a free zone company, is a wholly owned subsidiary of the company. The subsidiary company is engaged in the business of distribution of the products of the Parent Company and it started its operations on 1 February 2006. The consolidated financial statements comprise of the Parent Company and its subsidiary, collectively “the Group”.
2 Summary of significant accounting policies
The principal accounting policies are summarised below. These policies have been consistently applied to each of the years presented, unless otherwise stated.
2.1 Basis of preparation
(a) These financial statements are prepared on the historical cost basis, as modified by the revaluation of investments held as financial assets at fair value through profit or loss and in accordance with International Financial Reporting Standards (IFRS), the requirements of the Commercial Companies Law of the Sultanate of Oman, 1974 (as amended) and comply with the disclosure requirements set out in the “Rules and Guidelines on Disclosure by issuer of Securities and Insider Trading” issued by the Capital Market Authority (CMA) of the Sultanate of Oman.
(b) The preparation of financial statements in conformity with IFRS requires the use of certain critical accounting estimates. It also requires management to exercise its judgement in the process of applying the Group’s accounting policies. The areas involving a higher degree of judgement or complexity, or areas where assumptions and estimates are significant to the financial statements are disclosed in Note 4.
(c) New and amended standards adopted by the group:
IFRS 7 ‘Financial instruments – Disclosures’ (amendment) - effective 1 January 2009. The amendment requires enhanced disclosures about fair value measurement and liquidity risk. In particular, the amendment requires disclosure of fair value measurements by level of a fair value measurement hierarchy. As the change in accounting policy only results in additional disclosures, there is no impact on earnings per share;
IAS 1 (revised), ‘Presentation of financial statements’ – effective 1 January 2009. The revised standard prohibits the presentation of items of income and expenses (that is, ‘non-owner changes in equity’) in the statement of changes in equity, requiring ‘non-owner changes in equity’ to be presented separately from owner changes in equity in a statement of comprehensive income. As a result the company presents in the statement of changes in equity all owner changes in equity, whereas all non-owner changes in equity are presented in the statement of comprehensive income. Comparative information has been re-presented so that it also is in conformity with the revised standard. The change in accounting policy only impacts presentation aspects, there is no impact on earnings per share;
IFRS 8, Operating segments (effective 1 January 2009).
IAS 27 (Revised), ‘Consolidated and separate financial statements’ (effective from 1 July 2009);
7
NOTES TO THE CONSOLIDATED FINANCIAL STATEMENTS
For the year ended 31 March 2010
2 Summary of significant accounting policies (continued)2.2 Consolidation
(a) Subsidiaries
Subsidiaries are all entities (including special purpose entities) over which the Group has the power to govern the financial and operating policies generally accompanying a shareholding of more than one half of the voting rights. The existence and effect of potential voting rights that are currently exercisable or convertible are considered when assessing whether the Group controls another entity. Subsidiaries are fully consolidated from the date on which control is transferred to the Group. They are de-consolidated from the date that control ceases.
The purchase method of accounting is used to account for the acquisition of subsidiaries by the Group. The cost of an acquisition is measured as the fair value of the assets given, equity instruments issued and liabilities incurred or assumed at the date of exchange, plus costs directly attributable to the acquisition. Identifiable assets acquired and liabilities and contingent liabilities assumed in a business combination are measured initially at their fair values at the acquisition date, irrespective of the extent of any minority interest. The excess of the cost of acquisition over the fair value of the Group’s share of the identifiable net assets acquired is recorded as goodwill.
Inter-company transactions, balances and unrealised gains on transactions between Group companies are eliminated. Unrealised losses are also eliminated. Accounting policies of subsidiaries have been changed where necessary to ensure consistency with the policies adopted by the Group.
2.3 Revenue recognitionRevenue from the sale of goods is stated at the fair value of the consideration received or receivable, net of returns and allowances, trade discounts and volume rebates. Revenue is recognised when the significant risks and rewards of ownership have been transferred to the buyer, recovery of the consideration is probable, the associated costs and possible return of goods can be estimated reliably, and there is no continuing management involvement with the goods.
Sales represent the invoiced value of fish supplied by the Group during the year. Sale of fishing rights is recognised on an accrual basis.
2.4 Foreign currency translation
(a) Functional and presentation currency
Items included in the financial statements of each of the Group’s entities are measured using the currency of the primary economic environment in which the entity operates (‘the functional currency’). The consolidated financial statements are presented in ‘Rial Omani’, which is the Parent company’s functional and the Group’s presentation currency.
(b) Transactions and balances
Foreign currency transactions are translated into the functional currency using the exchange rates prevailing at the dates of the transactions or valuation where items are re-measured. Foreign exchange gains and losses resulting from the settlement of such transactions and from the translation at year-end exchange rates of monetary assets and liabilities denominated in foreign currencies are recognised in the statement of comprehensive income.
(c) Group companies
The accounting records of the subsidiary, Oman Fisheries Co. FZE are maintained in UAE Dirhams (AED). The Rial Omani amounts included in the consolidated financial statements have been translated at an exchange rate of 0.105 Omani Rial to each AED for the statement of comprehensive income and the statement of financial position items, as the AED to RO exchange rate has effectively remained fixed during the year, both currencies being pegged to the US Dollar.

8
NOTES TO THE CONSOLIDATED FINANCIAL STATEMENTS
For the year ended 31 March 2010
2.5 Finance costs and income
Finance cost comprises of interest payable on overdraft facility and finance income comprises of interest income from deposits and held to maturity financial assets. Finance income and cost are accounted on accrual basis using the effective interest rate method.
2.6 Operating leases
Leases in which a significant portion of the risks and rewards of ownership are retained by the lessor are classified as operating leases. Payments made under operating leases are included in “other operating expense” in the statement of comprehensive income on a straight-line basis over the period of the lease.
2.7 Taxation
Income tax on the results for the year comprises current and deferred tax.
Current tax is recognised in the statement of comprehensive income as the expected tax payable on the taxable income for the year, using tax rates enacted or substantially enacted at the reporting date, and any adjustment to tax payable in respect of previous years.
Deferred income tax is provided, using the liability method, for all temporary differences arising between the tax bases of assets and liabilities and their carrying values for financial reporting purposes. Currently enacted tax rates are used to determine deferred tax. Deferred income tax assets and liabilities are offset as there is a legally enforceable right to offset these in Oman.
The principal temporary differences arise from depreciation on property, plant and equipment, provision for doubtful debts and provision for slow moving inventories.
2.8 Property, plant and equipment
Property, plant and equipment are stated at historical cost less accumulated depreciation. The cost of property, plant and equipment is their purchase price together with any incidental expenses that are directly attributable to the acquisition of the item. Subsequent costs are included in the asset’s carrying amount or recognised as a separate asset, as appropriate, only when it is probable that future economic benefits associated with the item will flow to the establishment and the cost of the item can be measured reliably. All other repairs and maintenance are charged to the statement of comprehensive income during the financial year in which they are incurred.
The cost of property, plant and equipment is written down to residual value in equal installments over the estimated useful lives of the assets. The estimated useful lives are:
YearsBuildings and cabins 5 - 25Plant and equipment 3 - 10Boats and trawlers 5 - 15Motor vehicles 3 - 5Furniture, fixtures and office equipment 3 - 10
Land is not depreciated as it is deemed to have an indefinite life.
Capital work-in-progress is not depreciated until it is transferred into one of the above categories at the time when it is ready for use.
The assets’ residual values and useful lives are reviewed, and adjusted if appropriate, at each reporting date.
Where the carrying amount of an asset is greater than its estimated recoverable amount it is written down immediately to its recoverable amount.
Gains and losses on disposals of property and equipment are determined by reference to their carrying amounts, and are taken into account in determining operating profit.
9
NOTES TO THE CONSOLIDATED FINANCIAL STATEMENTS
For the year ended 31 March 2010
2.9 Investment in subsidiary
Classification
A company is a subsidiary company, if Oman Fisheries Co (SAOG) has the power to govern the financial and operating policies generally accompanying a shareholding of more than one half of the voting rights so as to obtain benefits from the investee company’s activities.
Valuation
Investment in a subsidiary company is stated at cost less any diminution in the value of specific investment, which is other than temporary by the Parent company. Investment income is accounted for in the year in which entitlement is established.
2.10 Financial assets
The Group classifies its financial assets in the following categories: at fair value through profit or loss, held to maturity and loans and receivables. The classification depends on the purpose for which the financial assets were acquired. Management determines the classification of its financial assets at initial recognition.
(a) Financial assets at fair value through profit or loss
Classification
A financial asset is classified in this category if acquired principally for the purpose of selling in the short term or if so designated by management.
Valuation
Financial assets carried at fair value through profit or loss are initially recognised at fair value and transaction costs are expensed in the statement of comprehensive income. Financial assets at fair value through profit or loss are subsequently carried at fair value.
The fair values of quoted investments are based on current market bid prices. Gains or losses arising from changes in the fair value are presented in the statement of comprehensive income in the period in which they arise.
Investments are derecognised when the rights to receive cash flows from the investments have expired or have been transferred and the Group has transferred subsequently all risks and rewards of ownership.
All purchases and sales of investments are recognised on the trade date, which is the date that the Group commits to purchase or sell the asset.
(b) Held to maturity investments
Held-to-maturity investments are non-derivative financial assets with fixed or determinable payments and fixed maturities that the Group’s management has the positive intent and ability to hold to maturity.
Held-to-maturity investments are initially recognized at cost and subsequently re-measured at amortized cost using the effective yield method less any provision for impairment.
Interest receivable from held to maturity is accounted for on the accruals basis.
(c) Loans and receivables
Loans and receivables are non-derivative financial assets with fixed or determinable payments that are not quoted in an active market. They are included in current assets, except for maturities greater than 12 months after the reporting date. These are classified as non-current assets. The Group’s loans and receivables comprise deposits, trade and other receivables and cash and cash equivalents in the statement of financial position (notes 2.12 and 2.13).

10
NOTES TO THE CONSOLIDATED FINANCIAL STATEMENTS
For the year ended 31 March 2010
2.11 Inventories
Inventories are valued at the lower of cost and net realisable value. Cost is determined on the weighted average cost method. The cost of inventories comprises of direct cost of materials and related expenses. Net realisable value is the price at which inventories can be sold in the normal course of business after allowing for the costs of realisation. Provision is made where necessary for obsolete, slow moving and defective items.
2.12 Trade and other receivables
Trade debtors and other receivables are initially recognised at their fair value and subsequently stated at amortised cost using effective interest rate method, less provision for impairment. A provision for impairment of trade receivables is established when there is objective evidence that the Group will not be able to collect all amounts due according to the original terms of receivables. Significant financial difficulties of the debtor, probability that the debtor will enter bankruptcy or financial reorganisation, and default or delinquency in payments are considered indicators that the trade receivable is impaired. The amount of the provision is the difference between the asset’s carrying amount and the present value of estimated future cash flows, discounted at the effective interest rate. The amount of any provision is recognised in the statement of comprehensive income within “other operating expenses”. Subsequent recoveries of amounts previously written off are credited against “other operating expenses” in the statement of comprehensive income.
2.13 Cash and cash equivalents
For the purpose of the cash flow statement the Group considers all bank balances, including short term deposits with a maturity of three months or less from the date of placement, to be cash equivalents.
2.14 End of service benefits and leave entitlements
End of service benefits are accrued in accordance with the terms of employment of the Group’s employees at the reporting date, having regard to the requirements of the Oman Labour Law 2003 as amended and UAE Labour Law. Employee entitlements to annual leave and leave passage are recognised when they accrue to employees and an accrual is made for the estimated liability as a result of services rendered by employees up to the reporting date. These accruals are included in current liabilities, while that relating to end of service benefits is disclosed as a non-current liability.
Contributions to a defined contribution retirement plan and occupational hazard insurance for Omani employees in accordance with the Omani Social Insurances Law of 1991 are recognised as an expense in the statement of comprehensive income as incurred.
2.15 Trade and other payables
Trade payables are recognized initially at fair value and subsequently measured at amortized cost using the effective interest method.
Liabilities are recognised for amounts to be paid for goods and services received, whether or not billed to the Group.
2.16 Earning per share
The Group presents basic earnings per share (EPS) data for its ordinary shares. Basic EPS is calculated by dividing the profit or loss attributable to ordinary shareholders of the Parent company/Group by the weighted average number of ordinary shares outstanding during the period.
2.17 Directors’ remuneration
The Directors’ remuneration is governed as set out by the Commercial Companies Law and the rules prescribed by the Capital Market Authority.
11
NOTES TO THE CONSOLIDATED FINANCIAL STATEMENTS
For the year ended 31 March 2010
2.17 Directors’ remuneration (continued)
The Annual General Meeting shall approve the remuneration and the sitting fees for the Board of Directors and its sub-committees provided that such fees shall not exceed a minimum of 5% of the annual net profit after deduction of the legal reserve and the optional reserve as distribution of dividends to the shareholders. Such fees shall not exceed RO 200,000 in one year. The sitting fees for each Director shall not exceed RO 10,000 in one year.
2.18 Dividend distribution
Dividend distribution to the company’s shareholders is recognised as a liability in the company’s financial statements in the period in which the dividends are approved by the Parent company’s shareholders.
2.19 Segment reporting
Operating segments are reported in a manner consistent with the internal reporting provided to the chief operating decision-maker. The chief operating decision maker, who is responsible for allocating resources and assessing performance of the operating segments, make strategic decisions and has been identified as the Board of Directors.
3 Financial risk management
3.1 Financial risk factors
The Group’s activities expose it to a variety of financial risks: market risk (including currency risk, price risk and interest rate risk), credit risk and liquidity risk. The Group’s overall risk management program focuses on the unpredictability of financial markets and seeks to minimize potential adverse effects on the financial performance of the Group. Risk management is carried out by the management under policies approved by the Board of Directors.
(a) Market risk
(i) Foreign exchange risk
Foreign exchange risk arises when future commercial transactions or recognised assets or liabilities are denominated in a currency that is not the entity’s functional currency. The Group is exposed to foreign currency risk arising from currency exposures with respect to US Dollars, UAE Dirham, Saudi Riyal and Euro. In respect of the Group’s transactions denominated in US Dollars, Saudi Riyals and UAE Dirham, the Group is not exposed to currency risk as the Rial Omani, Saudi Riyals and UAE Dirham are pegged to the US Dollar.
At 31 March 2010, if the Rial Omani had weakened/strengthened by 5% against the Euro with all other variables held constant, post-tax profit for the year would have been RO 5,022 (2009 - nil) higher/lower primarily as a result of monetary assets.
(ii) Price risk
Price risk is the risk that the value of a financial instrument will fluctuate as a result of changes in market prices, whether these changes are caused by factors specific to the individual security, or its issuer, or factors affecting all securities in the market.
The Group is exposed to equity price risk because of investment in certain publicly listed companies at the Muscat Securities Market (MSM) which have been classified as financial assets at fair value through profit or loss. The Group limits market risk by maintaining a selective and strategic portfolio and by regular monitoring of the market. In addition the Group monitors actively the key factors that effect stock market movements.

12
NOTES TO THE CONSOLIDATED FINANCIAL STATEMENTS
For the year ended 31 March 2010
3.1 Financial risk factors (continued)
The table below summarises the impact of increase/(decreases) of the MSM Index on the gains/losses on equity securities on the assumption that the equity index had increased/decreased by 5% with all other variables held constant:
Index GroupParent
company GroupParent
company
2010 2010 2009 2009
RO RO RO RO
MSM 105,469 105,469 69,455 69,455
(iii) Interest rate risk
Interest rate risk arises from the possibility of changes in interest rates and mismatches or gaps in the amount of assets and liabilities that mature or re-price in a given period.
The Group is exposed to fair value interest rate risk on its held to maturity financial assets and fixed deposits placed with the commercial banks as these carry fixed interest rates.
At 31 March 2010, if the interest rate were to shift by 0.5%, there would be a maximum increase or decrease in the interest income by RO 85,356 (2009 - RO 72,539).
(b) Credit risk
Credit risk is the risk of financial loss if a customer or counterparty to a financial instrument fails to meet its contractual obligations.
Credit risk arises from cash and cash equivalents, long term fixed deposits, trade receivables and credit exposures to customers through outstanding debtors including outstanding amounts due from related parties (refer to note 19 for credit quality of banks and financial institutions).
The Group’s exposure to credit risk is influenced mainly by the individual characteristics of each customer. The demographics of the Group’s large customer base, including the default risk of the industry in the country of operation, which customers operate, has an influence on credit risk. Exposure to credit risk is monitored on an ongoing basis. Credit evaluations are performed on all customers requiring credit. All export customers risks are either covered by letter of credit, insurance or by way of a bank guarantee.
The Group categorizes its customers as hypermarkets, private entities and other retail customers.
The Group has significant concentrations of credit risk, details of which are provided in note 20. The Group manages concentration of its credit risk by monitoring collections within the credit period.
The maximum exposure to credit risk for trade receivables at the reporting date for the Group and the Parent company by geographical region was:
Group Parent company
2010 2009 2010 2009
RO RO RO RO
Local customers 361,852 237,268 331,879 237,268
Foreign customers 546,582 679,776 546,582 661,829
908,434 917,044 878,461 899,097

13
NOTES TO THE CONSOLIDATED FINANCIAL STATEMENTS
For the year ended 31 March 2010
3.1 Financial risk factors (continued)
The maximum exposure to credit risk for trade receivables at the reporting date for the Group and Parent company by type of customer was:
Group Parent company2010 2009 2010 2009RO RO RO RO
Hypermarkets 29,260 30,999 27,429 29,291Private entities 715,974 717,800 687,832 703,732Other retail customers 163,200 168,245 163,200 166,074
908,434 917,044 878,461 899,097
Management does not expect any losses from non-performances by these counterparties.
(c) Liquidity risk
Liquidity risk is the risk that the Group will not be able to meet its financial obligations as they fall due. The Group’s approach to managing liquidity is to ensure, as far as possible, that it will always have sufficient liquidity to meet its liabilities when due, under both normal and stressed conditions, without incurring unacceptable losses or risking damages to the Group’s reputation.
The Group’s financial liabilities consisting of trade and other payables for Group of RO 786,926 (2009 - RO 729,466) and for Parent company of RO 785,824 (2009 - RO 725,191) are the contractual undiscounted cash flows which are due within twelve months from the reporting date.
3.2 Fair value estimation
Effectively 1 January 2009, the Group adopted the amendments to IFRS 7 for financial instruments that are measured in the statement of financial position at fair value. Level 1 – quoted market prices; Level -2, inputs other that quoted prices included within level 1 that are observable for the asset or liability directly or indirectly; Level -3, inputs for the asset or liability that are not based on the observable market data. The Group’s entire financial assets at fair value through profit or loss are valued using Level 1 fair value techniques.
The face value less any estimated credit adjustments for financial assets and liabilities with a maturity of less than one year are assumed to approximate to their fair values. The fair values of quoted securities are based on market bid prices at the reporting date. The fair values of non-current fixed deposits are considered to approximate to their carrying amounts as these carry interest rates which are believed to be the commercial interest rates.
The table below summarises the carrying amounts and their fair values of the financial assets not presented in the statement of financial position at their fair value.
2010 2009Carrying
valueFair value Carrying
valueFair value
RO RO RO ROFinancial assets Held-to-maturity investments 1,105,073 1,153,755 1,637,581 1,630,700
3.3 Capital risk management
The capital of the Group comprises of paid-up share capital, retained earnings, legal reserves and special reserves. Summary of quantitative data as to what it manages as the capital and any changes therein from the previous year are given in statement of changes in equity. The Group’s objectives when managing capital are to safeguard the Group’s ability to continue as a going concern in order to provide returns for shareholders and to maintain an optimal capital structure to reduce the cost of capital.

14
NOTES TO THE CONSOLIDATED FINANCIAL STATEMENTS
For the year ended 31 March 2010
4 Critical accounting estimates
The Group makes estimates and assumptions concerning the future. Estimates are regularly evaluated and are based on historical experience and other factors, including expectations of future events that are believed to be reasonable under the circumstances. The estimates and assumptions that have a significant risk of causing a material adjustment to the carrying amounts of assets and liabilities within the next financial year are set out below:
Insurance claim/loss on sale of boats
During the year, the parent company disposed two boats (Asmak 1 and Asmak 2) included in the fixed assets as approved by the board of directors during 2009. Asmak 1 and Asmak 2 were sold at a loss of RO 68,431 and RO 51,924 respectively. During the year as against Asmak 2, an amount of RO 199,440 was agreed and received as insurance claim settlement and accordingly recognised as income. In respect of Asmak 1 during 2009, an amount of RO 146,935 was recognised as income towards insurance claim based on agreed settlement with the insurer in 2009.
Impairment of trade receivables
An estimate of the collectible amount of trade receivables is made when collection of the full amount is no longer probable. For individually significant amounts, this estimation is performed on an individual basis. Amounts which are not individually significant, but which are past due, are assessed collectively and a provision applied according to the length of time past due, based on historical recovery rates.
Impairment of inventories
Inventories are held at the lower of cost and net realisable value. When inventories become old or obsolete, an estimate is made of their net realisable value. For individually significant amounts this estimation is performed on an individual basis. Amounts which are not individually significant, but which are old or obsolete, are assessed collectively and a provision applied according to the inventory type and the degree of ageing or obsolescence, based on historical selling prices.
5 Segment information
Management has determined the operating segments based on the reports reviewed by the Board of Directors that are used to make strategic decisions. The Board considers the business from a group level as the group is principally engaged in one segment which is fishing, procurement, processing and sale of fish. The Board also considers the geographical segments. The directors review monthly analysis of these geographical segments by monitoring volume and value and the related debtors. As the directors effectively look at only one group level segment, all relevant details are as set out in the statement of comprehensive income and statement of financial position. The geographical distribution of revenue and receivables, based on the reports reviewed by the directors are set out as follows
Geographical segments
The geographical analysis relating to the primary segment based on the location of the Group’s customers is as follows:
SalesGroup Parent company
2010 2009 2010 2009RO RO RO RO
Far East 4,749,431 4,411,136 4,749,431 4,411,136GCC and Middle East 4,492,243 4,128,369 4,475,132 4,119,030Europe 854,383 1,160,433 854,383 1,160,433Others 1,733,783 1,155,730 1,733,783 1,155,730
11,829,840 10,855,668 11,812,729 10,846,329

15
NOTES TO THE CONSOLIDATED FINANCIAL STATEMENTS
For the year ended 31 March 2010
5 Segment information (continued)
Trade debtors
Group Parent company
2010 2009 2010 2009
RO RO RO RO
Far East 384,186 223,852 384,186 223,852
GCC and Middle East 377,937 349,398 347,964 331,451
Europe 55,341 240,669 55,341 240,669
Others 61,160 87,839 61,160 87,839
878,624 901,758 848,651 883,811
6 Sales
Group Parent company
2010 2009 2010 2009
RO RO RO RO
Procured from fishermen 7,320,764 5,794,379 7,320,764 5,794,379
Purchased from Yemen centre 1,758,102 2,479,407 1,758,102 2,479,407
Received from trawler companies under fishing rights 958,373 714,133 958,373 714,133
Breaded products 811,122 795,002 794,011 785,663
Purchased from Saudi Arabia centre 541,443 703,948 541,443 703,948
Frozen fish purchased from other suppliers and trawlers operating outside Oman 401,578 343,216 401,578 343,216
Purchased from Bahrain center 37,425 - 37,425 -
Received from operation of own boats 723 - 723 -
Purchased from India centre 310 25,337 310 25,337
Purchased from Somalia centre - 246 - 246
11,829,840 10,855,668 11,812,729 10,846,329
7 Cost of goods sold
Group Parent company
2010 2009 2010 2009
RO RO RO RO
Opening stock of fish 1,526,621 1,460,317 1,526,621 1,460,317
Purchases 6,757,975 6,906,945 6,757,975 6,906,945
Packing material consumed 308,974 302,941 308,974 302,941
Processing charges 304,496 409,609 304,496 409,609
Closing stock of fish (1,235,807) (1,526,621) (1,235,807) (1,526,621)
7,662,259 7,553,191 7,662,259 7,553,191
16
NOTES TO THE CONSOLIDATED FINANCIAL STATEMENTS
For the year ended 31 March 2010
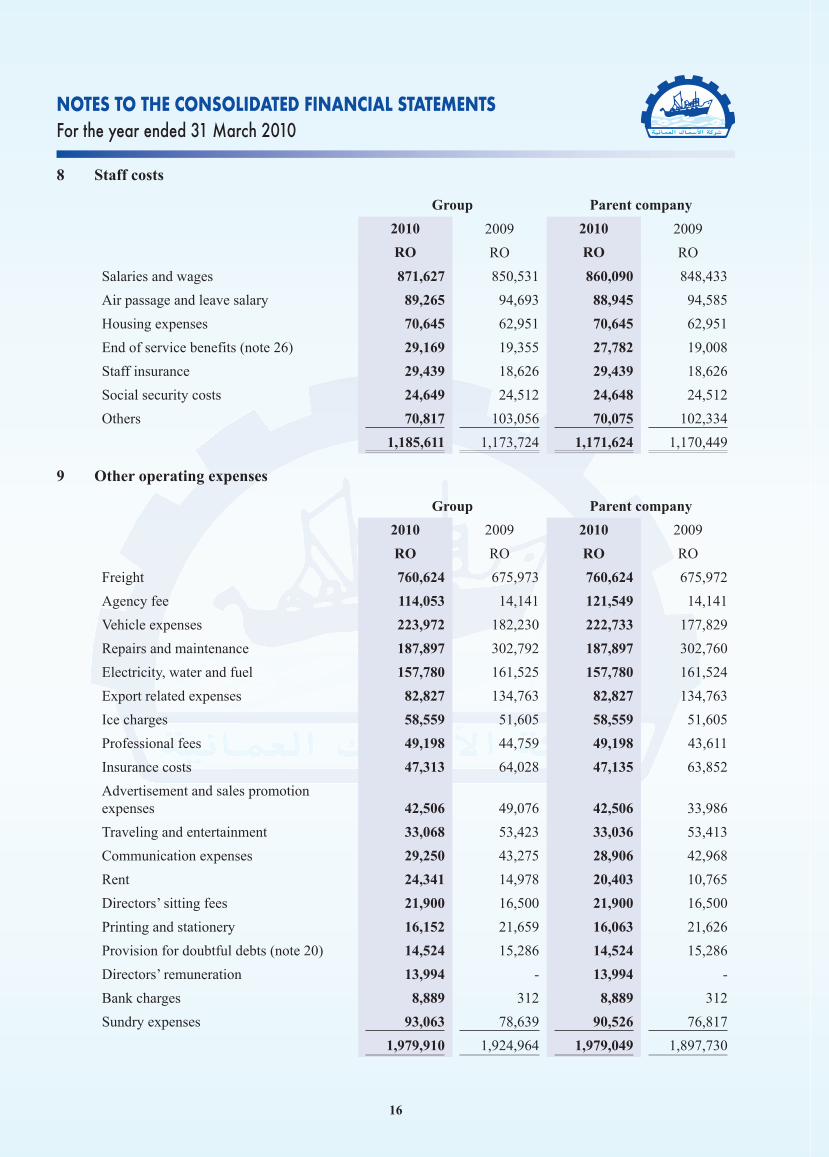
8 Staff costs
Group Parent company
2010 2009 2010 2009
RO RO RO RO
Salaries and wages 871,627 850,531 860,090 848,433
Air passage and leave salary 89,265 94,693 88,945 94,585
Housing expenses 70,645 62,951 70,645 62,951
End of service benefits (note 26) 29,169 19,355 27,782 19,008
Staff insurance 29,439 18,626 29,439 18,626
Social security costs 24,649 24,512 24,648 24,512
Others 70,817 103,056 70,075 102,334
1,185,611 1,173,724 1,171,624 1,170,449
9 Other operating expenses
Group Parent company
2010 2009 2010 2009
RO RO RO RO
Freight 760,624 675,973 760,624 675,972
Agency fee 114,053 14,141 121,549 14,141
Vehicle expenses 223,972 182,230 222,733 177,829
Repairs and maintenance 187,897 302,792 187,897 302,760
Electricity, water and fuel 157,780 161,525 157,780 161,524
Export related expenses 82,827 134,763 82,827 134,763
Ice charges 58,559 51,605 58,559 51,605
Professional fees 49,198 44,759 49,198 43,611
Insurance costs 47,313 64,028 47,135 63,852
Advertisement and sales promotion expenses 42,506 49,076 42,506 33,986
Traveling and entertainment 33,068 53,423 33,036 53,413
Communication expenses 29,250 43,275 28,906 42,968
Rent 24,341 14,978 20,403 10,765
Directors’ sitting fees 21,900 16,500 21,900 16,500
Printing and stationery 16,152 21,659 16,063 21,626
Provision for doubtful debts (note 20) 14,524 15,286 14,524 15,286
Directors’ remuneration 13,994 - 13,994 -
Bank charges 8,889 312 8,889 312
Sundry expenses 93,063 78,639 90,526 76,817
1,979,910 1,924,964 1,979,049 1,897,730

17
NOTES TO THE CONSOLIDATED FINANCIAL STATEMENTS
For the year ended 31 March 2010
10 Investment income
Group and Parent company
2010 2009
RO RO
Financial assets at fair value through profit or loss
Dividend income 59,536 109,584
Gain/(loss) on sale of investments 222,855 (610,506)
Fair value gain/(loss) (note 21) 362,121 (1,269,579)
644,512 (1,770,501)
11 Foreign exchange gains - net
Profit before taxation is arrived at after crediting RO 33,293 (2009 - RO 788) on account of foreign exchange gains on year-end translation of foreign currency assets and liabilities.
12 Finance income - net
Group and Parent company
2010 2009
RO RO
Finance costs
Interest expenses on overdraft (2,568) (8,233)
Finance income
Interest income on deposits (note 22) 318,152 333,607
Interest income on held to maturity financial assets (note 17) 150,950 102,031
469,102 435,638
Finance income - net 466,534 427,405
13 Taxation
(a) The tax charge/(credit) for the year is analysed as follows:
Group and Parent company
2010 2009
RO RO
Current tax
In respect of current year 123,670 33,268
In respect of prior year (2,540) -
121,130 33,268
Deferred tax (note 27) (14,209) (15,875)
106,921 17,393
(b) The company is subject to income tax at the rate of 12% of taxable profits in excess of RO 30,000 (2009 - 12%) in accordance with the income tax laws of the Sultanate of Oman. The following is reconciliation between income taxes calculated on accounting profits at the applicable tax rates with the income tax expense for the year:

18
NOTES TO THE CONSOLIDATED FINANCIAL STATEMENTS
For the year ended 31 March 2010
13 Taxation (Continued)
Group and Parent company2010 2009RO RO
Tax expense/(benefit) on accounting profit/(loss) 186,802 (191,467)Add/(less) tax effect of:Income not subject to tax (77,341) (13,150)Expenses not deductible - 225,610Reversal of excess tax provision in prior year (2,540) -Tax rate difference - (3,600)Tax charge for the year 106,921 17,393
(c) Gains and losses on sales of securities through the Muscat Securities Market are exempt from taxation from 2003.
(d) The tax assessments for the year ended 31 March 2006 to 2009 have not yet been agreed with the Oman Taxation Authorities. Board of Directors is of the opinion that any additional taxes that may be assessed would not be significant to the financial position of the Parent Company at 31 March 2010. The Parent Company was not subject to tax prior to 22 October 1999.
Oman Fisheries Co. FZE (The subsidiary)
Oman Fisheries Co. FZE is registered in Free Zone Establishment with limited liability at Sharjah Airport International Free Zone (SAIF Zone) in the Emirate of Sharjah and is not subject to taxation in the UAE.
(e) The movement in current tax liability is as follows:
Group and Parent company 2010 2009
RO ROAt 1 April 64,471 31,203Charge for the year 123,670 33,268Reversal in respect of prior year (2,540) -Paid during the year (30,728) -At 31 March 154,873 64,471
14 Earnings/(loss) per share
The earnings/(loss) per share has been derived by dividing the net profit/(loss) for the year attributable to shareholders by the weighted average number of shares outstanding. As there are no dilutive potential shares, the diluted earnings/(loss) per share is identical to the basic earnings/(loss) per share.
Group GroupParent
companyParent
Company
2010 2009 2010 2009
Profit/(loss) attributable to shareholders (RO) 1,484,673 (1,634,187) 1,479,766 (1,612,954)
Weighted average number of shares outstanding 125,000,000 125,000,000 125,000,000 125,000,000
Earnings/(loss) per share (RO) 0.012 (0.013) 0.012 (0.013)

19
NOTES TO THE CONSOLIDATED FINANCIAL STATEMENTS
For the year ended 31 March 2010
15 Property, plant and equipment
Group
Land, buildings
and cabinsPlant and equipment
Boats and trawlers
Motor vehicles
Furniture, fixtures
and office equipment
Capital work in progress Total
RO RO RO RO RO RO RO
Cost
1 April 2009 1,396,630 1,801,161 477,107 191,796 238,245 - 4,104,939
Additions 56,877 78,246 1,050 14,960 29,032 235,516 415,681
Disposals - - (474,890) - (2,770) - (477,660)
31 March 2010 1,453,507 1,879,407 3,267 206,756 264,507 235,516 4,042,960
Depreciation
1 April 2009 1,184,761 1,433,522 299,642 165,197 196,938 - 3,280,060
Charge for the year 50,369 111,576 28,207 16,141 20,595 - 226,888
Disposals - - (324,583) - (2,722) - (327,305)
31 March 2010 1,235,130 1,545,098 3,266 181,338 214,811 - 3,179,643
Net book value
31 March 2010 218,377 334,309 1 25,418 49,696 235,516 863,317
Land, buildings
and cabinsPlant and equipment
Boats and trawlers
Motor Vehicles
Furniture, fixtures and
office Equipment Total
RO RO RO RO RO RO
Cost
1 April 2008 1,380,910 1,791,174 631,794 179,146 261,705 4,244,729
Additions 16,445 62,267 - 12,650 13,553 104,915
Disposals (725) (52,280) (7,126) - (37,013) (97,144)
Impairment - - (147,561) - - (147,561)
31 March 2009 1,396,630 1,801,161 477,107 191,796 238,245 4,104,939
Depreciation
1 April 2008 1,120,403 1,373,383 251,223 149,423 213,471 3,107,903
Charge for the year 64,776 111,320 55,545 15,774 20,459 267,874
Disposals (418) (51,181) (7,126) - (36,992) (95,717)
31 March 2009 1,184,761 1,433,522 299,642 165,197 196,938 3,280,060
Net book value
31 March 2009 211,869 367,639 177,465 26,599 41,307 824,879

20
NOTES TO THE CONSOLIDATED FINANCIAL STATEMENTS
For the year ended 31 March 2010
15 Property, plant and equipment (continued)
Parent Company
Land, buildings
and cabinsPlant and equipment
Boats and trawlers
MotorVehicles
Furniture, fixtures
and office equipment
Capital work in progress Total
RO RO RO RO RO RO RO
Cost
1 April 2009 1,396,630 1,801,161 477,107 191,796 237,978 - 4,104,672
Additions 56,877 78,246 1,050 14,960 29,032 235,516 415,681
Disposals - - (474,890) - (2,770) - (477,660)
31 March 2010 1,453,507 1,879,407 3,267 206,756 264,240 235,516 4,042,693
Depreciation
1 April 2009 1,184,761 1,433,522 299,642 165,197 196,740 - 3,279,862
Charge for the year 50,369 111,576 28,207 16,141 20,552 - 226,845
Disposals - - (324,583) - (2,722) - (327,305)
31 March 2010 1,235,130 1,545,098 3,266 181,338 214,570 - 3,179,402
Net book value
31 March 2010 218,377 334,309 1 25,418 49,670 235,516 863,291
Land, buildings
and cabinsPlant and equipment
Boats and trawlers
Motorvehicles
Furniture, fixtures and
officeequipment Total
RO RO RO RO RO RO
Cost
1 April 2008 1,380,910 1,791,174 631,794 179,146 261,438 4,244,462
Additions 16,445 62,267 - 12,650 13,553 104,915
Disposals (725) (52,280) (7,126) - (37,013) (97,144)
Impairment - - (147,561) - - (147,561)
31 March 2009 1,396,630 1,801,161 477,107 191,796 237,978 4,104,672
Depreciation
1 April 2008 1,120,403 1,373,383 251,223 149,423 213,336 3,107,768
Charge for the year 64,776 111,320 55,545 15,774 20,396 267,811
Disposals (418) (51,181) (7,126) - (36,992) (95,717)
31 March 2009 1,184,761 1,433,522 299,642 165,197 196,740 3,279,862
Net book value
31 March 2009 211,869 367,639 177,465 26,599 41,238 824,810
Included above at a net book value of RO 13,557 (2009 - RO 7,724) are buildings and cabins constructed on leasehold land. The lease agreement will expire on 28 February 2011 and is renewable annually. The annual rental of this land is RO 10,288 (2009 - RO 9,615).

21
NOTES TO THE CONSOLIDATED FINANCIAL STATEMENTS
For the year ended 31 March 2010
16 Investment in subsidiary
Details regarding the Parent company’s subsidiary are set out below:
Company nameCountry of
incorporation Year endPercentage held
Principal activities
2010 2009
Oman Fisheries Co. FZE UAE 31 March 100% 100% Procurement and sale of fish and fish products
17. Held to maturity financial assets
Group and Parent company
2010 2009
RO RO
At 1 April 1,637,581 2,142,186
Investment during the year 974,797 -
Matured during the year - (500,000)
Premium amortized during the year (5,164) (4,605)
At 31 March 2,607,214 1,637,581
Less: current portion included in current assets (1,502,141) -
1,105,073 1,637,581
Held to maturity financial assets comprise of Oman Government Development Bonds of RO 1,502,141 which earn interest at a rate of 5.25% per annum with maturity on 1 November 2010 and bonds issued by a commercial bank of RO 131,540 which earn interest at the rate of 7% per annum with maturity on 18 June 2013 and of RO 973,533 which earns interest at the rate of 8% per annum with maturity on 7 May 2016.
18 Inventories
Group and Parent company
2010 2009
RO RO
Fish 1,235,807 1,526,621
Maintenance spares 46,500 51,307
Packing materials 108,707 94,237
Others 6,130 4,468
1,397,144 1,676,633
Less: provision for slow moving and obsolete maintenance spares (20,000) (20,000)
1,377,144 1,656,633
(a) Fish stocks at 31 March 2010 represent 45 days (31 March 2009 - 55 days) of sales.
(b) Cost of stock directly written off to cost of sales amounted to RO 9,551 (2009 - RO 117)

22
NOTES TO THE CONSOLIDATED FINANCIAL STATEMENTS
For the year ended 31 March 2010
19 Financial instruments by category
(a) The accounting policies for financial instruments have been applied to the line items below:
Group
31 March 2010Loans and receivables
Held to maturity financial
assets
Financial assets at
fair value through
profit or loss Total
Assets as per statement of financial position RO RO RO RO
Held to maturity financial assets - 2,607,214 - 2,607,214
Financial assets at fair value through profit or loss - - 2,109,378 2,109,378
Trade and other receivables (excluding prepayments) 1,577,727 - - 1,577,727
Deposits 7,481,947 - - 7,481,947
Cash and cash equivalents 576,644 - - 576,644
Total 9,636,318 2,607,214 2,109,378 14,352,910
31 March 2010 Total financial
liabilities
Liabilities as per statement of financial position RO
Trade and other payables (excluding accrued expenses) 341,866
31 March 2009Loans and receivables
Held to maturity financial
assets
Financial assets at
fair value through
profit or loss Total
Assets as per statement of financial position RO RO RO RO
Held to maturity financial assets - 1,637,581 - 1,637,581
Financial assets at fair value through profit or loss - - 1,389,100 1,389,100
Trade and other receivables (excluding prepayments) 1,479,032 - - 1,479,032
Deposits 7,204,131 - - 7,204,131
Cash and cash equivalents 792,007 - - 792,007
Total 9,475,170 1,637,581 1,389,100 12,501,851
31 March 2009Total financial
liabilities
Liabilities as per statement of financial position RO
Trade and other payables (excluding accrued expenses) 352,235
23
NOTES TO THE CONSOLIDATED FINANCIAL STATEMENTS
For the year ended 31 March 2010
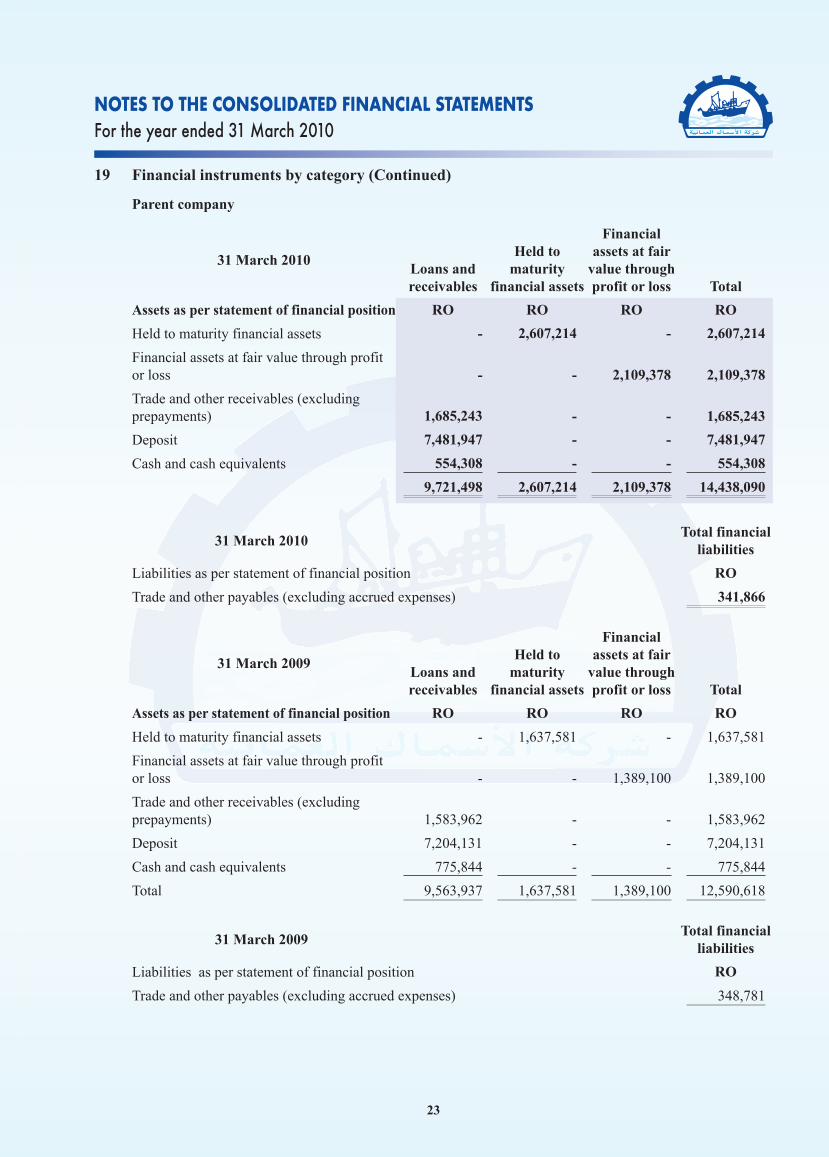
19 Financial instruments by category (Continued)
Parent company
31 March 2010Loans and receivables
Held to maturity
financial assets
Financial assets at fair
value through profit or loss Total
Assets as per statement of financial position RO RO RO RO
Held to maturity financial assets - 2,607,214 - 2,607,214
Financial assets at fair value through profit or loss - - 2,109,378 2,109,378
Trade and other receivables (excluding prepayments) 1,685,243 - - 1,685,243
Deposit 7,481,947 - - 7,481,947
Cash and cash equivalents 554,308 - - 554,308
9,721,498 2,607,214 2,109,378 14,438,090
31 March 2010Total financial
liabilities
Liabilities as per statement of financial position RO
Trade and other payables (excluding accrued expenses) 341,866
31 March 2009Loans and receivables
Held to maturity
financial assets
Financial assets at fair
value through profit or loss Total
Assets as per statement of financial position RO RO RO RO
Held to maturity financial assets - 1,637,581 - 1,637,581
Financial assets at fair value through profit or loss - - 1,389,100 1,389,100
Trade and other receivables (excluding prepayments) 1,583,962 - - 1,583,962
Deposit 7,204,131 - - 7,204,131
Cash and cash equivalents 775,844 - - 775,844
Total 9,563,937 1,637,581 1,389,100 12,590,618
31 March 2009Total financial
liabilities
Liabilities as per statement of financial position RO
Trade and other payables (excluding accrued expenses) 348,781
24
NOTES TO THE CONSOLIDATED FINANCIAL STATEMENTS
For the year ended 31 March 2010
19 Financial instruments by category (Continued)
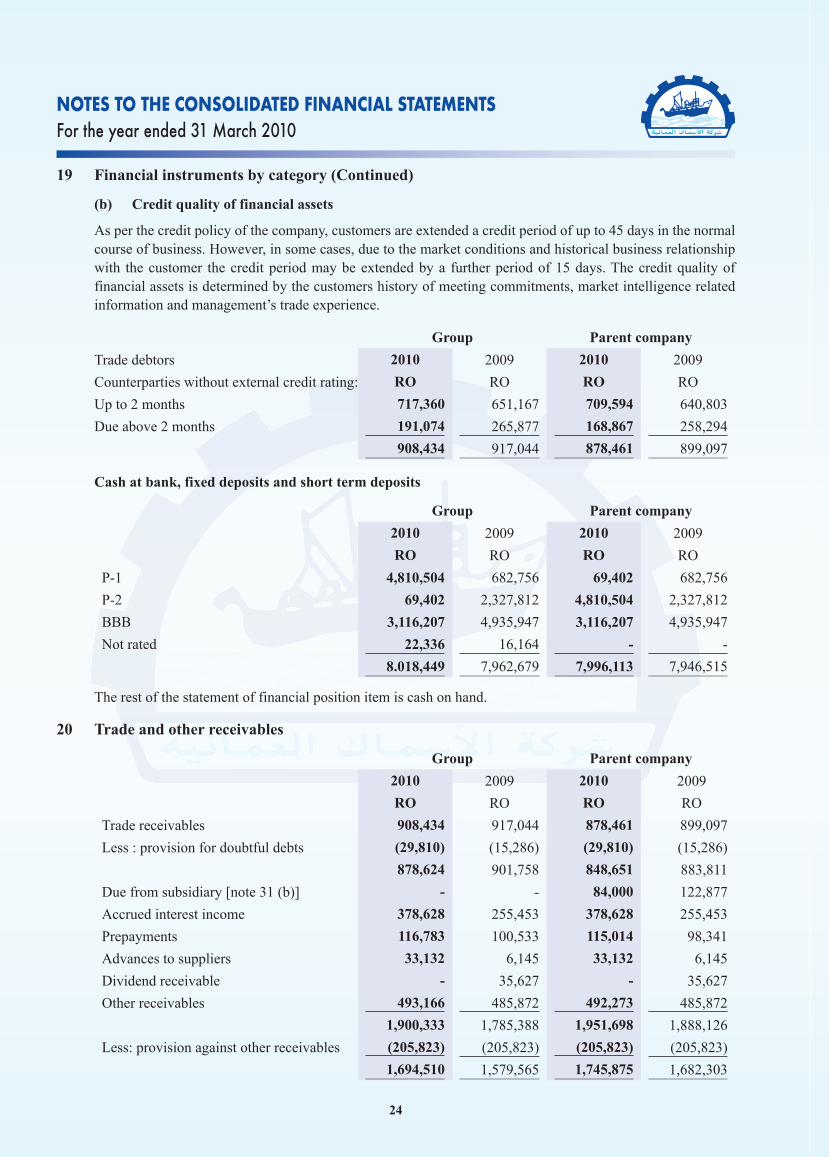
(b) Credit quality of financial assets
As per the credit policy of the company, customers are extended a credit period of up to 45 days in the normal course of business. However, in some cases, due to the market conditions and historical business relationship with the customer the credit period may be extended by a further period of 15 days. The credit quality of financial assets is determined by the customers history of meeting commitments, market intelligence related information and management’s trade experience.
Group Parent company
Trade debtors 2010 2009 2010 2009
Counterparties without external credit rating: RO RO RO RO
Up to 2 months 717,360 651,167 709,594 640,803
Due above 2 months 191,074 265,877 168,867 258,294
908,434 917,044 878,461 899,097
Cash at bank, fixed deposits and short term deposits
Group Parent company
2010 2009 2010 2009
RO RO RO RO
P-1 4,810,504 682,756 69,402 682,756
P-2 69,402 2,327,812 4,810,504 2,327,812
BBB 3,116,207 4,935,947 3,116,207 4,935,947
Not rated 22,336 16,164 - -
8.018,449 7,962,679 7,996,113 7,946,515
The rest of the statement of financial position item is cash on hand.
20 Trade and other receivables
Group Parent company
2010 2009 2010 2009
RO RO RO RO
Trade receivables 908,434 917,044 878,461 899,097
Less : provision for doubtful debts (29,810) (15,286) (29,810) (15,286)
878,624 901,758 848,651 883,811
Due from subsidiary [note 31 (b)] - - 84,000 122,877
Accrued interest income 378,628 255,453 378,628 255,453
Prepayments 116,783 100,533 115,014 98,341
Advances to suppliers 33,132 6,145 33,132 6,145
Dividend receivable - 35,627 - 35,627
Other receivables 493,166 485,872 492,273 485,872
1,900,333 1,785,388 1,951,698 1,888,126
Less: provision against other receivables (205,823) (205,823) (205,823) (205,823)
1,694,510 1,579,565 1,745,875 1,682,303

25
NOTES TO THE CONSOLIDATED FINANCIAL STATEMENTS
For the year ended 31 March 2010
20 Trade and other receivables (Continued)
(a) At the reporting date 16% of trade debtors are receivable from one party (2009 - 18% from one party) in the sultanate of Oman.
(b) The fair values of trade and other debtors are assumed to be the same as their carrying amounts above.
(c) Details of gross exposure of trade debtors are set out below:
Group Parent company
2010 2009 2010 2009
RO RO RO RO
Not due 717,360 651,167 709,594 640,803
Past due not impaired 161,264 250,591 139,057 243,008
Past due and impaired 29,810 15,286 29,810 15,286
908,434 917,044 878,461 899,097
(d) As of 31 March 2010, trade debtors of Group RO 161,264 (2009 - RO 250,591), Parent company RO 139,057 (2009 - RO 243,008) were past due but not impaired. These relate to a number of independent customers for whom there is no recent history of default. The ageing analysis of these past due trade debtors is as follows:
Group Parent company
2010 2009 2010 2009
RO RO RO RO
2 to 6 months 152,163 229,526 130,266 222,620
Over 6 months 9,101 21,065 8,791 20,388
Total 161,264 250,591 139,057 243,008
(e) The individually impaired debtors during the year amounting to RO 29,810 (2009 - RO 15,286) related to parties specifically identified by the Parent company and were fully provided for.
(f) Movement in the provision for doubtful debts against trade receivables is as follows:
Group Parent company
2010 2009 2010 2009
RO RO RO RO
At 1 April 15,286 - 15,286 -
Charge for the year 14,524 15,286 14,524 15,286
At 31 March 29,810 15,286 29,810 15,286
(g) Other receivables of Group and Parent company of RO 205,823 (2009 - RO 205,823) were impaired and fully provided for based on assessments of the likelihood of recovery after extensive follow up by the credit department.
(h) The net carrying amounts of the Group’s trade debtors are denominated in the following currencies:
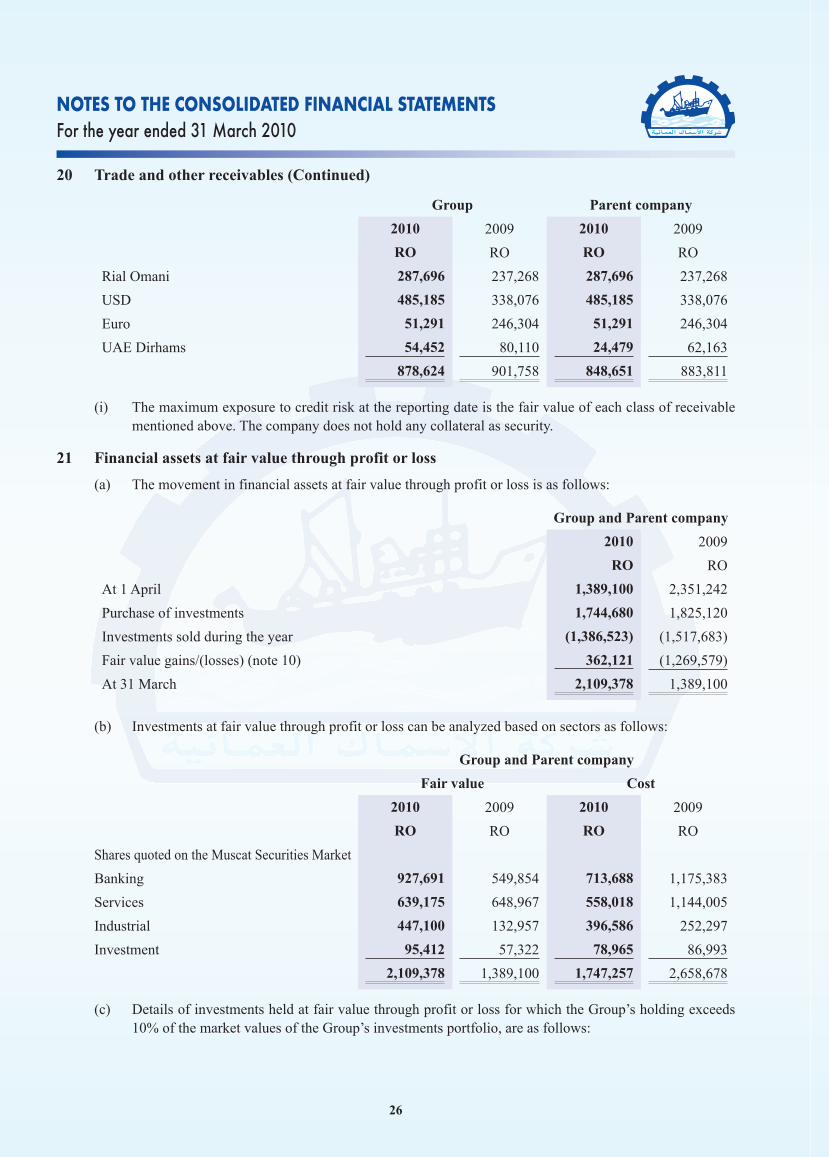
26
NOTES TO THE CONSOLIDATED FINANCIAL STATEMENTS
For the year ended 31 March 2010
20 Trade and other receivables (Continued)
Group Parent company
2010 2009 2010 2009
RO RO RO RO
Rial Omani 287,696 237,268 287,696 237,268
USD 485,185 338,076 485,185 338,076
Euro 51,291 246,304 51,291 246,304
UAE Dirhams 54,452 80,110 24,479 62,163
878,624 901,758 848,651 883,811
(i) The maximum exposure to credit risk at the reporting date is the fair value of each class of receivable mentioned above. The company does not hold any collateral as security.
21 Financial assets at fair value through profit or loss
(a) The movement in financial assets at fair value through profit or loss is as follows:
Group and Parent company
2010 2009
RO RO
At 1 April 1,389,100 2,351,242
Purchase of investments 1,744,680 1,825,120
Investments sold during the year (1,386,523) (1,517,683)
Fair value gains/(losses) (note 10) 362,121 (1,269,579)
At 31 March 2,109,378 1,389,100
(b) Investments at fair value through profit or loss can be analyzed based on sectors as follows:
Group and Parent company
Fair value Cost
2010 2009 2010 2009
RO RO RO RO
Shares quoted on the Muscat Securities Market
Banking 927,691 549,854 713,688 1,175,383
Services 639,175 648,967 558,018 1,144,005
Industrial 447,100 132,957 396,586 252,297
Investment 95,412 57,322 78,965 86,993
2,109,378 1,389,100 1,747,257 2,658,678
(c) Details of investments held at fair value through profit or loss for which the Group’s holding exceeds 10% of the market values of the Group’s investments portfolio, are as follows:

27
NOTES TO THE CONSOLIDATED FINANCIAL STATEMENTS
For the year ended 31 March 2010
21 Financial assets at fair value through profit or loss (Continued)
2010 % of investment portfolio
Number of shares
Market valueRO
CostRO
Shares quoted on the Muscat Securities Market:
Bank Muscat SAOG 14% 350,035 296,129 181,473
Renaissance Services SAOG 10% 270,905 214,557 138,464
2009 % of investment
portfolioNumber of
shares
Market value
ROCostRO
Shares quoted on the Muscat Securities Market:
Bank Muscat SAOG 16% 377,462 220,815 606,841
Oman Telecommunications Co. SAOG 19% 231,573 274,646 485,657
22 Bank deposits
Group Parent company
2010 2009 2010 2009
RO RO RO RO
Deposits 7,481,947 7,204,131 7,481,947 7,204,131
Cash and bank balances 576,644 792,007 554,308 775,844
8,058,591 7,996,138 8,036,255 7,979,975
Less: Deposits with maturities between 3 to 12 months classified as short term deposits (500,000) (1,538,104) (500,000) (1,538,104)
Less: Deposits with maturities over 12 months classified as fixed deposits (6,981,947) (5,666,027) (6,981,947) (5,666,027)
Cash and cash equivalents 576,644 792,007 554,308 775,844
(a) Short term deposits are denominated in Rial Omani and are placed with the commercial banks at interest rates ranging between 1.50% to 4.9% per annum (2009 - 4.35% to 6.00%) and have maturity of one year from the date of placement.
(b) Long term deposits are denominated in Rial Omani and are placed with the commercial banks at interest rates ranging from 4.75% to 5.25% (2009 - 4.4% to 4.9%) per annum and have maturity ranging from 15 months to 36 months from the date of placement.
23 Share capital
(a) The share capital comprises of 125,000,000 (2009 - 125,000,000) fully paid ordinary shares of RO 0.100 each (2009 - RO 0.100) each.
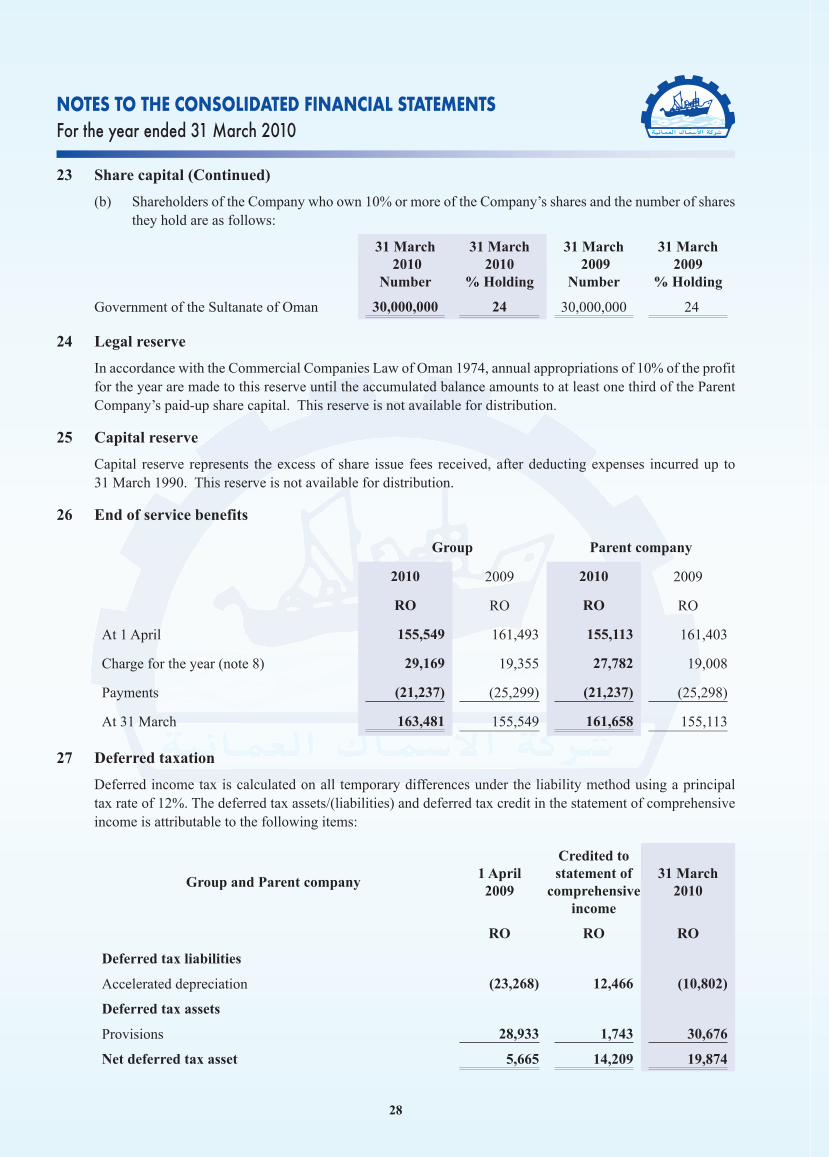
28
NOTES TO THE CONSOLIDATED FINANCIAL STATEMENTS
For the year ended 31 March 2010
23 Share capital (Continued)
(b) Shareholders of the Company who own 10% or more of the Company’s shares and the number of shares they hold are as follows:
31 March 2010
Number
31 March2010
% Holding
31 March 2009
Number
31 March 2009
% Holding
Government of the Sultanate of Oman 30,000,000 24 30,000,000 24
24 Legal reserve
In accordance with the Commercial Companies Law of Oman 1974, annual appropriations of 10% of the profit for the year are made to this reserve until the accumulated balance amounts to at least one third of the Parent Company’s paid-up share capital. This reserve is not available for distribution.
25 Capital reserve
Capital reserve represents the excess of share issue fees received, after deducting expenses incurred up to 31 March 1990. This reserve is not available for distribution.
26 End of service benefits
Group Parent company
2010 2009 2010 2009
RO RO RO RO
At 1 April 155,549 161,493 155,113 161,403
Charge for the year (note 8) 29,169 19,355 27,782 19,008
Payments (21,237) (25,299) (21,237) (25,298)
At 31 March 163,481 155,549 161,658 155,113
27 Deferred taxation
Deferred income tax is calculated on all temporary differences under the liability method using a principal tax rate of 12%. The deferred tax assets/(liabilities) and deferred tax credit in the statement of comprehensive income is attributable to the following items:
Group and Parent company1 April2009
Credited to statement of
comprehensive income
31 March2010
RO RO RO
Deferred tax liabilities
Accelerated depreciation (23,268) 12,466 (10,802)
Deferred tax assets
Provisions 28,933 1,743 30,676
Net deferred tax asset 5,665 14,209 19,874

29
NOTES TO THE CONSOLIDATED FINANCIAL STATEMENTS
For the year ended 31 March 2010
27 Deferred taxation (Continued)
Group and Parent company1 April2008
Credited to statement of
comprehensive income
31 March2009
RO RO RO
Deferred tax liabilities
Accelerated depreciation (37,309) 14,041 (23,268)
Deferred tax assets
Provisions 27,099 1,834 28,933
Net deferred tax (liability)/asset (10,210) 15,875 5,665
28 Trade and other payables
Group Parent company
2010 2009 2010 2009
RO RO RO RO
Trade payables 245,671 284,212 245,671 284,212
Accrued expenses 445,060 377,231 443,958 376,410
Other payables 55,152 54,340 55,152 50,886
Advances from customers 41,043 13,683 41,043 13,683
786,926 729,466 785,824 725,191
29 Net assets per share
Net assets per share is calculated by dividing the net assets attributable to shareholders of the Group’s and Parent company at the year end by the number of shares outstanding at the year end as follows:
Group Parent company
2010 2009 2010 2009
Net assets (RO) 15,624,748 14,140,075 15,726,808 14,247,042
Number of shares at 31 March 125,000,000 125,000,000 125,000,000 125,000,000
Net assets per share (RO) 0.125 0.113 0.126 0.114
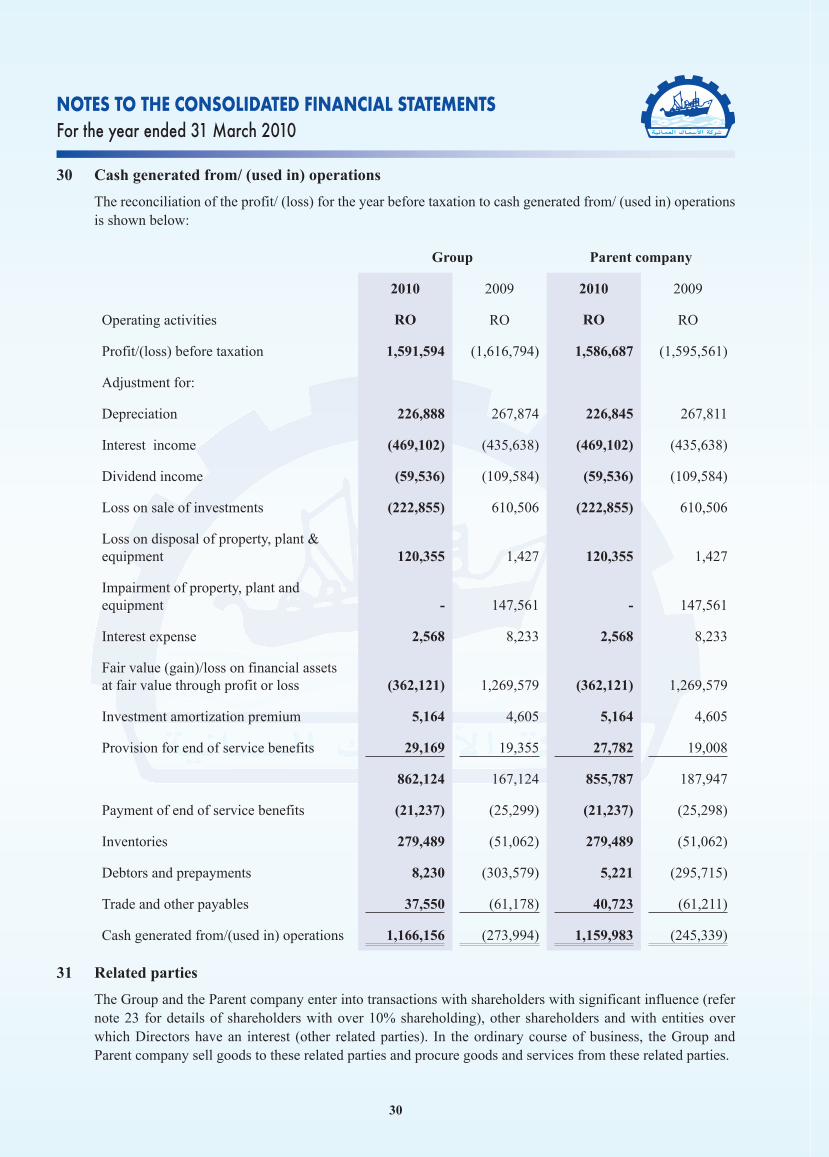
30
NOTES TO THE CONSOLIDATED FINANCIAL STATEMENTS
For the year ended 31 March 2010
30 Cash generated from/ (used in) operations
The reconciliation of the profit/ (loss) for the year before taxation to cash generated from/ (used in) operations is shown below:
Group Parent company
2010 2009 2010 2009
Operating activities RO RO RO RO
Profit/(loss) before taxation 1,591,594 (1,616,794) 1,586,687 (1,595,561)
Adjustment for:
Depreciation 226,888 267,874 226,845 267,811
Interest income (469,102) (435,638) (469,102) (435,638)
Dividend income (59,536) (109,584) (59,536) (109,584)
Loss on sale of investments (222,855) 610,506 (222,855) 610,506
Loss on disposal of property, plant & equipment 120,355 1,427 120,355 1,427
Impairment of property, plant and equipment - 147,561 - 147,561
Interest expense 2,568 8,233 2,568 8,233
Fair value (gain)/loss on financial assets at fair value through profit or loss (362,121) 1,269,579 (362,121) 1,269,579
Investment amortization premium 5,164 4,605 5,164 4,605
Provision for end of service benefits 29,169 19,355 27,782 19,008
862,124 167,124 855,787 187,947
Payment of end of service benefits (21,237) (25,299) (21,237) (25,298)
Inventories 279,489 (51,062) 279,489 (51,062)
Debtors and prepayments 8,230 (303,579) 5,221 (295,715)
Trade and other payables 37,550 (61,178) 40,723 (61,211)
Cash generated from/(used in) operations 1,166,156 (273,994) 1,159,983 (245,339)
31 Related parties
The Group and the Parent company enter into transactions with shareholders with significant influence (refer note 23 for details of shareholders with over 10% shareholding), other shareholders and with entities over which Directors have an interest (other related parties). In the ordinary course of business, the Group and Parent company sell goods to these related parties and procure goods and services from these related parties.

31
NOTES TO THE CONSOLIDATED FINANCIAL STATEMENTS
For the year ended 31 March 2010
31 Related parties (Continued)
(a) Transactions with related parties during the year were as follows:
(i) Sale of goods and services
Parent company
2010 2009
RO RO
Sale of goods:
- Subsidiary 48,974 41,264
(b) Year end balances arising from sales and purchases of goods and services are as follows:
Due from subsidiary
Parent company
2010 2009
RO RO
Due within one year 84,000 122,877
Due after more than one year 54,382 -
Amounts due from the subsidiary do not carry interest and has no fixed repayment schedule but management has estimated the receipts expected in the next twelve months and classified them as a current receivable.
No provision has been required in 2010 and 2009 in respect of amounts due from subsidiary.
(c) Directors’ remuneration and sitting fees
Group and Parent company
2010 2009
RO RO
Sitting fees for directors 21,900 16,500
Directors’ remuneration 13,994 -
(d) Key management compensation
Group and Parent company
2010 2009
RO RO
Salaries and allowances 86,725 100,582
Other benefits and expenses 10,840 12,859
End of service benefits 3,455 3,865
101,020 117,306

32
NOTES TO THE CONSOLIDATED FINANCIAL STATEMENTS
For the year ended 31 March 2010
32 Contingent liabilities
(a) Bank guarantees
At 31 March 2010, the company had contingent liabilities in respect of bank guarantees amounting to RO 1,400,912 (2009 - RO 1,320,000) given in the normal course of business on which no material liabilities are expected to arise.
(b) Legal case
At 31 March 2010, there were two legal cases outstanding against the company, details of which are set out below:
(i) The company faces legal claims from a landlord with respect to dispute over rentals of one of the staff accommodation. The company is defending the case in the Court of Law in the Sultanate of Oman. The court has given the judgment against the company; however the company has appealed against the judgment. The management is of the opinion that no material liabilities would arise and accordingly no liability has been recognised in these financial statements.
(ii) The company also faces a legal case filed by one of the ex-employee for wrongful termination. The company is defending the case in the Court of Law in the Sultanate of Oman. Given the circumstances under which the employee was terminated, the management consider it remote that any material liability will arise on the company.
33 Commitments
Purchase commitments
At 31 March 2010, the value of outstanding purchase orders and letters of credit amounted to RO 279,447 (2009 - RO 53,118).
34 Comparative figures
Certain comparative figures have been reclassified in order to conform to the presentation for the current year.
Report of the Auditors - page 1.