hkscan corporation q3 interim report, 3 nov 2009 · boguslaw miszczuk eur 1 179.3m
TRANSCRIPT

HKScan CorporationQ3 Interim report, 3 Nov 2009
CEO Matti Perkonoja
Press conference, 3 November 2009

03/2009 2
St Petersburg
Outokumpu
Vantaa
EuraSäkylä
Turku Tallinn
RakvereStockholm
Riga
Vilnius
UppsalaÖrebro
LinköpingSkara
VisbyHalmstad
StrövelstorpKristianstad
Bjæverskov
Swinoujscie
PoznanWarsaw
Czyzew
SokolowKolo
JaroslawTarnowDebica
Ullånger
Luuleå
Surrey
Viiratsi
HKScan CorporationNet sales in 2008: EUR 2 294.6m, CEO Matti Perkonoja
Finland Sweden Baltics Poland
net sales
in 2008:
EUR 168.2m
• AS Rakvere
Lihakombinaat
Managing director
Anne Mere
• AS Tallegg
Managing director
Teet Soorm
net sales
in 2008:
EUR 270.9m**
• Saturn Nordic
Holding AB
Sokolów S.A.
Managing director
Boguslaw Miszczuk
net sales
in 2008:
EUR 1 179.3m
• Scan AB
Managing director
Denis Mattsson
net sales
in 2008:
EUR 740.4m
• HK
Ruokatalo Oy
Managing
director
Jari Leija
Group structure
* Between segments EUR -64.3 million
** Joint venture Saturn Nordic Holding owned 50/50 by HKScan and Danish
Crown holds 100% of shares in Sokolów. In 2008, half of Sokolów’s net
sales i.e. EUR 270.9 million were accounted for in HKScan Group figures.
Sales office
Production facility
ForssaMellilä
Skellefteå

03/2009 3
Outokumpu
Vantaa
EuraSäkylä
Turku Tallinn
Rakvere
Riga
Vilnius
Uppsala
Örebro
LinköpingSkara
VisbyHalmstad
StrövelstorpKristianstad
Bjæverskov
Swinoujscie
PoznanWarsaw
Czyzew
SokolowKolo
JaroslawTarnowDebica
Ullånger
Luuleå
Surrey
Viiratsi
Sales office
Production facility
ForssaMellilä
Skellefteå
Group structure
Finland Sweden Baltics Poland
Business processes
Business processes
Business processes
HKScan Corporation
Support processes
Support processes
M.Perkonoja 3.11.2009
St Petersburg
Stockholm

M.Perkonoja 3.11.2009 4
HKScan Corporation
Q3/
2009
Q3/
2008
Q1-Q3/
2009
Q1-Q3/
2008
2008
Net sales, EUR mill. 533.5 600.4 1 567.2 1 702.3 2 294.6
EBIT, EUR mill. 14.1 12.3 36.6 22.8 38.1
- EBIT margin, % 2.6 2.0 2.3 1.3 1.7
Profit / loss before taxes 10.8 5.4 21.9 3.1 9.0
Earnings/share, EUR 0.22 0.05 0.40 -0.05 0.12
• The Group’s competitiveness continued to grow stronger and supplier
shares increased in all of the company’s market areas.
•January-September positive for HKScan as anticipated.
• Nine-month EBIT was EUR 36.6 million (EUR 22.8 million).
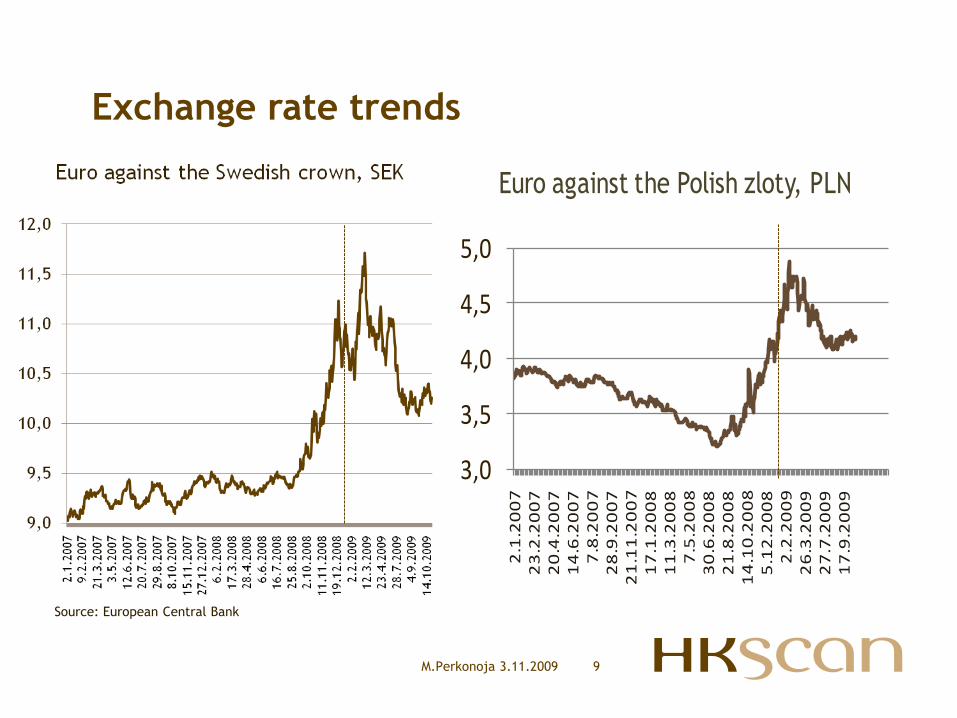
• Owing to changes in exchange rates, net sales in euro declined in the early
part of the year, yet at fixed rates increased by ca. 1%.
• EBIT for January-September is eroded by non-recurring charges of
approximately EUR 7m.

Group EBIT Bridge – Q3 /2008 vs. Q3 /2009
Net effect 1,8 milj.eur
M€
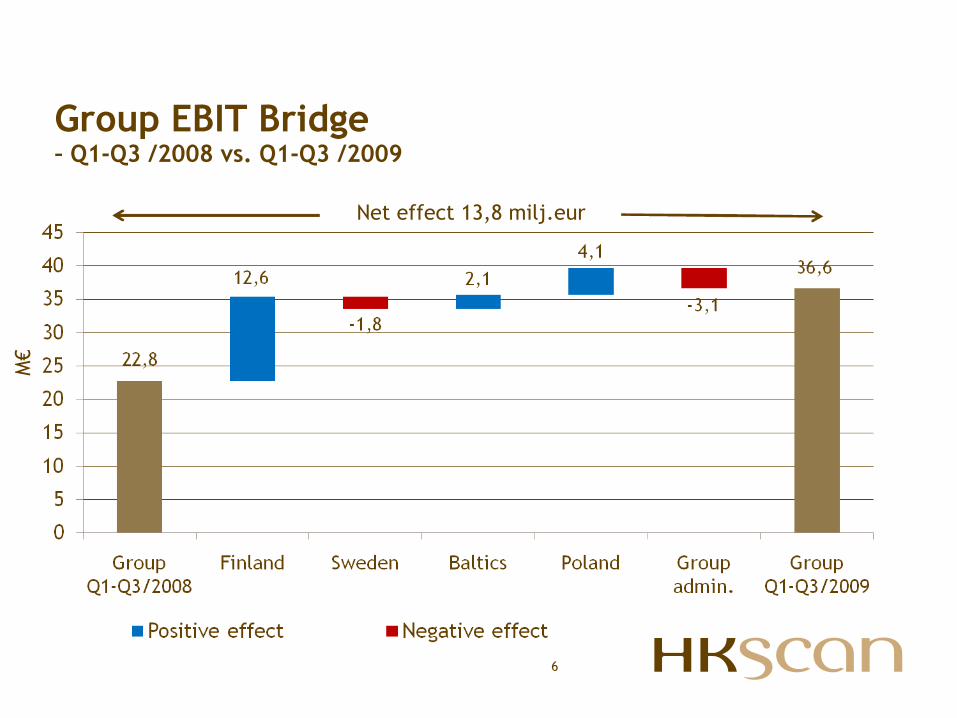
Group EBIT Bridge – Q1-Q3 /2008 vs. Q1-Q3 /2009
6
Net effect 13,8 milj.eur
M€

Group EBIT Bridge (one-off items separately) – Q3 /2008 vs. Q3 /2009
7
Net effect 1,8 milj.eur
M€

Group EBIT Bridge (one-off items separately) – Q1-Q3 /2008 vs. Q1-Q3 /2009
8
Net effect 13,8 milj.eur
M€
9
Exchange rate trends
Source: European Central Bank
M.Perkonoja 3.11.2009
3,0
3,5
4,0
4,5
5,0
2.1.2007
23.2.2007
20.4.2007
14.6.2007
7.8.2007
28.9.2007
21.11.2007
17.1.2008
11.3.2008
7.5.2008
30.6.2008
21.8.2008
14.10.2008
5.12.2008
2.2.2009
26.3.2009
27.7.2009
17.9.2009
Euro against the Polish zloty, PLN

10
Market area: Finland
Q3/
2009 Q3/
2008 Q1-Q3/
2009 Q1-Q3/
2008 2008
Net sales, EUR million 181.6 183.7 547.2 543.2 740.4 EBIT, EUR million 7.7 4.5 20.6 8.0 14.4 - EBIT margin, % 4.2 2.5 3.8 1.5 1.9
• EBIT grew in Q3 as anticipated. The year-on-year increase was 71%.
• Improved EBIT was based on HK Ruokatalo’s:o cost-effective operations
o excellent delivery reliability resulting in higher supplier shares.
• The slight decline in net sales was attributable to reduced export revenue.
• Domestic sales increased considerably in terms of both volume and value.
• Responsibility highlighted in consumer communications:o Kariniemen responsibility programme: farm, environment, taste and nutrition
o HK sandwich meat package redesign: marked reduction in use of plastic in packaging
• Earnings for January-September include a non-recurring cost provision of EUR 1.1 million (EUR 0.0 million) recognised in Q1.
M.Perkonoja 3.11.2009

11
Market area: Sweden
Q3/
2009 Q3/
2008 Q1-Q3/
2009 Q1-Q3/
2008 2008
Net sales, EUR million 256.2 315.4 759.1 877.7 1 179.3
EBIT, EUR million 2.5 5.5 7.6 9.4 18.0
- EBIT margin, % 1.0 1.7 1.0 1.1 1.5
• Net sales in crowns were nearly in line with comparison period Q3/2008.
• Streamlining plan announced in September:o industrial restructuring
o possible personnel cuts
• The measures are envisioned to deliver annual streamlining benefits of
EUR 30 million by the end of 2012.
• EUR 12m will be invested over the same time in the Swedish business.
• Non-recurring charges of EUR 4.5m (EUR 0.0m)recognised since the start
of the year:• Q3: EUR 2.8 million (EUR 0.0 million)relating to the streamlining plan
• Q1-Q2: EUR 1.7 million relating to personnel downsizing
M.Perkonoja 3.11.2009

12
Market area: Baltics
Q3/ 2009
Q3/ 2008
Q1-Q3/ 2009
Q1-Q3/ 2008
2008
Net sales, EUR million 40.5 44.2 118.8 125.2 168.2
EBIT, EUR million 3.4 1.7 7.9 5.8 6.4
- EBIT margin, % 8.3 3.8 6.6 4.7 3.8
• Rakvere Lihakombinaat and Tallegg have grown their earnings and
strengthened their market position:o Sustained cost control
o Operational flexibility
• The competition setting has grown increasingly fierce.
• The state of the national economies in the Baltics is unclear to some
extent at present.
• Latvia in particular is facing great challenges.
M.Perkonoja 3.11.2009

13
Market area: Poland
*)
Q3/ 2009
Q3/ 2008
Q1-Q3/ 2009
Q1-Q3/ 2008
2008
Net sales, EUR million 69.2 74.2 186.5 204.6 270.9
EBIT, EUR million 2.2 1.6 6.4 2.3 4.2
- EBIT margin, % 3.2 2.2 3.4 1.1 1.6
*) The figures refer to HKScan’s share (50%) of the Sokolów Group’s figures.
• Sokolów's business grew in Q3 in terms of both volume and value.
• Sokolów's net sales for the full nine months grew by 16% year-on-year when measured in zloty.
• The company has gained even better access into the selections of modern retail chains where most of the market growth will be taking place.
• Thanks to solid sales in the domestic market, rising exports and cost control, Sokolów has considerably improved its profitability.
• The recession has not had any considerable effect on the food-buying decisions of consumers in Poland.
M.Perkonoja 3.11.2009

M. Perkonoja 3.11.2009 14
Breakdown of net sales and EBIT Q3/2009
Net sales EUR 533.5m
Finland
33.2%
Baltics
7.4%
Finland
48.7%
Baltics
21.5%
Poland
12.6%
Sweden
46.8%Sweden
15.8%
EBIT EUR 14.1m
* shares calculated exclusive of Group
administration costs
Poland
13.9%
* shares calculated inclusive of internal sales

M. Perkonoja 3.11.2009 15
Breakdown of net sales and EBITQ1-Q3/2009
Net sales EUR 1 567.2m
Finland
34.0%
Baltics
7.4%
Finland
48.5%
Baltics
18.6%
Poland
11.6%
Sweden
47.1%Sweden
17.9%
EBIT 36.6m
* shares calculated exclusive of Group
administration costs
Poland
15.1%
* shares calculated inclusive of internal sales

M. Perkonoja 3.11.2009 16
Quarterly EBIT* development
* reported
EUR mill.

03/2009 17
Future outlook
The conditions of exceptional uncertainty
arising from the global financial crisis
continue to prevail. Consumer demand for
food is nonetheless anticipated to remain
unchanged in Finland and in Sweden,
which provides the foundation for stable
business development in the Group’s main
market areas. Signs of sharp fluctuations
in demand are visible in the Group's other
market areas as well as its export
markets.
Based on business performance and the
outlook in the near term, Group EBIT for
the current year is estimated to clearly
surpass that for 2008.

18
HKScan income statement
(EUR million) Q3/
2009 Q3/
2008 Q1 –Q3/
2009 Q1-Q3/
2008 2008
NET SALES 533.5 600.4 1 567.2 1 702.3 2 294.6
Operating income and expenses -504.0 -572.9 -1 488.2 -1 638.0 -2 203.1
Share of profit of associate 0.6 -0.2 0.8 0.6 0.6
Depreciation and impairment -16.0 -15.0 -43.2 -42.1 -54.0
EBIT 14.1 12.3 36.6 22.8 38.1
- % of net sales 2.6 2.0 2.3 1.3 1.7
Financial income and expenses, net
-4.6 -7.6 -17.2 -20.6 -29.0
Exchange rate differences 0.8 0.2 1.1 -0.1 -1.1
Share of profit of associates
0.5
0.6
1.4
1.0
0.9
PROFIT / LOSS BEFORE TAXES 10.8 5.4 21.9 3.1 9.0
- % of net sales 2.0 0.9 1.4 0.2 0.4
Income taxes -1.1 -2.2 -3.3 -3.5 -1.4
PROFIT / LOSS FOR THE PERIOD 9.8 3.2 18.7 -0.4 7.6

19
HKScan income statement
(EUR million) Q3/
2009
Q3 /
2008
Q1-Q3 /
2009
Q1 –Q3/
2008 2008
OTHER COMPREHENSIVE INCOME Exchange differences on translating
foreign operations 4.5
-2.8 0.9 0.9 -21.9
Available-for-sale investments -0.0 -1.3 0.1 -1.0 -0.2 Cash flow hedging 0.0 -1.0 0.2 0.1 -2.0 TOTAL OTHER COMPREHENSIVE INCOME 4.5 -5.1 1.2 -0.0 -24.1 TOTAL COMPREHENSIVE INCOME
FOR THE PERIOD 14.2
-1.8 19.9 -0.5 -16.5
PROFIT/LOSS FOR THE PERIOD
ATTRIBUTABLE TO:
Equity holders of the parent 9.1 2.1 16.7 -2.1 4.7 Minority interests 0.7 1.1 2.0 1.7 2.9 Total 9.8 3.2 18.7 -0.4 7.6 TOTAL COMPREHENSIVE INCOME FOR
THE PERIOD ATTRIBUTABLE TO:
Equity holders of the parent 13.3 -2.5 17.6 -2.1 -19.0 Minority interests 0.9 0.7 2.2 1.6 2.5 Total 14.2 -1.8 19.9 -0.5 -16.5
EPS, EUR, undiluted/diluted
0.22
0.05
0.40
-0.05
0.12
20
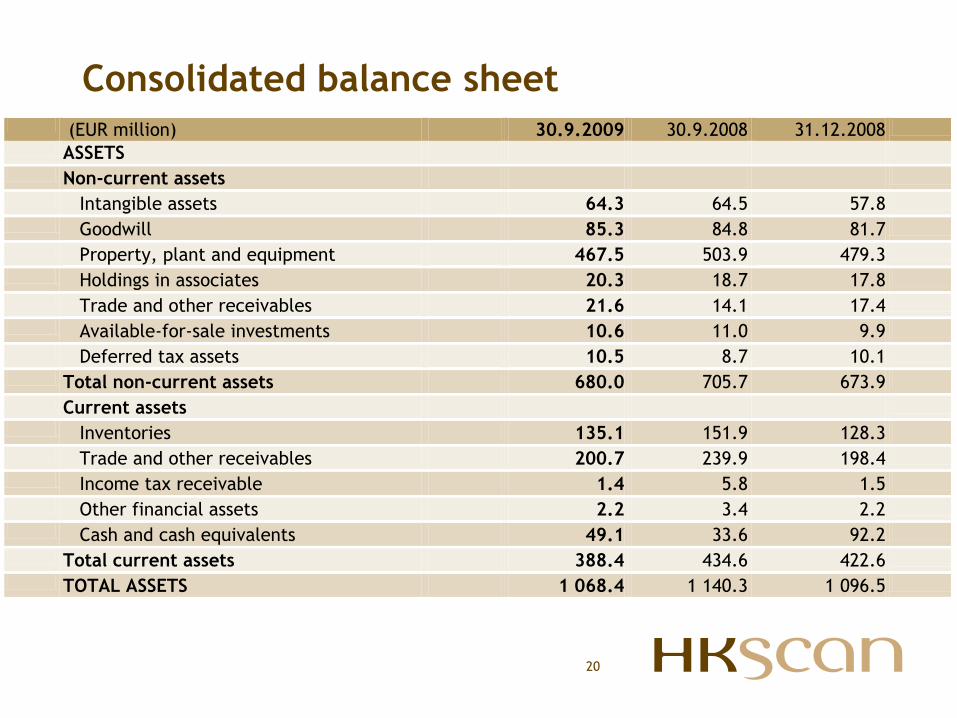
Consolidated balance sheet (EUR million) 30.9.2009 30.9.2008 31.12.2008
ASSETS
Non-current assets
Intangible assets 64.3 64.5 57.8
Goodwill 85.3 84.8 81.7
Property, plant and equipment 467.5 503.9 479.3
Holdings in associates 20.3 18.7 17.8
Trade and other receivables 21.6 14.1 17.4
Available-for-sale investments 10.6 11.0 9.9
Deferred tax assets 10.5 8.7 10.1
Total non-current assets 680.0 705.7 673.9
Current assets
Inventories 135.1 151.9 128.3
Trade and other receivables 200.7 239.9 198.4
Income tax receivable 1.4 5.8 1.5
Other financial assets 2.2 3.4 2.2
Cash and cash equivalents 49.1 33.6 92.2
Total current assets 388.4 434.6 422.6
TOTAL ASSETS 1 068.4 1 140.3 1 096.5

21
Consolidated balance sheet (EUR million) 30.9.2009 30.9.2008 2008
EQUITY AND LIABILITIES
Equity attributable to
equity holders of the parent 325.6 336.6 318.2
Minority interest 6.2 5.2 5.4
Total equity 331.8 341.8 323.7
Deferred tax liability 33.5 35.6 33.6
Non-current interest-bearing liabilities 425.0 426.9 442.1
Non-current non-interest bearing liabilities 4.5 6.1 7.9
Pension obligations 3.5 3.0 3.7
Non-current provisions 3.5 0.4 1.4
Non-current liabilities 470.0 472.0 488.7
Current interest-bearing liabilities 58.6 114.1 82.4
Trade and other payables 204.8 210.9 199.4
Income tax liability 0.4 0.1 0.5
Current provisions 2.7 1.4 1.9
Current liabilities 266.5 326.6 284.2
EQUITY AND LIABILITIES 1 068.4 1 140.3 1 096.5
M.Perkonoja 3.11.2009

M.Perkonoja 27.2.2009 22
Cash flow statement (EUR million) 1-9 /2009 1-9 /2008 2008 Operating activities
EBIT and depreciation
(incl. adjustment items) 81.6 60.5 92.2
Change in net working capital -11.5 -31.2 1.3
Financial income and expenses -16.1 -20.6 -29.9
Taxes -3.3 -3.5 -1.4
Net cash flow from operating activities 50.7 5.2 62.2
Investing activities
Gross investments in fixed assets -32.7 -68.8 -84.1
Disposals of fixed assets 1.7 8.6 12.0
Investments in subsidiary -0.9 0.0 0.0
Loans granted and repaid 0.3 1.6 1.8
Net cash flow from investing activities -31.8 -58.6 -70.3
Cash flow before financing activities 18.9 -53.4 -8.1
Financing activities
Payments received on hybrid bond
0.0
20.0
20.0
Borrowings raised and repaid -52.2 25.2 43.8
Interest on hybrid bond -1.3 0.0 0.0
Dividends paid -9.4 -10.6 -10.6
Purchase of treasury shares 0.0 -0.1 -0.1
Net cash flow from financing activities -62.9 34.4 53.0
Change in cash and cash equivalents -44.0 -19.0 44.9

Cash flows after capital expenditure2005-2009
Eur
mill.
2005 2006 2007 2008Q1-Q3
2009
M.Perkonoja 3.11.2009

24
Capital expenditure
Eur mill.
* Exclusive of enterprise value on Scan AB acquisition
M.Perkonoja 3.11.2009

25
Financial highlights
30.9.2009 30.9.2008 2008 Earnings/share (EPS), diluted, EUR 0.40 -0.05 0.12 Equity / share, 30.9., EUR *) 8.29 8.57 8.10 Dividend per share 0.24 Equity ratio, % 31.1 30.0 29.5 Average no. of shares, mill. 39.3 39.3 39.3 Production-related investment, EUR mill. 33.8 70.6 84.0 Average no. of employees 7 301 7 526 7 421
*) Exclusive of minority interest in equity
M.Perkonoja 3.11.2009

26
Financial targets and their achievement2005 – Q3/2009
Target Achievement
Q1-Q3/
2009 2008 2007 2006 2005
EBIT
over 5% of net sales
2.3 1.7 2.6 4.3 2.7
Return on equity over 15% 5.6 2.3 9.2 11.9 7.7
Equity ratio over 40% 31.1 29.5 29.3 43.7 44.7
Dividend distribution
at least 30% of net earnings
- 199.3 37.7 34.2 58.2
M.Perkonoja 3.11.2009

HKScan’s development
2006 2007 2008 2009 2010 2011 2012
27
1. Birth of HKScan
2. Scan’s consolidation and development programmes
3. New profitable growth
Matti Perkonoja 3.11.2009
Industrial restructuring in
Finland
Economic recession

M.Perkonoja 27.2.2009 28