historical subsidence and wetland loss in the … · historical subsidence and wetland loss in the...
TRANSCRIPT
555 Gulf Coast Association of Geological Societies Transactions, Volume 55, 2005
Historical Subsidence and Wetland Loss in the Mississippi Delta Plain
Morton, Robert A.;1 Bernier, Julie C.;2 Barras, John A.;3 and Ferina, Nicholas F.1
1U.S. Geological Survey, 600 4th St. S., St. Petersburg, Florida 337012Environmental Careers Organization, 600 4th St. S., St. Petersburg, Florida 337013U.S. Geological Survey, National Wetlands Research Center, Baton Rouge, Louisiana 70894
Abstract
Five representative areas of the Mississippi River delta plain were investigated using remoteimages, marsh elevations, water depths, sediment cores, and radiocarbon dates to estimate thetiming, magnitudes, and relative rates of marsh erosion and land subsidence at geological and his-torical time scales. In the Terrebonne-Lafourche region of rapid interior-wetland loss, formermarshes are now submerged beneath water that averages 0.5 to 1.0 m deep. Most of the perma-nent historical flooding was caused by rapid subsidence and collapse of the delta plain thatoccurred during the late 1960s and 1970s. Subsequent erosion of the submerged delta-plain marshwas relatively minor at most of the coring sites.
Widespread nearly simultaneous collapse of marshes across the Mississippi delta plainappears to be unprecedented and not repeated in the geological record of the past 1,000 years.Surface and subsurface data strongly indicate that the rapid subsidence and associated wetlandloss were largely induced by extraction of hydrocarbons and associated formation water. Averagehistorical rates of subsidence between 1965 and 1993 were about 8 to 12 mm/yr, whereas averagegeological rates of subsidence for the past 5,000 years were about 1 to 5 mm/yr. Natural processessuch as deep-seated salt migration and fault movement cannot be discounted entirely, but there isno compelling evidence that these processes were responsible for the observed historical changes.Results of this study provide a basis for determining the relative importance of subsidence andshoreline erosion as causes of past wetland loss and for predicting sites and probable mechanismsof future wetland loss. This information should improve the selection of project sites and designsfor wetland-loss mitigation and coastal restoration in south Louisiana.
Introduction
The magnitude, rate, and timing of wetland loss in south Louisiana and the identification of theunderlying processes that cause historical wetland loss have been high-priority topics of scientific inves-tigation since the 1980s. These issues take on even greater importance and urgency considering that thestate is seeking substantial federal funding to restore parts of coastal Louisiana and to compensate forsome of the historical wetland loss. There are two major challenges for researchers responsible for pro-viding the scientific data used to formulate public policy regarding wetland loss and coastal restorationin Louisiana. The first is generating subsidence estimates for wetland areas that are not immediatelyadjacent to benchmarks and tide gauges, which is where subsidence rates have been determined previ-ously. The second challenge is developing accurate models for predicting areas and rates of futuresubsidence and wetland loss.
This paper addresses the general lack of subsidence estimates away from levee roads and marinasby applying the field and laboratory methods of Morton et al. (2003) to four additional areas of histori-cal wetland loss. The purpose of the study is to examine further the timing and processes involved insubsidence and wetland loss in coastal Louisiana. This was accomplished by: (1) estimating magnitudesof recent subsidence and erosion at these selected areas and (2) comparing the temporal and spatialtrends of wetland change to historical trends of subsurface-resource extraction in the same areas.

Historical Subsidence and Wetland Loss in the Mississippi Delta Plain
556
MethodsVibracores and water depths were obtained at the Bay St. Elaine, DeLarge, Pointe au Chien, and
Bully Camp study areas (Figs. 1 and 2), where historical wetland loss has been rapid and widespread.Core pairs provided close correlation between delta-plain sediments from the emergent marsh and adja-cent open water. Ten additional vibracores had previously been collected from the Madison Bay area(Figs. 1 and 2, and Morton et al., 2003). The cores provided a basis for identifying the predominant sedi-mentary facies and for selecting stratigraphic contacts and surfaces that could be correlated between coresand used to estimate magnitudes of wetland subsidence and erosion (Table 1). The core locations, descrip-tions, and photographs, detailed descriptions of historical land-water changes, and histories of nearbyresource extraction (oil and gas, sulfur) for the five study areas are reported in Morton et al. (2005).
Water depths at open-water coring sites and along bathymetric profiles were measured from thecoring barge with a graduated rod, while the geographic coordinates of each depth measurement wereobtained simultaneously with a GPS receiver. Movements of water levels at the coring sites during thefield operations were assumed to be comparable to those recorded at nearby tide gauges (Fig. 2, andMorton et al., 2003, 2005). Sub-regional water depths and marsh elevations (Table 1) can be comparedonly if they are corrected for any local conditions (e.g., tidal stage) that would bias the water-level data.The U.S. Army Corps of Engineers (USACE) New Orleans District and Louisiana Department of Natu-ral Resources (LDNR) operate independent networks of tide gauges located throughout the coastalwaters of south Louisiana. The tide gauges at Cocodrie (USACE #76305) and near Montegut (LDNR#TE01-12R) are located less than 20 km from the coring sites (Fig. 2). The Cocodrie gauge was used tocorrect measured water levels at Bay St. Elaine, Madison Bay, and DeLarge, and the Montegut gaugewas used to correct measured water levels at Pointe au Chien and Bully Camp.
Figure 1. Regional map of south-central Louisiana showing locations of coring sites and subdeltas of theLafourche delta system. Geologic ages of the Lafourche subdeltas after Penland et al. (1988). Landsat TM 5image acquired Nov. 7, 2004. The RGB visual display uses bands 4 (near-infrared), 5 (mid-infrared), and 3(visible red).

Morton et al.
557
Figure 2. Regional map of south-central Louisiana showing locations of coring sites, the USACE Cocodrie tidegauge, the LDNR Montegut tide gauge, and the distribution of wetland losses (1956-2004) relative to produc-ing oil-and-gas fields and potentially active faults. Land-water classification and wetland loss from Morton etal. (2005). Fault projection from Kuecher et al. (2001).
Beta Analytic, Inc. (Miami, FL) conducted isotopic analyses of peat samples from the vibracores
and provided radiocarbon ages (14C) and the corresponding 13C values for the remains of former delta-
plain marshes (Table 2). Ranges and means of 13C ratios for the fresh, intermediate, brackish, and salinemarshes of the Barataria Basin (Chmura et al., 1987) were used to interpret the types of marshes recov-ered in the vibracores.
Average long-term geological rates of delta-plain subsidence can be inferred from burial histories
of peats, using depths of peat below the surface and the 14C peat ages (Penland et al., 1988; Roberts etal., 1994; Kulp and Howell, 1998). Results of those calculations (Tables 3 and 4) can also be expressedas average long-term geological rates of sediment aggradation. For this report, burial histories of peatsare expressed as subsidence rates rather than rates of sediment aggradation.

Historical Subsidence and Wetland Loss in the Mississippi Delta Plain
558
Table 1. Core depths and NAVD88 elevations of stratigraphic markers correlated between core pairs. Themost prominent markers are contacts between predominantly organic and predominantly clastic sediments.Positive marsh-minus-water (M-W) depth-difference values indicate erosion, and negative M-W depth-difference values indicate sediment accumulation. M-W elevation-difference values represent estimatedsubsidence. Core locations are presented in Morton et al. (2005).
Base Last Marsh Base First Marsh
Core IDCore
locationCore Elevation (cm NAVD88)
Depth in Core Barrel (cm)
Elevation (cm NAVD88)
Depth in Core Barrel (cm)
Elevation (cm NAVD88)
Bay St. Elaine Area
composite BSE-04 marsh 49 105 -56
BSE-05 water -7 112 -119
difference (M-W) 56 -7 63
composite BSE-04 marsh 49 105 -56
BSE-01 water -35 150 -185
difference (M-W) 84 -45 129
BSE-01 water -35 150 -185
composite BSE-03 marsh 50 96 -46
difference (M-W) 85 -54 139
BSE-02 water -8 111 -119
composite BSE-03 marsh 50 96 -46
difference (M-W) 58 -15 73
Madison Bay Area
MB-10 marsh 30 153 -123 198 -168
MB-06 water -58 129 -187 175 -233
difference (M-W) 88 24 64 23 65
MB-10 marsh 30 153 -123 198 -168
MB-05 water -92 111 -203 134 -226
difference (M-W) 122 42 80 64 58
MB-10 marsh 30 153 -123 198 -168
MB-04 water -108 90 -198 134 -242
difference (M-W) 138 63 75 64 74
MB-01 water -46 125 -171 186 -232
MB-07 marsh 24 115 -91 192 -168
difference (M-W) 70 -10 80 6 64
MB-05 water -92 111 -203 134 -226
MB-09 marsh 17 146 -129 168 -151
difference (M-W) 109 35 74 34 75
MB-03 water -77 118 -195 131 -208
MB-09 marsh 17 146 -129 168 -151
difference (M-W) 94 28 66 37 57
MB-02 water -59 134 -193 151 -210
MB-08 marsh 20 161 -141 180 -160
difference (M-W) 79 27 52 29 50
Table cont. on next page

Morton et al.
559
DeLarge Area
DL-01B marsh 32 30 2 110 -78
DL-01A water -49 28 -77 97 -146
difference (M-W) 81 2 79 13 68
Pointe au Chien Area
PAC-05 marsh 33 41 -8
PAC-04 water -41 42 -83
difference (M-W) 74 -1 75
PAC-05 marsh 33 41 -8
PAC-06 water -54 33 -87
difference (M-W) 87 8 79
PAC-05 marsh 33 41 -8
PAC-02A water -41 46 -87
difference (M-W) 74 -5 79
PAC03-05 marsh 33 41 -8
PAC03-02B marsh 32 56 -24
difference (05-02B) 1 -15 16
PAC-02A water -41 46 -87 114 -155
PAC-02B marsh 32 56 -24 99 -67
difference (M-W) 73 10 63 -15 88
PAC-02B marsh 32 56 -24 99 -67
PAC-03 water -62 42 -104 129 -191
difference (M-W) 94 14 80 -30 124
PAC03-02B marsh 32 56 -24 99 -67
PAC03-01B marsh 39 26 13 103 -64
difference (01B-02B) 7 -30 37 4 3
PAC-03 water -62 42 -104 129 -191
PAC-01B marsh 39 26 13 103 -64
difference (M-W) 101 -16 117 -26 127
PAC-01A water -38 39 -77 110 -148
PAC-01B marsh 39 26 13 103 -64
difference (M-W) 77 -13 90 -7 84
Bully Camp Area
SM-02B marsh 49 59 -10 93 -44
SM-02A water -45 33 -78 80 -125
difference (M-W) 94 26 68 13 81
SM-02B marsh 49 59 -10 93 -44
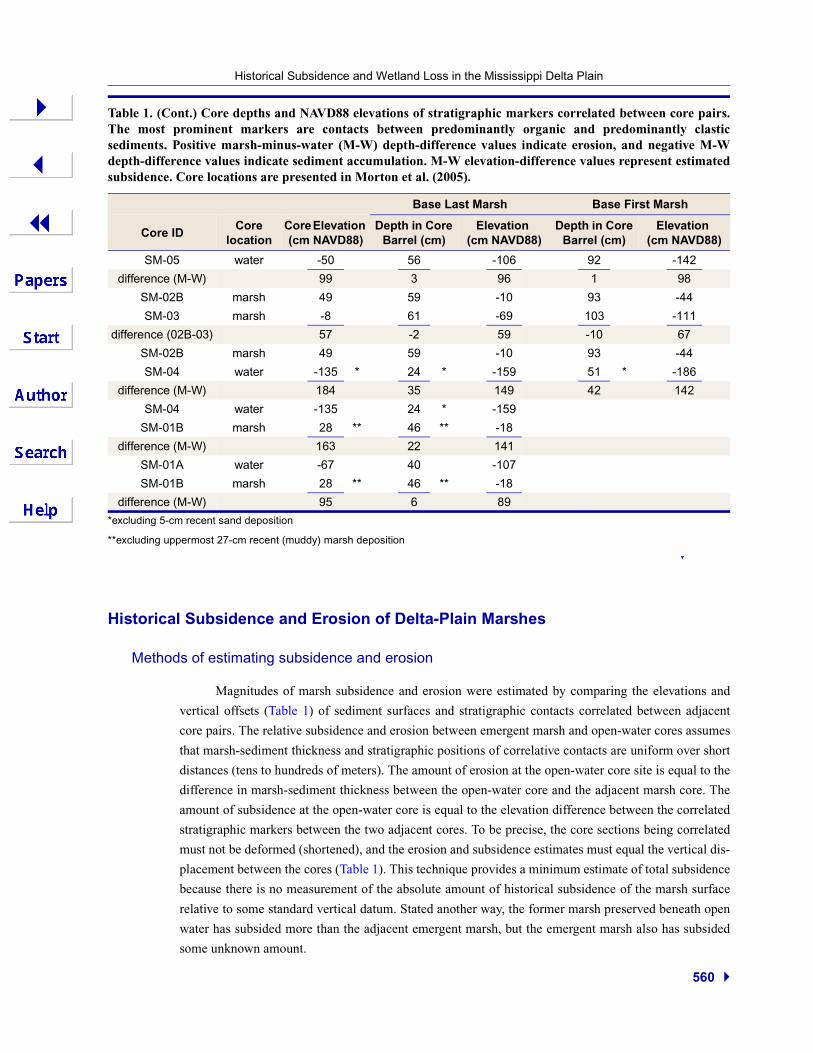
Table 1. (Cont.) Core depths and NAVD88 elevations of stratigraphic markers correlated between core pairs.The most prominent markers are contacts between predominantly organic and predominantly clasticsediments. Positive marsh-minus-water (M-W) depth-difference values indicate erosion, and negative M-Wdepth-difference values indicate sediment accumulation. M-W elevation-difference values represent estimatedsubsidence. Core locations are presented in Morton et al. (2005).
Base Last Marsh Base First Marsh
Core IDCore
locationCore Elevation (cm NAVD88)
Depth in Core Barrel (cm)
Elevation (cm NAVD88)
Depth in Core Barrel (cm)
Elevation (cm NAVD88)
Table cont. on next page
Historical Subsidence and Wetland Loss in the Mississippi Delta Plain
560
*excluding 5-cm recent sand deposition
**excluding uppermost 27-cm recent (muddy) marsh deposition
Historical Subsidence and Erosion of Delta-Plain Marshes
Methods of estimating subsidence and erosion
Magnitudes of marsh subsidence and erosion were estimated by comparing the elevations and
vertical offsets (Table 1) of sediment surfaces and stratigraphic contacts correlated between adjacent
core pairs. The relative subsidence and erosion between emergent marsh and open-water cores assumes
that marsh-sediment thickness and stratigraphic positions of correlative contacts are uniform over short
distances (tens to hundreds of meters). The amount of erosion at the open-water core site is equal to the
difference in marsh-sediment thickness between the open-water core and the adjacent marsh core. The
amount of subsidence at the open-water core is equal to the elevation difference between the correlated
stratigraphic markers between the two adjacent cores. To be precise, the core sections being correlated
must not be deformed (shortened), and the erosion and subsidence estimates must equal the vertical dis-
placement between the cores (Table 1). This technique provides a minimum estimate of total subsidence
because there is no measurement of the absolute amount of historical subsidence of the marsh surface
relative to some standard vertical datum. Stated another way, the former marsh preserved beneath open
water has subsided more than the adjacent emergent marsh, but the emergent marsh also has subsided
some unknown amount.
SM-05 water -50 56 -106 92 -142
difference (M-W) 99 3 96 1 98
SM-02B marsh 49 59 -10 93 -44
SM-03 marsh -8 61 -69 103 -111
difference (02B-03) 57 -2 59 -10 67
SM-02B marsh 49 59 -10 93 -44
SM-04 water -135 * 24 * -159 51 * -186
difference (M-W) 184 35 149 42 142
SM-04 water -135 24 * -159
SM-01B marsh 28 ** 46 ** -18
difference (M-W) 163 22 141
SM-01A water -67 40 -107
SM-01B marsh 28 ** 46 ** -18
difference (M-W) 95 6 89
Table 1. (Cont.) Core depths and NAVD88 elevations of stratigraphic markers correlated between core pairs.The most prominent markers are contacts between predominantly organic and predominantly clasticsediments. Positive marsh-minus-water (M-W) depth-difference values indicate erosion, and negative M-Wdepth-difference values indicate sediment accumulation. M-W elevation-difference values represent estimatedsubsidence. Core locations are presented in Morton et al. (2005).
Base Last Marsh Base First Marsh
Core IDCore
locationCore Elevation (cm NAVD88)
Depth in Core Barrel (cm)
Elevation (cm NAVD88)
Depth in Core Barrel (cm)
Elevation (cm NAVD88)

Morton et al.
561
Table 2. Radiocarbon ages and carbon-isotope data for organic samples. Core locations are presented in Morton et al. (2005).
Core IDSample Depth
(cm)Stratigraphic Horizon
Conventional Age (BP) δ13C (‰)
Bay St. Elaine Area
BSE-01 146-147 base first marsh 820 ± 40 -25.6
BSE-02 73-74 top first marsh 400 ± 40 -23.4
BSE-02 110-111 base first marsh 850 ± 40 -26.6
BSE-04 21-22 top first marsh 320 ± 40 -24.6
BSE-04 71-72 base first marsh 680 ± 40 -24.8
BSE-05 37-38 base last marsh 200 ± 40 -13.9
Madison Bay Area
MB-02 133-134 base last marsh 840 ± 40 -26.0
MB-02 145-146 top first marsh 940 ± 40 -25.6
MB-02 150-151 base first marsh 930 ± 40 -25.8
MB-04 107-108 top intermediate marsh 720 ± 40 -26.6
MB-04 113-114 base intermediate marsh 700 ± 40 -27.0
MB-04 133-134 base first marsh 960 ± 40 -26.7
MB-07 114-115 base last marsh 600 ± 40 -25.8
MB-07 186-187 top first marsh 980 ± 40 -26.3
MB-07 191-192 base first marsh 950 ± 40 -26.5
MB-09 46-47 base recent marsh 150 ± 40 -14.1
MB-09 145-146 base last marsh 680 ± 40 -26.7
MB-09 167-168 base first marsh 920 ± 40 -26.3
MB-10 152-153 base last marsh 660 ± 40 -26.4
MB-10 197-198 base first marsh 970 ± 40 -26.5
DeLarge Area
DL-01A 26-27 base last marsh 510 ± 40 -27.4
DL-01A 56-57 top first marsh 840 ± 40 -26.4
DL-01A 95-96 base first marsh 1050 ± 40 -26.9
Pointe au Chien Area
PAC-01A 109-110 base first marsh 900 ± 40 -27.2
PAC-01B 25-26 base last marsh 280 ± 40 -26.1
PAC-02A 91-92 top first marsh 930 ± 40 -27.3
PAC-02A 112-113 base first marsh 980 ± 40 -28.0
PAC-02B 55-56 base last marsh 430 ± 40 -26.2
PAC-03 99-100 first marsh 940 ± 40 -27.4
PAC-03 128-129 base first marsh 950 ± 40 -19.4
Bully Camp Area
SM-01B 27-28 base recent marsh 90 ± 40 -26.3
SM-01B 72-73 base last marsh 420 ± 40 -27.4
SM-02B 58-59 base last marsh 450 ± 40 -26.5
SM-02B 85-86 top first marsh 860 ± 50 -27.0
SM-02B 92-93 base first marsh 900 ± 40 -27.3
Historical Subsidence and Wetland Loss in the Mississippi Delta Plain
562
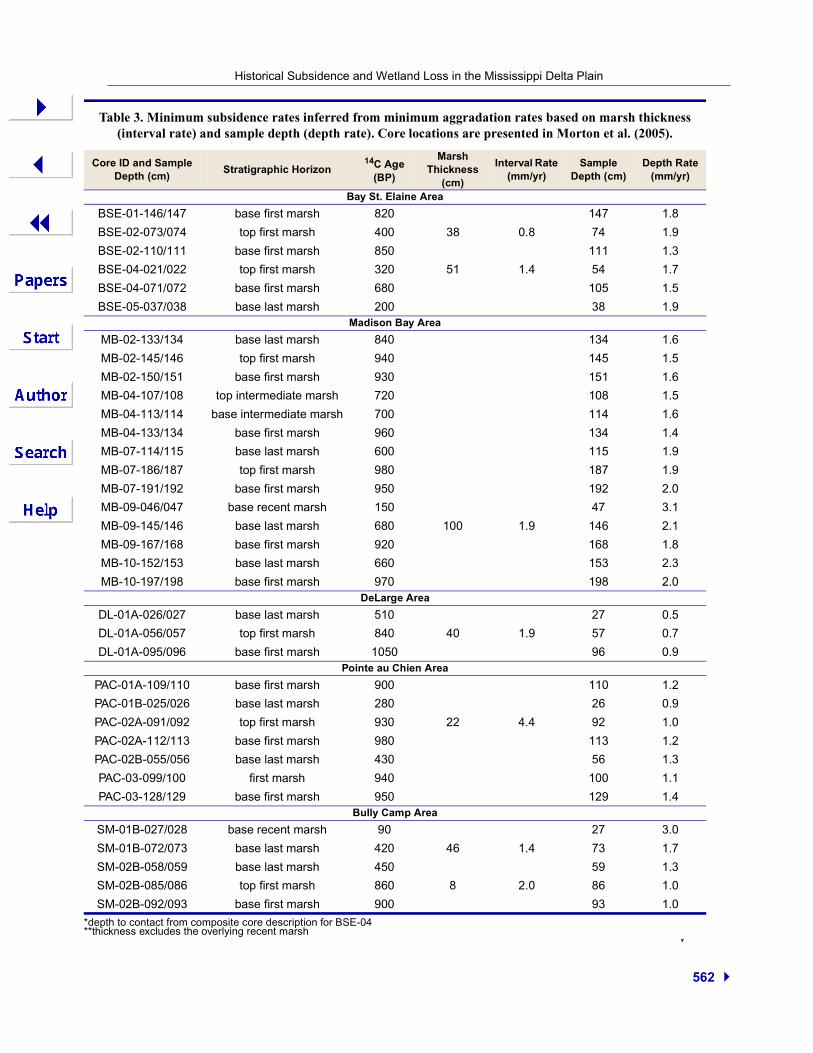
*depth to contact from composite core description for BSE-04**thickness excludes the overlying recent marsh
Table 3. Minimum subsidence rates inferred from minimum aggradation rates based on marsh thickness (interval rate) and sample depth (depth rate). Core locations are presented in Morton et al. (2005).
Core ID and Sample Depth (cm)
Stratigraphic Horizon14C Age
(BP)
Marsh Thickness
(cm)
Interval Rate (mm/yr)
Sample Depth (cm)
Depth Rate (mm/yr)
Bay St. Elaine Area
BSE-01-146/147 base first marsh 820 147 1.8
BSE-02-073/074 top first marsh 400 38 0.8 74 1.9
BSE-02-110/111 base first marsh 850 111 1.3
BSE-04-021/022 top first marsh 320 51 1.4 54 1.7
BSE-04-071/072 base first marsh 680 105 1.5
BSE-05-037/038 base last marsh 200 38 1.9Madison Bay Area
MB-02-133/134 base last marsh 840 134 1.6
MB-02-145/146 top first marsh 940 145 1.5
MB-02-150/151 base first marsh 930 151 1.6
MB-04-107/108 top intermediate marsh 720 108 1.5
MB-04-113/114 base intermediate marsh 700 114 1.6
MB-04-133/134 base first marsh 960 134 1.4
MB-07-114/115 base last marsh 600 115 1.9
MB-07-186/187 top first marsh 980 187 1.9
MB-07-191/192 base first marsh 950 192 2.0
MB-09-046/047 base recent marsh 150 47 3.1
MB-09-145/146 base last marsh 680 100 1.9 146 2.1
MB-09-167/168 base first marsh 920 168 1.8
MB-10-152/153 base last marsh 660 153 2.3
MB-10-197/198 base first marsh 970 198 2.0DeLarge Area
DL-01A-026/027 base last marsh 510 27 0.5
DL-01A-056/057 top first marsh 840 40 1.9 57 0.7
DL-01A-095/096 base first marsh 1050 96 0.9Pointe au Chien Area
PAC-01A-109/110 base first marsh 900 110 1.2
PAC-01B-025/026 base last marsh 280 26 0.9
PAC-02A-091/092 top first marsh 930 22 4.4 92 1.0
PAC-02A-112/113 base first marsh 980 113 1.2
PAC-02B-055/056 base last marsh 430 56 1.3
PAC-03-099/100 first marsh 940 100 1.1
PAC-03-128/129 base first marsh 950 129 1.4Bully Camp Area
SM-01B-027/028 base recent marsh 90 27 3.0
SM-01B-072/073 base last marsh 420 46 1.4 73 1.7
SM-02B-058/059 base last marsh 450 59 1.3
SM-02B-085/086 top first marsh 860 8 2.0 86 1.0
SM-02B-092/093 base first marsh 900 93 1.0

Morton et al.
563
n/g = not given
*levee
**back marsh
Pointe au Chien area
The Pointe au Chien (PAC) study area (Figs. 1 and 3) was selected to represent the results pre-sented by Morton et al. (2005) because, in many respects, it is similar to the other four delta-plainsettings. Extant marsh elevations at PAC range from 32 to 39 cm above the North American VerticalDatum of 1988 (NAVD88), and water depths where marsh formerly existed range from 24 to 68 cm andaverage about 48 cm below NAVD88 (Fig. 4).
The Pointe au Chien study area is located within an east-west regional trend of historic wetlandloss that extends from Lake De Cade to Bayou Lafourche (Fig. 2). Wetland loss at PAC is nearly com-plete, with isolated marsh patches surrounded by open water. Much of the wetland loss occurredbetween 1969 and 1974 (Fig. 3). There is no obvious surface expression of faults or other structurescontrolling patterns of wetland loss, although the projected surface trace of the Golden Meadow fault(Kuecher et al., 2001) occurs to the south of the core sites (Fig. 3D).
Six stratigraphic units were identified in the PAC cores: (1) dark olive-gray peat, (2) gray toolive-gray, massive to laminated mud, (3) olive-gray to black peat, (4) gray to olive-gray or black, mas-sive to laminated mud and organic mud, (5) olive-gray to gray, massive to laminated silt, sand, and/ormud, and (6) olive-gray laminated mud and sand. The unit 3 peat represents the first subdelta marsh.
Radiocarbon ages and carbon-isotope ratios of peat samples indicate that freshwater plants estab-lished the first marsh at PAC about 950 BP. The duration of this wetland is uncertain because the ages ofsamples near the top of the peat are within the error range of ages from the base of the peat (Fig. 4).After the first marsh was flooded, as much as 50 cm of mud was deposited before the last marsh wasestablished about 300 to 400 BP. Since then, long-term rates of marsh aggradation have averaged about1 mm/yr (Table 3).
Table 4. Rates (mm/yr) of sediment accumulation (sed) and inferred rates of subsidence (sub) for the Terrebonne and Barataria Basins estimated from isotopic ages (< 5000 BP) and direct field
measurements (feldspar marker).
Method Type PeriodRange
(mm/yr)Mean
(mm/yr)Reference
marker sed years n/g 22 Rybczyk and Cahoon, 2002137Cs sed decades 11 - 17 13* Hatton et al., 1983
137Cs sed decades 3 - 10 7** Hatton et al., 1983
137Cs sed decades 6 - 8 7 DeLaune et al., 1985
14C sub centuries 1 - 16 6 Penland et al., 1988
14C sub centuries 3 - 7 5 Roberts et al., 1994
14C sub centuries 0.5 - 4 2 this study, Table 3
14C sub millennia 1 - 5 2 Penland et al., 1988
14C sub millennia 3 - 5 4 Roberts et al., 1994
14C sub millennia 0.1 - 8 1 Kulp and Howell, 1998

Historical Subsidence and Wetland Loss in the Mississippi Delta Plain
564
Figure 3. Locations of sediment cores and sediment-surface profiles from the Pointe au Chien area superim-posed on aerial photographs taken in (A) 1969, (B) 1974, and (C) 1998. (D) 1956-2004 wetland loss at Pointe auChien and the surrounding area superimposed on the 1998 image. The 1998 DOQQ imagery was obtainedfrom the Louisiana Oil Spill Coordinator’s Office (LOSCO).
The magnitudes of land subsidence are similar across the Pointe au Chien area of wetland loss(Fig. 4), and the highest marsh elevations coincide with the areas of least subsidence. Analysis of marshcores PAC-01B and PAC-05 suggest that the base of the last marsh was near NAVD88 before the areasubsided. Consequently, comparisons of open-water cores with marsh core PAC-02B may underesti-mate total subsidence because the marsh remnant at core PAC-02B has subsided more than the adjacentemergent marsh. Core PAC-02B has subsided 16 to 37 cm relative to the adjacent marsh at cores PAC-01B and PAC-05. Subsidence at the open-water sites ranged from 75 to 117 cm and averaged about 88cm (Table 1). The variable thickness of marsh sediments across the Pointe au Chien area makes esti-mates of erosion at the open-water sites imprecise. Nevertheless, erosion of the last marsh surfaceranged from 0 to 14 cm, which is minor compared to magnitudes of subsidence.
Patterns of wetland loss in the Pointe au Chien area do not coincide with the projected extent ofany single oil-and-gas field, but the area of wetland loss is surrounded by the Bayou Jean la Croix,Lirette, and Montegut fields (Fig. 2). Initial discovery of gas in the 1920s at Lirette was attributed to sur-face seeps, whereas deep hydrocarbons at Lirette were discovered in 1937 (Troutman, 1956) and atMontegut in 1957 (Silvernail, 1967). These fields produce from rollover anticline structures associatedwith a family of growth faults (Piaggio, 1961; Lyons, 1982). Peak hydrocarbon production from thesefields occurred between 1965 and 1980 (Fig. 5). The combined cumulative production through 2002from the three fields was 35.2 million bbls of oil, 1.7 Tcf of gas, and 103 million bbls of water. Regionaldepressurization of subsurface reservoir strata may be a contributing factor to surface subsidence in thisarea. The projected surface trace of the Golden Meadow Fault extends through the southern zone of

Morton et al.
565
Figure 4. Combined bathymetric profile and stratigraphic cross section for marsh and open-water cores illus-trate the magnitude of subsidence and wetland erosion (in cm) at the Pointe au Chien area. Locations shown inFigure 3, 200x vertical exaggeration.
Figure 5. Annual fluid production through 2002 from the Bayou Jean la Croix, Lirette, and Mon-tegut fields in Terrebonne Parish. Data from the Louisiana Department of Natural Resources andthe PI/Dwights PLUS database (IHS Energy Group, 2003).
-450
-400
-350
-300
-250
-200
-150
-100
-50
0
50
0 250 500 750 1000 1250 1500 1750
Distance (m)
Ele
va
tio
n (
cm
NA
VD
88
)PAC-05
PAC-04 PAC-06 PAC-02A
PAC-02B
PAC-03 PAC-01A
PAC-01B
peat
mud
sand and silty sand
interbedded mud and sand
930 BP
980 BP
430 BP
940 BP
950 BP
900 BP
280 BP
Annual fluid production, Pointe au Chien study areaBayou Jean la Croix, Lirette, and Montegut fields
0
20
40
60
80
100
120
1930 1940 1950 1960 1970 1980 1990 2000 2010
Year
0
2
4
6
8
10
12
Gas
Oil
Water
An
nu
al
Pro
du
cti
on
- N
atu
ral
Ga
s (
mc
f) x
10
6
An
nu
al
Pro
du
cti
on
- O
il a
nd
Fo
rma
tio
n W
ate
r (b
bls
) x
10
6

Historical Subsidence and Wetland Loss in the Mississippi Delta Plain
566
greatest wetland loss between Bayou Terrebonne and Bayou Pointe au Chien (Fig. 2), but spatially itdoes not appear to correlate with any limits to wetland loss. The projected surface trace of the LakeHatch spur fault, however, approximates the northern boundary of extensive wetland loss.
Geological and Historical Rates of Subsidence
Geological subsidence rates
Rates of vertical sediment accumulation have been used as a proxy for subsidence rates based onthe assumption that the accommodation space necessary for vertical sediment accumulation (aggrada-tion) was provided by subsidence regardless of the specific process (crustal loading, sedimentcompaction, fault activation). For wetland sediments and static sea-level conditions, this assumptionappears to be valid as a first approximation. The condition of constant sea level equivalent to modernsea level is not difficult to achieve for recent periods, such as decades or a few centuries, but would notbe a reasonable assumption for periods encompassing several millennia. To avoid potential inaccuraciesassociated with eustatic fluctuations, only published subsidence rates for periods less than 5,000 yearswere included in the comparison (Table 4). Geological rates of subsidence calculated for this studyrange from 0.5 to 4.4 mm/yr (Table 3) and average about 2 mm/yr (Table 4).
Historical subsidence rates
Historical changes in land elevation relative to a standard vertical datum can be measured directlyfrom controlled benchmarks or inferred from long-period tide-gauge records (Holdahl and Morrison,1974). Both of these methods have been used to approximate subsidence rates in south Louisiana (Pen-land et al., 1988; Morton et al., 2002). Shinkle and Dokka (2004) re-analyzed historical leveling dataalong Bayou Lafourche and Bayou Petit Caillou and calculated revised subsidence rates between 1965and 1993. The spatial trends of the revised subsidence rates (Fig. 6) are identical to those presented byMorton et al. (2002); however, they also allow comparison of subsidence rates for two periods (Fig. 6).Within the context of generally increased subsidence in a seaward direction, highest rates of subsidencecoincided locally with faults and producing oil-and-gas fields. Between the fields and faults, subsidencerates were lower. There is no evidence of uplift across the known salt domes (Valentine, Bully Camp,and Leeville) that would indicate historical dome growth. From 1965 to 1982, subsidence rates betweenRaceland and Leeville ranged from 1.6 to 12.0 mm/yr and averaged about 7.6 mm/yr. From 1982 to1993, subsidence rates ranged from 8.2 to 18.9 mm/yr and averaged about 12.1 mm/yr. Although sub-sidence rates accelerated between the two periods, the spatial order of higher and lower rates wasmaintained, indicating that subsidence is strongly controlled by subsurface geological processes.
Comparison of subsidence rates
Short-term historical rates of geological processes are commonly higher than the long-term aver-age rates of those same processes, and subsidence rates are no exception. The important question toanswer is whether the temporal differences are related to actual differences in the driving forces, orwhether they are simply related to timing of the observations or sampling frequency. Some geologicalprocesses, such as fault slip, are intermittent, and their instantaneous rates may be very high, but theduration is short and the frequency of recurrence is low. These processes typically produce low long-term average rates of change. High instantaneous rates measured for these processes cannot be sustainedindefinitely; therefore, those rates should not be extrapolated for predictive purposes. For example, ifthe historical rates of subsidence had persisted for the past 1,000 years, the Mississippi delta would havebeen deeply inundated long ago.

Morton et al.
567
Figure 6. Plots of historical subsidence rates along (A) Bayou Lafourche and (B) Bayou Petit Cail-lou calculated by the National Geodetic Survey from re-leveling of benchmarks (Shinkle andDokka, 2004). The plots show a close spatial correlation between highest subsidence rates, hydro-carbon-producing fields (delineated in tan), and the projected intersection of deep faults. Theyalso show that subsidence rates accelerated between 1965-82 and 1982-93. Modified from Mortonet al. (2002). Revised subsidence rates provided by Kurt Shinkle (NGS).
NGS subsidence rates, Raceland to Leeville, 1965-1993
-20
-15
-10
-5
0
0 10 20 30 40 50 60 70 80 90
Distance (km)
Su
bsid
en
ce R
ate
(m
m/y
r)
RA
CE
LA
ND
VA
LE
NT
INE
CU
T O
FF
BU
LL
Y C
AM
P
GO
LD
EN
ME
AD
OW
FA
UL
T
GO
LD
EN
ME
AD
OW
BA
YO
U F
ER
BL
AN
C
LE
EV
ILL
E
1965-1982
1982-1993
A
NGS subsidence rates, Houma to Cocodrie, 1966-1993
-20
-15
-10
-5
0
0 10 20 30 40 50
Distance (km)
Su
bsid
en
ce R
ate
(m
m/y
r)
HO
UM
A
CH
AU
VIN
CH
AU
VIN
, S
OU
TH
LA
KE
HA
TC
H
SP
UR
FA
UL
T
LIR
ET
TE
-
L.
BO
UD
RE
AU
X
GO
LD
EN
ME
AD
OW
FA
UL
T
LA
PE
YR
OU
SE
B

Historical Subsidence and Wetland Loss in the Mississippi Delta Plain
568
Historical subsidence rates are roughly an order of magnitude higher than geological subsidencerates (compare Fig. 6 and Table 4). One explanation would be that natural faulting and subsidence areactive at a time when monitoring is being conducted, and the methods of detection can resolve and mea-sure the movement. Another explanation is that the rates actually are much higher than normally wouldbe expected because subsidence and/or fault activation have been induced by subsurface-resourceextraction.
Whether the high rates of historical subsidence and associated wetland loss are natural or inducedis still somewhat controversial. Gagliano et al. (2003) concluded that historical subsidence and wetlandlosses in south Louisiana were caused naturally by sediment loading, salt evacuation, and gravity glid-ing. All of these processes are known to be responsible for the overall tectonic regime of the Gulf CoastBasin, but Gagliano et al. (2003) presented no evidence to substantiate their claim that the recent timing(post-1960s) and rates of subsidence south of New Orleans were attributable to natural salt migrationand faulting. They also did not consider that (1) major decreases in formation pore pressure, such asthose reported by Morton et al. (2002) around hydrocarbon producing fields in south Louisiana, havethe same effect as sediment loading, or that (2) changes in subsurface stress induced by fluid withdrawalare capable of accelerating movement of potentially active faults (Chan, 2005). Gagliano et al. (2003)also argued that the 1964 Alaskan earthquake was largely responsible for the timing of fault reactivationin south Louisiana, again without presenting any scientific evidence of transitory changes in subsurfacestress that would support their speculation. The 1964 Alaskan earthquake was not felt in Louisiana,although seiches were generated in water bodies by the passing surface wave (Stevenson and McCulloh,2001). Perhaps more important is the fact that the massive wetland losses in the delta plain (Figs. 2 and7) were mostly initiated more than 5 years after the 1964 Alaskan earthquake.
Significant reductions in subsidence rates are expected in the Terrebonne-Lafourche Basinsbecause the rates of subsurface-fluid withdrawal that were largely responsible for the rapid induced sub-sidence have markedly declined (Fig. 7). Moreover, whatever contribution fault reactivation may havemade, fault movement likely has already relieved the stress differential created by subsurface pressurereductions, and the state of stress has returned to near-equilibrium conditions. If this is true, then addi-tional subsidence related to fault reactivation would not be expected because the subsurface perturbationcaused by peak fluid production has passed (Fig. 7).
Figure 7. Composite histories of fluid production from oil-and-gas fields and wetland loss in southLouisiana. Production data from the Louisiana Department of Natural Resources and the PI/Dwights PLUS database (IHS Energy Group, 2003). Wetland loss values were determined byBritsch and Dunbar (1993) and John Barras (personal communication, 2005). These historicaldata, integrated across the delta plain, show close temporal and spatial correlations between ratesof wetland loss and rates of fluid production.
0
100
200
300
400
500
600
700
1930 1940 1950 1960 1970 1980 1990 2000 2010
Year
An
nu
al
Pro
du
cti
on
- N
atu
ral
Gas (
mcf)
x 1
06
0
20
40
60
80
100
120
140
An
nu
al
Pro
du
cti
on
- O
il a
nd
Fo
rmati
on
Wate
r (b
bls
) x 1
06
Annual fluid production vs. rate of wetland loss, Louisiana delta plain
rapid wetland loss, 1969-1974
0
5
10
15
20
25
30
Wetland L
oss (
mi2
/yr)
oilgas
wetland losswater

Morton et al.
569
Conclusions and Implications
Historical wetland losses in the Mississippi delta plain have been classified on the basis of mor-phology and interpreted physical processes (Penland et al., 2000a, 2000b). Wetland losses around themargins of interior water bodies were attributed to shoreline erosion based on the inferred erosionalcapability of storm waves and field observations of local marsh erosion. Results of our study indicatethat most of the wetland losses around open-water bodies at the coring sites are due to subsidence, anderosion is only a minor process contributing to the conversion of wetlands to open water. At most of theopen-water sites that were formerly continuous emergent marsh, extant water depths are greater than thethickness of the delta-plain marsh. This physical relation is clear evidence that wetland loss resultedfrom subsidence, because it is impossible to erode to those depths and still preserve some of the marshdeposits. Emergent-marsh elevations, used as the standard for subsidence estimates, are significantlylower where subsidence has been greatest, such as at Madison Bay and the marsh-island remnants ofPointe au Chien and Bully Camp. The magnitudes and similarities of subsidence around the perimetersof water bodies that were former marshes provide compelling evidence that the subsidence is not largelyrelated to fault reactivation, because it is not geologically reasonable to infer a fault between each emer-gent-marsh and open-water core pair. The similarities of subsidence magnitudes across the delta plain,regardless of position relative to a fault plane, are further evidence that recent subsidence is not locallyfault controlled.
Lithologic and chronostratigraphic similarities of peat deposits from Bay St. Elaine, DeLarge,Pointe au Chien, and Bully Camp indicate that processes that influenced the organic accumulation andinflux of clastic sediments operated over large portions of the delta plain, and not just locally. Thisimplies that fault reactivation is not a likely mechanism to explain the alternating deposition of peat andmud several hundred years ago. Furthermore, there is no unequivocal evidence of a fault influencing thethickness or number of peat beds at any of the coring sites. This includes Bay St. Elaine, where coreswere deliberately taken across the marsh-water lineament that appears to be the surface expression of afault. The fault may have moved recently, but there is no evidence of recurrent motion in the recent geo-logic past that has resulted in stratigraphic expansion, which is typical of an active growth fault thatmoves frequently.
The types of core data and imagery used by Gagliano et al. (2003) and Morton et al. (2002, 2003,2005) are similar, and yet their interpretations with regard to past and future subsidence and wetlandloss are quite different. These differences are not academic, because they have profound implicationswith regard to predicting future subsidence and its impact on coastal-restoration projects. Gagliano et al.(2003) attributed the historical subsidence and wetland loss to natural processes deep within the GulfCoast Basin that are random and unpredictable as to future occurrences. In contrast, Morton et al. (2002,2003, 2005) concluded that historical subsidence and wetland loss was primarily induced by fluid with-drawal, and therefore the future impacts are qualitatively predictable.
Results from this study confirm that the most likely explanation for historical wetland losses insouth-central Louisiana is regional subsidence and local fault reactivation induced by hydrocarbon pro-duction. There is no compelling evidence of historical salt dome growth in the area before, during, orafter the period of rapid subsidence and the pore-pressure reduction in the reservoirs is equivalent tosediment loading across the delta plain. Furthermore, it is clear that offsets in stratigraphic marker bedsobserved in shallow cores taken in marsh and adjacent open-water sites are a result of subsidence, notfault slip. There is no evidence that such widespread instantaneous subsidence occurred in the past fewthousand years as a result of natural deep-basin processes (sediment loading, salt migration, gravitygliding).
The results of this study give guidance to future research directions and the development ofdatasets that could facilitate resource-management decisions and coastal-restoration planning efforts insouth Louisiana. The conclusion that some interior water bodies are expanding as a result of subsidencerather than shoreline erosion needs to be tested systematically in the field. Shoreline erosion seems to bean intuitively correct explanation for water-body expansion where fetch and water-body orientation withrespect to predominant wind directions are sufficient to generate erosive waves. This hypothesis can betested easily by taking core pairs around the perimeters of some of the largest water bodies. Also, thereare several wetland-loss mitigation sites where riprap was used to dampen wave energy, but the shore-

Historical Subsidence and Wetland Loss in the Mississippi Delta Plain
570
line continued to retreat. Elevation profiles and cores taken landward of the riprap would offer a way ofdetermining which processes were primarily responsible for the wetland loss and shoreline retreat. Ifshoreline erosion is not the primary cause of water-body expansion, then hard structures may not be anappropriate method of mitigating wetland loss at those sites.
Monitoring the rates and trends of delta-plain subsidence is necessary for accurately predictingfuture subsidence rates. Evaluating the relative vulnerability of coastal-restoration projects to potentialsubsidence is an objective of state officials who are charged with the responsibility of managing coastalresources. In the absence of a sophisticated numerical model for predicting subsidence, historical sub-sidence records can serve as indicators of regions of higher and lower risk. This approach becomes evenmore powerful when the subsurface processes causing subsidence are known and future trends can bepredicted.
References
Britsch, L.D., and Dunbar, J.B., 1993, Land-loss rates: Louisiana coastal plain: Journal of Coastal Research, v. 9, p.324-338.
Chan, A.W.K., 2005, Production-induced reservoir compaction, permeability loss and land surface subsidence:unpublished Ph.D. dissertation, Stanford University, Stanford, California, 176 p.
Chmura, G.L., Aharon, P., Socki, R.A., and Abernathy, R., 1987, An inventory of 13C abundance in coastal wet-lands of Louisiana, USA: vegetation and sediments: Oecologia, v. 74, p. 264-271.
DeLaune, R.D., Smith, C.J., and Patrick, W.H., 1985, Land loss in coastal Louisiana: effect of sea level rise andmarsh accretion: Louisiana State University Final Report, Board of Regents Research and DevelopmentProgram.
Gagliano, S.M., Kemp, E.B., Wicker, K.M., Wiltenmuth, K., and Sabate, R.W., 2003, Neo-tectonic framework ofsoutheast Louisiana and applications to coastal restoration: Transactions, Gulf Coast Association of Geolog-ical Societies, v. 53, p. 262-272.
Hatton, R.S., DeLaune, R.D., and Patrick, W.H., Jr., 1983, Sedimentation, accretion, and subsidence in marshes ofBarataria Basin, Louisiana: Limnology and Oceanography, v. 28, p. 494-502.
Holdahl, S.R., and Morrison, N.L., 1974, Regional investigations of vertical crustal movements in the U.S., usingprecise relevelings and mareograph data: Tectonophysics, v. 23, p. 373-390.
IHS Energy Group, 2003, PI/Dwights Plus U.S. Production Data on CD: available from IHS Energy Group, 15 Inv-erness Way East, D205, Englewood, CO 80112.
Kuecher, G.J., Roberts, H.H., Thompson, M.D., and Matthews, I., 2001, Evidence for active growth faulting in theTerrebonne delta plain, south Louisiana: implications for wetland loss and the vertical migration of petro-leum: Environmental Geosciences, v. 8, p. 77-94.
Kulp, M.A., and Howell, P.D., 1998, Assessing the accuracy of Holocene subsidence rates in southern Louisiana asindicated by radiocarbon-dated peats: Geological Society of America, Abstracts with Programs, v. 30, p. 142.
Lyons, W.S., 1982, Subsurface geology and geopressured/geothermal resource evaluation of the Lirette-Chauvin-Lake Boudreaux area, Terrebonne Parish, Louisiana: unpublished M.S. thesis, University of SouthwesternLouisiana, Lafayette, 125 p.
Morton, R.A., Buster, N.A., and Krohn, M. D., 2002, Subsurface controls on historical subsidence rates and associ-ated wetland loss in southcentral Louisiana: Gulf Coast Association of Geological Societies Transactions, v.52, p. 767-778.
Morton, R.A., Tiling, G., and Ferina, N.F., 2003, Causes of hotspot wetland loss in the Mississippi delta plain: Envi-ronmental Geosciences, v. 10. p. 71-80.
Morton, R. A., Bernier, J. C., Barras, J. A., and Ferina, N. F., 2005, Rapid subsidence and historical wetland loss inthe Mississippi delta plain: likely causes and future implications: U. S. Geological Survey Open-file Report2005-1216.
Penland, S., Ramsey, K.E., McBride, R.A., Mestayer, J.T., and Westphal, K.A., 1988, Relative sea-level rise anddelta-plain development in the Terrebonne Parish region: Louisiana Geological Survey, Coastal GeologyTechnical Report No. 4, 121 p.
Penland, S., Wayne, L., Britsch, L.D., Williams, S.J., Beall, A.D., and Butterworth, V.C., 2000a, Geomorphic clas-sification of coastal land loss between 1932 and 1990 in the Mississippi River delta plain, southeastern Lou-isiana: U.S. Geological Survey Open-File Report 00-417, 1 sheet.
Penland, S., Wayne, L., Britsch, L.D., Williams, S.J., Beall, A.D., and Butterworth, V.C., 2000b, Process classifica-tion of coastal land loss between 1932 and 1990 in the Mississippi River delta plain, southeastern Louisiana:U.S. Geological Survey Open-File Report 00-418, 1 sheet.

Morton et al.
571
Piaggio, A.D., 1961, The Montegut-Lirette-Bay Baptiste structural complex: Terrebonne Parish, Louisiana: TheCompass, p. 157-171.
Roberts, H.H., Bailey, A., and Kuecher, G.J., 1994, Subsidence in the Mississippi River delta – Important influ-ences of valley filling by cyclic deposition, primary consolidation phenomena, and early diagenesis:,\ GulfCoast Association of Geological Societies Transactions, v. 44, p. 619-629.
Rybczk, J.M., and Cahoon, D.R., 2002, Estimating the potential for submergence for two wetlands in the Missis-sippi River delta: Estuaries, v. 25, p. 985-998.
Shinkle, K.D., and Dokka, R.K., 2004, Rates of vertical displacement at benchmarks in the lower Mississippi Val-ley and the northern Gulf Coast: National Oceanic and Atmospheric Administration, Technical Report 50,135 p.
Silvernail, J.D., 1967, Lirette and Montegut fields, in Braunstein, J., ed., Oil and Gas Fields of Southeast Louisiana,v. II: New Orleans Geological Society, p. 109-115.
Stevenson, D.A., and McCulloh, R.P., 2001, Earthquakes in Louisiana: Louisiana Geological Survey Public Infor-mation Series No. 7, 8 p.
Troutman, A., 1956, The oil and gas fields of southeast Louisiana: Five Star Oil Report, Houston, p. 101-104.