hispanic self-employment: a dynamic analysis of business ...ftp.iza.org/dp2101.pdfrelatively high...
TRANSCRIPT
IZA DP No. 2101
Hispanic Self-Employment:A Dynamic Analysis of Business Ownership
Magnus LofstromChunbei Wang
DI
SC
US
SI
ON
PA
PE
R S
ER
IE
S
Forschungsinstitutzur Zukunft der ArbeitInstitute for the Studyof Labor
April 2006
Hispanic Self-Employment:
A Dynamic Analysis of Business Ownership
Magnus Lofstrom University of Texas at Dallas
and IZA Bonn
Chunbei Wang University of Texas at Dallas
Discussion Paper No. 2101 April 2006
IZA
P.O. Box 7240 53072 Bonn
Germany
Phone: +49-228-3894-0 Fax: +49-228-3894-180
Email: [email protected]
Any opinions expressed here are those of the author(s) and not those of the institute. Research disseminated by IZA may include views on policy, but the institute itself takes no institutional policy positions. The Institute for the Study of Labor (IZA) in Bonn is a local and virtual international research center and a place of communication between science, politics and business. IZA is an independent nonprofit company supported by Deutsche Post World Net. The center is associated with the University of Bonn and offers a stimulating research environment through its research networks, research support, and visitors and doctoral programs. IZA engages in (i) original and internationally competitive research in all fields of labor economics, (ii) development of policy concepts, and (iii) dissemination of research results and concepts to the interested public. IZA Discussion Papers often represent preliminary work and are circulated to encourage discussion. Citation of such a paper should account for its provisional character. A revised version may be available directly from the author.
IZA Discussion Paper No. 2101 April 2006
ABSTRACT
Hispanic Self-Employment: A Dynamic Analysis of Business Ownership*
This paper analyzes causes of the low self-employment rates among Hispanics, which are nearly half of non-Hispanic white self-employment rates. Relatively little is known of the reason for the lower entrepreneurship rates among Hispanics, the fastest growing ethnic group in the U.S. The paper analyzes the self-employment gap by studying self-employment entry and exits, which determine the observed self-employment rates, utilizing nationally representative longitudinal data, the 1996 panel of the Survey of Income and Program Participation (SIPP). The data reveals differences between Mexican-Hispanics and Hispanics not of Mexican descent, referred to as Other-Hispanics. While Mexican-Hispanics are less likely to enter self-employment, relative to whites, Other-Hispanics are more likely to start a business. The differences however, are relatively small but shown to be meaningful in explaining the white-Hispanic self-employment rate gap. The data show large differences in business survival rates between Hispanics and whites. Mexican-Hispanics are almost twice as likely to exit business ownership in a year compared to whites. Our results indicate that differences in education and financial wealth are important factors in explaining differences in entrepreneurship across groups. We also show that the lower self-employment entry rates among Mexican-Hispanics is due to lower entry rates into business ownership of firms in relatively high barrier industries. In fact, Hispanics are more likely to start-up a business in a low barrier industry than whites. Differences in the industry composition across groups is also discussed and analyzed as a determinant of differences in business survival rates. JEL Classification: J15, J23 Keywords: self-employment, entrepreneurship, Hispanic Corresponding author: Magnus Lofstrom University of Texas at Dallas School of Social Sciences P.O. Box 830688 GR 31 Richardson, TX 75083-0688 USA Email: [email protected]
* We thank participants at the first Entrepreneurship Boot Camp, particularly Tim Bates, and seminar participants at Concordia University, Montreal for helpful comments as well as Rob Fairlie for providing SAS programming code for the nonlinear decomposition. Funding from the Ewing M. Kauffman foundation is greatly appreciated.
1
1. Introduction
A major concern to U.S. policy makers is the relative lack of success of African-
Americans and Hispanics in the U.S. labor market. Evidence of this can be seen in recent
data, such as the 2002 March CPS, which indicate that average annual earnings among
working age male Hispanics is roughly equal to the earnings of African-Americans, both
slightly above $25,000 and substantially below average earnings of whites and Asians,
who on average earn approximately $45,000 per year. These two minority groups also
have substantially lower self-employment rates. The above data also show that for both
African-Americans and Hispanics, the self-employment rate is around one-half of the
self-employment rates of whites and Asians. If self-employment is an important tool to
facilitate upward economic mobility, which is commonly believed (see for example
Glazer and Moynihan, 1970 and Cummings, 1980), it is important to understand why
certain minority groups, such as Hispanics, have relatively low self-employment rates
and how well they do as entrepreneurs. Support of self-employment acting as an avenue
to economic improvement for Hispanics is found by Fairlie (2004) who reports that
earnings among self-employed Hispanics males grow faster than earnings among their
wage/salary counterpart. Also of importance, given the large proportion of Hispanics who
are foreign born, is Lofstrom’s (2002) finding that self-employed immigrants do
significantly better in the U.S. labor market than wage/salary immigrants.
Up to now, research on Hispanic self-employment has not received the same
attention as African-American entrepreneurship. Hispanics are of particular interest given
the fact that this is the fastest growing ethnic group in the U.S., primarily fueled by
immigration, and now represents almost 14 percent of the U.S. population, slightly
2
greater than the proportion of non-Hispanics blacks (Statistical Abstracts of the U.S.,
2006).
An unresolved question in the entrepreneurship literature is why Hispanics are
less likely to be self-employed than other ethnic groups, such as whites. This paper
extends and contributes to the existing entrepreneurship literature by analyzing the
observed Hispanic self-employment gap, relative to non-Hispanic whites. Since the self-
employment rate is a function of the number of individuals who enter and exit self-
employment, it suggests that to adequately understand differences in business ownership,
as well as entrepreneurial success or failure, research needs to also address the dynamic
dimension of self-employment.
The paper is organized in the following way. In section 2 we review relevant
entrepreneurship literature. Section 3 describes the data and variables while in Section 4
we present descriptive statistics and discuss differences, between Hispanics and non-
Hispanic whites. In Section 5 we present a business ownership entry/exit model while in
Section 6 we present the empirical results as well as a decomposition of the effect of
observable characteristics on the minority-white self-employment gap. Lastly, we
conclude in Section 7.
2. Previous Research
In order to address the issue of the low Hispanic self-employment rate and to
identify possible determinants, we build on the large entrepreneurship literature
addressing the business ownership choice as well as research addressing minority-white
self-employment gaps, particularly the black-white gap.
3
The focus of a considerable body of the literature is the role of access to financial
capital in business creation and whether liquidity constraints are binding. This is typically
assessed by investigating whether own financial wealth impacts the decision to become a
business owner, holding constant all other relevant factors. The majority of these studies
do find evidence of binding liquidity constraints in business start-ups (e.g. Evans and
Leighton, 1989; Evans and Jovanovic, 1989; Lindh and Ohlsson, 1996). A rare exception
is Hurst and Lusardi (2004). Furthermore, Holtz-Eakin, Joulfaian and Rosen (1994a) find
that greater assets, measured as inheritances, leads to higher probability of business
survival, also suggesting that liquidity constraints are binding and not only affects
business start-ups. Furthermore, Bates (1990) finds that owner educational background is
a major determinant in business survival and financial capital structure of small business
start-ups. Other factors linked to the business ownership decision are managerial ability
(e.g. Jovanovic, 1982) risk aversion (e.g. Kihlstrom and Laffont, 1979), non-pecuniary
benefits (e.g. Blanchflower and Oswald, 1998) and intergenerational links, such as
parental wealth and entrepreneurship (Dunn and Holtz-Eakin, 2000).
Nor surprisingly, the above factors have also been linked to explaining the low
self-employment rates among some minority groups such as African-Americans and
Hispanics, or Latinos. Although differences in wealth, education and family structure
across groups have been found to partly explain differences in self-employment rates
(Fairlie, 1999 and Hout and Rosen, 2000) differences in parental entrepreneurship
appears to explain a significant proportion of the gap. (Fairlie, 1999 and Hout and Rosen,
2000). Unfortunately, it is not clear what the policy recommendations are based on the
findings of strong intergenerational links. Although it points towards returns to policies
4
that do decrease the gap across generations. The fact that a substantial proportion of
Hispanics are immigrants, and have not yet accumulated sufficient financial and human
capital, as well as information, is also a contributor to the self-employment gap (Fairlie
and Meyer, 1996).
Another potential factor explaining differences in business ownership is
differential treatment in the credit market. Blanchflower, Levine and Zimmerman (2003)
find that black-owned small businesses are about twice as likely to be denied credit and if
approved pay a one percentage point higher interest rate than whites even after
controlling for differences in creditworthiness and other factors and conclude that
differences in credit availability is likely caused by discrimination. The credit constraints
faced by certain minority groups are likely to impact the types of industry, and hence the
industry composition, and the structure of the business, as maintained by Bates (1995).
The only existing research, to our knowledge, directly addressing the lower self-
employment rates among Hispanics by studying business entry and exits is a working
paper by Fairlie and Woodruff (2005), who utilizes matched CPS data, and finds that
differences in education and wealth are key factors in explaining the low self-
employment rates among Mexican-Americans.1 Our study addresses the heterogeneity
among Hispanics, an issue raised by Bates (1990), by disaggregating Hispanics into two
groups, Mexican-Hispanics and Other-Hispanics, as well as controlling for immigration
status. Our nationally representative longitudinal data, the Survey of Income and Program
Participation (SIPP), also has the advantage of following individuals over a four year
period, as opposed to only one year possible utilizing CPS data, as well as more detailed
1 Taniguchi (2002) analyzes women’s entry into self-employment but does not decompose ethnic or racial differences in self-employment rates. The study utilizes NLSY data and includes Hispanic women younger than 41.
5
information regarding assets and business ownership. We also address the role of
industry the entrepreneur chooses and operates within in explaining the Hispanic-white
self-employment gap. The paper also evaluates the impact of differences in entry and exit
rates on the observed business ownership gap between Hispanics and whites.
3. Data
The data utilized in this paper is derived from the 1996 panel of the Survey of
Income and Program Participation (SIPP), covering a four year period from 1996 to
1999. The data is nationally representative, when appropriate weights are utilized, and
includes information on socio-economic characteristics, geographic location, country of
origin, year of arrival in the U.S., assets, asset income, industry, as well as business
ownership.
The 1996 SIPP survey is a rotating panel made up of waves of data collected
every four months for approximately 36,700 U.S. households. The 1996 panel over
sampled low-income households and hence sampling weights will be used throughout our
analysis. As with previous SIPP panels, each wave contains both core questions, common
to each wave, and topical questions that are not updated in each wave. In addition to the
key variables found in the core modules, we use information from two topical modules;
immigration (which includes information on country of origin as well as year of arrival
collected in the 2nd of the12 waves ) and assets and liabilities (containing wealth and asset
data, collected each year in waves 3, 6, 9 and 12).
The sample utilized is restricted to Hispanic and non-Hispanic white males
between the ages of 20 and 64 in the survey period. We divide Hispanics into two groups;
6
Mexican-Hispanics and Other-Hispanics (the latter groups consistsing largely of
Hispanics of Puerto Rican and Cuban descent). We do not restrict our sample to
containing only full-time working individuals since a significant proportion of business
entries and exits are from or to non-employment, which includes both unemployment as
well as not in the labor force. Concentrating this specific research on males simplifies the
analysis somewhat since male labor supply issues are arguably less complicated.
Furthermore, we restrict our sample to males for whom immigration status and wealth
information is available, as well as to individuals who are observed in at least two
consecutive years. The latter restriction is necessary for our analysis of transitions in and
out of self-employment, which is based on changes in year-over-year labor market state
by panel wave. Furthermore, an individual is defined to be self-employed if he reported
owning a business in the sample wave. The sample restrictions yield a sample of 140,734
observations, or 19,271 individuals.
4. Descriptive Statistics
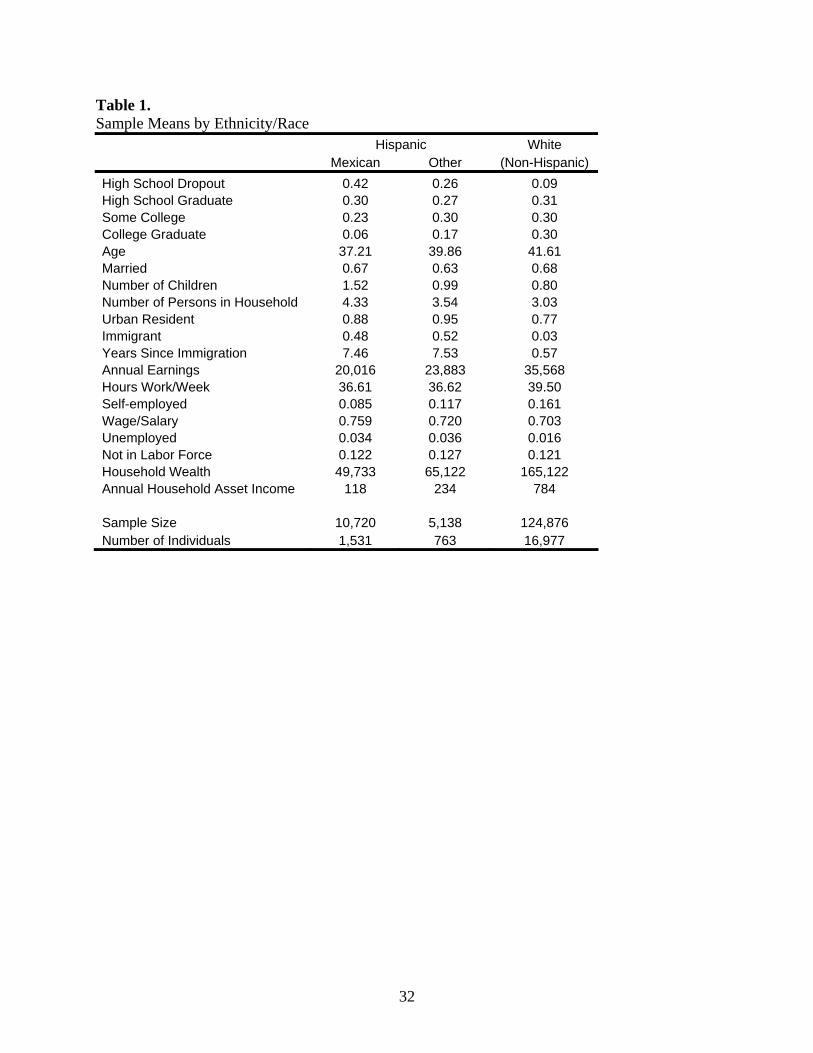
Table 1 shows sample means by the above defined groups. The data shows, as
previous research also indicates, that Hispanics have substantially lower annual earnings
relative to whites. This does not appear to be largely due to fewer hours worked or lower
employment rates among Hispanics since there seems to be no substantial differences in
these across the groups. However, educational attainment among Hispanics is
considerably lower, partially explaining the lower earnings. Among Mexican-Hispanics
males, 42% have less than a high school diploma and only about 6% are college
graduates. The respective proportions among Other-Hispanics and whites are 26% and
7
9% dropouts and 17% and 30% college graduates. Not surprisingly given the above
observations, wealth and asset incomes are also lower among Hispanics, particularly
among Mexican-Hispanics. Table 1 also shows that Hispanics are substantially less likely
to be business owners compared to white. Approximately 8.5% of Hispanics of Mexican
origin in our sample report owning their own business, while 11.7% of Hispanics of non-
Mexican origin are business owners, and slightly more than 16% of whites are self-
employed.
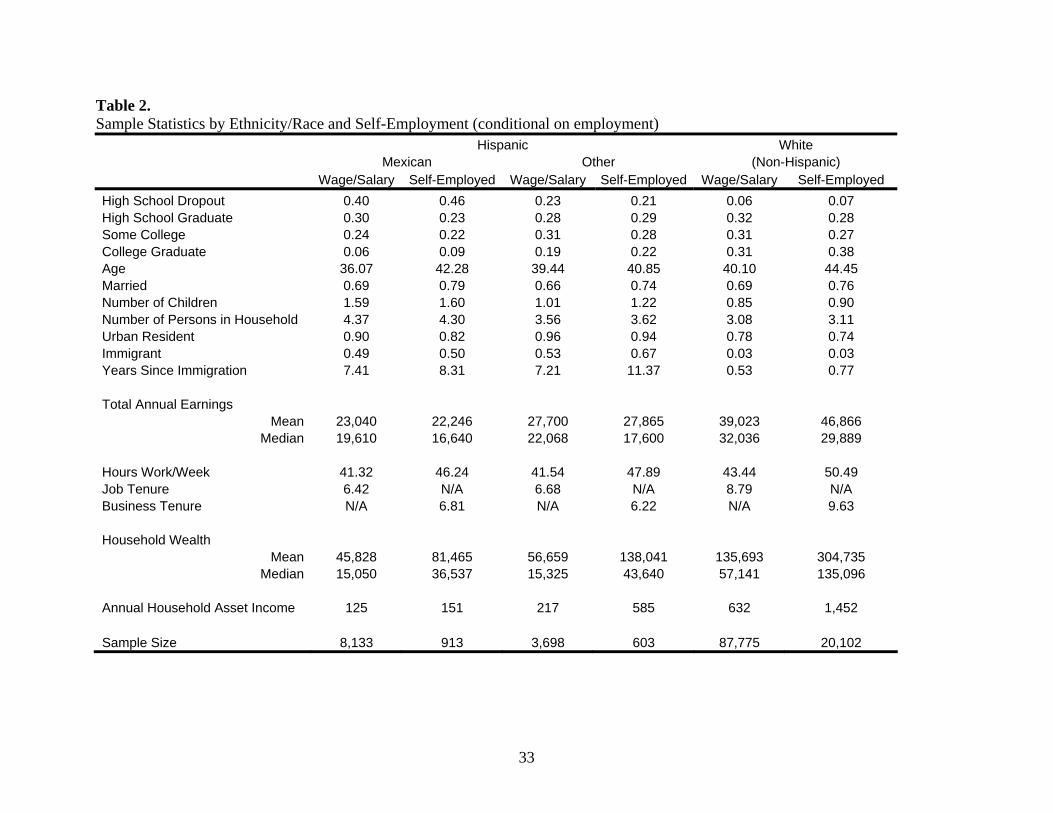
We show sample statistics by ethnic group and whether the person owns a
business or works in the wage/salary sector in Table 2. Note that we have restricted the
non-business owners in the sample used for Table 2 to wage/salary workers, i.e. it is
conditional on employment. This is done since a motivation for the information provided
in the table is to address observable differences, and differences in economic well-being,
between wage/salary workers and entrepreneurs. Interestingly, the table shows that mean
total annual earnings among both Hispanic groups are not dramatically different between
wage/salary workers and business owners, and in fact somewhat lower for Mexican-
Hispanics. Mean earnings of white entrepreneurs are on the other hand substantially
higher than among white wage/salary workers. If however the success story among
entrepreneurs is one of relatively few very successful business owners, comparison of
mean outcomes creates a skewed picture, suggesting that a preferred summary statistics is
the median. Table 2 reveals lower median earnings among the self-employed compared
to wage/salary workers for all three groups.
Another issue in comparing earnings of wage/salary workers and the self-
employed as a measure of success, or economic well being, is that business owners may
8
opt to re-invest portions of profits/earnings in their business instead of taking it out as
salary, leading to, not necessarily higher earnings, but higher wealth. This suggests that
financial wealth is also a relevant measure of the relative labor market success of
entrepreneurs and wage/salary workers. Our data indicates that this may be of
importance, since when we compare household wealth between business owners and
workers, both mean and median wealth is significantly higher among the self-employed
for both Hispanics and whites.2 Lastly, it should be noted that whether we compare mean
or median earnings and wealth, both Hispanic groups earn less than whites and possess
less wealth than whites.
Self-employment Entry and Exit
The lower business ownership rates among both Mexican-Hispanics and Other-
Hispanics relative to whites, 8.5, 11.7 and 16.1 percent respectively, is determined by
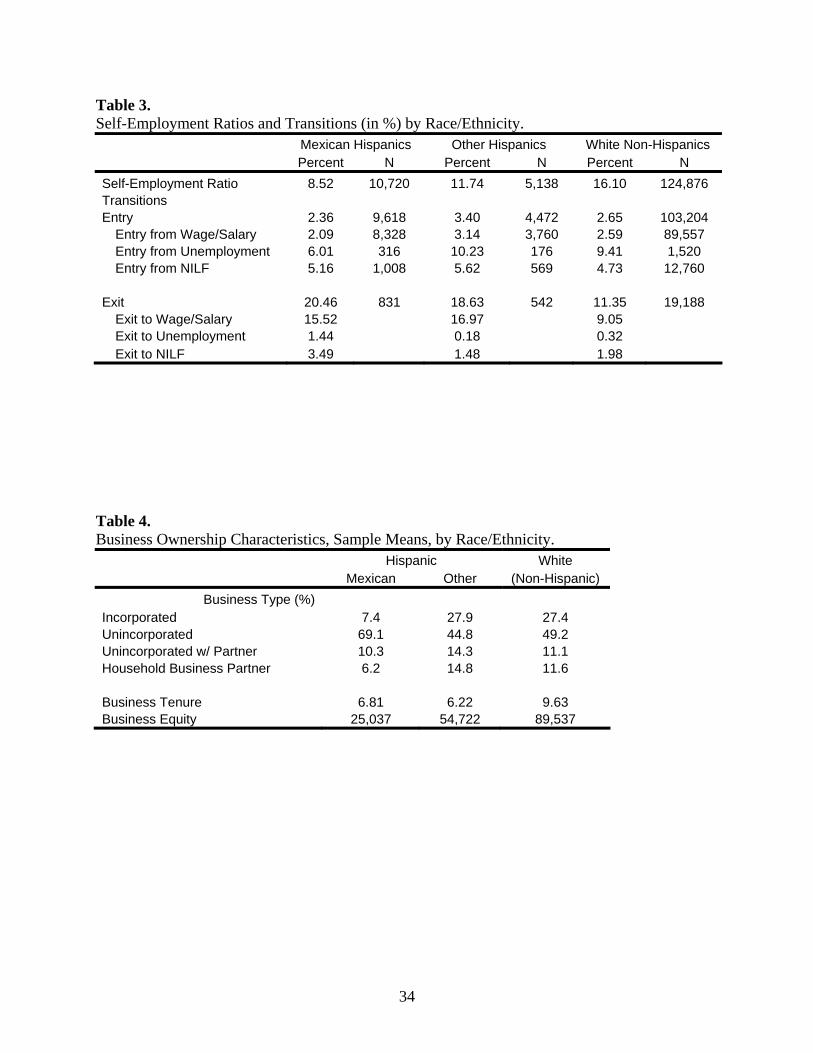
differences in self-employment entry and exit rates across the groups. Table 3 shows the
self-employment ratio (defined as the number of self-employed divided by the sample
population) as well as the probability of entering self-employment at time t, conditional
on non-business ownership at time t-1, where time t is measured in years. Similarly self-
employment exit rates are conditional movements from business ownership at time t-1 to
non-business ownership at time t.3
2 Wealth is defined as the sum of financial assets and equity in home, vehicle and owned business. 3 The transition rates shown in Table 3 appear to be consistent with previous research on self-employment entry and exits. For example, Holtz-Eakin, Joulfaian and Rosen (1994a and 1994b) report four-year entry and exit transition rates, 1981-1985, based on administrative data of 6.8 percent and 28 percent respectively. These are quite similar to the sample period transition rates obtained with our definition of self-employment using the SIPP data with the above specified sample; about 8 percent and 32 percent respectively. Some of the differences are likely to be due to changes in self-employment since the 1980’s and our sample selection.
9
Table 3 shows that Mexican-Hispanics have both the lowest entry and the highest
exit rates, 2.4 percent and 20.5 percent annual transition rates, suggesting that both
contribute to the observed lower business ownership rates. Other-Hispanics are almost 1
percentage point more likely to enter self-employment each year than Mexican-
Hispanics, while the self-employment entry rates among non-Hispanic whites are
approximately 0.3 percentage points greater than the ones of Mexican-Hispanics. The
differences between Hispanics and whites are however substantially greater in the self-
employment exit rates. Among Mexican-Hispanics entrepreneurs, 20.5 percent exit self-
employment annually while only slightly more than 11 percent of white business owners
exit self-employment. The year-over-year exit rate for Other-Hispanics is 18.6 percent.
Overall, these transition rates suggest that higher Hispanic business failure rates, or exits,
are the main cause for the lower Hispanic business ownership rates. The table also shows
that for all three groups, roughly 85 percent of the individuals who enter self-employment
do so by leaving a wage/salary job. Furthermore, of the individuals who exit self-
employment, a substantial portion do so by either leaving the labor force or to enter
unemployment in the subsequent year. This suggests that it is of some importance to not
restrict the sample to individuals working full-time. It also suggests that entries and exits
may be gradual movements in and out of business ownership.
It should be pointed out that even if the differences in business entry rates are
relatively small, this does not imply that they are unimportant and/or that minorities do
not face additional business start-up constraints. Firstly, small differences in entry rates
may lead to substantial differences in the observed rates of business ownership, as
discussed and demonstrated in the results section. Secondly, the relatively low
10
educational attainment level of Hispanics is likely to restrict access to certain industries
(such as professional services which includes physicians, dentists and lawyers) and may
“push” Hispanic entrepreneurs into less selective, educationally speaking, industries. If
industries that require relatively high schooling levels to enter also have relatively high
business survival rates, we may not observe large differences in business start-up rates
but average exit rates will be higher for Hispanics. Thirdly, If Hispanics enters certain
types of less well funded businesses, or industries, because they face limited access to
capital, we may expect this to reveal itself in higher business failure rates, even though
the self-employment entry rates are not dramatically different. Clearly, it is quite
challenging to address the latter issue, but the above discussion suggests that a closer
look at industries is important in order to understand why Hispanics are less likely to be
business owners than non-Hispanic whites.
The type of business ownership is also of interest and related to potential barriers
to enter self-employment. The SIPP data contains information on what type of business
the individual owns, as well as business equity. These characteristics are shown in Table
4, together with how long the business has been owned by the individual and business
equity. The table shows that self-employed Mexican-Hispanics are substantially less
likely to own an incorporated business than either of the other two groups. Furthermore,
business equity is found to be lower among Hispanic owned businesses than white owned
businesses. It is particularly low among Mexican-Hispanics, about $25,000, compared to
$54,000 and close to $90,000 for the Other-Hispanic group and whites respectively.
Although, these observed characteristics may be the outcome of different selection into
business ownership between minorities and whites (see e.g. Kawaguchi, 2005), they are
11
also consistent with Hispanics facing additional capital constraints, relatives to whites, as
well as group differences in educational attainment.
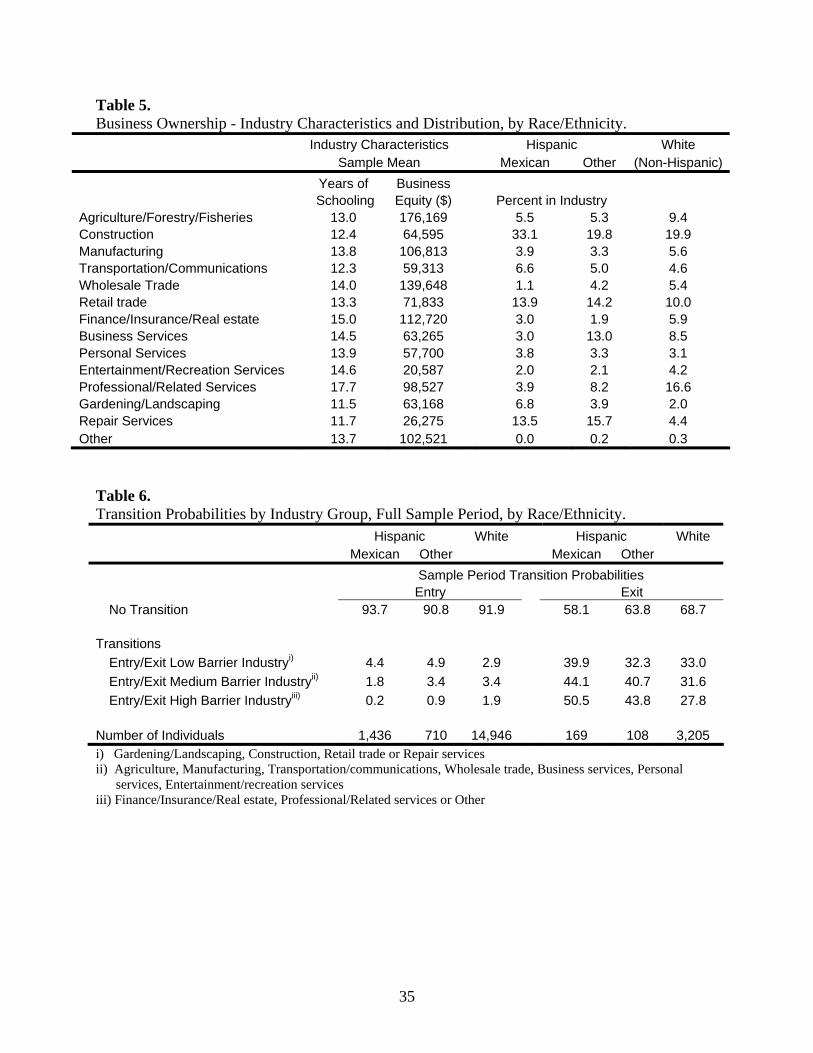
The distribution of industries entrepreneurs operate in also varies across the three
groups. Table 5 shows the industry distribution for business owners, as well as mean
years of schooling and business equity by these industries. The table shows that Mexican-
Hispanics business owners are most likely to own a business in the construction industry,
which is also an industry with relatively low educational attainment and business equity.
The construction industry is also the most common industry to own a business among the
other two groups, but by roughly 13 percentage points fewer business owners, about 33
percent among Mexican-Hispanics and approximately 20 percent of entrepreneurs in the
other two groups. A large proportion of Non-Hispanic whites own a business in the
professional services industry, slightly more than 16 percent. Only about 4 percent of
Mexican-Hispanics own a business in this industry of the most highly educated
entrepreneurs, where business owners have close to 18 years of schooling on average.
Overall, it appears that Hispanics may be over-represented, relative to whites, in
industries with lower educational attainment levels and business equity.
What causes the differences in business ownership industry distributions is not
clear, but the data in the table suggests incorporating and analyzing the role of industries
in the business transition models. Of course, we would expect that entrepreneurs
belonging to a group with lower educational attainment would be more likely to operate
in industries with lower schooling levels. Nonetheless, we address the issue in our
analysis below.
12
5. Self-Employment Entry and Exit Model
The objective of our study is to investigate the determinants of the low Hispanic
self-employment rates by analyzing entry and/or exits into self-employment. To analyze
differences in self-employment rates, it is useful to model the decision to enter and exit a
business venture. One possibility is to assume that individuals choose to enter, or exit,
self-employment based on expected utility in each state (e.g. self-employment,
wage/salary work, unemployment or to not participate in the labor force), as well as
constraints faced by the individual.
Let us assume that the utility function is a function of expected income, or
earnings if working, e-sity for self-employment work and J
ity for participating in state J
(defined here as wage/salary work, unemployment or to not participate in the labor force
and where i and t are indices for individual i at time t), and that the function also indicates
preferences for the characteristics of participation or work in the state, denoted iz .
Furthermore, earnings, or income, in each state will depend on a vector of observable
characteristics, itX , possible constraints faced by the individual, vit, and unobserved
characteristics itε , which may represent random shocks to earnings or income
opportunities. It also possible to allow zi to include time invariant unobserved individual
heterogeneity that affects earnings, such as ability and motivation. Assuming that
individuals maximize expected utility, a person will choose self-employment if the
expected utility from self-employment, denoted )( e-situE , is greater than the expected
utility in any of the other J states, represented here by )( JituE . Expected utility in the J+1
states can be defined as:
13
Jit
JJi
JJit
Jit
JJit
Jit
Jit yuE ελδβλ +++=+= zvΧz)( (1)
esit
esesi
esesit
esit
esesi
esit
esit yuE −−−−−−−−−− +++=+= ελδβλ zvΧz)( (2)
where esJ −εε and may be assumed to be jointly normally distributed with mean zero and
variances 22 and esJ −σσ . Alternatively, as is done in our analysis, the disturbances may be
assumed to follow a logistics distribution. An individual chooses self-employment at time
t if:
0)()(* >−= − J
ites
itit uEuEI , for any state J (3) Clearly the index function *
itI is unobservable. However, from equations (1), (2) and (3)
*itI can be defined as:
* ( ) ( )
s e Jit it it
s e J s e s e J Jit it it it
s e s e J J s e Ji i it it
it it
I E u E u
W e
β β δ δ
λ λ ε επ
−
− − −
− − −
= −
= − + −
+ − + −= +
Χ Χ v v
z z (4)
If we set I=1 if 0* >itI , if the individual is observed to have entered self-employment at
time t, and I=0 if 0* ≤itI , if the person decides not to start up a new business, then
equation (4) can simply be seen as a probability model of entry into self-employment. In
other words, the model can be seen as a conditional probability model where the person is
observed to not be self-employed in the previous time period, i.e. at t-1. Similarly,
conditioning on observing the person to be in self-employment at time t-1, the model can
represent the business ownership exit decision.
14
Of interest here are the determinants and particularly their role in explaining the
observed relatively low Hispanic self-employment rates. For example, differences in
human capital and financial capital are likely to be determinants of the Hispanic-white
self-employment gap. To address the endogeneity issue of wealth levels on self-
employment, in the sense that higher wealth levels may be the results of entrepreneurship
and not the cause, we utilize one year lagged wealth and asset income in the estimated
models. Differences in marital status, family composition, geographic location and the
composition of U.S. born and foreign born individuals are also likely to have an impact
on the observed rates of self-employment.
The entry and exit models estimated can be represented by the following, where
Iit=1 represents an observed transition, i.e. a decision to enter or exit self-employment:
itit]1Prob[ eI itit ++== δβ vX (5) where
itX = Matrix containing observable characteristics such as age, educational attainment, marital status, number of children, immigrant status, years in residence in the U.S., geographic location.
itv = Matrix containing controls for potential business ownership constraints, or barriers, such as financial assets.
To assess the role of the above controls and characteristics in explaining the
ethnic/racial self-employment gap the self-employment models will also be estimated
separately by the three groups, Mexican-Hispanics, Other-Hispanics and whites. The
estimates and the values of the observed characteristics are then utilized in a nonlinear
15
Blinder-Oaxaca decomposition (such as Fairlie, 1999) to determine their contributions of
each type of characteristic on the observed differences in self-employment entry or exit.
Clearly, potential business ownership constraints faced by minorities are typically
not directly observable. However, they may manifest themselves in the choice of
industry, or types of business, as discussed above. For example, if there are additional
lending constraints faced by minorities, as suggested by Blanchflower, Levine and
Zimmerman (2003), we would expect to see fewer minorities in financial capital
intensive industries. As discussed above, however, some barriers to self-employment are
observable. For example, given the substantial observed differences in educational
attainment between Hispanics and whites, many Hispanics effectively do not have access
to certain human capital intensive industries. This can, at least partially, be addressed by
simply controlling for schooling levels. However, Hispanics’ stock of human capital may
be valued and/or perceived differently from non-Hispanics, suggesting that education
may play different roles across ethnic/racial groups. Evidence of different roles of
education in the U.S. labor market, in terms of schooling’s impact on earnings, between
immigrants and natives is found in Betts and Lofstrom (2000). Given the large proportion
of immigrants among Hispanics, this is relevant to the self-employment decision, which
is partially based on expected earnings. The above reasoning suggests that it is important
to address the role of industries, which vary in the human and financial capital
requirements, as argued by Bates (1995).
In the analysis below we attempt to tackle these issues by estimating multinomial
logit models of self-employment entry. In this setting, we view the self-employment and
industry choices as simultaneous.
16
A practical restriction we face is that the number of individuals in the industries
defined in Table 5 are in some cases small, particularly by race/ethnicity, making
relatively precise estimation difficult. Instead, we define three industry categories based
on human and financial capital requirements, or barriers, to enter the industry. Clearly,
any classification into industry categories of entry difficulty, or barriers, is somewhat
arbitrary. Nonetheless, to determine whether an industry is a low, medium or high barrier
industry, we utilize the 1997 Annual Capital Expenditure Survey (ACES) to determine
average fixed private capital by the 14 industries defined in Table 5 and the 2000 Census
to determine entrepreneurs’ educational attainment by industry. Based on the above data,
we categorize Gardening/Landscaping, Construction, Retail trade and Repair services as
low barrier industries since all these industries display relatively low average educational
attainment levels (roughly around high school graduate or below) and average capital
expenditures rank among the lowest. The medium barrier category consists of firms in
Agriculture, Manufacturing, Transportation/Communications, Wholesale trade, Business
services, Personal services and Entertainment/Recreation services. These are industries in
which entrepreneurs typically have at least some college education and/or average capital
expenditures are in the mid-range amongst our industries. The high barrier industry
category consists of firms in the Finance/Insurance/Real estate, Professional/Related
services or “Other” industries. According to the 2000 Census, more than 85 percent of
entrepreneurs in the Finance/Insurance/Real estate and Professional/Related industries
have some college education while the 1997 ACES data show that businesses in the
Finance/Insurance/Real estate and Other industries have the highest average capital
expenditures.
17
Lastly, the increase in the number of choices also implies that the year-over-year
probability an individual chooses a particular transition, or no transition, is rather small.
Hence, for the multinomial logit models below, we focus on the four-year sample period
transition probabilities, i.e. changes from first being observed to the last period being
observed.
We show the sample period entry and exit rates separately for the three groups in
Table 6. The table shows that, although Mexican-Hispanics are less likely to enter self-
employment than whites, they are 1.5 percentage points more likely to enter a low barrier
industry than whites. Both Hispanic groups are however less likely to enter business
ownership in a high barrier industry. The table suggests that about 2/3 of Mexican-
Hispanic business start-ups are in low barrier industry while only about 1/3 of white
business entries are in these industries. The table also shows that Hispanics are more
likely to exit business ownership over the sample period than whites. Interestingly,
although white owned businesses in the higher barrier industries are more likely to
survive than low barrier industry, the reverse holds for Hispanics. This suggests that the
differences in self-employment exit rates are not entirely due to differences in industry
distribution across groups, in which Hispanics are simply “pushed” into low barrier
industries. Given that the Hispanic-white exit rate gaps are greater the greater the barrier
to enter the industry, it may not be surprising that potential Hispanic entrepreneurs are
more likely to start businesses in low barrier industries, relative to whites. We discuss this
further and look at the role of observables in explaining these differences in the results
section.
18
6. Empirical Results
We begin the empirical analysis by estimating logit models of self-employment
entry and exit, including two dummy variables capturing differences in the conditional
transition probabilities between Mexican-Hispanics and whites, and Other-Hispanics and
whites. All models include controls for year effects.
Self-employment Entry
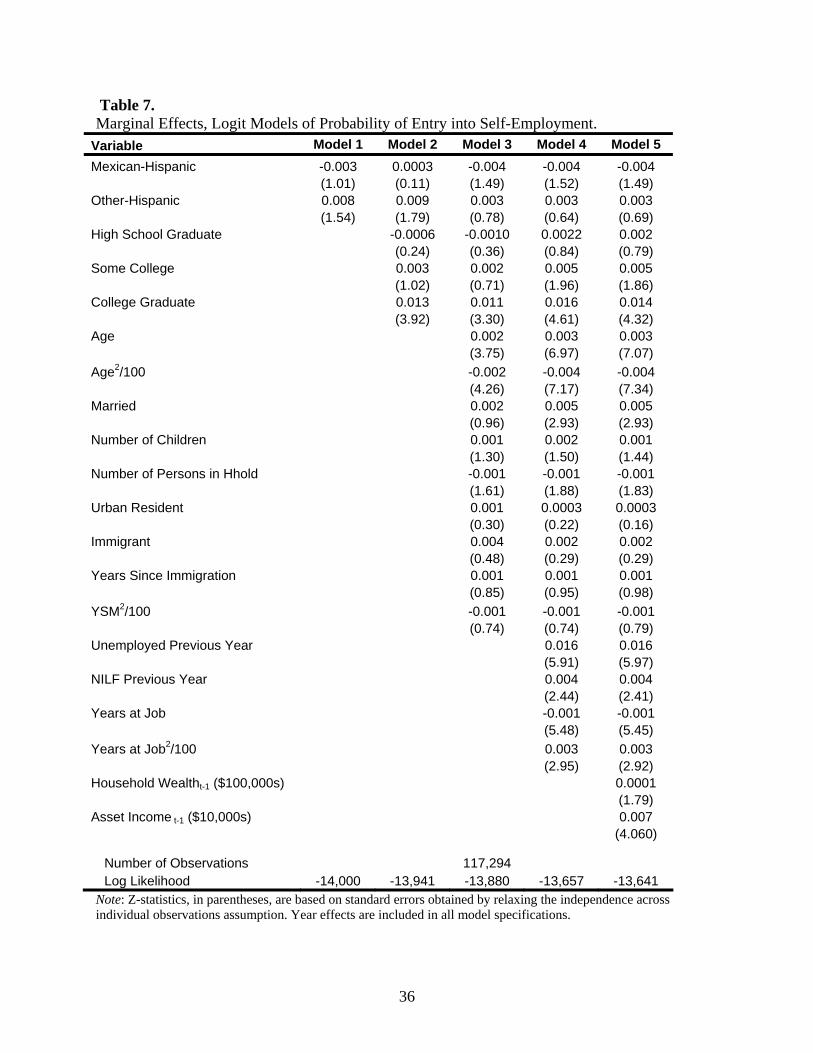
Table 7 shows the marginal effects from estimated logit models of the probability
of entering self-employment. As seen in Model 1, the unadjusted entry rate differences
between the Mexican-Hispanics and whites is quite small, about 0.3%, while Hispanics
not of Mexican descent are approximately 0.8% more likely to enter self-employment
compared to whites. When controls for educational attainment are added, shown as
Model 2, Mexican-Hispanics are more likely to enter self-employment than whites,
although the difference is insignificant in both models, as it is when additional controls
are added, as seen in Models 3-5. This also holds true for the entry rate difference
between Other-Hispanics and whites.
Also of interest are the effects of the determinants on the entry probability.
Models 2-5 point to a large college graduation effect on the probability of a business
start-up. The estimates indicate that a college graduate is about 1.5 percentage point more
likely to become a business owner compared to both high school dropouts and graduates.
The results in Model 4 shows that the longer an individual has held his job, the lower the
probability is that he will become a business owner. Model 4 also shows a strong positive
effect of experiencing unemployment in the previous year on the probability of becoming
19
a business owner. Given that the specification also controls for job tenure, the estimated
effect captures the effect of a change in labor force status and may be viewed as a
“timing” effect. Holding everything else constant, an individual is more likely to enter
self-employment after having left employment to become unemployed, compared to not
leaving employment.
Wealth and asset income also have a positive impact on the self-employment
entry probability, as shown in Model 5. An increase of $100,000 in household wealth,
roughly the difference in mean household wealth between Mexican-Hispanics and
whites, increases the entry probability only by 0.01 percentage points. An increase in
annual asset income of $1,000 increases the probability an individual will enter self-
employment by 0.07 percentage points. These appear to be rather small effects, although
statistically significant, but they also represent about ¼ of the entry rate gap between
Mexican-Hispanics and whites.
Self-employment Exit
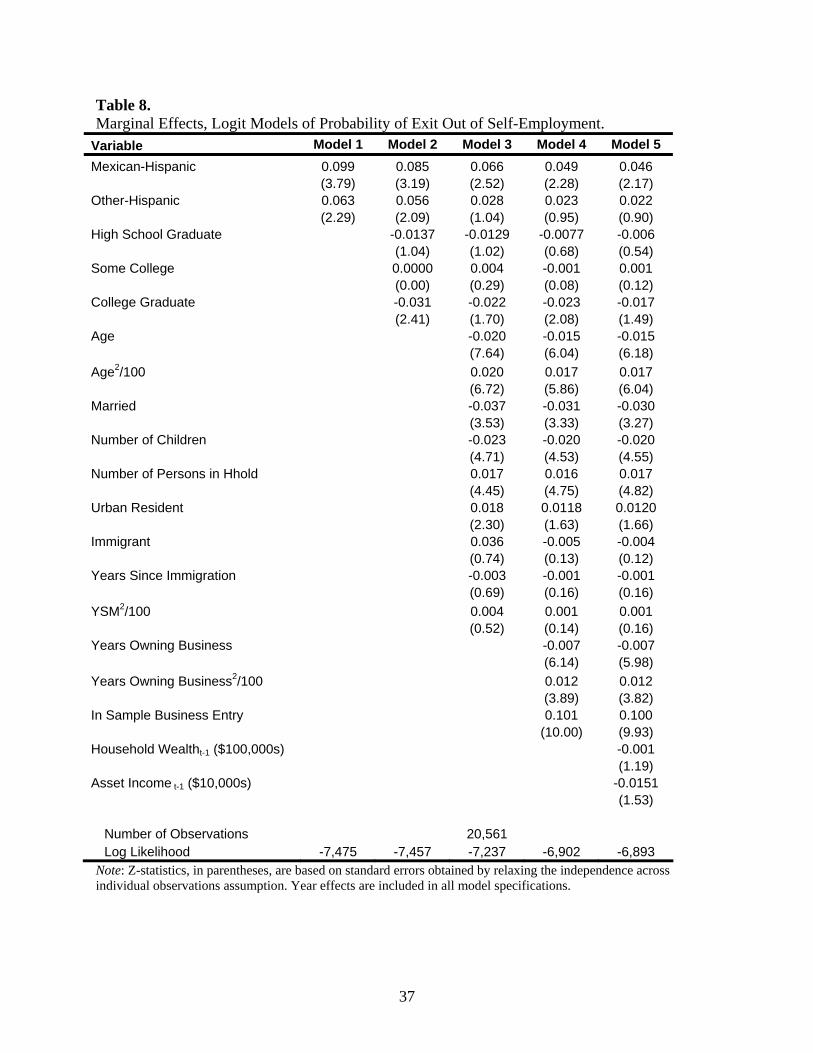
Table 8 shows the marginal effects based on the estimated logit models of year-
over-year self-employment exits. Unlike entry rates, there are large differences in
business failure, or exit, rates across the three groups. The unadjusted differences
between whites and Hispanics are close to 10 percentage points higher for Mexican-
Hispanics and about 6.5 percentage points for Other-Hispanics. As the results from
Model 2 indicate, when education controls are added, the gap for both Hispanic groups
drops by about 15%. Model 3 shows that differences in demographic composition (i.e.
age, family structure, nativity and geographic location) appear to be contributors to
20
higher business ownership exit rates among Hispanics. According to Model 3 estimates,
Mexican-Hispanics are about 6.5 percentage points more likely to exit self-employment,
compared to an observably similar white male.
Not surprisingly, how long a business owner has been in operation has an impact
on the probability of exiting self-employment. The results in Model 4 indicates that an
entrepreneur who has been in business for 10 years is about 5 percentage points less
likely to give up his business, compared to after the first year of ownership. Differences
in business ownership tenure across groups further explain the higher Hispanic self-
employment exit rates, compared to whites. When these factors are controlled for the gap
drops to about 5 percentage points for Mexican-Hispanics and to about 2.3 percentage
points for Other-Hispanics. Lastly, Model 5 shows that higher wealth levels and asset
income are associated with slightly lower exit rates and a further small decrease in the
exit rate gaps between whites and Hispanics. Overall, the results in Table 8 suggest that
roughly half the exit rate gap between Mexican-Hispanics and whites is due to
differences in observable characteristics, while almost 2/3 of the higher self-employment
exit rate among Other-Hispanics, relative to whites, is due to differences in these factors.
However, the shares of the exit rate gaps that can be attributed to observable
characteristics are arguably somewhat pointless since Models 4 and 5 include controls for
business survival, i.e. years of owning the business. A more conservative, and maybe
more appropriate, share of the exit rate gaps due to differences in observable
characteristics, based on Model 3, are 1/3 and 1/2 respectively for the two Hispanic
groups.
21
The Impact of Differences in Exit and Entry Rates on Self-employment Rates
In this section we investigate the role of differences in entry and exit rates on the
Hispanic-white self-employment gap. We utilize the assumption that the transition rates
are in steady-state and hence the self-employment rate can be expressed as the Entry Rate
/ (Entry Rate + Exit Rate). Another goal is to asses how differences in observable
characteristics not only impact the transition rates but how they affect business ownership
rates.
One way to illustrate how small differences in entry rates have a meaningful
impact on self-employment rates, and differences between groups, is to demonstrate what
the self-employment gap would be if Mexican-Hispanics were as likely to enter self-
employment as whites, i.e. an increase in the Mexican-Hispanic self-employment entry
rate by only 0.3%. In this hypothetical example, the Mexican-Hispanic self-employment
rate would increase by slightly more than one percentage point and hence reduce the self-
employment rate gap by that amount.
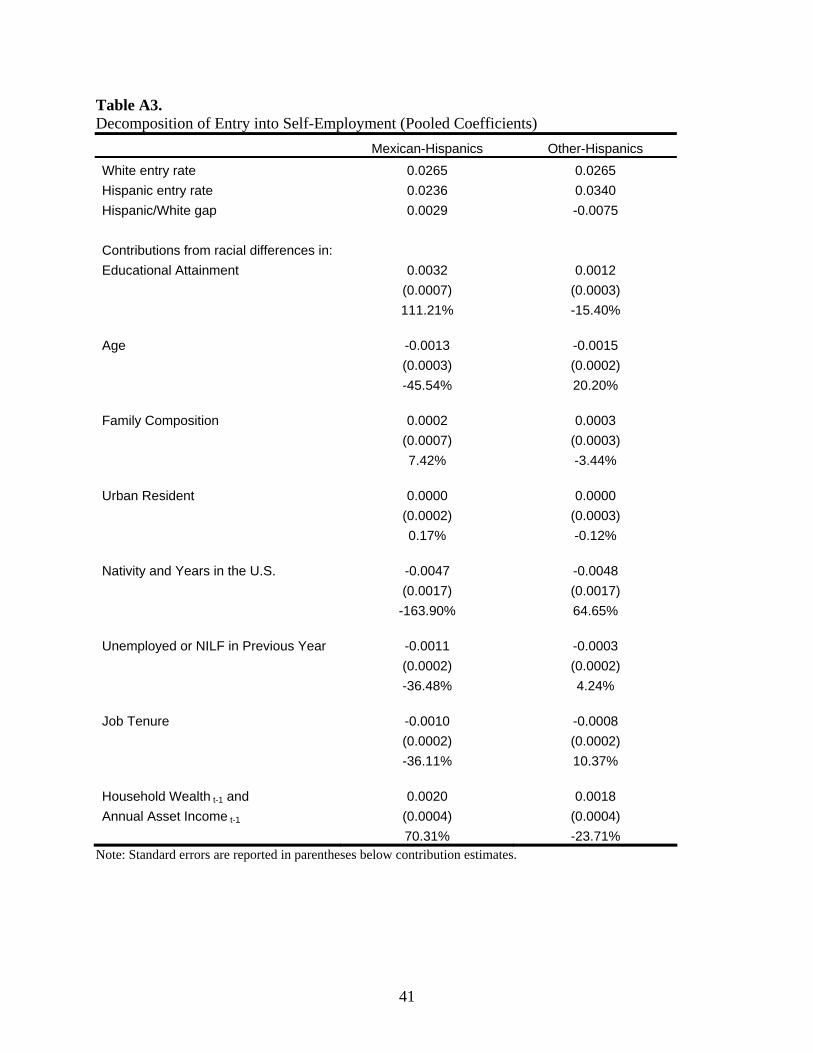
The decomposition results shown in Table A3 show that the contribution from
differences in educational attainment between Mexican-Hispanics and whites to the entry
rate gap is about 0.32%. This implies that if Mexican-Hispanics had the same educational
attainment distribution as whites, the self-employment gap would be decreased by
roughly 1.3 percentage points. The contribution from differences in household wealth and
asset income between these two groups is slightly less that 0.1%, which would decrease
the self-employment gap by about another 0.4 percentage points.
The largest differences between Hispanics and whites are not in the entry rates but
in business ownership exit rates. If we perform the same hypothetical example as above,
22
but instead of assuming white entry rates for Hispanics we assume the white exit rate, the
implied self-employment rate gap between Mexican-Hispanics and whites drop to
slightly less than two percentage points, while the gap is turned into a “surplus” for
Other-Hispanics. If we turn to the role of differences in observable characteristics and use
the decomposition results in Table A4, we see that about 40% of the observed exit rate
gap is due to differences in observable characteristics between Mexican-Hispanics and
whites. The respective proportion of the exit rate gap for Other-Hispanics is slightly
higher at 42%. If we use these estimates and derive “implied” self-employment rate gaps,
we see that Mexican-Hispanic self-employment rates would be about 2 percentage point
higher while business ownership rates among Other-Hispanics would increase by
approximately 2.5 percentage points. Note however that the latter calculations are based
on estimates which include controls for years of business ownership, which accounts for
almost half the gaps attributable to our observable controls.
Although these “rough” calculations show that differences in observable
characteristics explain part of the observed self-employment gap, they also illustrate that
large, unexplained, differences remain between Hispanics and whites. The next section
attempts to address the role of industries in further explaining entrepreneurship
differences between Hispanics and whites.
The Role of Industries and Potential Entry Barriers
To address the role of industries in the business start-up decision, we estimate
multinomial logit model with four choice categories; no entry, entry into a low barrier
industry, entry into a medium barrier industry or entry into a high barrier industry. We
23
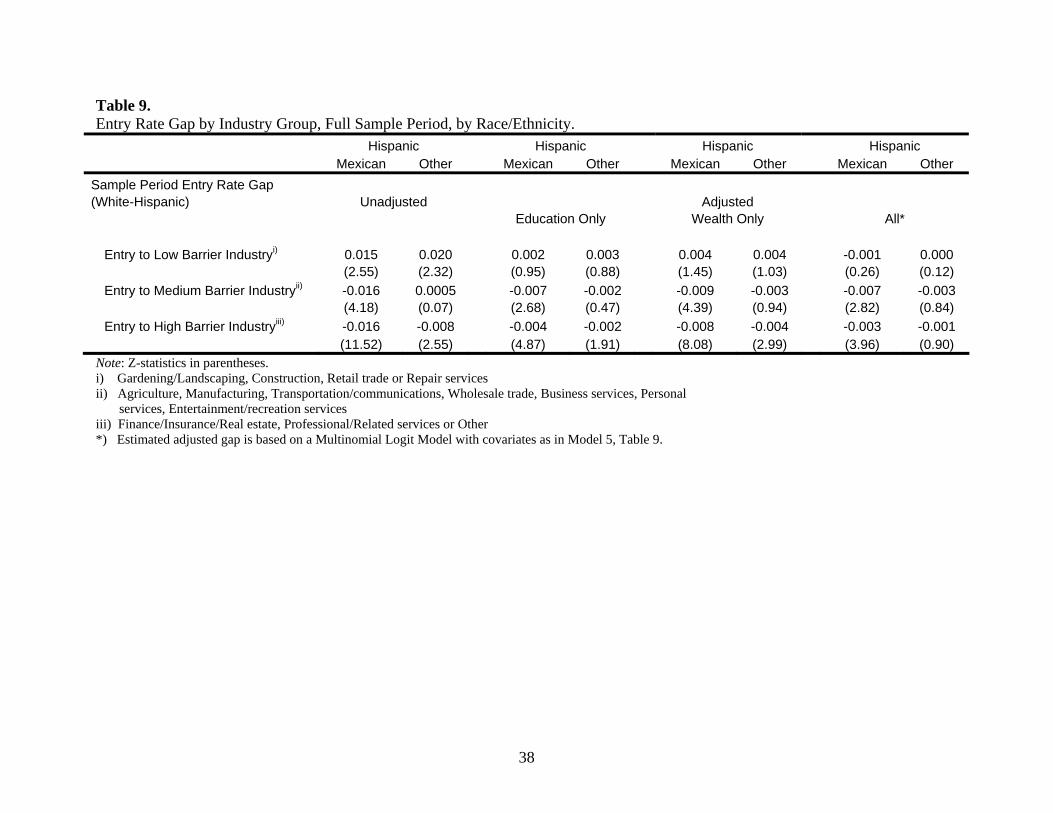
present the estimated gaps based on different specifications in Table 9.4 The table shows
that without any controls for observable factors, both Hispanics groups are more likely to
enter business ownership in a low barrier industry than whites, by about 1.5 and 2
percentage points respectively. However, Mexican Hispanics are about 1.5 percentage
points less likely to enter either a medium or high barrier industry compared to whites,
while there are no differences in the probability to start a business in the medium barrier
industry for Other-Hispanics. They latter group is however close to one percentage point
less likely to enter a high barrier industry than whites. Although the unadjusted
differences are quite informative, in that they point out that the type of business start-ups
for Hispanics and whites are very different, they may be due to differences in education
and wealth.
The remaining columns in Table 9 attempt to address the specific roles of
education and financial capital in explaining the observed differences across groups. In
the specification with controls only for schooling levels, there are no differences between
Hispanics and whites in entry rates to the low barrier industry category. This is due to the
negative relationship between business start-up in the low barrier category and higher
levels of educational attainment. The results also indicate that the lower entry rates into
medium and high barrier industries is largely due to the lower schooling levels of
Hispanics. The white-Mexican Hispanic business start-up gap drops by about 50% and
75% respectively for these industry categories. Although our estimates for the entry rate
gaps into these industry categories appear to be affected by differences in wealth, these
effects are not as strong as the impact of education. In fact, adding controls for all
4 Multinomial logit parameter vectors and standard errors are not shown but are available on request from the authors.
24
observable characteristics does not change the estimated gaps by much compared to the
specification with only schooling level controls. Overall, these results suggest that
Hispanics entrepreneurs are quite likely to start their own business but given their
relatively low levels of education, these start-ups are to a large extent restricted to low
barrier industries, such as businesses in gardening/landscaping and construction.
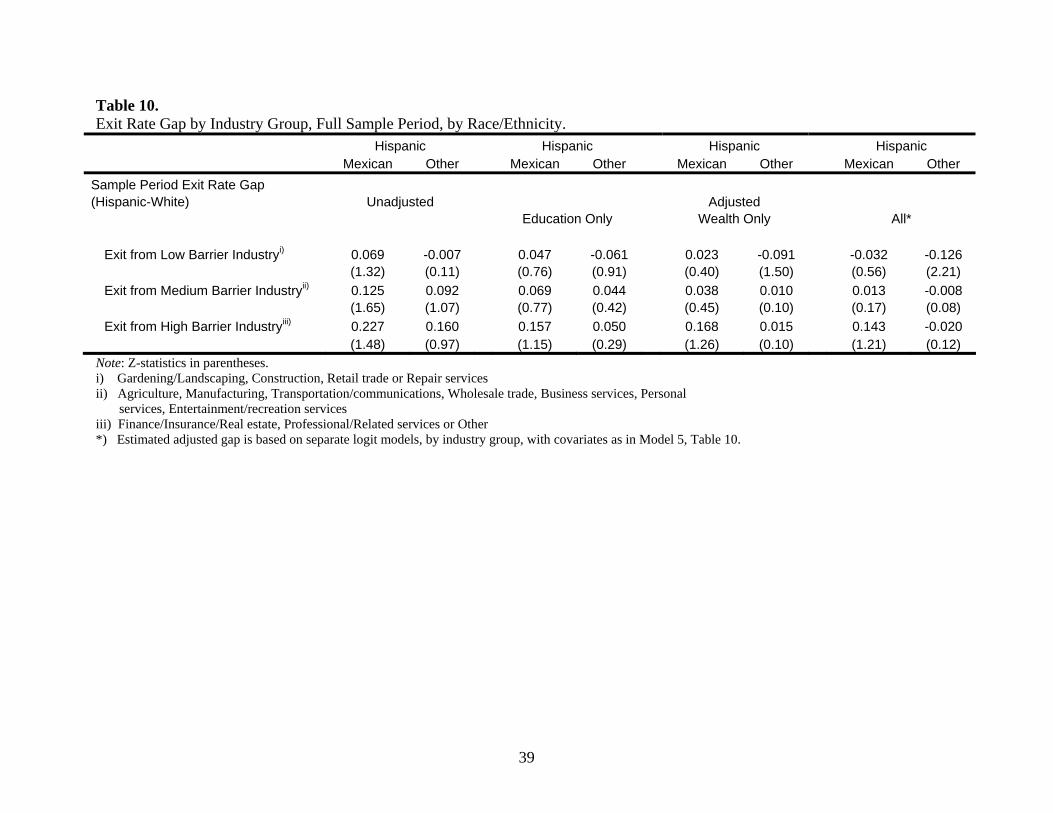
The relatively higher Hispanic entry rates into firms in the low barrier industry
category may also partly explain the higher Hispanic self-employment exit rates
discussed above. Table 10 shows the estimated Hispanic-white exit rates gap by industry
categories. As Table 6 indicates, overall, the exit rates are monotonically decreasing as
the barriers increase. However, the reverse is true for Hispanics. It should be pointed out
that the Hispanic-white industry exit rates gaps are not very precisely estimated due to the
relatively few observations in each of these cells. Nonetheless, the results in Table 10
indicate higher self-employment exit rates for Hispanics in all three industry categories
and that the differences are particularly large for entrepreneurs operating businesses in
the medium and high barrier industries.
Again, we attempt to address the role of education and wealth in explaining these
differences. Unlike the entry rate results, the Hispanic-white exit rate gap appears to
somewhat more of an issue of differences in wealth than schooling levels. For example,
the observed exit rate gaps in the medium barrier industry are about 12 and 9 percent
points respectively for Mexican and Other-Hispanics. The estimated gaps with only
schooling level controls drop to roughly 7 and 4 percentage points while the gap decrease
to approximately 4 and 1 percentage points with only wealth controls. This suggests the
possibility that once a Hispanic entrepreneur has started a business, he faces additional
25
capital constraints, compared to whites, that decreases the survival probability, even
within industry group. Also noteworthy, the estimated Mexican Hispanic-white exit rate
gap for firms in the low barrier industry group turns to a “deficit” when we control for all
observable characteristics, suggesting that the observed higher exit rates are entirely due
to differences in observable characteristics.5 Furthermore, the results also suggest that the
higher observed exit rates for non-Mexican Hispanics in all industry groups are due to
differences in observable characteristics. Lastly, the lower business survival rates among
Mexican-Hispanics in the higher barrier industries also provides an additional potential
explanation for the concentration of Mexican-Hispanic business start-ups in the low
barrier industry group, since the lower survival rates in the high barrier industry make
these ventures more risky even for an observationally similar Hispanic entrepreneur,
compared to a non-Hispanic white entrepreneur.
7. Summary and Conclusions
This paper contributes to the minority entrepreneurship research by analyzing
self-employment among Hispanics, an important and growing minority group which has
been relatively overlooked in the entrepreneurship literature. Our data reveals that
Hispanic males are substantially less likely to be business owners, relative to whites. The
self-employment gap is particularly large for Mexican-Hispanics, whose self-
employment rates are about half the self-employment rates among non-Hispanic whites.
We investigate the causes of the Hispanic-white difference in business ownership rates by
analyzing self-employment entry and exit rates.
5 Importantly, this holds true whether or not we include controls for years of business ownership.
26
We observe relatively small differences in self-employment entry rates across
groups, with Other-Hispanics displaying the highest entry rates. We argue that this should
not be interpreted as Hispanics do not face additional barriers to enter self-employment.
We observe differences across groups in forms of businesses owned, i.e. incorporated or
unincorporated, and industry composition. Although these differences are partially due to
differences in factors such as educational attainment, they are also consistent with
minority business start-up credit constraints which lead to less well funded small business
and/or selection into less capital intensive industries. Also, we show that relatively small
differences in entry rates have a meaningful impact on the Hispanic self-employment
gap. The data also reveal large differences in business survival, or exit, rates, and show
that Hispanics are substantially more likely to exit self-employment than whites.
Our estimates indicate that education plays an important role in the business start-
up decision and that after controlling for differences in educational attainment across
groups, Hispanics are as likely to enter self-employment as whites. Household wealth and
asset income also affects the entry decision, as well as differences in entry probabilities
across groups. Our results indicate that between 20 and 40 percent of the Hispanic-white
exit rate gap is due to differences in our observable controls. Although our results point to
education and financial capital as factors partly explaining the observed low Hispanic
self-employment rates, it also indicates that a substantial part of the gap remains
unexplained.
We discuss and analyze the role of industries in further explaining differences in
entrepreneurship between Hispanics and whites. We categorize firms into three industry
groups based on human and financial capital requirements to enter the industry; low,
27
medium and high barriers to enter industries. This reveals that Hispanics are more likely
than whites to become business owners in the low barrier industry group. The observed
lower self-employment entry rates among Hispanics are due to lower entry rates into the
relatively higher barrier industries. Our analysis indicates that this is primarily due to
lower educational attainment levels, although difference in financial wealth appears to
contribute to some extent. Hispanic entrepreneurs in all three industry groups are more
likely to leave self-employment than whites. Furthermore, the Hispanic-white exit rate
gap is greater the greater the barrier to enter the industry is. We find that the observed
higher business ownership exit rates among Mexican-Hispanics, compared to whites, in
the low barrier industry group is explained by differences in observable characteristics.
Moreover, our results suggest a greater role in explaining differences in exit rates across
groups to differences in wealth rather than differences in education, although the latter
also contributes to the gap. The role of wealth differences may point to relatively less
well financed Hispanic businesses as an explanation for the higher failure rates and may
be due to stronger capital constraints faced by Hispanics. Also, the results provide an
additional rationale for the concentration of Mexican-Hispanic business start-ups in the
low barrier industry group. The relatively lower Mexican-Hispanic survival rates in the
high barrier industry make these ventures more risky for Mexican-Hispanics than whites,
and arguably less attractive.
Although our findings shed light on the white-Hispanic self-employment gap, it
also points to the need for further research to more accurately assess, particularly, the
higher business failure rates among Hispanics. Our relatively small sample size makes
the industry specific exit rate estimates rather imprecise and should be interpreted with
28
the appropriate discretion. Nonetheless they are suggestive of some potential
explanations.
Lastly, our results quite strongly indicate the importance of education in
explaining differences in business ownership between Hispanics and whites, not only as a
determinant of the self-employment gap, but also in its effects on what type of business
start-ups entrepreneurs are likely to pursue. Furthermore, since business survival rates
vary across industries, education also has an indirect impact on self-employment exit
rates. Overall, this suggests yet another area in which education is a key determinant in
economic success.
29
Appendix
Decomposition of Transition Rate Gaps
To assess the specific role of differences in observable characteristics across
groups in explaining Hispanic-white entry and exit rates gaps, we utilize a non-linear
Blinder-Oaxaca decomposition as proposed by Fairlie (1999). The decompositions are
based on the estimated logit parameter vectors from a specification similar to Model 5
shown in Tables 7 and 8, but exclude the Hispanic indicator variables. The
decomposition results are presented in Tables A3 and A4.
Since the decomposition is based on logit results from separate regressions for the
three groups, it has the advantage that it relaxes the assumption that observables have the
same impact on transition probabilities across groups. Furthermore, this approach has the
advantage, compared to the technique utilized in Tables 7 and 8, that the order in which
controls are added is irrelevant. That is, for example, in Tables 7 and 8 we add education
controls first and assign the drop in the Hispanic coefficients to differences in educational
attainment alone, ignoring the likely possibility that education is positively correlated
with wealth, for example. This may or may not be an important issue. A comparison of
the decomposition results to the discussion in Section 6 suggests no real changes in
conclusions based on the two approaches to analyze group differences.
30
References Bates, Timothy. 1989. "The Changing Nature of Minority Business: A Comparative
Analysis of Asian, Nonminority, and Black-Owned Businesses" The Review of Black Political Economy, 18, Fall: 25-42.
Bates, Timothy. 1990. "Entrepreneur Human Capital Inputs and Small Business
Longevity," Review of Economics and Statistics 72 (4): 551-59.
Bates, Timothy. 1990. "Self-Employment Trends Among Mexican Americans”, Working Paper, U.S. Census Economic Studies.
Bates, Timothy. 1995. “Self-Employment Entry across Groups” Journal of Business
Venturing, 10: 143-156 Bates, Timothy. 1997. Race, Self-Employment & Upward Mobility: An Illusive
American Dream, Washington, D.C.: Woodrow Wilson Center Press and Baltimore: John Hopkins University Press.
Betts, Julian R. and Magnus Lofstrom. 2000. “The Educational Attainment of
Immigrants: Trends and Implications,” in George J. Borjas ed. Issues in the Economics of Immigration, University of Chicago Press, for National Bureau of Economic Research, pp. 51-115.
Blanchflower, David G. 2004. “Self-Employment: More May Not Be Better”, NBER
Working paper No. 10286. Blanchflower, David G., P. Levine and D. Zimmerman. 2003. "Discrimination in the
Small Business Credit Market", Review of Economics and Statistics, November, 85(4): 930-943
Blanchflower, David G. and Andrew J. Oswald. 1998. “What Makes an Entrepreneur?”
Journal of Labor Economics,16, 26-60. Cummings, Scott. 1980. Self-Help in Urban America: Patterns of Minority Business
Enterprise, Kenikart Press, New York. Dunn, T. and D. Holtz-Eakin. 2000. “Financial Capital, Human Capital, and the
Transition to Self-Employment: Evidence from Intergenerational Links.” Journal of Labor Economics,18, 282-305.
Evans, David S. and Boyan Jovanovic. 1989. “An Estimated Model of Entrepreneurial
Choice under Liquidity Constraints.” Journal of Political Economy, 97, 808-827. Evans, David S. and Linda S. Leighton. 1989. “Some Empirical Aspects of
Entrepreneurship”. American Economic Review, 79, 519-35.
31
Fairlie, Robert W. and Christopher Woodruff. 2005. “Mexican-American
Entrepreneurship” Paper presented at the 10th Annual Meeting of the Society of Labor Economists, San Francisco, June 2005.
Fairlie, Robert W. 1999. "The Absence of the African-American Owned Business: An
Analysis of the Dynamics of Self-Employment." Journal of Labor Economics, 17(1): 80-108.
Fairlie, Robert W. and Meyer, Bruce D. 1996. “Ethnic and Racial Self-Employment
Differences and Possible Explanations.” Journal of Human Resources 31:757-93. Glazer, Mathan and Daniel P. Moynihan. 1970. Beyond the Melting Pot: the Negroes,
Puerto Ricans, Jews, Italians and Irish of New York City, MIT Press, Cambridge. Holtz-Eakin, Douglas, David Joulfaian and Harvey S. Rosen. 1994a. “Sticking it Out:
Entrepreneurial Survival and Liquidity Constraints.” Journal of Political Economy, 102, 53-75.
Holtz-Eakin, Douglas, David Joulfaian and Harvey S. Rosen. 1994b. “Entrepreneurial
Decisions and Liquidity Constraints” Rand Journal of Economics, 25, 334-47. Hurst, Erik, and Annamaria Lusardi. 2004. "Liquidity Constraints, Household Wealth,
and Entrepreneurship," Journal of Political Economy, 112(2): 319-347. Kihlstrom, Richard E. and Jean-Jacques Laffont. 1979. “A General Equilibrium
Entrepreneurial Theory of Firm Formation Based on Risk Aversion” Journal of Political Economy, 87:4, 719-748.
Lindh, Thomas and Henry Ohlsson. 1996. “Self-Employment and Windfall Gains.
Evidence from the Swedish Lottery”. The Economic Journal, 106, 1515-1526. Lofstrom, Magnus. 2002. “Labor Market Assimilation and the Self-Employment
Decision of Immigrant Entrepreneurs,” Journal of Population Economics, 15(1): 83-114.
Taniguchi, Hiromi. 2002. “Determinants of Women’s Entry into Self-Employment”
Social Science Quarterly, 3: 875-93.
32
Table 1. Sample Means by Ethnicity/Race Hispanic White Mexican Other (Non-Hispanic) High School Dropout 0.42 0.26 0.09 High School Graduate 0.30 0.27 0.31 Some College 0.23 0.30 0.30 College Graduate 0.06 0.17 0.30 Age 37.21 39.86 41.61 Married 0.67 0.63 0.68 Number of Children 1.52 0.99 0.80 Number of Persons in Household 4.33 3.54 3.03 Urban Resident 0.88 0.95 0.77 Immigrant 0.48 0.52 0.03 Years Since Immigration 7.46 7.53 0.57 Annual Earnings 20,016 23,883 35,568 Hours Work/Week 36.61 36.62 39.50 Self-employed 0.085 0.117 0.161 Wage/Salary 0.759 0.720 0.703 Unemployed 0.034 0.036 0.016 Not in Labor Force 0.122 0.127 0.121 Household Wealth 49,733 65,122 165,122 Annual Household Asset Income 118 234 784 Sample Size 10,720 5,138 124,876 Number of Individuals 1,531 763 16,977
33
Table 2. Sample Statistics by Ethnicity/Race and Self-Employment (conditional on employment) Hispanic White Mexican Other (Non-Hispanic) Wage/Salary Self-Employed Wage/Salary Self-Employed Wage/Salary Self-Employed High School Dropout 0.40 0.46 0.23 0.21 0.06 0.07 High School Graduate 0.30 0.23 0.28 0.29 0.32 0.28 Some College 0.24 0.22 0.31 0.28 0.31 0.27 College Graduate 0.06 0.09 0.19 0.22 0.31 0.38 Age 36.07 42.28 39.44 40.85 40.10 44.45 Married 0.69 0.79 0.66 0.74 0.69 0.76 Number of Children 1.59 1.60 1.01 1.22 0.85 0.90 Number of Persons in Household 4.37 4.30 3.56 3.62 3.08 3.11 Urban Resident 0.90 0.82 0.96 0.94 0.78 0.74 Immigrant 0.49 0.50 0.53 0.67 0.03 0.03 Years Since Immigration 7.41 8.31 7.21 11.37 0.53 0.77 Total Annual Earnings
Mean 23,040 22,246 27,700 27,865 39,023 46,866 Median 19,610 16,640 22,068 17,600 32,036 29,889
Hours Work/Week 41.32 46.24 41.54 47.89 43.44 50.49 Job Tenure 6.42 N/A 6.68 N/A 8.79 N/A Business Tenure N/A 6.81 N/A 6.22 N/A 9.63 Household Wealth
Mean 45,828 81,465 56,659 138,041 135,693 304,735 Median 15,050 36,537 15,325 43,640 57,141 135,096
Annual Household Asset Income 125 151 217 585 632 1,452 Sample Size 8,133 913 3,698 603 87,775 20,102
34
Table 3. Self-Employment Ratios and Transitions (in %) by Race/Ethnicity. Mexican Hispanics Other Hispanics White Non-Hispanics Percent N Percent N Percent N Self-Employment Ratio 8.52 10,720 11.74 5,138 16.10 124,876 Transitions Entry 2.36 9,618 3.40 4,472 2.65 103,204
Entry from Wage/Salary 2.09 8,328 3.14 3,760 2.59 89,557 Entry from Unemployment 6.01 316 10.23 176 9.41 1,520 Entry from NILF 5.16 1,008 5.62 569 4.73 12,760
Exit 20.46 831 18.63 542 11.35 19,188 Exit to Wage/Salary 15.52 16.97 9.05 Exit to Unemployment 1.44 0.18 0.32 Exit to NILF 3.49 1.48 1.98
Table 4. Business Ownership Characteristics, Sample Means, by Race/Ethnicity. Hispanic White Mexican Other (Non-Hispanic)
Business Type (%) Incorporated 7.4 27.9 27.4 Unincorporated 69.1 44.8 49.2 Unincorporated w/ Partner 10.3 14.3 11.1 Household Business Partner 6.2 14.8 11.6 Business Tenure 6.81 6.22 9.63 Business Equity 25,037 54,722 89,537
35
Table 5. Business Ownership - Industry Characteristics and Distribution, by Race/Ethnicity.
Industry Characteristics Hispanic White Sample Mean Mexican Other (Non-Hispanic)
Years of Business Schooling Equity ($) Percent in Industry
Agriculture/Forestry/Fisheries 13.0 176,169 5.5 5.3 9.4 Construction 12.4 64,595 33.1 19.8 19.9 Manufacturing 13.8 106,813 3.9 3.3 5.6 Transportation/Communications 12.3 59,313 6.6 5.0 4.6 Wholesale Trade 14.0 139,648 1.1 4.2 5.4 Retail trade 13.3 71,833 13.9 14.2 10.0 Finance/Insurance/Real estate 15.0 112,720 3.0 1.9 5.9 Business Services 14.5 63,265 3.0 13.0 8.5 Personal Services 13.9 57,700 3.8 3.3 3.1 Entertainment/Recreation Services 14.6 20,587 2.0 2.1 4.2 Professional/Related Services 17.7 98,527 3.9 8.2 16.6 Gardening/Landscaping 11.5 63,168 6.8 3.9 2.0 Repair Services 11.7 26,275 13.5 15.7 4.4 Other 13.7 102,521 0.0 0.2 0.3
Table 6. Transition Probabilities by Industry Group, Full Sample Period, by Race/Ethnicity. Hispanic White Hispanic White Mexican Other Mexican Other Sample Period Transition Probabilities Entry Exit
No Transition 93.7 90.8 91.9 58.1 63.8 68.7 Transitions
Entry/Exit Low Barrier Industryi) 4.4 4.9 2.9 39.9 32.3 33.0 Entry/Exit Medium Barrier Industryii) 1.8 3.4 3.4 44.1 40.7 31.6 Entry/Exit High Barrier Industryiii) 0.2 0.9 1.9 50.5 43.8 27.8
Number of Individuals 1,436 710 14,946 169 108 3,205 i) Gardening/Landscaping, Construction, Retail trade or Repair services ii) Agriculture, Manufacturing, Transportation/communications, Wholesale trade, Business services, Personal services, Entertainment/recreation services iii) Finance/Insurance/Real estate, Professional/Related services or Other
36
Table 7. Marginal Effects, Logit Models of Probability of Entry into Self-Employment.
Variable Model 1 Model 2 Model 3 Model 4 Model 5 Mexican-Hispanic -0.003 0.0003 -0.004 -0.004 -0.004 (1.01) (0.11) (1.49) (1.52) (1.49) Other-Hispanic 0.008 0.009 0.003 0.003 0.003 (1.54) (1.79) (0.78) (0.64) (0.69) High School Graduate -0.0006 -0.0010 0.0022 0.002 (0.24) (0.36) (0.84) (0.79) Some College 0.003 0.002 0.005 0.005 (1.02) (0.71) (1.96) (1.86) College Graduate 0.013 0.011 0.016 0.014 (3.92) (3.30) (4.61) (4.32) Age 0.002 0.003 0.003 (3.75) (6.97) (7.07) Age2/100 -0.002 -0.004 -0.004 (4.26) (7.17) (7.34) Married 0.002 0.005 0.005 (0.96) (2.93) (2.93) Number of Children 0.001 0.002 0.001 (1.30) (1.50) (1.44) Number of Persons in Hhold -0.001 -0.001 -0.001 (1.61) (1.88) (1.83) Urban Resident 0.001 0.0003 0.0003 (0.30) (0.22) (0.16) Immigrant 0.004 0.002 0.002 (0.48) (0.29) (0.29) Years Since Immigration 0.001 0.001 0.001 (0.85) (0.95) (0.98) YSM2/100 -0.001 -0.001 -0.001 (0.74) (0.74) (0.79) Unemployed Previous Year 0.016 0.016 (5.91) (5.97) NILF Previous Year 0.004 0.004 (2.44) (2.41) Years at Job -0.001 -0.001 (5.48) (5.45) Years at Job2/100 0.003 0.003 (2.95) (2.92) Household Wealtht-1 ($100,000s) 0.0001 (1.79) Asset Income t-1 ($10,000s) 0.007 (4.060)
Number of Observations 117,294 Log Likelihood -14,000 -13,941 -13,880 -13,657 -13,641
Note: Z-statistics, in parentheses, are based on standard errors obtained by relaxing the independence across individual observations assumption. Year effects are included in all model specifications.
37
Table 8. Marginal Effects, Logit Models of Probability of Exit Out of Self-Employment.
Variable Model 1 Model 2 Model 3 Model 4 Model 5 Mexican-Hispanic 0.099 0.085 0.066 0.049 0.046 (3.79) (3.19) (2.52) (2.28) (2.17) Other-Hispanic 0.063 0.056 0.028 0.023 0.022 (2.29) (2.09) (1.04) (0.95) (0.90) High School Graduate -0.0137 -0.0129 -0.0077 -0.006 (1.04) (1.02) (0.68) (0.54) Some College 0.0000 0.004 -0.001 0.001 (0.00) (0.29) (0.08) (0.12) College Graduate -0.031 -0.022 -0.023 -0.017 (2.41) (1.70) (2.08) (1.49) Age -0.020 -0.015 -0.015 (7.64) (6.04) (6.18) Age2/100 0.020 0.017 0.017 (6.72) (5.86) (6.04) Married -0.037 -0.031 -0.030 (3.53) (3.33) (3.27) Number of Children -0.023 -0.020 -0.020 (4.71) (4.53) (4.55) Number of Persons in Hhold 0.017 0.016 0.017 (4.45) (4.75) (4.82) Urban Resident 0.018 0.0118 0.0120 (2.30) (1.63) (1.66) Immigrant 0.036 -0.005 -0.004 (0.74) (0.13) (0.12) Years Since Immigration -0.003 -0.001 -0.001 (0.69) (0.16) (0.16) YSM2/100 0.004 0.001 0.001 (0.52) (0.14) (0.16) Years Owning Business -0.007 -0.007 (6.14) (5.98) Years Owning Business2/100 0.012 0.012 (3.89) (3.82) In Sample Business Entry 0.101 0.100 (10.00) (9.93) Household Wealtht-1 ($100,000s) -0.001 (1.19) Asset Income t-1 ($10,000s) -0.0151 (1.53)
Number of Observations 20,561 Log Likelihood -7,475 -7,457 -7,237 -6,902 -6,893
Note: Z-statistics, in parentheses, are based on standard errors obtained by relaxing the independence across individual observations assumption. Year effects are included in all model specifications.
38
Table 9. Entry Rate Gap by Industry Group, Full Sample Period, by Race/Ethnicity.
Hispanic Hispanic Hispanic Hispanic Mexican Other Mexican Other Mexican Other Mexican Other Sample Period Entry Rate Gap (White-Hispanic) Unadjusted Adjusted Education Only Wealth Only All*
Entry to Low Barrier Industryi) 0.015 0.020 0.002 0.003 0.004 0.004 -0.001 0.000 (2.55) (2.32) (0.95) (0.88) (1.45) (1.03) (0.26) (0.12) Entry to Medium Barrier Industryii) -0.016 0.0005 -0.007 -0.002 -0.009 -0.003 -0.007 -0.003 (4.18) (0.07) (2.68) (0.47) (4.39) (0.94) (2.82) (0.84) Entry to High Barrier Industryiii) -0.016 -0.008 -0.004 -0.002 -0.008 -0.004 -0.003 -0.001
(11.52) (2.55) (4.87) (1.91) (8.08) (2.99) (3.96) (0.90) Note: Z-statistics in parentheses. i) Gardening/Landscaping, Construction, Retail trade or Repair services ii) Agriculture, Manufacturing, Transportation/communications, Wholesale trade, Business services, Personal services, Entertainment/recreation services iii) Finance/Insurance/Real estate, Professional/Related services or Other *) Estimated adjusted gap is based on a Multinomial Logit Model with covariates as in Model 5, Table 9.
39
Table 10. Exit Rate Gap by Industry Group, Full Sample Period, by Race/Ethnicity.
Hispanic Hispanic Hispanic Hispanic Mexican Other Mexican Other Mexican Other Mexican Other Sample Period Exit Rate Gap (Hispanic-White) Unadjusted Adjusted Education Only Wealth Only All*
Exit from Low Barrier Industryi) 0.069 -0.007 0.047 -0.061 0.023 -0.091 -0.032 -0.126 (1.32) (0.11) (0.76) (0.91) (0.40) (1.50) (0.56) (2.21) Exit from Medium Barrier Industryii) 0.125 0.092 0.069 0.044 0.038 0.010 0.013 -0.008 (1.65) (1.07) (0.77) (0.42) (0.45) (0.10) (0.17) (0.08) Exit from High Barrier Industryiii) 0.227 0.160 0.157 0.050 0.168 0.015 0.143 -0.020
(1.48) (0.97) (1.15) (0.29) (1.26) (0.10) (1.21) (0.12) Note: Z-statistics in parentheses. i) Gardening/Landscaping, Construction, Retail trade or Repair services ii) Agriculture, Manufacturing, Transportation/communications, Wholesale trade, Business services, Personal services, Entertainment/recreation services iii) Finance/Insurance/Real estate, Professional/Related services or Other *) Estimated adjusted gap is based on separate logit models, by industry group, with covariates as in Model 5, Table 10.
40
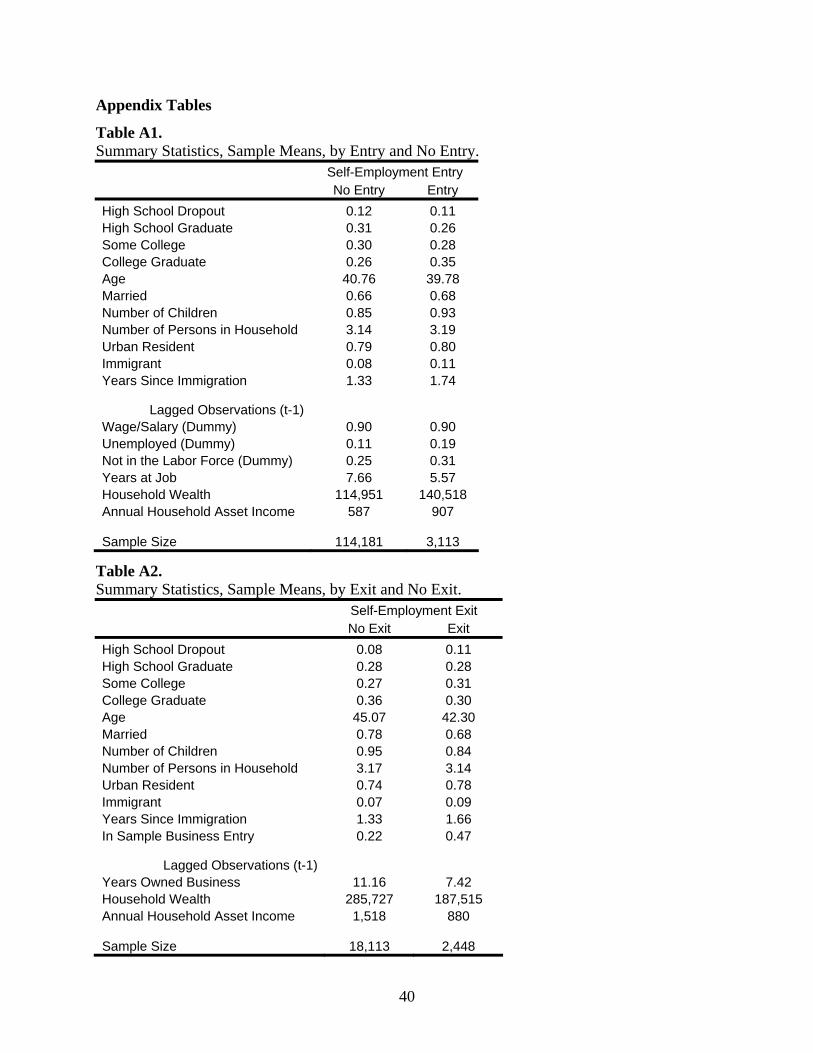
Appendix Tables
Table A1. Summary Statistics, Sample Means, by Entry and No Entry. Self-Employment Entry No Entry Entry High School Dropout 0.12 0.11 High School Graduate 0.31 0.26 Some College 0.30 0.28 College Graduate 0.26 0.35 Age 40.76 39.78 Married 0.66 0.68 Number of Children 0.85 0.93 Number of Persons in Household 3.14 3.19 Urban Resident 0.79 0.80 Immigrant 0.08 0.11 Years Since Immigration 1.33 1.74
Lagged Observations (t-1) Wage/Salary (Dummy) 0.90 0.90 Unemployed (Dummy) 0.11 0.19 Not in the Labor Force (Dummy) 0.25 0.31 Years at Job 7.66 5.57 Household Wealth 114,951 140,518 Annual Household Asset Income 587 907 Sample Size 114,181 3,113
Table A2. Summary Statistics, Sample Means, by Exit and No Exit. Self-Employment Exit No Exit Exit High School Dropout 0.08 0.11 High School Graduate 0.28 0.28 Some College 0.27 0.31 College Graduate 0.36 0.30 Age 45.07 42.30 Married 0.78 0.68 Number of Children 0.95 0.84 Number of Persons in Household 3.17 3.14 Urban Resident 0.74 0.78 Immigrant 0.07 0.09 Years Since Immigration 1.33 1.66 In Sample Business Entry 0.22 0.47
Lagged Observations (t-1) Years Owned Business 11.16 7.42 Household Wealth 285,727 187,515 Annual Household Asset Income 1,518 880 Sample Size 18,113 2,448
41
Table A3. Decomposition of Entry into Self-Employment (Pooled Coefficients) Mexican-Hispanics Other-Hispanics White entry rate 0.0265 0.0265 Hispanic entry rate 0.0236 0.0340 Hispanic/White gap 0.0029 -0.0075 Contributions from racial differences in: Educational Attainment 0.0032 0.0012 (0.0007) (0.0003) 111.21% -15.40% Age -0.0013 -0.0015 (0.0003) (0.0002) -45.54% 20.20% Family Composition 0.0002 0.0003 (0.0007) (0.0003) 7.42% -3.44% Urban Resident 0.0000 0.0000 (0.0002) (0.0003) 0.17% -0.12% Nativity and Years in the U.S. -0.0047 -0.0048 (0.0017) (0.0017) -163.90% 64.65% Unemployed or NILF in Previous Year -0.0011 -0.0003 (0.0002) (0.0002) -36.48% 4.24% Job Tenure -0.0010 -0.0008 (0.0002) (0.0002) -36.11% 10.37% Household Wealth t-1 and 0.0020 0.0018 Annual Asset Income t-1 (0.0004) (0.0004) 70.31% -23.71%
Note: Standard errors are reported in parentheses below contribution estimates.
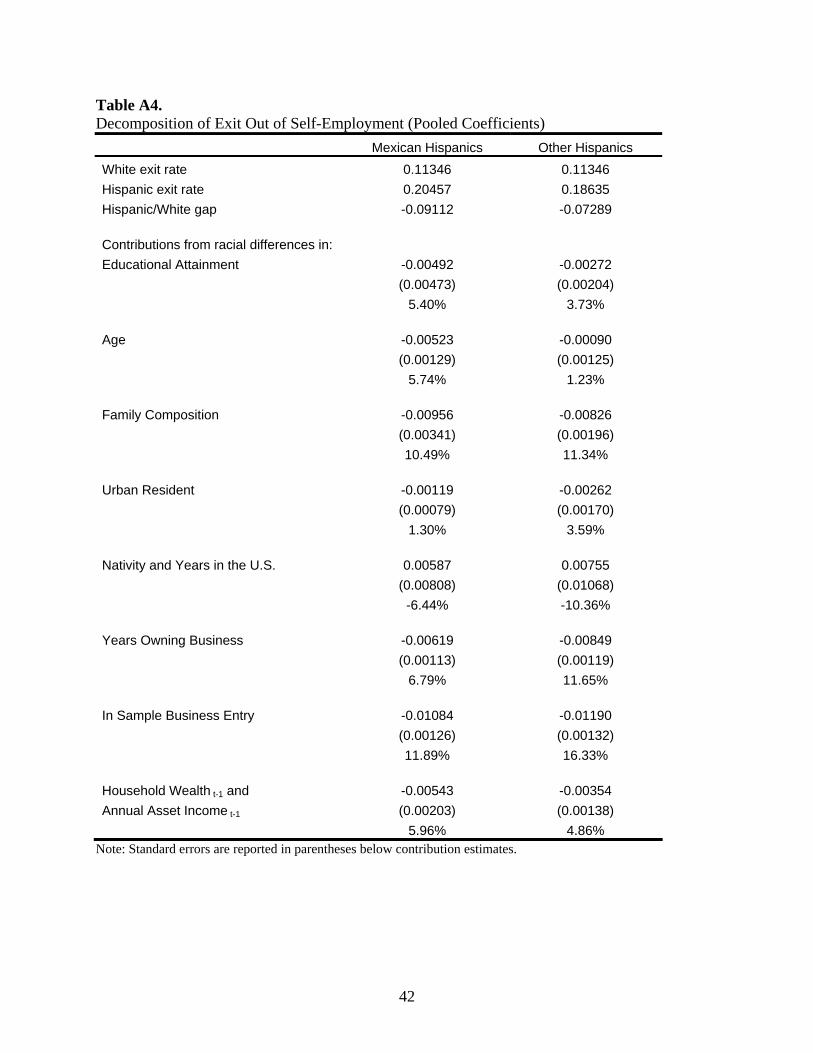
42
Table A4. Decomposition of Exit Out of Self-Employment (Pooled Coefficients) Mexican Hispanics Other Hispanics White exit rate 0.11346 0.11346 Hispanic exit rate 0.20457 0.18635 Hispanic/White gap -0.09112 -0.07289 Contributions from racial differences in: Educational Attainment -0.00492 -0.00272 (0.00473) (0.00204) 5.40% 3.73% Age -0.00523 -0.00090 (0.00129) (0.00125) 5.74% 1.23% Family Composition -0.00956 -0.00826 (0.00341) (0.00196) 10.49% 11.34% Urban Resident -0.00119 -0.00262 (0.00079) (0.00170) 1.30% 3.59% Nativity and Years in the U.S. 0.00587 0.00755 (0.00808) (0.01068) -6.44% -10.36% Years Owning Business -0.00619 -0.00849 (0.00113) (0.00119) 6.79% 11.65% In Sample Business Entry -0.01084 -0.01190 (0.00126) (0.00132) 11.89% 16.33% Household Wealth t-1 and -0.00543 -0.00354 Annual Asset Income t-1 (0.00203) (0.00138) 5.96% 4.86%
Note: Standard errors are reported in parentheses below contribution estimates.