highly polymorphic microsatellites 00graphicraft limited ... - lacerta.de · de novo. we report...
TRANSCRIPT
Molecular Ecology (2000)
9
, 1919–1952
© 2000 Blackwell Science Ltd
Blackwell Science, Ltd
PRIMER NOTES
0000Graphicraft Limited, Hong Kong
Highly polymorphic microsatellites in the lacertid
Gallotia galloti
from the western Canary Islands
M. RICHARD and R . S . THORPE
S.B.S., University of Wales, Bangor, Gwynedd LL57 2UW, UK
Keywords
:
Gallotia galloti
,
Gallotia stehlini
, microsatellite markers
Received 2 March 2000; revision accepted 31 May 2000
Correspondence: R. S. Thorpe. Fax: number: 00 44 1248 37 16 44; E-mail: [email protected]
Microsatellite loci are increasingly used in population geneticand evolutionary studies, see Schlötterer & Pemberton (1994)and Jarne & Lagoda (1996) for reviews. Although primersmay amplify a homologous microsatellite locus in related taxa(Schlötterer
et al
. 1991; Primmer
et al
. 1996) they tend to be specificto species/species groups and have to be isolated
de novo.
We report here the isolation and characterization of five highlypolymorphic microsatellite loci for phylogenetic and popula-tion genetic use in
Gallotia galloti,
which have also been testedon the related species,
G. stehlini
. A
G. galloti
genomic librarywas established in XL-1 Blue MRF
′
(Stratagene) transformedwith
Alu
I/
Hae
III fragments (300–600 bp), ligated into the
Sma
Isite of pUC18 (Pharmacia). A total of 2500 recombinant cloneswere transferred on plates (2
×
TY medium) and replica plated
onto nylon membranes. Colonies were screened with end-labelled oligonucleotides (CA)
n
, (CT)
n
, (GATA)
n
and (GACA)
n
.From 100 selected positive clones, primers were designed for10 loci using
oligo
5.0 (National Biosciences, INC. Plymouth,MN, USA). At least five of the primer sets produce clear,highly polymorphic amplification products of the expectedsize range (Table 1).
Tissue samples come from noninvasive biopsies (tail tipsnaturally autotomized) taken from individuals of
G. galloti
from several geographically distinct localities in Tenerife andfrom
G. stehlini
in Gran Canaria. An average number of 30individuals per population has been analysed. DNA extrac-tions were performed using a standard protocol (Sambrook
et al
. 1989). Radioactive polymerase chain reaction (PCR)amplifications were carried out in 10
µ
L of a mixture contain-ing 15–30 ng of DNA, 200 n
m
of each primer (100 n
m
of oneof them labelled with [
γ
32
P]-dATP), 30
µ
m
of each dNTP,1.5 m
m
MgCl
2
, standard MgCl
2
-free BRL 1
×
reaction buffer(50 m
m
KCl, 20 m
m
Tris-HCl pH 8.4) and 0.4 U of
Taq
DNApolymerase (BRL). Initial denaturing step of 3 min at 94
°
Cwas followed by 35 cycles [94
°
C for 30 s, 55
°
C (53
°
C for locusA348 for 30 s and 72
°
C for 15 sec] and 2 min at 72
°
C. PCRproducts were run through 6% denaturing sequencing poly-acrylamide gels and visualized by autoradiography. Allelelengths were determined by comparison to the original cloneand those previously scored. Observed (
H
O
), and expected (
H
E
)
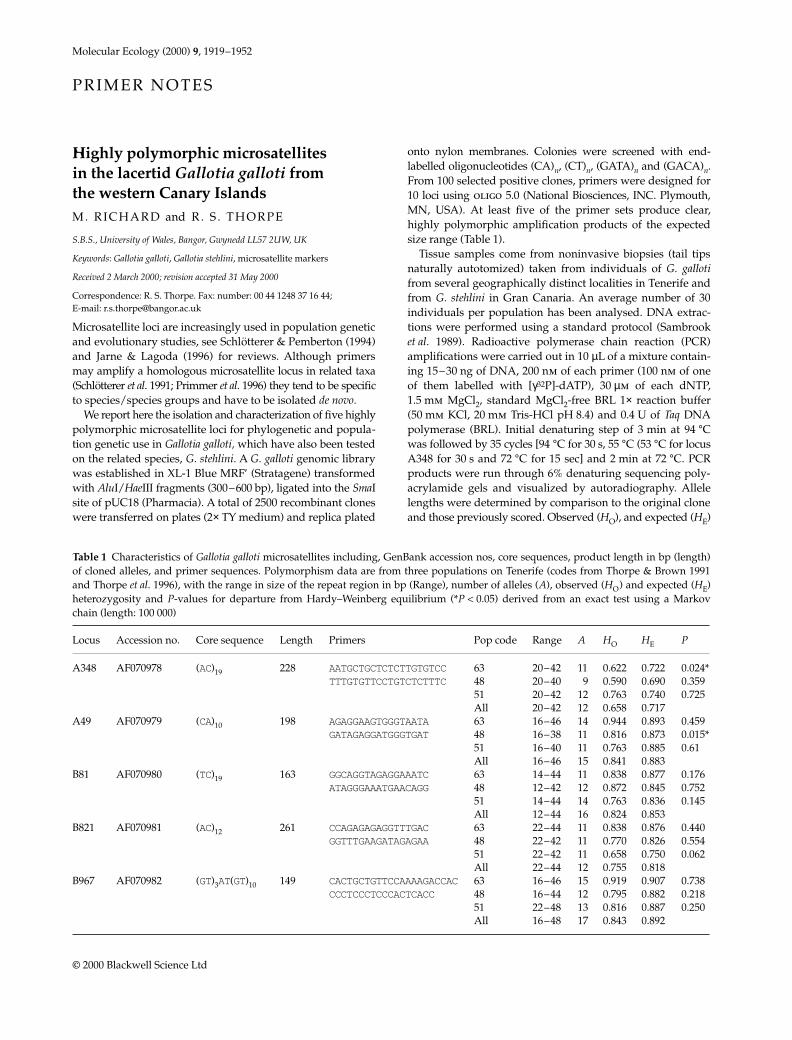
Table 1 Characteristics of Gallotia galloti microsatellites including, GenBank accession nos, core sequences, product length in bp (length)of cloned alleles, and primer sequences. Polymorphism data are from three populations on Tenerife (codes from Thorpe & Brown 1991and Thorpe et al. 1996), with the range in size of the repeat region in bp (Range), number of alleles (A), observed (HO) and expected (HE)heterozygosity and P-values for departure from Hardy–Weinberg equilibrium (*P < 0.05) derived from an exact test using a Markovchain (length: 100 000)
Locus Accession no. Core sequence Length Primers Pop code Range A HO HE P
A348 AF070978 (AC)19 228 AATGCTGCTCTCTTGTGTCC 63 20–42 11 0.622 0.722 0.024*TTTGTGTTCCTGTCTCTTTC 48 20–40 9 0.590 0.690 0.359
51 20–42 12 0.763 0.740 0.725All 20–42 12 0.658 0.717
A49 AF070979 (CA)10 198 AGAGGAAGTGGGTAATA 63 16–46 14 0.944 0.893 0.459GATAGAGGATGGGTGAT 48 16–38 11 0.816 0.873 0.015*
51 16–40 11 0.763 0.885 0.61All 16–46 15 0.841 0.883
B81 AF070980 (TC)19 163 GGCAGGTAGAGGAAATC 63 14–44 11 0.838 0.877 0.176ATAGGGAAATGAACAGG 48 12–42 12 0.872 0.845 0.752
51 14–44 14 0.763 0.836 0.145All 12–44 16 0.824 0.853
B821 AF070981 (AC)12 261 CCAGAGAGAGGTTTGAC 63 22–44 11 0.838 0.876 0.440GGTTTGAAGATAGAGAA 48 22–42 11 0.770 0.826 0.554
51 22–42 11 0.658 0.750 0.062All 22–44 12 0.755 0.818
B967 AF070982 (GT)3AT(GT)10 149 CACTGCTGTTCCAAAAGACCAC63 16–46 15 0.919 0.907 0.738CCCTCCCTCCCACTCACC 48 16–44 12 0.795 0.882 0.218
51 22–48 13 0.816 0.887 0.250All 16–48 17 0.843 0.892
MEC1052.fm Page 1919 Saturday, October 7, 2000 11:46 AM
1920
P R I M E R N O T E S
© 2000 Blackwell Science Ltd,
Molecular Ecology
, 9, 1919–1952
heterozygosity and departure from Hardy–Weinberg equi-librium were calculated (Raymond & Rousset 1995).
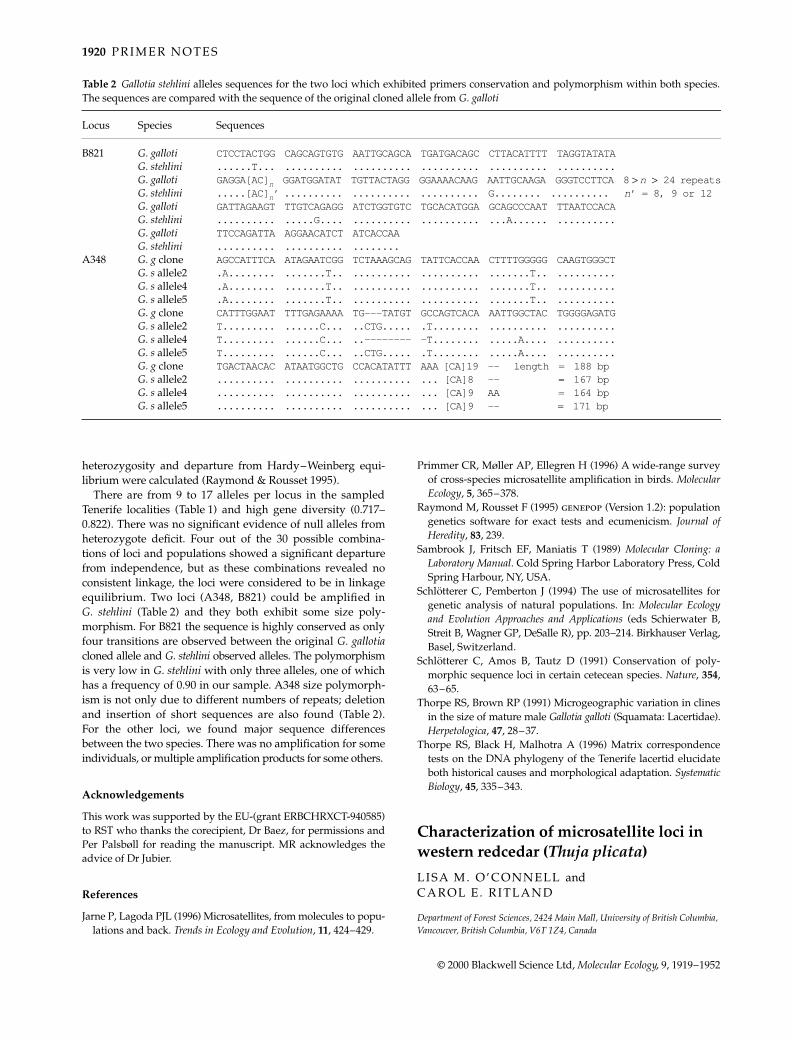
There are from 9 to 17 alleles per locus in the sampledTenerife localities (Table 1) and high gene diversity (0.717–0.822). There was no significant evidence of null alleles fromheterozygote deficit. Four out of the 30 possible combina-tions of loci and populations showed a significant departurefrom independence, but as these combinations revealed noconsistent linkage, the loci were considered to be in linkageequilibrium. Two loci (A348, B821) could be amplified in
G. stehlini
(Table 2) and they both exhibit some size poly-morphism. For B821 the sequence is highly conserved as onlyfour transitions are observed between the original
G. gallotia
cloned allele and
G. stehlini
observed alleles. The polymorphismis very low in
G. stehlini
with only three alleles, one of whichhas a frequency of 0.90 in our sample. A348 size polymorph-ism is not only due to different numbers of repeats; deletionand insertion of short sequences are also found (Table 2).For the other loci, we found major sequence differencesbetween the two species. There was no amplification for someindividuals, or multiple amplification products for some others.
Acknowledgements
This work was supported by the EU-(grant ERBCHRXCT-940585)to RST who thanks the corecipient, Dr Baez, for permissions andPer Palsbøll for reading the manuscript. MR acknowledges theadvice of Dr Jubier.
References
Jarne P, Lagoda PJL (1996) Microsatellites, from molecules to popu-lations and back.
Trends in Ecology and Evolution
,
11
, 424–429.
Primmer CR, Møller AP, Ellegren H (1996) A wide-range surveyof cross-species microsatellite amplification in birds.
MolecularEcology
,
5
, 365–378.Raymond M, Rousset F (1995)
genepop
(Version 1.2): populationgenetics software for exact tests and ecumenicism.
Journal ofHeredity
,
83
, 239.Sambrook J, Fritsch EF, Maniatis T (1989)
Molecular Cloning: aLaboratory Manual
. Cold Spring Harbor Laboratory Press, ColdSpring Harbour, NY, USA.
Schlötterer C, Pemberton J (1994) The use of microsatellites forgenetic analysis of natural populations. In:
Molecular Ecologyand Evolution Approaches and Applications
(eds Schierwater B,Streit B, Wagner GP, DeSalle R), pp. 203–214. Birkhauser Verlag,Basel, Switzerland.
Schlötterer C, Amos B, Tautz D (1991) Conservation of poly-morphic sequence loci in certain cetecean species.
Nature
,
354
,63–65.
Thorpe RS, Brown RP (1991) Microgeographic variation in clinesin the size of mature male
Gallotia galloti
(Squamata: Lacertidae).
Herpetologica
,
47
, 28–37.Thorpe RS, Black H, Malhotra A (1996) Matrix correspondence
tests on the DNA phylogeny of the Tenerife lacertid elucidateboth historical causes and morphological adaptation.
SystematicBiology
,
45
, 335–343.
91120001055PRIMER NOTESPRIMER NOTESPRIMER NOTES0000Graphicraft Limited, Hong Kong
Characterization of microsatellite loci in western redcedar (
Thuja plicata
)
L ISA M. O’CONNELL and CAROL E . RITLAND
Department of Forest Sciences, 2424 Main Mall, University of British Columbia, Vancouver, British Columbia, V6T 1Z4, Canada
Table 2 Gallotia stehlini alleles sequences for the two loci which exhibited primers conservation and polymorphism within both species.The sequences are compared with the sequence of the original cloned allele from G. galloti
Locus Species Sequences
B821 G. galloti CTCCTACTGG CAGCAGTGTG AATTGCAGCA TGATGACAGC CTTACATTTT TAGGTATATAG. stehlini ......T... .......... .......... .......... .......... ..........G. galloti GAGGA[AC]n GGATGGATAT TGTTACTAGG GGAAAACAAG AATTGCAAGA GGGTCCTTCA 8 > n > 24 repeatsG. stehlini .....[AC] n’ .......... .......... .......... G........ .......... n’ = 8, 9 or 12G. galloti GATTAGAAGT TTGTCAGAGG ATCTGGTGTC TGCACATGGA GCAGCCCAAT TTAATCCACAG. stehlini .......... .....G.... .......... .......... ...A...... ..........G. galloti TTCCAGATTA AGGAACATCT ATCACCAAG. stehlini .......... .......... ........
A348 G. g clone AGCCATTTCA ATAGAATCGG TCTAAAGCAG TATTCACCAA CTTTTGGGGG CAAGTGGGCTG. s allele2 .A........ .......T.. .......... .......... .......T.. ..........G. s allele4 .A........ .......T.. .......... .......... .......T.. ..........G. s allele5 .A........ .......T.. .......... .......... .......T.. ..........G. g clone CATTTGGAAT TTTGAGAAAA TG---TATGT GCCAGTCACA AATTGGCTAC TGGGGAGATGG. s allele2 T......... ......C... ..CTG..... .T........ .......... ..........G. s allele4 T......... ......C... ..-------- -T........ .....A.... ..........G. s allele5 T......... ......C... ..CTG..... .T........ .....A.... ..........G. g clone TGACTAACAC ATAATGGCTG CCACATATTT AAA [CA]19 -- length = 188 bpG. s allele2 .......... .......... .......... ... [CA]8 -- = 167 bpG. s allele4 .......... .......... .......... ... [CA]9 AA = 164 bpG. s allele5 .......... .......... .......... ... [CA]9 -- = 171 bp
MEC1052.fm Page 1920 Saturday, October 7, 2000 11:46 AM
P R I M E R N O T E S 1921
© 2000 Blackwell Science Ltd, Molecular Ecology, 9, 1919–1952
Keywords: conifer, Cupressaceae, genetics, microsatellites, redcedar, Thuja plicata
Received 31 March 2000; revision accepted 31 May 2000
Correspondence: L. M. O’Connell. Fax: 1604 8229102; E-mail: [email protected]
Conifers are among the most genetically diverse plants(Hamrick & Godt 1996) and are predominantly outcrossed(Barrett & Eckert 1990). In contrast, western redcedar (Thujaplicata Donn, Cupressaceae) has shown low diversity basedon leaf oil terpenes (von Rudloff & Lapp 1979), isozyme loci(El-Kassaby et al. 1994) and restriction fragment length poly-morphism (RFLP) (Glaubitz et al. 2000). Population outcross-ing rates for western redcedar based on one isozyme locusindicates a mixed mating strategy in this species (El-Kassabyet al. 1994; LM O’Connell et al., unpublished). Thuja plicata isa widespread conifer found along the west coast of NorthAmerica from southern Alaska to northern California, and inthe interior from east-central British Columbia into northernIdaho (Minore 1990). The coastal and interior populationsare geographically isolated from each other and may begenetically differentiated. Estimating outcrossing rates inplants usually requires several polymorphic loci, however, inspecies with low genetic diversity the lack of isozyme poly-morphism prevents us from obtaining accurate estimates of
outcrossing rates with this marker. Because microsatellitesare highly polymorphic, codominant and neutrally selectedmarkers they are well suited for mating system studies. Wedesigned microsatellites in T. plicata to study its populationgenetic structure and mating system.
Microsatellite markers were isolated from redcedar genomicDNA using modifications of biotin-enrichment strategies ofKijas & Fowler (1994). Genomic DNA was digested with HaeIIIand individual fragments were ligated to double strandedoligonucleotide adapters (M28, M29) on their 5′ and 3′ ends,respectively. Adapted fragments were then denatured, hybrid-ized with 5′ biotin labelled (TG)12 and enriched by selectionwith magnetic streptavidin affinity supports (Dynal M-280).Biotin selected genomic fragments were then amplified usingprimer M30 and the resulting mixture was cut with EcoRI andligated into standard cloning vectors (pGEM3Z+, Promega) forpropagation in bacteria. Individual microsatellites containingclones were isolated by colony hybridization with P32-labelled(AC)12 and picked into glycerol cultures for long-term storageand isolation.
We sequenced 96 clones directly from glycerol stocks usingSequiTherm EXCEL™ II Long-Read DNA Sequencing Kits-LC (Epicentre Technologies) on a LiCor 4200. We chose 35clones to design microsatellite primer sets. In each primerpair, one of the primers was tailed (Table 1; Oetting et al. 1995).
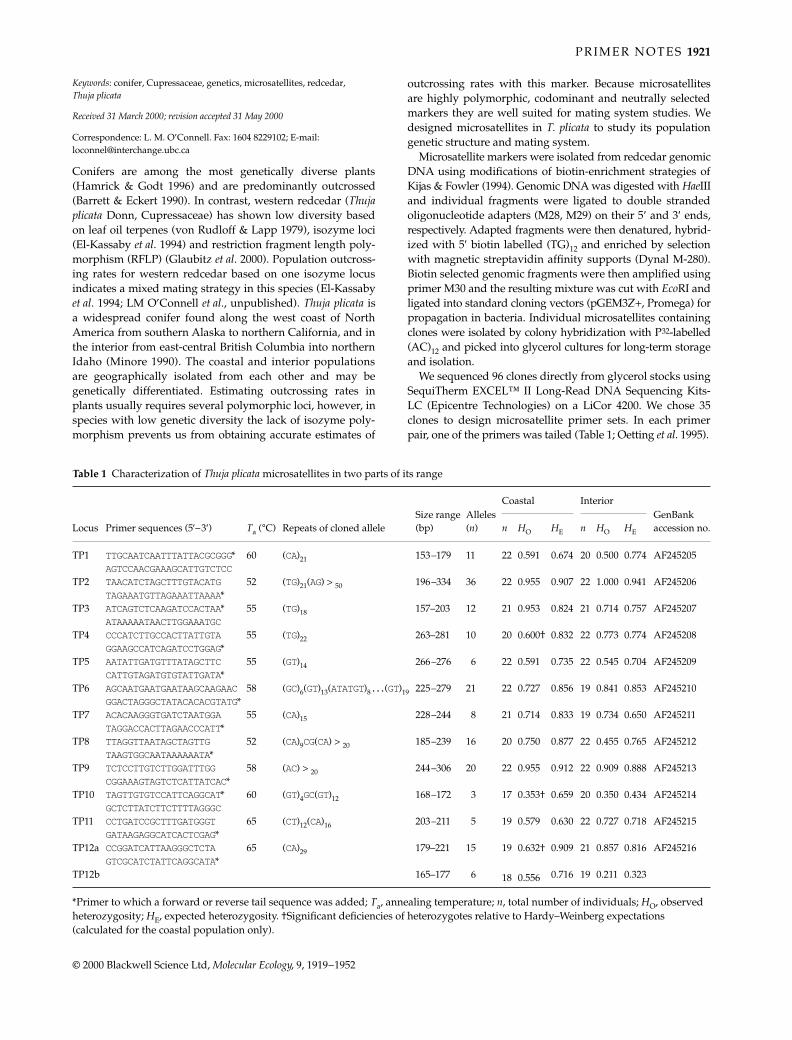
Table 1 Characterization of Thuja plicata microsatellites in two parts of its range
Size range(bp)
Alleles(n)
Coastal InteriorGenBank accession no.Locus Primer sequences (5′–3′) Ta (°C) Repeats of cloned allele n HO HE n HO HE
TP1 TTGCAATCAATTTATTACGCGGG* 60 (CA)21 153–179 11 22 0.591 0.674 20 0.500 0.774 AF245205AGTCCAACGAAAGCATTGTCTCC
TP2 TAACATCTAGCTTTGTACATG 52 (TG)21(AG) > 50 196–334 36 22 0.955 0.907 22 1.000 0.941 AF245206TAGAAATGTTAGAAATTAAAA*
TP3 ATCAGTCTCAAGATCCACTAA* 55 (TG)18 157–203 12 21 0.953 0.824 21 0.714 0.757 AF245207ATAAAAATAACTTGGAAATGC
TP4 CCCATCTTGCCACTTATTGTA 55 (TG)22 263–281 10 20 0.600† 0.832 22 0.773 0.774 AF245208GGAAGCCATCAGATCCTGGAG*
TP5 AATATTGATGTTTATAGCTTC 55 (GT)14 266–276 6 22 0.591 0.735 22 0.545 0.704 AF245209CATTGTAGATGTGTATTGATA*
TP6 AGCAATGAATGAATAAGCAAGAAC58 (GC)6(GT)13(ATATGT)8... (GT)19 225–279 21 22 0.727 0.856 19 0.841 0.853 AF245210GGACTAGGGCTATACACACGTATG*
TP7 ACACAAGGGTGATCTAATGGA 55 (CA)15 228–244 8 21 0.714 0.833 19 0.734 0.650 AF245211TAGGACCACTTAGAACCCATT*
TP8 TTAGGTTAATAGCTAGTTG 52 (CA)9CG(CA) > 20 185–239 16 20 0.750 0.877 22 0.455 0.765 AF245212TAAGTGGCAATAAAAAATA*
TP9 TCTCCTTGTCTTGGATTTGG 58 (AC) > 20 244–306 20 22 0.955 0.912 22 0.909 0.888 AF245213CGGAAAGTAGTCTCATTATCAC*
TP10 TAGTTGTGTCCATTCAGGCAT* 60 (GT)4GC(GT)12 168–172 3 17 0.353† 0.659 20 0.350 0.434 AF245214GCTCTTATCTTCTTTTAGGGC
TP11 CCTGATCCGCTTTGATGGGT 65 (CT)12(CA)16 203–211 5 19 0.579 0.630 22 0.727 0.718 AF245215GATAAGAGGCATCACTCGAG*
TP12a CCGGATCATTAAGGGCTCTA 65 (CA)29 179–221 15 19 0.632† 0.909 21 0.857 0.816 AF245216GTCGCATCTATTCAGGCATA*
TP12b 165–177 6 18 0.556 0.716 19 0.211 0.323
*Primer to which a forward or reverse tail sequence was added; Ta, annealing temperature; n, total number of individuals; HO, observed heterozygosity; HE, expected heterozygosity. †Significant deficiencies of heterozygotes relative to Hardy–Weinberg expectations (calculated for the coastal population only).
MEC1052.fm Page 1921 Saturday, October 7, 2000 11:46 AM
1922 P R I M E R N O T E S
© 2000 Blackwell Science Ltd, Molecular Ecology, 9, 1919–1952
Total DNA from T. plicata was isolated using a CTAB method(Doyle & Doyle 1987). To test for polymorphism we screenedindividuals from one coastal population (south-western BC,n = 22) and two interior populations (south-eastearn BC,n = 11; and northern Idaho, n = 11). The DNA samples for theinterior populations were obtained from J Glaubitz (personalcommunication).
Polymerase chain reaction (PCR) amplifications were per-formed using 10 µL total reaction volumes with 1× Taq buffer(10 mm Tris, 1.5 mm MgCl2, 50 mm KCl, pH 8.3; Roche), 1 pmoldNTP, 0.5 pmol each of forward and reverse primers, 0.5 pmolM13 IRD-labelled primer, 1 Unit Taq DNA Polymerase (Roche),and between 10 and 30 ng of genomic DNA template. Sampleswere amplified on a PTC-100 thermocycler (MJ Research)denaturing at 95 °C for 5 min, followed by 33 cycles of 95 °Cfor 45 s, annealing temperature (Table 1) for 45 s, 72 °C for45 s and ending with one cycle of 72 °C for 5 min. Followingamplification, 3 µL of loading dye (100% formamide, 1 mg/mL pararosaniline basic red 9) was added to each reaction.For final screening the microsatellites were detected on aLI-COR 4200 sequencer with a 7% polyacrylamide (LongRanger™) gels.
Of the 35 microsatellites, 12 amplified interpretable poly-morphic loci. One of these (TP12a,b; Table 1) showed two locifor the primer pair. Observed and expected heterozygositieswere higher for a greater number of loci in the coastal popula-tion than in the interior population. There was a significantdeficiency in heterozygotes at three loci (TP4, TP10 and TP12a)in the coastal population indicating possible null alleles. Thenumber of alleles ranged from 3 to 36 for a total of 189 allelesfor the 13 loci. Together these loci have enough variability tostudy the population genetic structure T. plicata. Loci withhigh number of alleles will be particularly useful for thestudy of the mating system of this species.
Acknowledgements
We thank C. Newton for his assistance in developing the micro-satellites and J. Glaubitz for DNA samples. This work wassupported by a Natural Sciences and Engineering Research Councilof Canada (NSERC) grant to K. Ritland, and NSERC and KillamScholarships to L. M. O’Connell.
References
Barrett SCH, Eckert CG (1990) Variation and evolution of matingsystems in seed plants. In: Biological Approaches and EvolutionaryTrends in Plants (ed. Kawano S), pp. 229–254. Academic Press,London.
Doyle JJ, Doyle JL (1987) A rapid DNA isolation procedure forsmall quantities of fresh leaf tissue. Phytochemical Bulletin, 19,11–15.
El-Kassaby YA, Russell J, Ritland K (1994) Mixed mating in anexperimental population of western red cedar, Thuja plicata.Journal of Heredity, 85, 227–231.
Minore D (1990) Western Redcedar (Thuja plicata Donn ex D. Don).In: Silvics of North America, Vol. 1, Conifers (eds Burns RM,Honkala BH), pp. 590–600. U.S.D.A. Forest Service Agri-culture Handbook 654, Washington, DC.
Glaubitz JC, El-Kassaby YA, Carlson J (2000) Nuclear RFLP ana-
lysis of genetic diversity in western redcedar. Canadian Journalof Forest Research, 30, 1–11.
Hamrick JL, Godt MJW (1996) Effects of life history traits ongenetic diversity in plant species. Philosophical Transactions ofthe Royal Society of London, Series B, 351, 1291–1298.
Kijas JMH, Fowler JCS (1994) Enrichment of microsatellites fromthe citrus genome using biotinylated oligonucleotide sequencesbound to streptavidin-coated magnetic particles. Biotechniques,16, 657–662.
Oetting WS, Lee HK, Flanders DJ et al. (1995) Linkage analysis withmultiplexed short tandem repeat polymorphisms using infraredfluorescence and M13 tailed primers. Genomics, 30, 450–458.
von Rudloff E, Lapp MS (1979) Populational variation in leaf oilterpene composition of western red cedar, Thuja plicata.Canadian Journal of Botany, 57, 476–479.
91120001077PRIMER NOTESPRIMER NOTESPRIMER NOTES113Graphicraft Limited, Hong Kong
Development of microsatellite markers in the guanaco, Lama guanicoe: utility for South American camelidsRONALD J . SARNO,* VICTOR A. DAVID,* WILLIAM L. FRANKLIN,† STEPHEN J . O’BRIEN* and WARREN E. JOHNSON*
*Laboratory of Genomic Diversity, NCI-FCRDC, Frederick, MD, 21702-1201, USA, †Department of Animal Ecology, Iowa State University, Ames, IA 50011, USA
Keywords: artiodactyl, guanaco, microsatellite, South American camelid
Received 2 March 2000; revision accepted 8 June 2000
Correspondence: R. Sarno. Fax: +1 301 846 1909; E-mail: [email protected]
In this paper we describe the development and characteristicsof microsatellite primers designed for the guanaco, Lamaguanicoe, and their utility for the South American camelids.To our knowledge, these are the first microsatellites developedfor a wild South American camelid, although Penedo et al.(1998, 1999) have developed them for the closely relateddomestic Llama, Lama glama.
We isolated microsatellite loci using a modified non-radioactive capture–hybridization method (Refseth et al. 1997).Aliquots (30 µg) of guanaco DNA were digested with Sau3AI,and electrophoresed on a 2% agarose (TAE) gel. The 300–600 bpDNA fragments were excised from the gel and purified usingGeneclean (BIO 101). Oligonucleotides EP-1 (CCCCCACCTCCT-GCCCATCATAAAAAATC, HPLC-purified) and EP-2 (GATC-GATTTTTTATGATGGGCAGGAGGTGGGGG, HPLC-purifiedand 5′-phosphorylated, Life Technologies) were modifiedversions of the prinker sequences described by Muth et al.(1996), which when annealed have an Sau3AI-compatible end.A double-stranded linker was made by combining 5 µL ofEP-1 (500 nm/mL), 5 µL EP-2 (500 nm/mL), 2.5 µL 10 × anneal-ing buffer (100 mm Tris pH 7.5, 1 m NaCl, 10 mm EDTA) and12.5 µL of water, incubating at 65 °C for 10 min, and then roomtemperature for 1 h. The linker concentration was adjusted to1 µg/µL with 12.5 µL of 1 × annealing buffer. For linker addi-tion, 1 µL of linker, 200 ng of the 300–600 bp Sau3AI-digestedDNA, 2 µL 10 × ligase buffer (New England Biolabs) and
MEC1052.fm Page 1922 Saturday, October 7, 2000 11:46 AM
P R I M E R N O T E S 1923
© 2000 Blackwell Science Ltd, Molecular Ecology, 9, 1919–1952
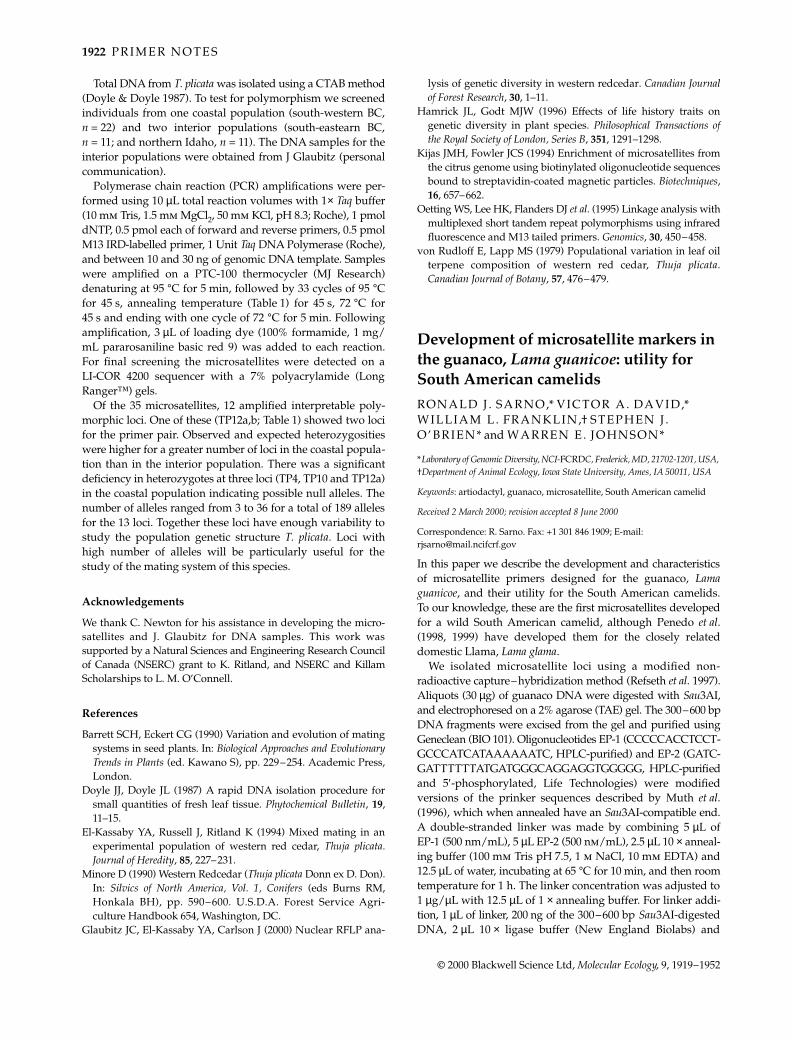
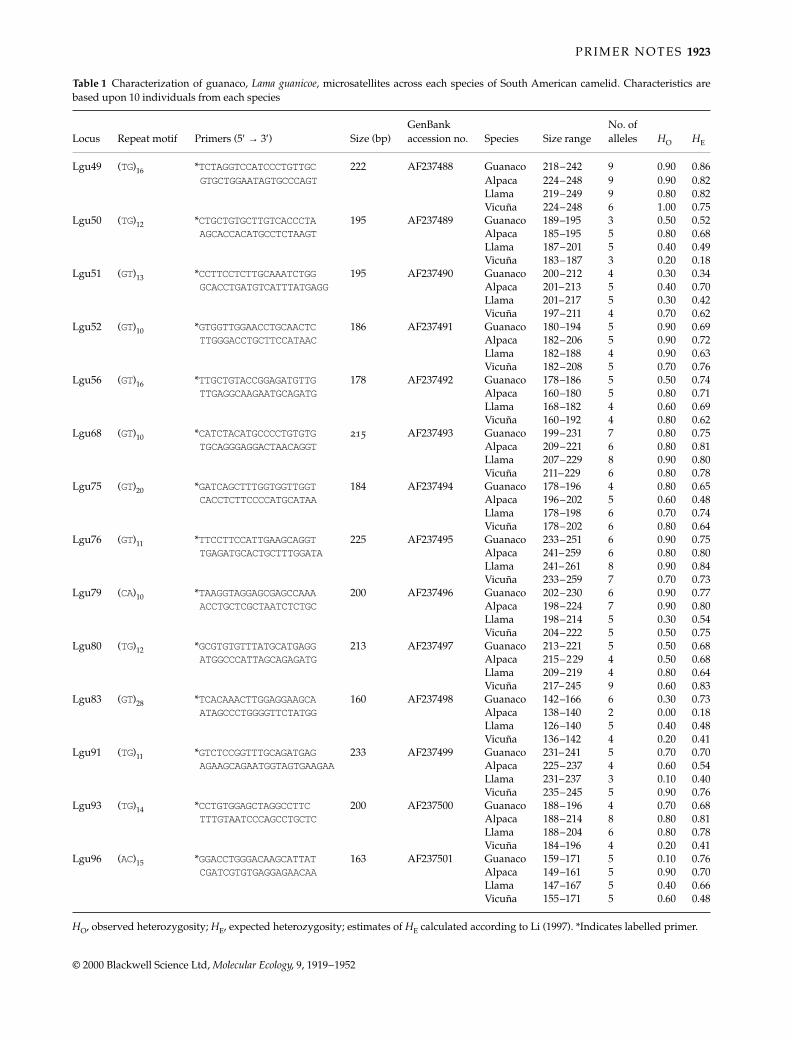
Table 1 Characterization of guanaco, Lama guanicoe, microsatellites across each species of South American camelid. Characteristics arebased upon 10 individuals from each species
Locus Repeat motif Primers (5′ → 3′) Size (bp)GenBank accession no. Species Size range
No. of alleles HO HE
Lgu49 (TG)16 *TCTAGGTCCATCCCTGTTGC 222 AF237488 Guanaco 218–242 9 0.90 0.86GTGCTGGAATAGTGCCCAGT Alpaca 224–248 9 0.90 0.82
Llama 219–249 9 0.80 0.82Vicuña 224–248 6 1.00 0.75
Lgu50 (TG)12 *CTGCTGTGCTTGTCACCCTA 195 AF237489 Guanaco 189–195 3 0.50 0.52AGCACCACATGCCTCTAAGT Alpaca 185–195 5 0.80 0.68
Llama 187–201 5 0.40 0.49Vicuña 183–187 3 0.20 0.18
Lgu51 (GT)13 *CCTTCCTCTTGCAAATCTGG 195 AF237490 Guanaco 200–212 4 0.30 0.34GCACCTGATGTCATTTATGAGG Alpaca 201–213 5 0.40 0.70
Llama 201–217 5 0.30 0.42Vicuña 197–211 4 0.70 0.62
Lgu52 (GT)10 *GTGGTTGGAACCTGCAACTC 186 AF237491 Guanaco 180–194 5 0.90 0.69TTGGGACCTGCTTCCATAAC Alpaca 182–206 5 0.90 0.72
Llama 182–188 4 0.90 0.63Vicuña 182–208 5 0.70 0.76
Lgu56 (GT)16 *TTGCTGTACCGGAGATGTTG 178 AF237492 Guanaco 178–186 5 0.50 0.74TTGAGGCAAGAATGCAGATG Alpaca 160–180 5 0.80 0.71
Llama 168–182 4 0.60 0.69Vicuña 160–192 4 0.80 0.62
Lgu68 (GT)10 *CATCTACATGCCCCTGTGTG 215 AF237493 Guanaco 199–231 7 0.80 0.75TGCAGGGAGGACTAACAGGT Alpaca 209–221 6 0.80 0.81
Llama 207–229 8 0.90 0.80Vicuña 211–229 6 0.80 0.78
Lgu75 (GT)20 *GATCAGCTTTGGTGGTTGGT 184 AF237494 Guanaco 178–196 4 0.80 0.65CACCTCTTCCCCATGCATAA Alpaca 196–202 5 0.60 0.48
Llama 178–198 6 0.70 0.74Vicuña 178–202 6 0.80 0.64
Lgu76 (GT)11 *TTCCTTCCATTGAAGCAGGT 225 AF237495 Guanaco 233–251 6 0.90 0.75TGAGATGCACTGCTTTGGATA Alpaca 241–259 6 0.80 0.80
Llama 241–261 8 0.90 0.84Vicuña 233–259 7 0.70 0.73
Lgu79 (CA)10 *TAAGGTAGGAGCGAGCCAAA 200 AF237496 Guanaco 202–230 6 0.90 0.77ACCTGCTCGCTAATCTCTGC Alpaca 198–224 7 0.90 0.80
Llama 198–214 5 0.30 0.54Vicuña 204–222 5 0.50 0.75
Lgu80 (TG)12 *GCGTGTGTTTATGCATGAGG 213 AF237497 Guanaco 213–221 5 0.50 0.68ATGGCCCATTAGCAGAGATG Alpaca 215–229 4 0.50 0.68
Llama 209–219 4 0.80 0.64Vicuña 217–245 9 0.60 0.83
Lgu83 (GT)28 *TCACAAACTTGGAGGAAGCA 160 AF237498 Guanaco 142–166 6 0.30 0.73ATAGCCCTGGGGTTCTATGG Alpaca 138–140 2 0.00 0.18
Llama 126–140 5 0.40 0.48Vicuña 136–142 4 0.20 0.41
Lgu91 (TG)11 *GTCTCCGGTTTGCAGATGAG 233 AF237499 Guanaco 231–241 5 0.70 0.70AGAAGCAGAATGGTAGTGAAGAA Alpaca 225–237 4 0.60 0.54
Llama 231–237 3 0.10 0.40Vicuña 235–245 5 0.90 0.76
Lgu93 (TG)14 *CCTGTGGAGCTAGGCCTTC 200 AF237500 Guanaco 188–196 4 0.70 0.68TTTGTAATCCCAGCCTGCTC Alpaca 188–214 8 0.80 0.81
Llama 188–204 6 0.80 0.78Vicuña 184–196 4 0.20 0.41
Lgu96 (AC)15 *GGACCTGGGACAAGCATTAT 163 AF237501 Guanaco 159–171 5 0.10 0.76CGATCGTGTGAGGAGAACAA Alpaca 149–161 5 0.90 0.70
Llama 147–167 5 0.40 0.66Vicuña 155–171 5 0.60 0.48
HO, observed heterozygosity; HE, expected heterozygosity; estimates of HE calculated according to Li (1997). *Indicates labelled primer.
MEC1052.fm Page 1923 Saturday, October 7, 2000 11:46 AM
1924 P R I M E R N O T E S
© 2000 Blackwell Science Ltd, Molecular Ecology, 9, 1919–1952
1 µL of ligase (New England Biolabs, 400 units/mL) were com-bined in a 20 µL reaction, and incubated for 1 h at 37 °C andfor 10 min at 65 °C. Excess linker was removed with two washesin a Microcon 100 (Amicon), and the volume brought to 15 µLwith water. A 1 µL aliquot of the linkered DNA was polymerasechain reaction (PCR)-amplified using primer EP-3 (CCCCCAC-CTCCTGCCCATCAT, HPLC-purified, Life Technologies). PCRwas performed in a Perkin Elmer 9700 thermal cycler with1.2 U Ampli Taq DNA polymerase (Perkin Elmer), 1 × PerkinElmer PCR buffer (10 mm Tris pH 8.3, 50 mm KCl), adjustedto 2 mm MgCl2 final, 2 µm EP-3, 250 µm each dNTP in a total of30 µL, at 95 °C for 5 min, 30 cycles at 95 °C for 1 min, 65 °C for30 s, 72 °C for 2 min, and a final extension at 72 °C for 2 min.
The biotinylated capture probe was annealed to the linkeredDNA by combining 10 µL of linkered DNA, 1 µL (0.1 µg/µL)5′-biotinylated capture probe (5′ biotin (CA)15, HPLC-purified,Life Technologies) and 89 µL of 6 × SSC (0.9 m NaCl, 0.09 msodium citrate pH 7.0), heating to 95 °C for 10 min, coolingon ice for 30 s, then incubating for 5 min at room temperature.Washed magnetic beads (Dyna beads M-280 streptavidan,Dynal Corps) as previously described by Refseth et al. (1997),were added to the DNA and incubated for 15 min at roomtemperature, washed three times with 200 µL of 2 × SSC atroom temperature, and three times with 200 µL of 1 × SSC at65 °C for 3 min. The DNA was eluted from the beads into50 µL water, incubated for 5 min at 95 °C, washed three timesin a Microcon 100, and concentrated to 15 µL. PCR amplifica-tion of DNA was performed with the EP-3 primer. The PCRproduct was run on a 3% TAE gel and the desired size frag-ment was recovered by the Geneclean procedure.
The final PCR product was ligated directly into the pT7 BlueT-Vector (Novagen Inc.) following the manufacturer’s direc-tions. Following transformation, white colonies were selectedand plasmid DNA was isolated using a REAL prep 96 plasmidkit (Qiagen). DNA was sequenced using PE Applied BiosystemsBig Dye Terminator Kit on an ABI 377 DNA sequencer.
Fourteen microsatellites were amplified in 10 individualsof the four South American camelid species (Table 1). All lociwere polymorphic and the number of alleles per locus wasvariable (Table 1). The guanaco demonstrated the highestaverage heterozygosity (0.69), followed by the alpaca, Lamapacos (0.68), llama (0.64) and vicuña, Vicugna vicugna (0.62).The domestic llama and alpaca exhibited an average of 5.5and 5.4 alleles per locus, respectively, while the wild guanacoand vicuña exhibited 5.3 and 5.2 alleles per locus, respect-ively. On the basis of this initial screening, these 14 guanacomicrosatellites appear to be a promising tool to study camelidpopulation genetics and phylogeography, which could ulti-mately influence camelid conservation and management.
Acknowledgements
We thank the Chilean National Forestry and Park Service(CONAF), along with Mike Bank, Dr Russ Hunter DVM and DrNicholas Soto DVM, for assistance collecting guanaco bloodsamples in southern Chile. Dr Cristian Bonacic DVM, BenitoGonzalez and Dr Beatriz Zapata DVM provided vicuña bloodsamples from northern Chile. Dr Brad Smith DVM providedllama and alpaca samples from the Oregon State University
captive herd. Eduardo Eizirik, Carla Ferris, Amanda Garfinkel,Jae-Heup Kim, Jan Martenson, Marilyn Raymond-Menotti, andAmy Snyder provided technical assistance. Permits to importblood samples were issued by the USDA and US Fish & WildlifeService to R.J.S.
References
Li WH (1997) Molecular Evolution. Sinauer Press, Massachusetts.Muth J, Muller O, Berka J, Leonard JY, Karger BL (1996) DNA
sequence analysis of Prinker-modified restriction fragmentsafter collection from capillary electrophoresis with replaceablematrices. Journal of ChromotographyA, 744, 303–310.
Penedo MCT, Caetano AR, Cordova KI (1998) Microsatellite markersfor South American camelids. Animal Genetics, 29, 398–413.
Penedo MCT, Caetano AR, Cordova KI (1999) Eight microsatel-lite markers for South American camelids. Animal Genetics,30, 161–168.
Refseth UH, Fangan BM, Jakobsen KS (1997) Hybridizationcapture of microsatellites directly from genomic DNA. Electro-phoresis, 18, 1519–1523.
91120001071PRIMER NOTESPRIMER NOTESPRIMER NOTES100Graphicraft Limited, Hong Kong
Isolation and characterization of microsatellite loci in the ascidian Ciona intestinalis (L.)GABRIELE PROCACCINI , MICHELE PISCHETOLA and ROBERTO DI LAURO
Stazione Zoologica ‘A. Dohrn’, Villa Comunale, 80121 Napoli, Italy
Keywords: ascidians, Ciona intestinalis, microsatellites, tunicates
Received 12 May 2000; revision accepted 8 June 2000
Correspondence: G. Procaccini. Fax: +39 081 984201; E-mail: [email protected]
In polluted areas, ascidians can take up and accumulate metalsand toxic substances, acting as active filters for purification andcleaning of coastal waters and becoming important pollutionbio-indicators (Papadopolou & Kanias 1977; Naranjo et al.1996). The ascidian Ciona intestinalis forms relatively densepopulations, with a filtration rate of 0.3 cm3 individuals/second,characterized by cyclic reduction and re-colonization of preferentialareas (Riisgard et al. 1998). The study of the genetic structureof C. intestinalis in distinct populations could help in understandingthe tempo and modo of colonization of new environments andof re-colonization of particular sites. Such results could shedlight on the effective dispersal of the planktonic larval stagein this important benthic organism and give important insightsfor the management of the coastline. The high rates of mutationcommonly observed at microsatellite loci make this class ofmarker suitable for addressing the above objectives.
High-molecular-weight DNA from Ciona sperms wasprepared with Proteinase K buffer and purified using chloro-form:isoamyl alcohol (24:1) following a standard protocol(Sambrook et al. 1989). DNA from five C. intestinalis individualswas pooled to increase the number of gene copies to be scored
MEC1052.fm Page 1924 Saturday, October 7, 2000 11:46 AM
P R I M E R N O T E S 1925
© 2000 Blackwell Science Ltd, Molecular Ecology, 9, 1919–1952
during hybridization. A size-selected genomic library (200–400 bp fragments) was prepared in pBluescript SK+ vector(Stratagene) from the pooled DNA (Sambrook et al. 1989). Formicrosatellite identification, the protocol described by Procaccini& Waycott (1998) was utilized. Pooled C. intestinalis DNAwas digested to completion with Sau3A restriction enzymeand aliquots were dot-blotted on Hybond N+ membrane(Amersham). Dot blots were hybridized with 17 syntheticoligos, end-labelled with γ-32P, and the four oligos giving thestrongest signals (TG/AC, AGC/TCG, ACC/TGG, AGG/TCC) were chosen for screening almost 25 000 colonies. Onlythe colonies giving the strongest signals were manuallysequenced using the dideoxy chain termination method(Sanger et al. 1977). Of the total number of sequenced clones,only five were chosen for designing primers on the flankingregions of repeated sequences. PCR reactions were optimizedin a total volume of 10 µL to a final concentration of 50 mmKCl, 10 mm Tris–HCl pH 9.0, 200 µm of each dNTP, 2 mm MgCl2,1.7 pmol of each primer, 0.5 units of Taq DNA polymerase(Perkin Elmer Cetus) and 10–20 ng of template DNA. Thirty-fiveamplification cycles were run in a Perkin Elmer model 9700thermal cycler with the following cycling conditions: 15 sdenaturation (94 °C), 30 s annealing (see Table 1) and 30 sextension (72 °C). Results were obtained by running γ-32P-labelledPCR products (forward primers were labelled) on 6% poly-acrylamide gels and visually scoring bands on autoradiographs.
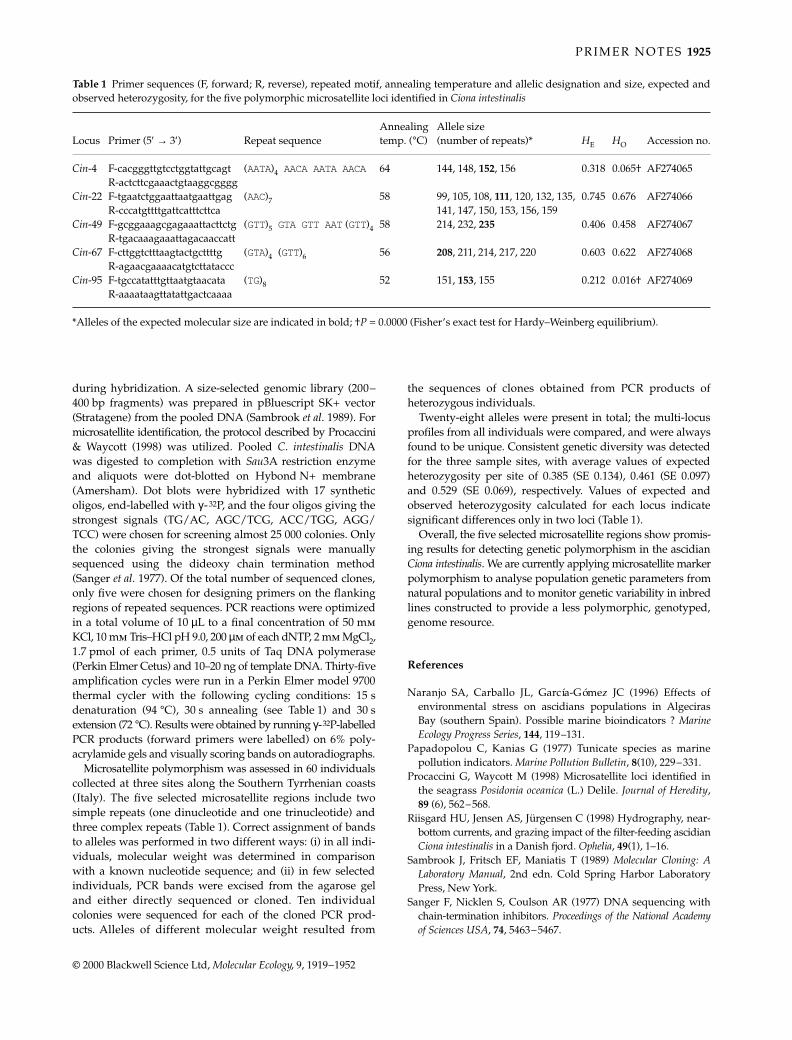
Microsatellite polymorphism was assessed in 60 individualscollected at three sites along the Southern Tyrrhenian coasts(Italy). The five selected microsatellite regions include twosimple repeats (one dinucleotide and one trinucleotide) andthree complex repeats (Table 1). Correct assignment of bandsto alleles was performed in two different ways: (i) in all indi-viduals, molecular weight was determined in comparisonwith a known nucleotide sequence; and (ii) in few selectedindividuals, PCR bands were excised from the agarose geland either directly sequenced or cloned. Ten individualcolonies were sequenced for each of the cloned PCR prod-ucts. Alleles of different molecular weight resulted from
the sequences of clones obtained from PCR products ofheterozygous individuals.
Twenty-eight alleles were present in total; the multi-locusprofiles from all individuals were compared, and were alwaysfound to be unique. Consistent genetic diversity was detectedfor the three sample sites, with average values of expectedheterozygosity per site of 0.385 (SE 0.134), 0.461 (SE 0.097)and 0.529 (SE 0.069), respectively. Values of expected andobserved heterozygosity calculated for each locus indicatesignificant differences only in two loci (Table 1).
Overall, the five selected microsatellite regions show promis-ing results for detecting genetic polymorphism in the ascidianCiona intestinalis. We are currently applying microsatellite markerpolymorphism to analyse population genetic parameters fromnatural populations and to monitor genetic variability in inbredlines constructed to provide a less polymorphic, genotyped,genome resource.
References
Naranjo SA, Carballo JL, García-Gómez JC (1996) Effects ofenvironmental stress on ascidians populations in AlgecirasBay (southern Spain). Possible marine bioindicators ? MarineEcology Progress Series, 144, 119–131.
Papadopolou C, Kanias G (1977) Tunicate species as marinepollution indicators. Marine Pollution Bulletin, 8(10), 229–331.
Procaccini G, Waycott M (1998) Microsatellite loci identified inthe seagrass Posidonia oceanica (L.) Delile. Journal of Heredity,89 (6), 562–568.
Riisgard HU, Jensen AS, Jürgensen C (1998) Hydrography, near-bottom currents, and grazing impact of the filter-feeding ascidianCiona intestinalis in a Danish fjord. Ophelia, 49(1), 1–16.
Sambrook J, Fritsch EF, Maniatis T (1989) Molecular Cloning: ALaboratory Manual, 2nd edn. Cold Spring Harbor LaboratoryPress, New York.
Sanger F, Nicklen S, Coulson AR (1977) DNA sequencing withchain-termination inhibitors. Proceedings of the National Academyof Sciences USA, 74, 5463–5467.
91120001073PRIMER NOTESPRIMER NOTESPRIMER NOTES0000Graphicraft Limited, Hong Kong
Table 1 Primer sequences (F, forward; R, reverse), repeated motif, annealing temperature and allelic designation and size, expected andobserved heterozygosity, for the five polymorphic microsatellite loci identified in Ciona intestinalis
Locus Primer (5′ → 3′) Repeat sequenceAnnealing temp. (°C)
Allele size (number of repeats)* HE HO Accession no.
Cin-4 F-cacgggttgtcctggtattgcagt (AATA)4 AACA AATA AACA 64 144, 148, 152, 156 0.318 0.065† AF274065R-actcttcgaaactgtaaggcgggg
Cin-22 F-tgaatctggaattaatgaattgag (AAC)7 58 99, 105, 108, 111, 120, 132, 135, 0.745 0.676 AF274066R-cccatgttttgattcatttcttca 141, 147, 150, 153, 156, 159
Cin-49 F-gcggaaagcgagaaattacttctg (GTT)5 GTA GTT AAT (GTT)4 58 214, 232, 235 0.406 0.458 AF274067R-tgacaaagaaattagacaaccatt
Cin-67 F-cttggtctttaagtactgcttttg (GTA)4 (GTT)6 56 208, 211, 214, 217, 220 0.603 0.622 AF274068R-agaacgaaaacatgtcttataccc
Cin-95 F-tgccatatttgttaatgtaacata (TG)8 52 151, 153, 155 0.212 0.016† AF274069R-aaaataagttatattgactcaaaa
*Alleles of the expected molecular size are indicated in bold; †P = 0.0000 (Fisher’s exact test for Hardy–Weinberg equilibrium).
MEC1052.fm Page 1925 Saturday, October 7, 2000 11:46 AM
1926 P R I M E R N O T E S
© 2000 Blackwell Science Ltd, Molecular Ecology, 9, 1919–1952
Isolation and characterization of microsatellite loci from the tapeworm Schistocephalus solidusTHOMAS BINZ,*†‡ THORSTEN B . H. REUSCH,‡ CLAUS WEDEKIND,†§ LUKAS SCHÄRER,† JEREMY M. STERNBERG¶ and MANFRED MILINSKI†‡
*The Natural History Museum, Bernastrasse 15, 3005 Bern, Switzerland, †Abteilung Verhaltensökologie, Zoologisches Institut Universität Bern, Wohlenstrasse 50a, 3032 Hinterkappelen, Switzerland, ‡Max-Planck-Institut für Limnologie, Abteilung Evolutionsökologie, August-Thienemann-Str.2, 24306 Plön, Germany, § Institute of Cell, Animal and Population Biology, University of Edinburgh, Kings Buildings, West Mains Road, Edinburgh EH9 3JT, UK, ¶Department of Zoology, University of Aberdeen, Aberdeen AB24 2TZ, UK
Keywords: cestode, hermaphrodite, microsatellite, paternity, Schistocephalus solidus, sex allocation
Received 8 May 2000; revision accepted 9 June 2000
Correspondence: Thomas Binz. Tel.: +41 31 350 73 20; fax: +41 31 350 74 99; E-mail: [email protected]
Schistocephalus solidus, a pseudophyllidean cestode parasite,is an outstanding model organism for studying the evolution ofhermaphroditism, as it is a simultaneous hermaphrodite thatappears to reproduce by self- and cross-fertilization. Learningmore about, for example, sex allocation, selfing and out-crossingstrategies or decisions in the hermaphrodite’s dilemma requiresdetermination of selfing and out-crossing rates and the extentof sperm competition (Jarne & Charlesworth 1993). A necessaryprerequisite for such studies are high-resolution, co-dominantmolecular markers that allow assignment of paternity andthe assessment of levels of heterozygosity. In this report,we describe the isolation of five microsatellite DNA loci inSchistocephalus solidus and the development of appropriate PCRprimers. These are, to our knowledge, the first microsatelliteprimers for any cestode species.
Aliquots (75 µg) of genomic DNA from three individualsfrom Bochum (Germany) were isolated using the GenomicTip Kit from Qiagen (Basel, Switzerland). The DNA was sentto the Genetic Identification Services (GIS, http://www.genetic-
id-services.com; Chatsworth, California, USA), to develop twoenriched microsatellite genomic libraries, one containing insertswith (CT)n repeats and the other containing (CA)n repeats. Theinserts (cut with HindIII) were cloned into dephosphorylatedpUC18 cut with HindIII. The libraries (stored as plasmid DNA)were used to transform E. coli DH5α competent cells. Individualbacterial clones were picked, suspended in 20 µL sterile waterand the insert DNA was amplified by polymerase chain reaction(PCR) using primers complementary to the regions flankingthe polycloning site (5′-ACGACGTTGTAAAACGACGGCCAG-3′ and 5′-TTCACACAGGAAACAGCTATGACC-3′, respect-ively). PCR products were isolated for sequencing using‘Qiaquick’ PCR purification columns (Qiagen), and eluted into30 µL of distilled water. Insert DNA samples were subjectto dideoxy sequencing using the ABI BigDye ready reactionkit (PE Biosystems) and the M13 universal forward (5′-TGTAAAACGACGGCCAGT-3′) and reverse (5′-ACAGGA-AACAGCTATGACC-3′) primers. Sequencing reactions wereresolved on urea–5% polyacrlamide gels and the gels wereanalysed on an ABI 377 DNA Sequencer (PE Biosystems).Primers for amplification of the microsatellite loci were designedwith the help of primer 3 (Rozen & Skaletzky 1996–1997).Genomic DNA of two individuals each from various geo-graphical locations including Loirston (near Aberdeen, UK),Belfast (UK), Perth (UK), Inverness (UK) and 15 individualsfrom Bochum (Germany) was isolated as follows: approxim-ately 1 mg of tissue was suspended in 100 µL solution contain-ing 10 mm Tris, 2 mm EDTA, 0.01% Triton X-100 and 20 µgProteinase K (Sigma). The solution was incubated for 2 h andthen heated at 95 °C for 10 min. PCR reactions were carriedout in a 10 µL volume containing: 1 µL of extract, 10 mm Tris–HCl (pH 8.3), 50 mm KCl, 0.5 U of Amplitaq Gold DNA poly-merase (PE Biosystems), 2.5 mm MgCl2, 200 µm dNTPs, 0.5 µmof locus-specific fluorescent-labelled forward primer (fluore-scent dyes were 6-FAM and HEX) and non-labelled reverseprimer (see Table 1). PCR cycling parameters were the following:10 min at 95 °C, 30 cycles of 95 °C for 30 s, 15 s at 57 °C and75 s at 72 °C, followed by a final step of 72 °C for 7 min.Fluorescent PCR fragments were separated on a 5% poly-acrylamide gel and visualized on an ABI 373 DNA Sequencer.
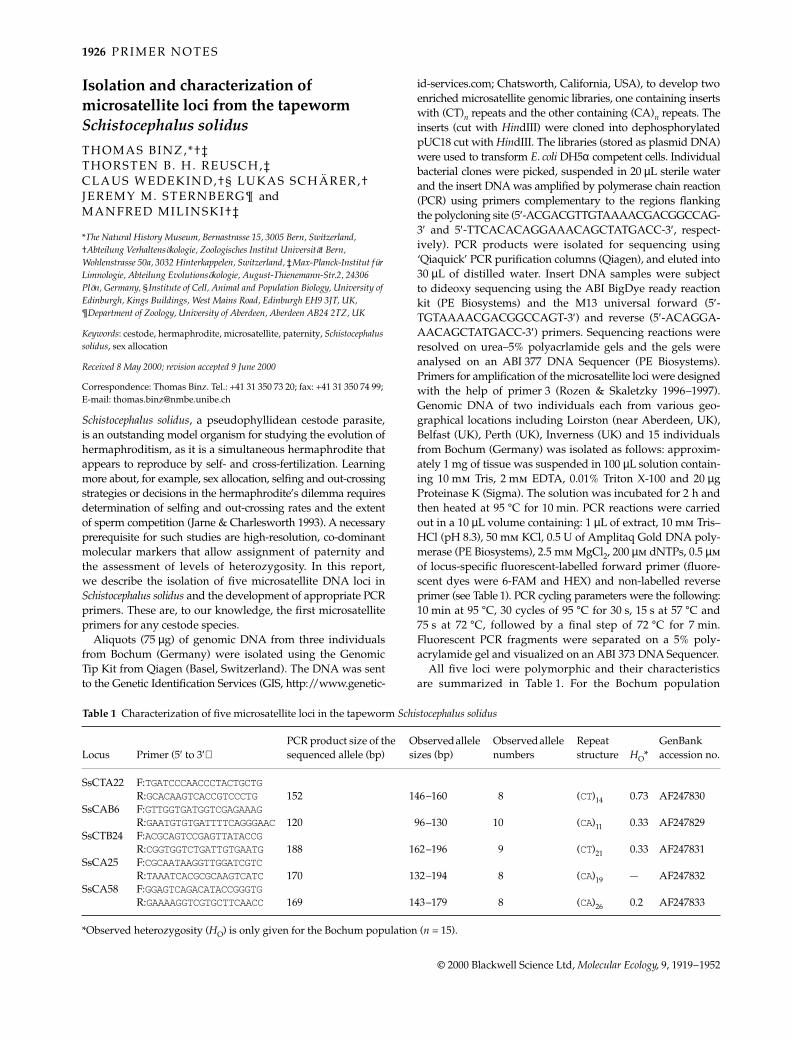
All five loci were polymorphic and their characteristicsare summarized in Table 1. For the Bochum population
Table 1 Characterization of five microsatellite loci in the tapeworm Schistocephalus solidus
Locus Primer (5′ to 3′)PCR product size of the sequenced allele (bp)
Observed allele sizes (bp)
Observed allele numbers
Repeat structure HO*
GenBank accession no.
SsCTA22 F:TGATCCCAACCCTACTGCTGR:GCACAAGTCACCGTCCCTG 152 146–160 8 (CT)14 0.73 AF247830
SsCAB6 F:GTTGGTGATGGTCGAGAAAGR:GAATGTGTGATTTTCAGGGAAC120 96–130 10 (CA)11 0.33 AF247829
SsCTB24 F:ACGCAGTCCGAGTTATACCGR:CGGTGGTCTGATTGTGAATG 188 162–196 9 (CT)21 0.33 AF247831
SsCA25 F:CGCAATAAGGTTGGATCGTCR:TAAATCACGCGCAAGTCATC 170 132–194 8 (CA)19 — AF247832
SsCA58 F:GGAGTCAGACATACCGGGTGR:GAAAAGGTCGTGCTTCAACC 169 143–179 8 (CA)26 0.2 AF247833
*Observed heterozygosity (HO) is only given for the Bochum population (n = 15).
MEC1052.fm Page 1926 Saturday, October 7, 2000 11:46 AM
P R I M E R N O T E S 1927
© 2000 Blackwell Science Ltd, Molecular Ecology, 9, 1919–1952
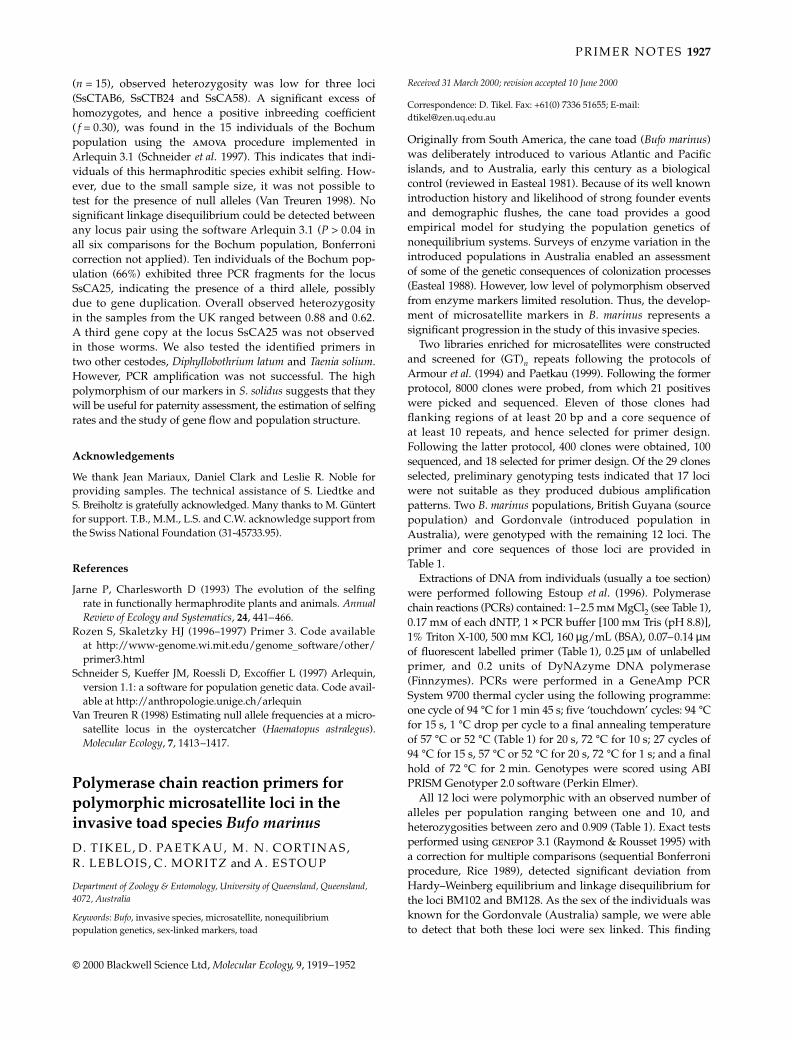
(n = 15), observed heterozygosity was low for three loci(SsCTAB6, SsCTB24 and SsCA58). A significant excess ofhomozygotes, and hence a positive inbreeding coefficient( f = 0.30), was found in the 15 individuals of the Bochumpopulation using the amova procedure implemented inArlequin 3.1 (Schneider et al. 1997). This indicates that indi-viduals of this hermaphroditic species exhibit selfing. How-ever, due to the small sample size, it was not possible totest for the presence of null alleles (Van Treuren 1998). Nosignificant linkage disequilibrium could be detected betweenany locus pair using the software Arlequin 3.1 (P > 0.04 inall six comparisons for the Bochum population, Bonferronicorrection not applied). Ten individuals of the Bochum pop-ulation (66%) exhibited three PCR fragments for the locusSsCA25, indicating the presence of a third allele, possiblydue to gene duplication. Overall observed heterozygosityin the samples from the UK ranged between 0.88 and 0.62.A third gene copy at the locus SsCA25 was not observedin those worms. We also tested the identified primers intwo other cestodes, Diphyllobothrium latum and Taenia solium.However, PCR amplification was not successful. The highpolymorphism of our markers in S. solidus suggests that theywill be useful for paternity assessment, the estimation of selfingrates and the study of gene flow and population structure.
Acknowledgements
We thank Jean Mariaux, Daniel Clark and Leslie R. Noble forproviding samples. The technical assistance of S. Liedtke andS. Breiholtz is gratefully acknowledged. Many thanks to M. Güntertfor support. T.B., M.M., L.S. and C.W. acknowledge support fromthe Swiss National Foundation (31-45733.95).
References
Jarne P, Charlesworth D (1993) The evolution of the selfingrate in functionally hermaphrodite plants and animals. AnnualReview of Ecology and Systematics, 24, 441–466.
Rozen S, Skaletzky HJ (1996–1997) Primer 3. Code availableat http://www-genome.wi.mit.edu/genome_software/other/primer3.html
Schneider S, Kueffer JM, Roessli D, Excoffier L (1997) Arlequin,version 1.1: a software for population genetic data. Code avail-able at http://anthropologie.unige.ch/arlequin
Van Treuren R (1998) Estimating null allele frequencies at a micro-satellite locus in the oystercatcher (Haematopus astralegus).Molecular Ecology, 7, 1413–1417.
91120001074PRIMER NOTESPRIMER NOTESPRIMER NOTES000000Graphicraft Limited, Hong Kong
Polymerase chain reaction primers for polymorphic microsatellite loci in the invasive toad species Bufo marinusD. TIKEL, D. PAETKAU, M. N. CORTINAS, R . LEBLOIS , C . MORITZ and A. ESTOUP
Department of Zoology & Entomology, University of Queensland, Queensland, 4072, Australia
Keywords: Bufo, invasive species, microsatellite, nonequilibrium population genetics, sex-linked markers, toad
Received 31 March 2000; revision accepted 10 June 2000
Correspondence: D. Tikel. Fax: +61(0) 7336 51655; E-mail: [email protected]
Originally from South America, the cane toad (Bufo marinus)was deliberately introduced to various Atlantic and Pacificislands, and to Australia, early this century as a biologicalcontrol (reviewed in Easteal 1981). Because of its well knownintroduction history and likelihood of strong founder eventsand demographic flushes, the cane toad provides a goodempirical model for studying the population genetics ofnonequilibrium systems. Surveys of enzyme variation in theintroduced populations in Australia enabled an assessmentof some of the genetic consequences of colonization processes(Easteal 1988). However, low level of polymorphism observedfrom enzyme markers limited resolution. Thus, the develop-ment of microsatellite markers in B. marinus represents asignificant progression in the study of this invasive species.
Two libraries enriched for microsatellites were constructedand screened for (GT)n repeats following the protocols ofArmour et al. (1994) and Paetkau (1999). Following the formerprotocol, 8000 clones were probed, from which 21 positiveswere picked and sequenced. Eleven of those clones hadflanking regions of at least 20 bp and a core sequence ofat least 10 repeats, and hence selected for primer design.Following the latter protocol, 400 clones were obtained, 100sequenced, and 18 selected for primer design. Of the 29 clonesselected, preliminary genotyping tests indicated that 17 lociwere not suitable as they produced dubious amplificationpatterns. Two B. marinus populations, British Guyana (sourcepopulation) and Gordonvale (introduced population inAustralia), were genotyped with the remaining 12 loci. Theprimer and core sequences of those loci are provided inTable 1.
Extractions of DNA from individuals (usually a toe section)were performed following Estoup et al. (1996). Polymerasechain reactions (PCRs) contained: 1–2.5 mm MgCl2 (see Table 1),0.17 mm of each dNTP, 1 × PCR buffer [100 mm Tris (pH 8.8)],1% Triton X-100, 500 mm KCl, 160 µg/mL (BSA), 0.07–0.14 µmof fluorescent labelled primer (Table 1), 0.25 µm of unlabelledprimer, and 0.2 units of DyNAzyme DNA polymerase(Finnzymes). PCRs were performed in a GeneAmp PCRSystem 9700 thermal cycler using the following programme:one cycle of 94 °C for 1 min 45 s; five ‘touchdown’ cycles: 94 °Cfor 15 s, 1 °C drop per cycle to a final annealing temperatureof 57 °C or 52 °C (Table 1) for 20 s, 72 °C for 10 s; 27 cycles of94 °C for 15 s, 57 °C or 52 °C for 20 s, 72 °C for 1 s; and a finalhold of 72 °C for 2 min. Genotypes were scored using ABIPRISM Genotyper 2.0 software (Perkin Elmer).
All 12 loci were polymorphic with an observed number ofalleles per population ranging between one and 10, andheterozygosities between zero and 0.909 (Table 1). Exact testsperformed using genepop 3.1 (Raymond & Rousset 1995) witha correction for multiple comparisons (sequential Bonferroniprocedure, Rice 1989), detected significant deviation fromHardy–Weinberg equilibrium and linkage disequilibrium forthe loci BM102 and BM128. As the sex of the individuals wasknown for the Gordonvale (Australia) sample, we were ableto detect that both these loci were sex linked. This finding
MEC1052.fm Page 1927 Saturday, October 7, 2000 11:46 AM
1928 P R I M E R N O T E S
© 2000 Blackwell Science Ltd, Molecular Ecology, 9, 1919–1952
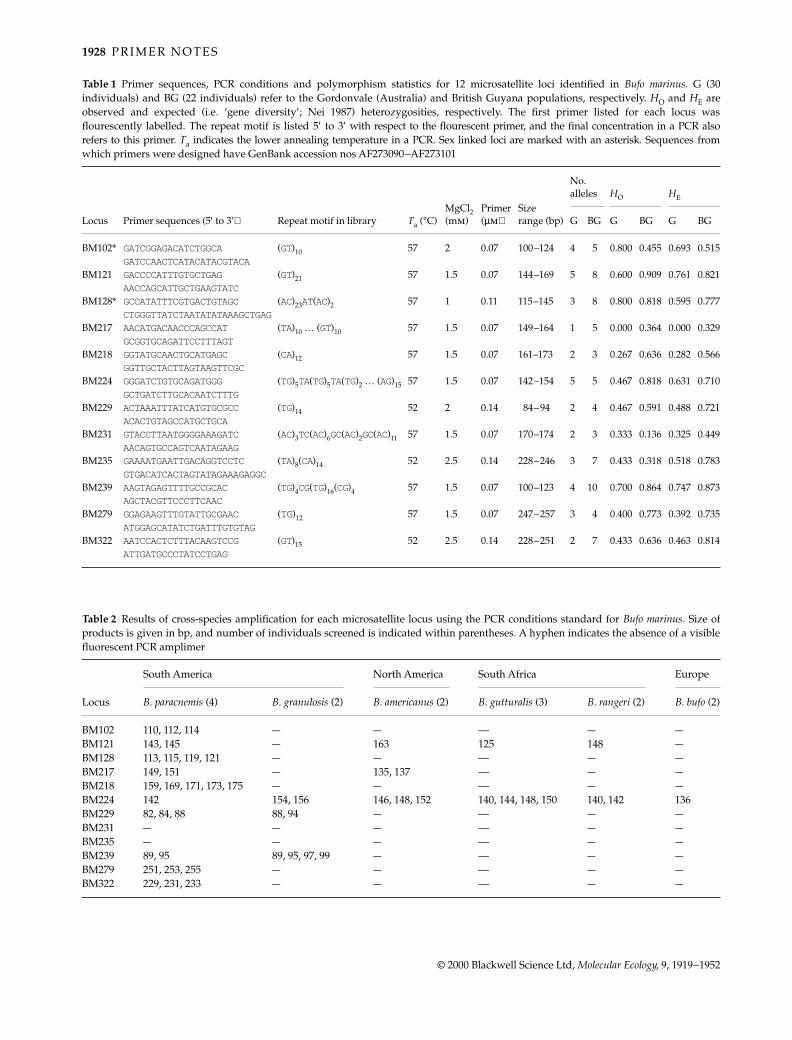
Table 1 Primer sequences, PCR conditions and polymorphism statistics for 12 microsatellite loci identified in Bufo marinus. G (30individuals) and BG (22 individuals) refer to the Gordonvale (Australia) and British Guyana populations, respectively. HO and HE areobserved and expected (i.e. ‘gene diversity’; Nei 1987) heterozygosities, respectively. The first primer listed for each locus wasflourescently labelled. The repeat motif is listed 5′ to 3′ with respect to the flourescent primer, and the final concentration in a PCR alsorefers to this primer. Ta indicates the lower annealing temperature in a PCR. Sex linked loci are marked with an asterisk. Sequences fromwhich primers were designed have GenBank accession nos AF273090–AF273101
Locus Primer sequences (5′ to 3′) Repeat motif in library Ta (°C)MgCl2 (mm)
Primer (µm)
Size range (bp)
No. alleles HO HE
G BG G BG G BG
BM102* GATCGGAGACATCTGGCA (GT)10 57 2 0.07 100–124 4 5 0.800 0.455 0.693 0.515GATCCAACTCATACATACGTACA
BM121 GACCCCATTTGTGCTGAG (GT)21 57 1.5 0.07 144–169 5 8 0.600 0.909 0.761 0.821AACCAGCATTGCTGAAGTATC
BM128* GCCATATTTCGTGACTGTAGC (AC)23AT(AC)2 57 1 0.11 115–145 3 8 0.800 0.818 0.595 0.777CTGGGTTATCTAATATATAAAGCTGAG
BM217 AACATGACAACCCAGCCAT (TA)10 … (GT)10 57 1.5 0.07 149–164 1 5 0.000 0.364 0.000 0.329GCGGTGCAGATTCCTTTAGT
BM218 GGTATGCAACTGCATGAGC (CA)12 57 1.5 0.07 161–173 2 3 0.267 0.636 0.282 0.566GGTTGCTACTTAGTAAGTTCGC
BM224 GGGATCTGTGCAGATGGG (TG)5TA(TG)5TA(TG)2 … (AG)15 57 1.5 0.07 142–154 5 5 0.467 0.818 0.631 0.710GCTGATCTTGCACAATCTTTG
BM229 ACTAAATTTATCATGTGCGCC (TG)14 52 2 0.14 84–94 2 4 0.467 0.591 0.488 0.721ACACTGTAGCCATGCTGCA
BM231 GTACCTTAATGGGGAAAGATC (AC)3TC(AC)6GC(AC)2GC(AC)11 57 1.5 0.07 170–174 2 3 0.333 0.136 0.325 0.449AACAGTGCCAGTCAATAGAAG
BM235 GAAAATGAATTGACAGGTCCTC (TA)8(CA)14 52 2.5 0.14 228–246 3 7 0.433 0.318 0.518 0.783GTGACATCACTAGTATAGAAAGAGGC
BM239 AAGTAGAGTTTTGCCGCAC (TG)4CG(TG)16(CG)4 57 1.5 0.07 100–123 4 10 0.700 0.864 0.747 0.873AGCTACGTTCCCTTCAAC
BM279 GGAGAAGTTTGTATTGCGAAC (TG)12 57 1.5 0.07 247–257 3 4 0.400 0.773 0.392 0.735ATGGAGCATATCTGATTTGTGTAG
BM322 AATCCACTCTTTACAAGTCCG (GT)15 52 2.5 0.14 228–251 2 7 0.433 0.636 0.463 0.814ATTGATGCCCTATCCTGAG
Table 2 Results of cross-species amplification for each microsatellite locus using the PCR conditions standard for Bufo marinus. Size ofproducts is given in bp, and number of individuals screened is indicated within parentheses. A hyphen indicates the absence of a visiblefluorescent PCR amplimer
Locus
South America North America South Africa Europe
B. paracnemis (4) B. granulosis (2) B. americanus (2) B. gutturalis (3) B. rangeri (2) B. bufo (2)
BM102 110, 112, 114 — — — — —BM121 143, 145 — 163 125 148 —BM128 113, 115, 119, 121 — — — — —BM217 149, 151 — 135, 137 — — —BM218 159, 169, 171, 173, 175 — — — — —BM224 142 154, 156 146, 148, 152 140, 144, 148, 150 140, 142 136BM229 82, 84, 88 88, 94 — — — —BM231 — — — — — —BM235 — — — — — —BM239 89, 95 89, 95, 97, 99 — — — —BM279 251, 253, 255 — — — — —BM322 229, 231, 233 — — — — —
MEC1052.fm Page 1928 Saturday, October 7, 2000 11:46 AM
P R I M E R N O T E S 1929
© 2000 Blackwell Science Ltd, Molecular Ecology, 9, 1919–1952
was confirmed with additional tests using other populations(unpublished data).
Using PCR conditions for B. marinus, the 12 loci weretested for interspecies priming for an additional six Bufospecies (Table 2). BM224 was the only locus that providedan easily interpretable pattern for all species, and showedpolymorphism within most species. The closely related speciesB. paracnemis (Slade & Moritz 1998) amplified successfullywith nine of the 12 microsatellites and showed polymorphismat most loci. Other species could not be amplified for mostloci which is not unexpected considering their more distantrelationship to B. marinus and the deep evolutionary historyof the genus Bufo (Goebel et al. 1999). These results are inagreement with the low cross-species priming found at eightmicrosatellites cloned from B. calamita (Rowe et al. 1997).
Acknowledgements
For specimens, we thank: M. Cunningham, A. Krupa, N. Gemmell,B. Waldman, A. Goebel, R. Crambie, V. & B. Olson. This projectwas supported by a Special Investigator Award from the AustralianResearch Council, a grant from the Institut National de RechercheAgronomique, and the Australian Department of Industry Scienceand Technology.
References
Armour JAL, Neuman R, Gobert S, Jefreys AJ (1994) Isolation ofhuman simple repeat loci by hybridization selection. HumanMolecular Genetics, 3 (4), 599–605.
Easteal S (1981) The history of introductions of Bufo marinus(Amphibia: anura); a natural experiment in evolution. BiologicalJournal of the Linnean Society, 16, 93–113.
Easteal S (1988) Range expansion and its genetic consequences inpopulations of the giant toad, Bufo marinus. Evolutionary Biology,23, 49–84.
Estoup A, Largiader CR, Perrot E, Chourrout D (1996) Rapidone-tube DNA extraction for reliable PCR detection of fishpolymorphic markers and transgenes. Molecular MarineBiology and Biotechnology, 5, 295–298.
Goebel AM, Donnelly JM, Atz ME (1999) PCR primers andamplification methods for 12s ribosomal DNA, the controlregion, cytochrome oxidase I, and cytochrome b in bufonidsand other frogs, and an overview of PCR primers which haveamplified DNA in amphibians successfully. Molecular Phylo-genetics and Evolution, 11 (1), 163–199.
Nei M (1987) Molecular Evolutionary Genetics. Columbia UniversityPress, New York.
Paetkau D (1999) Microsatellites obtained using strand exten-sion: an enrichment protocol. Biotechniques, 26 (4), 690–697.
Raymond M, Rousset F (1995) genepop (Version 1.2): populationgenetics software for exact tests and ecumenicism. Journal ofHeredity, 86, 248–249.
Rice WR (1989) Analyzing tables of statistical tests. Evolution, 43,223–225.
Rowe G, Beebee TJC, Burke T (1997) PCR primers for polymorphicmicrosatellite loci in the anuran amphibian Bufo calamita.Molecular Ecology, 6, 401–402.
Slade RW, Moritz C (1998) Phylogeography of Bufo marinus fromits natural and introduced ranges. Proceedings of the Royal Societyof London B, 265, 769–777.
91120001076PRIMER NOTESPRIMER NOTESPRIMER NOTES000000Graphicraft Limited, Hong Kong
Microsatellite markers for coral trout (Plectropomus laevis) and red throat emperor (Lethrinus miniatus) and their utility in other species of reef fishLYNNE VAN HERWERDEN,*† JOHN BENZIE,* LESA PEPLOW* and CAMPBELL DAVIES‡
*Australian Institute of Marine Science, Queensland, Australia, ‡CRC Reef, James Cook University, Queensland, Australia
Keywords: Lethrinus miniatus, lethrinids, lutjanids, microsatellites, Plectropomus laevis, serranids
Received 21 March 2000; revision received 11 May 2000; accepted 10 June 2000
Correspondence: Lynne van Herwerden. †Present address: Department of Marine Biology, James Cook University, Queensland 4811, Australia. Fax: 61–747–251570; E-mail: [email protected]
There is concern about sustainable management of stocks ofreef fish, particularly as we do not fully understand popu-lation dynamics and response to harvest of many species(Mapstone et al. 1997). Evidence to date suggests that mostharvested species have restricted movement ranges (Davies1995). Genetic diversity may be reduced if particular popu-lations are over-harvested. To effectively manage fishing inthe Great Barrier Reef (GBR), managers require informationon the stock structure and gene flow among populations ofharvested species along the GBR. This will allow managersto balance conservation of biodiversity with sustainableexploitation. Genetic markers are useful in determining stockstructure of fish and assessing gene flow among populations(e.g. Wright & Benzen 1994). The lack of suitable geneticmarkers is an impediment to our understanding of the popu-lation structure of tropical reef fish.
Microsatellite markers are powerful tools for detectingintra- and interpopulation genetic diversity. Here we reportthe development of microsatellite markers to assess geneticdiversity for populations of Plectropomus laevis and Lethrinusminiatus on the GBR. These species represent two majorfamilies of harvested reef fish. Tests against several other taxawere undertaken to ascertain the utility of these markers todifferentiate between populations in a wide range of reef fish.
Partial genomic libraries were constructed using genomicDNA extracted from liver/muscle tissue of P. laevis andL. miniatus, by standard methods (Sambrook et al. 1989). DNAwas digested with AluI and HaeIII, fragments were separatedby gel electrophoresis and fragments of 400–1000 nucleotideswere excised (Rassman et al. 1991), purified and ligated intopuc18/SmaI BAP (Invitrogen).
Nearly 3000 clones were screened using a T4 polynucleotidekinase — [γ33P]-ATP end-labelled cocktail of di-, tri- and tetra-nucleotide oligonucleotides [(GT)15, (GA)15, (GAA)10, (CCA)10,(CGG)10, (CACG)7, (CCTT)7 and (GATA)7] as described by Glenn(1996). Fifty coral trout and 112 red throat emperor cloneswere sequenced (DyeDeoxy terminator cycle sequencing kits,Perkin Elmer/ABI). Vector sequences were eliminated andprimer pairs manually designed and optimized for 22 markersof each species according to principles described by Ehrlich(1989) (Table 1). Eight of the 22 red throat emperor markers,
MEC1052.fm Page 1929 Saturday, October 7, 2000 11:46 AM

1930 P R I M E R N O T E S
© 2000 Blackwell Science Ltd, Molecular Ecology, 9, 1919–1952
as well as the coral trout marker bst2–33, were tested on 2–7individuals each of 12 species (Table 2). One hundred andfive individuals of the target species, red throat emperor(L. miniatus) were also screened with the nine microsatellite
markers (Table 2). The remaining 35 markers are reportedelsewhere (van Herwerden et al. 2000). For visualization theforward primer of each pair was 5′ labelled with eitherFAM, TET or HEX dyes (Perkin Elmer/ABI). Polymerase
Table 1 Microsatellite markers developed from Plectropomus laevis and Lethrinus miniatus, optimized PCR conditions, size of amplifiedfragment obtained from library clones and GenBank accession nos
Locus Repeat motif Primers 5′ > 3′ Ta °C Mg mm Size (bp)GenBank accession no.
Bst 2.33 (TG)35(CG)12 F TAATGCCCACAAACCTGCTGG 60 2.5 230 AF249850R ATGTTCCACAACGCCTGACAAACC
19RTE (AC)18 F CAGCCAGGTTCCTCTTCATCC 58 1.5 109 AF260998R TGTACTCTATCAATGACAGACG
23RTE (GTAT)3ATGT(GT)8 F AGAGTTTCAAACACCCACAGG 58 2.5 300 AF260999R TCTGTGAAATATGAGCGGTGG
67RTE (GT)15 F TGGCTTTGAACAGATCCAGC 56 2.5 270 AF261001R TTTGGGCTATTAATGCCTTGG
90RTE (TG)17TATGAG(TG)4 F ATGCTGTCCACTTCCTCCAGC 62 1.5 190 AF261002R TTTCTCAAACTCCTGCCCTTCC
58RTE (TG)9AGTG F TGCCAGTGTGTGGGCAGTAGG 52 1.5 130 AF261008R TTCGACAAATTGTTTACTAATTTGC
80RTE (GT)23 F AATGTGATTTTGTATTTACATGC 54 2.5 195 AF261011R TCGTTTTCTTTCCCAGCTGG
95TGRTE (TG)13 F TCTGTATTTGGTATTCCAACG 54 1.5 120 AF261013R TCAGTGTCAGAGAGACAGC
37RTE (TC)4TGGT(TG)9CC(TG)3 F AGCATGCACACTCATGCTGTCC 64 2.5 170 AF261016R ACAGCACCAGTCAGTGCGAGG
Ta, annealing temperature.
Table 2 Plectropomus laevis and Lethrinus miniatus microsatellite markers used to screen Plectropomus species, Serranids, Lethrinids,Lutjanids and a Labrid. Number of alleles detected for each locus in number of individuals for which PCR products were obtained (inparentheses) of each species. ‘M’ indicates that products were monomorphic. ‘F’ indicates that PCR failed repeatedly. HO is the observedand HE the expected heterozygosity obtained when 105 individuals were screened from a single population of L. miniatus
19 23 37 58 67 80 90 95TGGroup Species Bst 2.33 RTE RTE RTE RTE RTE RTE RTE RTE
Plectropomus P. laevis (bst) 6(3) 3(3) 2(3) 2(3) 2(3) 3(2) F(3) 3(3) 3(3)P. laevis (fbt) 10(5) 3(5) 5(5) 2(5) 2(5) 1(1) F(5) 3(5) 3(5)P. leopardus 9(5) 4(4) 5(4) 3(4) 4(6) 2(3) 2(3) 2(5) 4(5)Variola louti 7(4) M(4) F(4) M(4) 2(4) 2(1) F(4) 3(4) M(4)
Lutjanids L. sebae 7(4) 2(2) 3(2) 2(4) 2(4) 1(1) F(4) 4(4) 3(4)(other) L. carponotatus 5(5) 2(3) 4(5) M(5) 3(5) 1(1) F(5) 3(5) 3(5)
Lethrinids L. miniatus HO = 0.93 HO = 0.91* HO = 0.90 HO = 0.58 HO = 0.73* HO = 0.50* HO = 0.85* HO = 0.83 HO = 0.72HE = 0.90 HE = 0.94 HE = 0.86 HE = 0.64 HE = 0.76 HE = 0.82 HE = 0.89 HE = 0.75 HE = 0.71
L. atkinsoni 6(4) 7(4) 3(4) 4(3) 2(4) 2(2) 3(4) 5(4) 3(4)L.erythracanthus 3(2) 3(3) 4(3) F(3) 2(3) 4(2) 2(3) 3(3) 2(3)L. nebulosus 2(2) 4(2) 4(2) 3(2) M(2) 2(1) 2(2) 2(2) 1(2)
Serranids Epinephelus polyphykelodon
3(5) 7(5) 6(5) 4(5) M(5) 4(3) 2(1) 6(4) 4(5)
Cephalopholis argus 2(4) 2(1) 3(4) 2(4) 2(4) F(4) 1(1) 5(4) 3(4)
Labrid Cheilinus undulatus 2(3) 4(3) 3(2) 5(3) 2(3) 4(2) 2(2) 2(3) 1(2)
Heterozygosities were calculated using Levene’s correction, as implemented in genepop version 3.1 (Raymond & Rousset (1999) Institut des Sciences de l’Evolution. Universite de Montpellier, France). *Loci that had heterozygote deficiencies (P ≤ 0.05). RTE, Red throat emperor.
MEC1052.fm Page 1930 Saturday, October 7, 2000 11:46 AM
P R I M E R N O T E S 1931
© 2000 Blackwell Science Ltd, Molecular Ecology, 9, 1919–1952
chain recation (PCR) products were sized with internal lanestandards (TAMRA, Perkin Elmer/ABI). PCR reactions werecarried out using 50–100 ng genomic DNA, 10 pmol of eachprimer, 200 µm of each dNTP, Taq Buffer (containing 2.5 mmTrisCl, 5 mm KCl (NH4)2SO4 and 1.5 mm MgCl2, pH 8.7), upto 4 mm MgCl2 and 0.75 units of Taq DNA Polymerase(Qiagen) in 10 µL volumes. Amplifications were performedusing touchdown PCR (Don et al. 1991) in 9600 Perkin Elmer/ABI thermal cyclers (Table 1). PCR products were screenedon 2% agarose gels containing 10 and 25 ng of standard todetermine dilution factors required for detection of 1 ng ofeach PCR product.
Heterozygosities were determined for all loci used to screenthe population of red throat emperor, but not for cross-speciestests, where sample sizes were small (Table 2). The coral troutlocus (bst2–33) was polymorphic in all 13 species tested.Of the eight red throat emperor loci tested, five were poly-morphic in 11 or 12 out of 13 species tested (Table 2). The ninemarkers described here can be used to investigate populationstructure of Serranids, Lethrinids, Lutjanids and a Labrid(Cheilinus undulatus). These findings indicate the potentialutility of microsatellite markers developed for one species,both for other species within the genus and species of distantgenera.
Acknowledgements
Tissue samples provided by the ELF Project funded by theCollaborative Research Centre Reef, Fisheries Research andDevelopment Council (FRDC) and Great Barrier Reef MarinePark Authority. Project supported by a FRDC grant (nos 98–131).Thanks to Carolyn Smith, Beth Ballment, Gary Carlos and RobinStewart. This is contribution 1011 from Australian Institute ofMarine Science.
References
Davies CR (1995) Patterns of movement of three species of large reeffish on the Great Barrier Reef. PhD Thesis. Department of MarineBiology, James Cook University, Queensland.
Don RH, Cox PT, Wainwright BJ, Baker K, Mattick JS (1991)‘Touchdown’ PCR to circumvent spurious priming duringgene amplification. Nucleic Acids Res, 19, 4008.
Ehrlich HA (ed.) (1989) PCR Technology. Principles and applicationsfor DNA amplification. Stockton Press, New York.
Glenn TC (1996) Microsatellite Manual, Version 6. Laboratory ofMolecular Systematics, Smithsonian Institution, Washington DC.
Mapstone BD, Davies CR, Robertson J (1997) The effects of linefishing on the Great Barrier Reef: Available evidence and futuredirections. Proceedings of the 2nd State of the GBR Conference:Science, use and management. Volume 1. James Cook University,Townsville.
Rassmann K, Schlotterer C, Tautz D (1991) Isolation of simple-sequence loci for use in polymerase chain reaction-based DNAfingerprinting. Electrophoresis, 12, 113–118.
Sambrook J, Fritch EF, Maniatis T (1989) Molecular Cloning: aLaboratory Manual. 2nd edn. Cold Spring Harbor LaboratoryPress, New York.
van Herwerden L, Benzie J, Peplow L, Davies C (2000) Micro-satellite markers for the Serranid, Plectropomus laevis and the
Lutjanid, Lethrinus miniatus. Institute of Marine Science Reportno. 32, 20pp.
Wright JM, Benzen P (1994) Microsatellites: genetic markersfor the future. In: Reviews in Fish Biology and Fisheries (edsCarvalho GR, Pitcher TJ), pp. 384–388. Chapman & Hall, London.
91120001072PRIMER NOTESPRIMER NOTESPRIMER NOTES0000Graphicraft Limited, Hong Kong
Polymorphic microsatellite loci of Oryzomys palustris, the marsh rice rat, in South Florida detected by silver stainingYUNQIU WANG,* COLIN R. HUGHES,* EDWIN A. GINES-CANDELARIA† and MICHAEL S . GAINES*
*Department of Biology, University of Miami, PO Box 249118, Coral Gables, FL 33124, USA, †School of Natural Sciences, Miami Dade Community College, Wolfson Campus, Miami, FL 33132, USA
Keywords: microsatellite, Oryzomys palustris, polymorphic, primers, silver stain
Received 12 May 2000; revision accepted 14 June 2000
Correspondence: Yunqiu Wang. Fax: +1 305 284 3039; E-mail: [email protected]
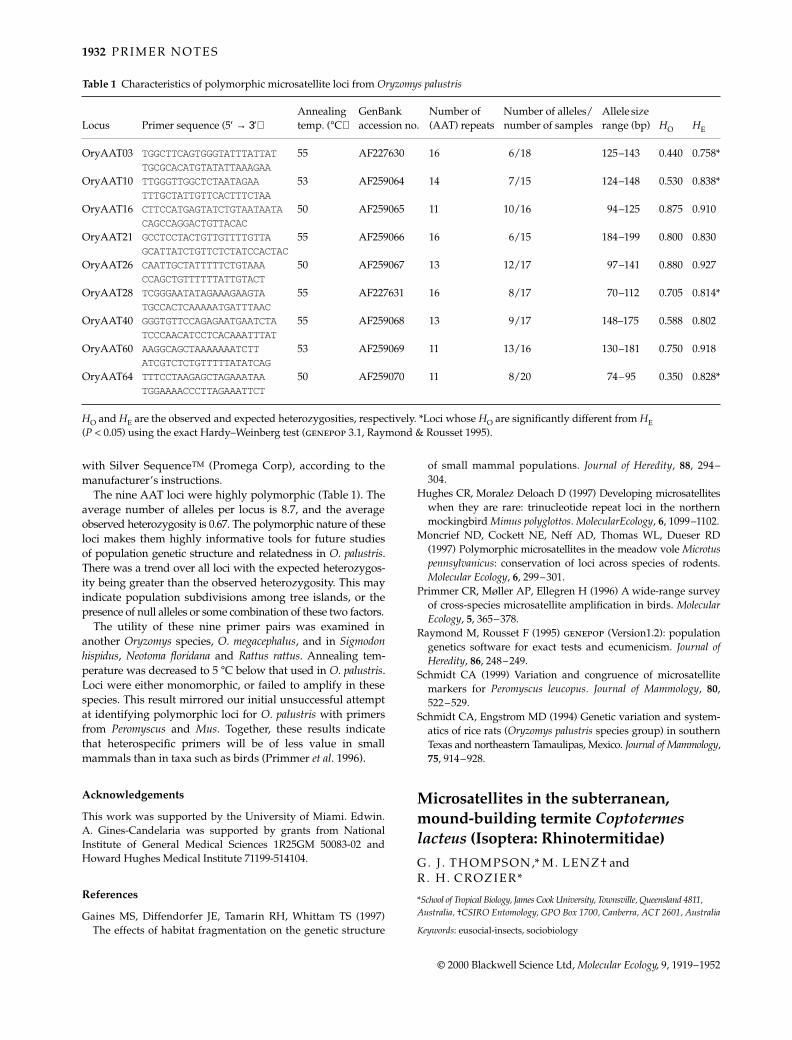
As part of an on-going study of impacts of habitat patchinesson genetic structure, we report the characterization of micro-satellite loci for the marsh rice rat (Oryzomys palustris). Previousstudies on the population structure of this species havesuggested that allozymes (Schmidt & Engstrom 1994) andmitochondrial DNA sequence data (Gaines et al. 1997) onlyreveal large-scale geographical structure. To study the specieswithin Everglades National Park and its surrounding habitat,we need more variable loci; microsatellite loci seemed thebest choice.
Our first approach was to use polymerase chain reaction(PCR) primers that amplify polymorphic microsatellite lociin the related species Peromyscus leucopus (Schmidt 1999) andMus musculus (Moncrief et al. 1997). However, 15 pairs ofPeromyscus primers and 52 pairs of Mus primers failed toproduce polymorphic markers for Oryzomys.
We therefore isolated microsatellites de novo. A partialgenomic library was created in λ ZAP Express (Stratagene,La Jolla, California, USA) as described by Hughes & MoralezDeLoach (1997). Approximately 150 000 clones were screenedwith 32P-labelled oligo(AAT)10. Fifty positive clones werepurified and then sequenced using the BigDyeTM TerminatorCycle Sequencing Kit and an ABI 310 genetic analyser (PEApplied Biosystems). PCR primers were developed for nineclones containing >10 uninterrupted repeats of the sequenceAAT.
PCR reactions (10 µL) contained 4 mm MgCl2, 10 mm Tris-ClpH 8.3, 50 mm KCl, 125 µm each dNTP, 500 nm forward andreverse primers, 0.25 U Taq DNA polymerase (Perkin Elmer)and about 10 ng DNA. Individuals had been sampled fromeight tree islands <300 m apart. Reactions were cycled usingthe ‘tube-control’ function of a Hybaid thermal cycler: 1 minat 92 °C, then 30 cycles of 5 s at 92 °C, 5 s at annealingtemperature (Table 1) and 10 s at 72 °C. PCR products wereresolved on a 6% denaturing polyacrylamide gel and stained
MEC1052.fm Page 1931 Saturday, October 7, 2000 11:46 AM
1932 P R I M E R N O T E S
© 2000 Blackwell Science Ltd, Molecular Ecology, 9, 1919–1952
with Silver SequenceTM (Promega Corp), according to themanufacturer’s instructions.
The nine AAT loci were highly polymorphic (Table 1). Theaverage number of alleles per locus is 8.7, and the averageobserved heterozygosity is 0.67. The polymorphic nature of theseloci makes them highly informative tools for future studiesof population genetic structure and relatedness in O. palustris.There was a trend over all loci with the expected heterozygos-ity being greater than the observed heterozygosity. This mayindicate population subdivisions among tree islands, or thepresence of null alleles or some combination of these two factors.
The utility of these nine primer pairs was examined inanother Oryzomys species, O. megacephalus, and in Sigmodonhispidus, Neotoma floridana and Rattus rattus. Annealing tem-perature was decreased to 5 °C below that used in O. palustris.Loci were either monomorphic, or failed to amplify in thesespecies. This result mirrored our initial unsuccessful attemptat identifying polymorphic loci for O. palustris with primersfrom Peromyscus and Mus. Together, these results indicatethat heterospecific primers will be of less value in smallmammals than in taxa such as birds (Primmer et al. 1996).
Acknowledgements
This work was supported by the University of Miami. Edwin.A. Gines-Candelaria was supported by grants from NationalInstitute of General Medical Sciences 1R25GM 50083-02 andHoward Hughes Medical Institute 71199-514104.
References
Gaines MS, Diffendorfer JE, Tamarin RH, Whittam TS (1997)The effects of habitat fragmentation on the genetic structure
of small mammal populations. Journal of Heredity, 88, 294–304.
Hughes CR, Moralez Deloach D (1997) Developing microsatelliteswhen they are rare: trinucleotide repeat loci in the northernmockingbird Mimus polyglottos. MolecularEcology, 6, 1099–1102.
Moncrief ND, Cockett NE, Neff AD, Thomas WL, Dueser RD(1997) Polymorphic microsatellites in the meadow vole Microtuspennsylvanicus: conservation of loci across species of rodents.Molecular Ecology, 6, 299–301.
Primmer CR, Møller AP, Ellegren H (1996) A wide-range surveyof cross-species microsatellite amplification in birds. MolecularEcology, 5, 365–378.
Raymond M, Rousset F (1995) genepop (Version1.2): populationgenetics software for exact tests and ecumenicism. Journal ofHeredity, 86, 248–249.
Schmidt CA (1999) Variation and congruence of microsatellitemarkers for Peromyscus leucopus. Journal of Mammology, 80,522–529.
Schmidt CA, Engstrom MD (1994) Genetic variation and system-atics of rice rats (Oryzomys palustris species group) in southernTexas and northeastern Tamaulipas, Mexico. Journal of Mammology,75, 914–928.
91120001080PRIMER NOTEPRIMER NOTEPRIMER NOTE000000Graphicraft Limited, Hong Kong
Microsatellites in the subterranean, mound-building termite Coptotermes lacteus (Isoptera: Rhinotermitidae)G. J . THOMPSON,* M. LENZ† and R . H. CROZIER*
*School of Tropical Biology, James Cook University, Townsville, Queensland 4811, Australia, †CSIRO Entomology, GPO Box 1700, Canberra, ACT 2601, Australia
Keywords: eusocial-insects, sociobiology
Table 1 Characteristics of polymorphic microsatellite loci from Oryzomys palustris
Locus Primer sequence (5′ → 3′)Annealing temp. (°C)
GenBank accession no.
Number of (AAT) repeats
Number of alleles/number of samples
Allele size range (bp) HO HE
OryAAT03 TGGCTTCAGTGGGTATTTATTAT 55 AF227630 16 6/18 125–143 0.440 0.758*TGCGCACATGTATATTAAAGAA
OryAAT10 TTGGGTTGGCTCTAATAGAA 53 AF259064 14 7/15 124–148 0.530 0.838*TTTGCTATTGTTCACTTTCTAA
OryAAT16 CTTCCATGAGTATCTGTAATAATA50 AF259065 11 10/16 94–125 0.875 0.910CAGCCAGGACTGTTACAC
OryAAT21 GCCTCCTACTGTTGTTTTGTTA 55 AF259066 16 6/15 184–199 0.800 0.830GCATTATCTGTTCTCTATCCACTAC
OryAAT26 CAATTGCTATTTTTCTGTAAA 50 AF259067 13 12/17 97–141 0.880 0.927CCAGCTGTTTTTTATTGTACT
OryAAT28 TCGGGAATATAGAAAGAAGTA 55 AF227631 16 8/17 70–112 0.705 0.814*TGCCACTCAAAAATGATTTAAC
OryAAT40 GGGTGTTCCAGAGAATGAATCTA55 AF259068 13 9/17 148–175 0.588 0.802TCCCAACATCCTCACAAATTTAT
OryAAT60 AAGGCAGCTAAAAAAATCTT 53 AF259069 11 13/16 130–181 0.750 0.918ATCGTCTCTGTTTTTATATCAG
OryAAT64 TTTCCTAAGAGCTAGAAATAA 50 AF259070 11 8/20 74–95 0.350 0.828*TGGAAAACCCTTAGAAATTCT
HO and HE are the observed and expected heterozygosities, respectively. *Loci whose HO are significantly different from HE (P < 0.05) using the exact Hardy–Weinberg test (genepop 3.1, Raymond & Rousset 1995).
MEC1052.fm Page 1932 Saturday, October 7, 2000 11:46 AM
P R I M E R N O T E S 1933
© 2000 Blackwell Science Ltd, Molecular Ecology, 9, 1919–1952
Received 16 March 2000; revision accepted 25 June 2000
Correspondence: G. J. Thompson. Fax: + 61 7 4725 1570; E-mail: [email protected]
The conceptual framework for the evolution of social life andcolony organization is provided by kin selection theory, withpredictions often tested through direct estimates of colonyand population genetic structure (Pamilo et al. 1997). All termitespecies are eusocial yet, despite their significance as potentialfalsifiers to this theory, have received comparatively little atten-tion in this respect (Reilly 1987; Husseneder et al. 1999). Coloniesof the subterranean, mound-building species Coptotermes lacteus(Rhinotermitidae) are normally founded by a single repro-ductive pair which remain the sole progenitors for as long as20 years (Gay & Calaby 1970). Upon failure of one or more ofthese primary reproductives, however, colonies will recruitsecondary reproductives of either sex through differentiation ofnymphal instars. This in turn promotes the formation of poly-gamous reproductive associations, a shift in alate productionfrom seasonal to perennial, and extremely male-biased alatesex ratios (Lenz & Runko 1993). Thus, in addition to the applica-tion of variable markers for inferring colony structure of normalC. lacteus populations, they will make it possible to monitor howshifts in genetic heterogeneity affect reproductive decisionsof orphaned colonies. In this note we characterize six poly-morphic microsatellite markers from C. lacteus; member ofthe family Rhinotermitidae (~200 sp.). Four microsatellitemarkers have recently been characterized for the Termitidae(Kaib et al. 2000).
Partial genomic libraries were constructed from DNAextracted from the heads of 500 individual termites pooledfrom five different mounds (South Brooma State Forest, NSWAustralia). Approximately 6 µg of genomic DNA was restrictedwith double-digest combinations of either Sau3AI/RsaI orSau3AI/AluI and fragments ranging between 300 and 800 bpwere purified and ligated into HincII/BamHI sites of pUC19plasmid vector. Transformations were carried out by electro-poration (GenePulser, BioRad) into Escherichia coli JM109cells, then plated onto nutrient agar for white/blue selection
of recombinant/nonrecombinant transformants (Ausubel et al.1995). Approximately 4000 positive clones were isolated inthis manner, transferred onto Hybond N + (Amersham) nylonmembranes, and subsequently hybridized with (AG)10 and(GT)10 dinucleotide probes previously end-labelled with[γ33P]-ATP. On the basis of positive hybridization signal,30 putative microsatellite-containing clones were identifiedand sequenced. Polymerase chain reaction (PCR) primer pairswere designed for 10 of these loci using primer (Lincoln et al.1991).
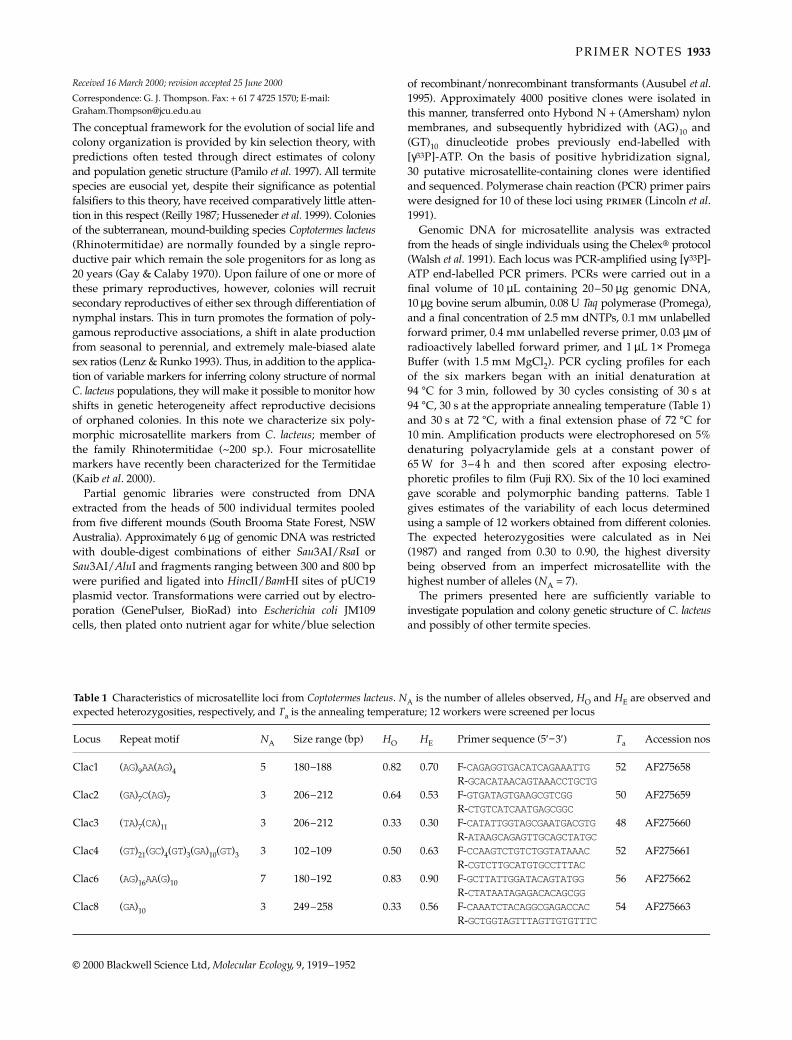
Genomic DNA for microsatellite analysis was extractedfrom the heads of single individuals using the Chelex® protocol(Walsh et al. 1991). Each locus was PCR-amplified using [γ33P]-ATP end-labelled PCR primers. PCRs were carried out in afinal volume of 10 µL containing 20–50 µg genomic DNA,10 µg bovine serum albumin, 0.08 U Taq polymerase (Promega),and a final concentration of 2.5 mm dNTPs, 0.1 mm unlabelledforward primer, 0.4 mm unlabelled reverse primer, 0.03 µm ofradioactively labelled forward primer, and 1 µL 1× PromegaBuffer (with 1.5 mm MgCl2). PCR cycling profiles for eachof the six markers began with an initial denaturation at94 °C for 3 min, followed by 30 cycles consisting of 30 s at94 °C, 30 s at the appropriate annealing temperature (Table 1)and 30 s at 72 °C, with a final extension phase of 72 °C for10 min. Amplification products were electrophoresed on 5%denaturing polyacrylamide gels at a constant power of65 W for 3–4 h and then scored after exposing electro-phoretic profiles to film (Fuji RX). Six of the 10 loci examinedgave scorable and polymorphic banding patterns. Table 1gives estimates of the variability of each locus determinedusing a sample of 12 workers obtained from different colonies.The expected heterozygosities were calculated as in Nei(1987) and ranged from 0.30 to 0.90, the highest diversitybeing observed from an imperfect microsatellite with thehighest number of alleles (NA = 7).
The primers presented here are sufficiently variable toinvestigate population and colony genetic structure of C. lacteusand possibly of other termite species.
Table 1 Characteristics of microsatellite loci from Coptotermes lacteus. NA is the number of alleles observed, HO and HE are observed andexpected heterozygosities, respectively, and Ta is the annealing temperature; 12 workers were screened per locus
Locus Repeat motif NA Size range (bp) HO HE Primer sequence (5′−3′) Ta Accession nos
Clac1 (AG)9AA(AG)4 5 180–188 0.82 0.70 F-CAGAGGTGACATCAGAAATTG 52 AF275658R-GCACATAACAGTAAACCTGCTG
Clac2 (GA)7C(AG)7 3 206–212 0.64 0.53 F-GTGATAGTGAAGCGTCGG 50 AF275659R-CTGTCATCAATGAGCGGC
Clac3 (TA)7(CA)11 3 206–212 0.33 0.30 F-CATATTGGTAGCGAATGACGTG48 AF275660R-ATAAGCAGAGTTGCAGCTATGC
Clac4 (GT)21(GC)4(GT)3(GA)10(GT)3 3 102–109 0.50 0.63 F-CCAAGTCTGTCTGGTATAAAC 52 AF275661R-CGTCTTGCATGTGCCTTTAC
Clac6 (AG)16AA(G)10 7 180–192 0.83 0.90 F-GCTTATTGGATACAGTATGG 56 AF275662R-CTATAATAGAGACACAGCGG
Clac8 (GA)10 3 249–258 0.33 0.56 F-CAAATCTACAGGCGAGACCAC 54 AF275663R-GCTGGTAGTTTAGTTGTGTTTC
MEC1052.fm Page 1933 Saturday, October 7, 2000 11:46 AM

1934 P R I M E R N O T E S
© 2000 Blackwell Science Ltd, Molecular Ecology, 9, 1919–1952
Acknowledgements
J. Painter, C. Crozier and M. Carew for technical advice; P. Gleesonand S. Runko for termite collections.
References
Ausubel FM, Brent R, Kingston RE et al. (1995) Short Protocols inMolecular Biology. 3rd edn. Wiley, New York.
Gay FJ, Calaby JH (1970) Termites of the Australian region. In:Biology of Termites Vol. 2 (eds Krishna K, Weesner FM), pp. 393–448. Academic Press, New York.
Husseneder C, Brandl R, Epplen C, Epplen JT, Kaib M (1999)Within-colony relatedness in a termite species: Genetic roadsto eusociality? Behaviour, 136, 1045–1063.
Kaib M, Hacker M, Over I et al. (2000) Microsatellite loci inMacrotermes michaelseni (Isoptera: Termitidae). Molecular Ecology,9, 502–504.
Lenz M, Runko S (1993) Long-term impact of orphaning on fieldcolonies of Coptotermes lacteus (Froggatt) (Isoptera, Rhinoter-mitidae). Insectes Sociaux, 40, 439–456.
Lincoln S, Daley M, Lander E (1991) PRIMER, Version 0.5. White-head Institute/MIT, Cambridge, MA.
Nei M (1987) Molecular Evolutionary Genetics. Columbia Univer-sity Press, New York.
Pamilo P, Gertsch P, Thorén P, Seppä P (1997) Molecular popu-lation genetics of social insects. Annual Review of Ecology andSystematics, 28, 1–25.
Reilly LM (1987) Measurements of inbreeding and averagerelatedness in a termite population. American Naturalist, 130,339–349.
Walsh PS, Metzger DA, Higuchi R (1991) Chelex® 100 as amedium for simple extraction of DNA for PCR-based typingfrom forensic material. Biotechniques, 10, 506–513.
91120001079PRIMER NOTEsPRIMER NOTEsPRIMER NOTEs100Graphicraft Limited, Hong Kong
Characterization of microsatellites in capercaillie Tetrao urogallus (AVES)G. SEGELBACHER,* R . J . PAXTON,† G. STEINBRÜCK,† P. TRONTELJ§ and I . STORCH*
*Wildlife Research and Management Unit, Faculty of Forest Sciences, TU, Munich, Am Hochanger 13, D-85354 Freising, Germany, †Zoological, Institute, University of Tübingen, Auf der Morgenstelle 28, D-72076 Tübingen, Germany, §Department of Biology, Biotechnical Faculty, University of, Ljubljana, PO Box 2995, SI-1001 Ljubljana, Slovenia
Keywords: capercaillie, gene flow, microsatellites, population structure, Tetrao
Received 12 May 2000; revision accepted 25 June 2000
Correspondence: Gernot Segelbacher. Fax: +49 8161 714615; E-mail: [email protected]
The Capercaillie (Tetrao urogallus) is listed in the red-data booksof threatened species of most central European countries (Storch2000). Its range is fragmented both at the continental (centralEurope) and the regional (e.g. Alps) scale, and the distribution
of populations resembles a metapopulation pattern (Storch1997). In this context, information on (sub) population con-nectivity is highly relevant for species conservation. To assessthe extent of gene flow in relation to geographical distance inCapercaillie we developed species-specific microsatellites.As the abundance of microsatellites seems to be much lowerin birds than in other vertebrates (Primmer et al. 1997), we usedan enrichment method for establishing a microsatellite-richpartial genomic library (Piertney et al. 1998a). DNA was extractedfrom tissue of an adult capercaillie female using standardproteinase K digestion and phenol–chloroform procedures(Sambrook et al. 1989). DNA was digested using Sau3AIrestriction endonuclease and a 300–900 bp fraction isolated.Fragments were ligated to a SAU linker molecule (Piertneyet al. 1998b). Resultant fragments were denatured and hybrid-ized to a 1-cm2 piece of Hybond N + membrane (AmershamInternational Ltd) to which a synthetic polymer, either (CA)nor (GATA)n, was bound. Hybridization took place at 60 °Covernight in 2× SSC, 0.1% SDS for (CA)n and in 5× SSC, 0.1%SDS for (GATA)n. After three low stringency washes of 2×SSC, 0.1% SDS for (CA)n/5× SSC, 0.1% SDS for (GATA)n theenriched fraction was removed by heating to 95° for 5 minin sterile water. The enriched fraction was precipitated andcomplementary strands were reformed in a polymerase chainreaction (PCR) (30 cycles at 94 °C denaturation, 55 °C annealingand 72 °C extension) using the SAU-L-A oligonucleotide as aprimer. SAU linkers were removed by restriction with Sau3AIand fragments were ligated into a phosphorylated, BamHI-cutpUC18 vector (Pharmacia Ltd). Vector molecules were trans-formed into INVαF′One-ShotTM Escherichia coli (Invitrogen)which were then grown overnight on Luria-Bertani (LB) mediumwith ampicillin. Colony lifts were made from the plates ontoHybond N + membranes and screened for the presence ofmicrosatellites following Estoup & Turgeon (1996) in 5× SSC,0.1% SDS at 55 °C. Positive clones were sequenced on an ABI373 sequencer using Big Dye terminator chemistry (PerkinElmer Applied Biosystems) and primers were designed onsequences flanking the repeat elements (Whitehead InstitutePrimer 3.0). Genetic variability was examined in ≈ 20 indi-viduals from the European Alps. DNA was extracted fromcapercaillie feathers using a silica-based column method (Qiagen)according to the manufacturer’s protocol. PCR-amplificationswere performed in 10 µL reactions in an Eppendorf Gradientthermal cycler. Individual mixes contained approximately10 ng template, 0.2 mm of each nucleotide, 10 pmoles of eachprimer, 2.5 mm MgCl2, 0.25 units of Taq DNA polymerase(Gibco BRL), 20 mm Tris-HCl (pH 8.4) and 50 mm KCl. PCRprofiles consisted of 3 min denaturation at 94 °C, 35 cycles of30 s denaturation at 94 °C, 30 s annealing at the specifiedtemperature and 45 s extension at 72 °C with a final 5 min72 °C step. PCR fragments were resolved by electrophoresison 6% denaturing polyacrylamide gels and afterwards stainedwith silver. High levels of variability could be detected in theanalysed loci (Table 1), making them useful for paternityanalysis and population genetic studies.
Acknowledgements
The work was funded by the DFG (STO 230/4–2). We thank all
MEC1052.fm Page 1934 Saturday, October 7, 2000 11:46 AM
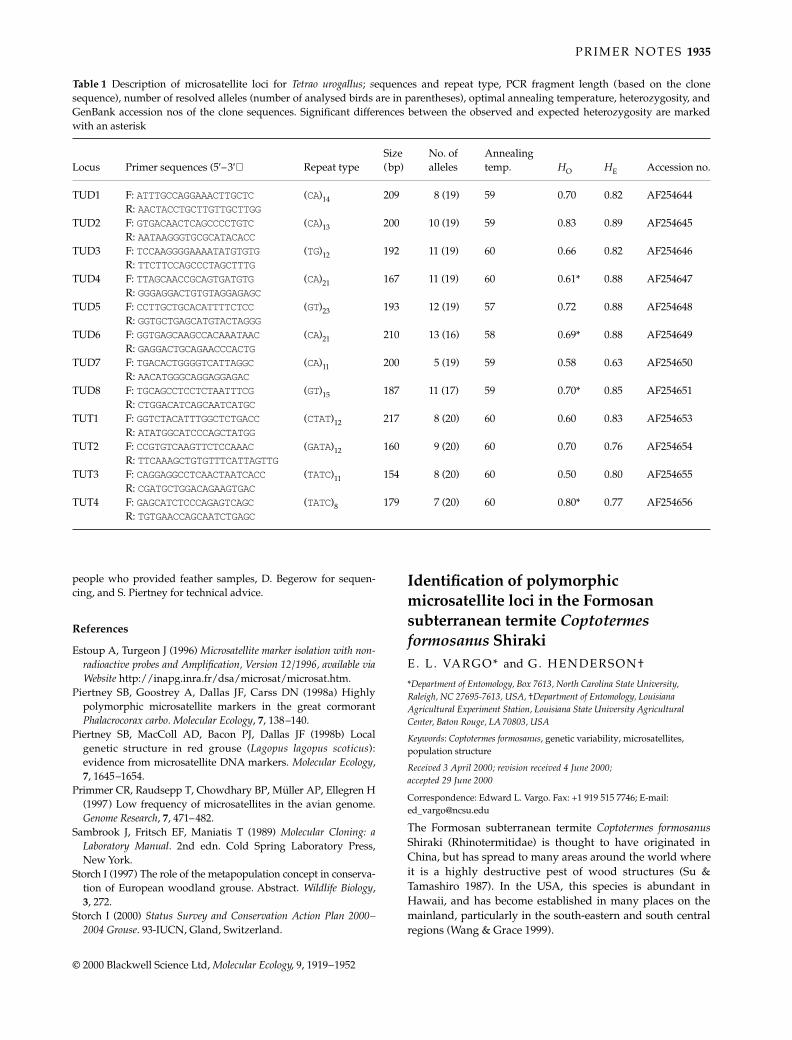
P R I M E R N O T E S 1935
© 2000 Blackwell Science Ltd, Molecular Ecology, 9, 1919–1952
people who provided feather samples, D. Begerow for sequen-cing, and S. Piertney for technical advice.
References
Estoup A, Turgeon J (1996) Microsatellite marker isolation with non-radioactive probes and Amplification, Version 12/1996, available viaWebsite http://inapg.inra.fr/dsa/microsat/microsat.htm.
Piertney SB, Goostrey A, Dallas JF, Carss DN (1998a) Highlypolymorphic microsatellite markers in the great cormorantPhalacrocorax carbo. Molecular Ecology, 7, 138–140.
Piertney SB, MacColl AD, Bacon PJ, Dallas JF (1998b) Localgenetic structure in red grouse (Lagopus lagopus scoticus):evidence from microsatellite DNA markers. Molecular Ecology,7, 1645–1654.
Primmer CR, Raudsepp T, Chowdhary BP, Müller AP, Ellegren H(1997) Low frequency of microsatellites in the avian genome.Genome Research, 7, 471–482.
Sambrook J, Fritsch EF, Maniatis T (1989) Molecular Cloning: aLaboratory Manual. 2nd edn. Cold Spring Laboratory Press,New York.
Storch I (1997) The role of the metapopulation concept in conserva-tion of European woodland grouse. Abstract. Wildlife Biology,3, 272.
Storch I (2000) Status Survey and Conservation Action Plan 2000–2004 Grouse. 93-IUCN, Gland, Switzerland.
91120001087PRIMER NOTESPRIMER NOTESPRIMER NOTES100Graphicraft Limited, Hong Kong
Identification of polymorphic microsatellite loci in the Formosan subterranean termite Coptotermes formosanus ShirakiE. L . VARGO* and G. HENDERSON†
*Department of Entomology, Box 7613, North Carolina State University, Raleigh, NC 27695-7613, USA, †Department of Entomology, Louisiana Agricultural Experiment Station, Louisiana State University Agricultural Center, Baton Rouge, LA 70803, USA
Keywords: Coptotermes formosanus, genetic variability, microsatellites, population structure
Received 3 April 2000; revision received 4 June 2000; accepted 29 June 2000
Correspondence: Edward L. Vargo. Fax: +1 919 515 7746; E-mail: [email protected]
The Formosan subterranean termite Coptotermes formosanusShiraki (Rhinotermitidae) is thought to have originated inChina, but has spread to many areas around the world whereit is a highly destructive pest of wood structures (Su &Tamashiro 1987). In the USA, this species is abundant inHawaii, and has become established in many places on themainland, particularly in the south-eastern and south centralregions (Wang & Grace 1999).
Table 1 Description of microsatellite loci for Tetrao urogallus; sequences and repeat type, PCR fragment length (based on the clonesequence), number of resolved alleles (number of analysed birds are in parentheses), optimal annealing temperature, heterozygosity, andGenBank accession nos of the clone sequences. Significant differences between the observed and expected heterozygosity are markedwith an asterisk
Locus Primer sequences (5′–3′) Repeat typeSize (bp)
No. of alleles
Annealing temp. HO HE Accession no.
TUD1 F: ATTTGCCAGGAAACTTGCTC (CA)14 209 8 (19) 59 0.70 0.82 AF254644R: AACTACCTGCTTGTTGCTTGG
TUD2 F: GTGACAACTCAGCCCCTGTC (CA)13 200 10 (19) 59 0.83 0.89 AF254645R: AATAAGGGTGCGCATACACC
TUD3 F: TCCAAGGGGAAAATATGTGTG (TG)12 192 11 (19) 60 0.66 0.82 AF254646R: TTCTTCCAGCCCTAGCTTTG
TUD4 F: TTAGCAACCGCAGTGATGTG (CA)21 167 11 (19) 60 0.61* 0.88 AF254647R: GGGAGGACTGTGTAGGAGAGC
TUD5 F: CCTTGCTGCACATTTTCTCC (GT)23 193 12 (19) 57 0.72 0.88 AF254648R: GGTGCTGAGCATGTACTAGGG
TUD6 F: GGTGAGCAAGCCACAAATAAC (CA)21 210 13 (16) 58 0.69* 0.88 AF254649R: GAGGACTGCAGAACCCACTG
TUD7 F: TGACACTGGGGTCATTAGGC (CA)11 200 5 (19) 59 0.58 0.63 AF254650R: AACATGGGCAGGAGGAGAC
TUD8 F: TGCAGCCTCCTCTAATTTCG (GT)15 187 11 (17) 59 0.70* 0.85 AF254651R: CTGGACATCAGCAATCATGC
TUT1 F: GGTCTACATTTGGCTCTGACC (CTAT)12 217 8 (20) 60 0.60 0.83 AF254653R: ATATGGCATCCCAGCTATGG
TUT2 F: CCGTGTCAAGTTCTCCAAAC (GATA)12 160 9 (20) 60 0.70 0.76 AF254654R: TTCAAAGCTGTGTTTCATTAGTTG
TUT3 F: CAGGAGGCCTCAACTAATCACC (TATC)11 154 8 (20) 60 0.50 0.80 AF254655R: CGATGCTGGACAGAAGTGAC
TUT4 F: GAGCATCTCCCAGAGTCAGC (TATC)8 179 7 (20) 60 0.80* 0.77 AF254656R: TGTGAACCAGCAATCTGAGC
MEC1052.fm Page 1935 Saturday, October 7, 2000 11:46 AM
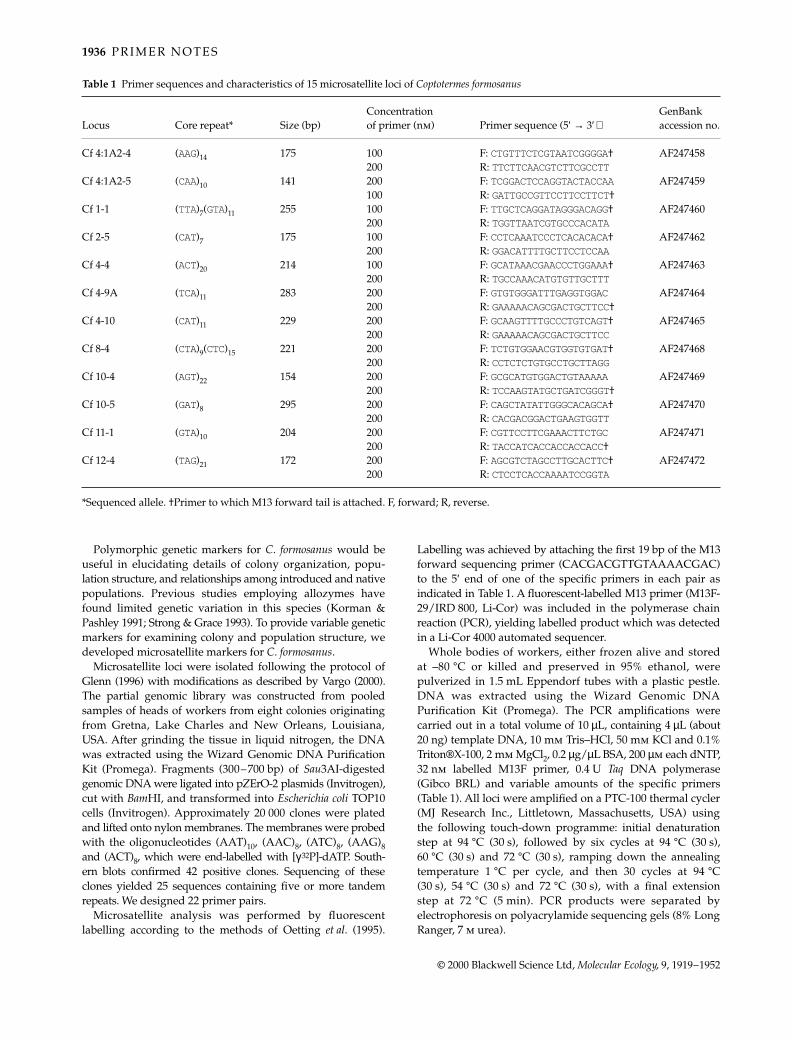
1936 P R I M E R N O T E S
© 2000 Blackwell Science Ltd, Molecular Ecology, 9, 1919–1952
Polymorphic genetic markers for C. formosanus would beuseful in elucidating details of colony organization, popu-lation structure, and relationships among introduced and nativepopulations. Previous studies employing allozymes havefound limited genetic variation in this species (Korman &Pashley 1991; Strong & Grace 1993). To provide variable geneticmarkers for examining colony and population structure, wedeveloped microsatellite markers for C. formosanus.
Microsatellite loci were isolated following the protocol ofGlenn (1996) with modifications as described by Vargo (2000).The partial genomic library was constructed from pooledsamples of heads of workers from eight colonies originatingfrom Gretna, Lake Charles and New Orleans, Louisiana,USA. After grinding the tissue in liquid nitrogen, the DNAwas extracted using the Wizard Genomic DNA PurificationKit (Promega). Fragments (300–700 bp) of Sau3AI-digestedgenomic DNA were ligated into pZErO-2 plasmids (Invitrogen),cut with BamHI, and transformed into Escherichia coli TOP10cells (Invitrogen). Approximately 20 000 clones were platedand lifted onto nylon membranes. The membranes were probedwith the oligonucleotides (AAT)10, (AAC)8, (ATC)8, (AAG)8and (ACT)8, which were end-labelled with [γ32P]-dATP. South-ern blots confirmed 42 positive clones. Sequencing of theseclones yielded 25 sequences containing five or more tandemrepeats. We designed 22 primer pairs.
Microsatellite analysis was performed by fluorescentlabelling according to the methods of Oetting et al. (1995).
Labelling was achieved by attaching the first 19 bp of the M13forward sequencing primer (CACGACGTTGTAAAACGAC)to the 5′ end of one of the specific primers in each pair asindicated in Table 1. A fluorescent-labelled M13 primer (M13F-29/IRD 800, Li-Cor) was included in the polymerase chainreaction (PCR), yielding labelled product which was detectedin a Li-Cor 4000 automated sequencer.
Whole bodies of workers, either frozen alive and storedat –80 °C or killed and preserved in 95% ethanol, werepulverized in 1.5 mL Eppendorf tubes with a plastic pestle.DNA was extracted using the Wizard Genomic DNAPurification Kit (Promega). The PCR amplifications werecarried out in a total volume of 10 µL, containing 4 µL (about20 ng) template DNA, 10 mm Tris–HCl, 50 mm KCl and 0.1%Triton®X-100, 2 mm MgCl2, 0.2 µg/µL BSA, 200 µm each dNTP,32 nm labelled M13F primer, 0.4 U Taq DNA polymerase(Gibco BRL) and variable amounts of the specific primers(Table 1). All loci were amplified on a PTC-100 thermal cycler(MJ Research Inc., Littletown, Massachusetts, USA) usingthe following touch-down programme: initial denaturationstep at 94 °C (30 s), followed by six cycles at 94 °C (30 s),60 °C (30 s) and 72 °C (30 s), ramping down the annealingtemperature 1 °C per cycle, and then 30 cycles at 94 °C(30 s), 54 °C (30 s) and 72 °C (30 s), with a final extensionstep at 72 °C (5 min). PCR products were separated byelectrophoresis on polyacrylamide sequencing gels (8% LongRanger, 7 m urea).
Table 1 Primer sequences and characteristics of 15 microsatellite loci of Coptotermes formosanus
Locus Core repeat* Size (bp)Concentration of primer (nm) Primer sequence (5′ → 3′ )
GenBank accession no.
Cf 4:1A2-4 (AAG)14 175 100 F: CTGTTTCTCGTAATCGGGGA† AF247458200 R: TTCTTCAACGTCTTCGCCTT
Cf 4:1A2-5 (CAA)10 141 200 F: TCGGACTCCAGGTACTACCAA AF247459100 R: GATTGCCGTTCCTTCCTTCT†
Cf 1-1 (TTA)7(GTA)11 255 100 F: TTGCTCAGGATAGGGACAGG† AF247460200 R: TGGTTAATCGTGCCCACATA
Cf 2-5 (CAT)7 175 100 F: CCTCAAATCCCTCACACACA† AF247462200 R: GGACATTTTGCTTCCTCCAA
Cf 4-4 (ACT)20 214 100 F: GCATAAACGAACCCTGGAAA† AF247463200 R: TGCCAAACATGTGTTGCTTT
Cf 4-9A (TCA)11 283 200 F: GTGTGGGATTTGAGGTGGAC AF247464200 R: GAAAAACAGCGACTGCTTCC†
Cf 4-10 (CAT)11 229 200 F: GCAAGTTTTGCCCTGTCAGT† AF247465200 R: GAAAAACAGCGACTGCTTCC
Cf 8-4 (CTA)9(CTC)15 221 200 F: TCTGTGGAACGTGGTGTGAT† AF247468200 R: CCTCTCTGTGCCTGCTTAGG
Cf 10-4 (AGT)22 154 200 F: GCGCATGTGGACTGTAAAAA AF247469200 R: TCCAAGTATGCTGATCGGGT†
Cf 10-5 (GAT)8 295 200 F: CAGCTATATTGGGCACAGCA† AF247470200 R: CACGACGGACTGAAGTGGTT
Cf 11-1 (GTA)10 204 200 F: CGTTCCTTCGAAACTTCTGC AF247471200 R: TACCATCACCACCACCACC†
Cf 12-4 (TAG)21 172 200 F: AGCGTCTAGCCTTGCACTTC† AF247472200 R: CTCCTCACCAAAATCCGGTA
*Sequenced allele. †Primer to which M13 forward tail is attached. F, forward; R, reverse.
MEC1052.fm Page 1936 Saturday, October 7, 2000 11:46 AM
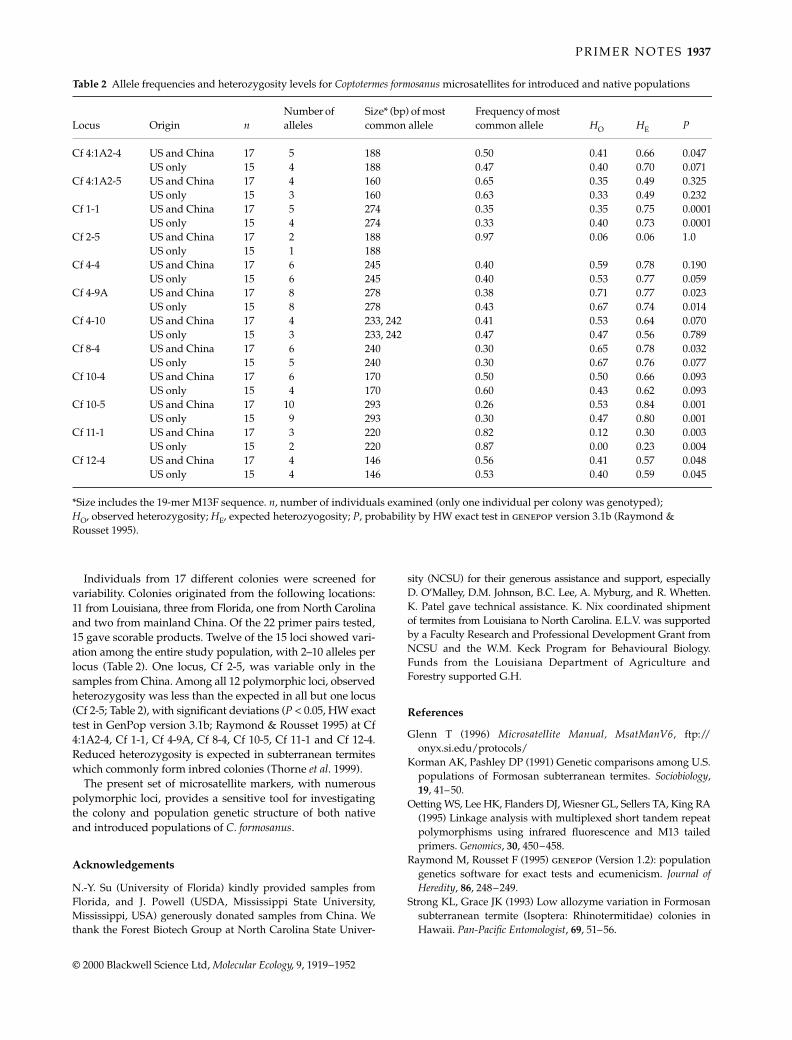
P R I M E R N O T E S 1937
© 2000 Blackwell Science Ltd, Molecular Ecology, 9, 1919–1952
Individuals from 17 different colonies were screened forvariability. Colonies originated from the following locations:11 from Louisiana, three from Florida, one from North Carolinaand two from mainland China. Of the 22 primer pairs tested,15 gave scorable products. Twelve of the 15 loci showed vari-ation among the entire study population, with 2–10 alleles perlocus (Table 2). One locus, Cf 2-5, was variable only in thesamples from China. Among all 12 polymorphic loci, observedheterozygosity was less than the expected in all but one locus(Cf 2-5; Table 2), with significant deviations (P < 0.05, HW exacttest in GenPop version 3.1b; Raymond & Rousset 1995) at Cf4:1A2-4, Cf 1-1, Cf 4-9A, Cf 8-4, Cf 10-5, Cf 11-1 and Cf 12-4.Reduced heterozygosity is expected in subterranean termiteswhich commonly form inbred colonies (Thorne et al. 1999).
The present set of microsatellite markers, with numerouspolymorphic loci, provides a sensitive tool for investigatingthe colony and population genetic structure of both nativeand introduced populations of C. formosanus.
Acknowledgements
N.-Y. Su (University of Florida) kindly provided samples fromFlorida, and J. Powell (USDA, Mississippi State University,Mississippi, USA) generously donated samples from China. Wethank the Forest Biotech Group at North Carolina State Univer-
sity (NCSU) for their generous assistance and support, especiallyD. O’Malley, D.M. Johnson, B.C. Lee, A. Myburg, and R. Whetten.K. Patel gave technical assistance. K. Nix coordinated shipmentof termites from Louisiana to North Carolina. E.L.V. was supportedby a Faculty Research and Professional Development Grant fromNCSU and the W.M. Keck Program for Behavioural Biology.Funds from the Louisiana Department of Agriculture andForestry supported G.H.
References
Glenn T (1996) Microsatellite Manual, MsatManV6, ftp://onyx.si.edu/protocols/
Korman AK, Pashley DP (1991) Genetic comparisons among U.S.populations of Formosan subterranean termites. Sociobiology,19, 41–50.
Oetting WS, Lee HK, Flanders DJ, Wiesner GL, Sellers TA, King RA(1995) Linkage analysis with multiplexed short tandem repeatpolymorphisms using infrared fluorescence and M13 tailedprimers. Genomics, 30, 450–458.
Raymond M, Rousset F (1995) genepop (Version 1.2): populationgenetics software for exact tests and ecumenicism. Journal ofHeredity, 86, 248–249.
Strong KL, Grace JK (1993) Low allozyme variation in Formosansubterranean termite (Isoptera: Rhinotermitidae) colonies inHawaii. Pan-Pacific Entomologist, 69, 51–56.
Table 2 Allele frequencies and heterozygosity levels for Coptotermes formosanus microsatellites for introduced and native populations
Locus Origin nNumber of alleles
Size* (bp) of most common allele
Frequency of most common allele HO HE P
Cf 4:1A2-4 US and China 17 5 188 0.50 0.41 0.66 0.047US only 15 4 188 0.47 0.40 0.70 0.071
Cf 4:1A2-5 US and China 17 4 160 0.65 0.35 0.49 0.325US only 15 3 160 0.63 0.33 0.49 0.232
Cf 1-1 US and China 17 5 274 0.35 0.35 0.75 0.0001US only 15 4 274 0.33 0.40 0.73 0.0001
Cf 2-5 US and China 17 2 188 0.97 0.06 0.06 1.0US only 15 1 188
Cf 4-4 US and China 17 6 245 0.40 0.59 0.78 0.190US only 15 6 245 0.40 0.53 0.77 0.059
Cf 4-9A US and China 17 8 278 0.38 0.71 0.77 0.023US only 15 8 278 0.43 0.67 0.74 0.014
Cf 4-10 US and China 17 4 233, 242 0.41 0.53 0.64 0.070US only 15 3 233, 242 0.47 0.47 0.56 0.789
Cf 8-4 US and China 17 6 240 0.30 0.65 0.78 0.032US only 15 5 240 0.30 0.67 0.76 0.077
Cf 10-4 US and China 17 6 170 0.50 0.50 0.66 0.093US only 15 4 170 0.60 0.43 0.62 0.093
Cf 10-5 US and China 17 10 293 0.26 0.53 0.84 0.001US only 15 9 293 0.30 0.47 0.80 0.001
Cf 11-1 US and China 17 3 220 0.82 0.12 0.30 0.003US only 15 2 220 0.87 0.00 0.23 0.004
Cf 12-4 US and China 17 4 146 0.56 0.41 0.57 0.048US only 15 4 146 0.53 0.40 0.59 0.045
*Size includes the 19-mer M13F sequence. n, number of individuals examined (only one individual per colony was genotyped); HO, observed heterozygosity; HE, expected heterozyogosity; P, probability by HW exact test in genepop version 3.1b (Raymond & Rousset 1995).
MEC1052.fm Page 1937 Saturday, October 7, 2000 11:46 AM
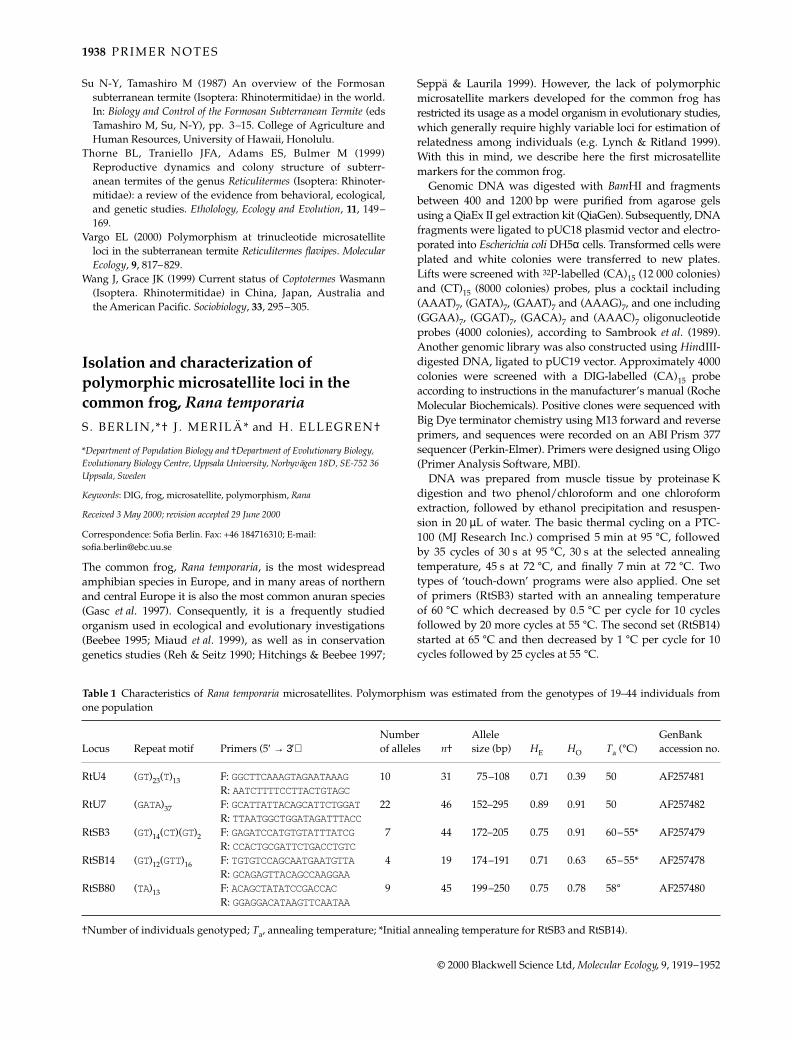
1938 P R I M E R N O T E S
© 2000 Blackwell Science Ltd, Molecular Ecology, 9, 1919–1952
Su N-Y, Tamashiro M (1987) An overview of the Formosansubterranean termite (Isoptera: Rhinotermitidae) in the world.In: Biology and Control of the Formosan Subterranean Termite (edsTamashiro M, Su, N-Y), pp. 3–15. College of Agriculture andHuman Resources, University of Hawaii, Honolulu.
Thorne BL, Traniello JFA, Adams ES, Bulmer M (1999)Reproductive dynamics and colony structure of subterr-anean termites of the genus Reticulitermes (Isoptera: Rhinoter-mitidae): a review of the evidence from behavioral, ecological,and genetic studies. Etholology, Ecology and Evolution, 11, 149–169.
Vargo EL (2000) Polymorphism at trinucleotide microsatelliteloci in the subterranean termite Reticulitermes flavipes. MolecularEcology, 9, 817–829.
Wang J, Grace JK (1999) Current status of Coptotermes Wasmann(Isoptera. Rhinotermitidae) in China, Japan, Australia andthe American Pacific. Sociobiology, 33, 295–305.
9no issue no.20001093PRIMER NOTESPRIMER NOTESPRIMER NOTES0000Graphicraft Limited, Hong Kong
Isolation and characterization of polymorphic microsatellite loci in the common frog, Rana temporariaS . BERLIN,*† J . MERILÄ* and H. ELLEGREN†
*Department of Population Biology and †Department of Evolutionary Biology, Evolutionary Biology Centre, Uppsala University, Norbyvägen 18D, SE-752 36 Uppsala, Sweden
Keywords: DIG, frog, microsatellite, polymorphism, Rana
Received 3 May 2000; revision accepted 29 June 2000
Correspondence: Sofia Berlin. Fax: +46 184716310; E-mail: [email protected]
The common frog, Rana temporaria, is the most widespreadamphibian species in Europe, and in many areas of northernand central Europe it is also the most common anuran species(Gasc et al. 1997). Consequently, it is a frequently studiedorganism used in ecological and evolutionary investigations(Beebee 1995; Miaud et al. 1999), as well as in conservationgenetics studies (Reh & Seitz 1990; Hitchings & Beebee 1997;
Seppä & Laurila 1999). However, the lack of polymorphicmicrosatellite markers developed for the common frog hasrestricted its usage as a model organism in evolutionary studies,which generally require highly variable loci for estimation ofrelatedness among individuals (e.g. Lynch & Ritland 1999).With this in mind, we describe here the first microsatellitemarkers for the common frog.
Genomic DNA was digested with BamHI and fragmentsbetween 400 and 1200 bp were purified from agarose gelsusing a QiaEx II gel extraction kit (QiaGen). Subsequently, DNAfragments were ligated to pUC18 plasmid vector and electro-porated into Escherichia coli DH5α cells. Transformed cells wereplated and white colonies were transferred to new plates.Lifts were screened with 32P-labelled (CA)15 (12 000 colonies)and (CT)15 (8000 colonies) probes, plus a cocktail including(AAAT)7, (GATA)7, (GAAT)7 and (AAAG)7, and one including(GGAA)7, (GGAT)7, (GACA)7 and (AAAC)7 oligonucleotideprobes (4000 colonies), according to Sambrook et al. (1989).Another genomic library was also constructed using HindIII-digested DNA, ligated to pUC19 vector. Approximately 4000colonies were screened with a DIG-labelled (CA)15 probeaccording to instructions in the manufacturer’s manual (RocheMolecular Biochemicals). Positive clones were sequenced withBig Dye terminator chemistry using M13 forward and reverseprimers, and sequences were recorded on an ABI Prism 377sequencer (Perkin-Elmer). Primers were designed using Oligo(Primer Analysis Software, MBI).
DNA was prepared from muscle tissue by proteinase Kdigestion and two phenol/chloroform and one chloroformextraction, followed by ethanol precipitation and resuspen-sion in 20 µL of water. The basic thermal cycling on a PTC-100 (MJ Research Inc.) comprised 5 min at 95 °C, followedby 35 cycles of 30 s at 95 °C, 30 s at the selected annealingtemperature, 45 s at 72 °C, and finally 7 min at 72 °C. Twotypes of ‘touch-down’ programs were also applied. One setof primers (RtSB3) started with an annealing temperatureof 60 °C which decreased by 0.5 °C per cycle for 10 cyclesfollowed by 20 more cycles at 55 °C. The second set (RtSB14)started at 65 °C and then decreased by 1 °C per cycle for 10cycles followed by 25 cycles at 55 °C.
Table 1 Characteristics of Rana temporaria microsatellites. Polymorphism was estimated from the genotypes of 19–44 individuals fromone population
Locus Repeat motif Primers (5′ → 3′)Number of alleles n†
Allele size (bp) HE HO Ta (°C)
GenBank accession no.
RtU4 (GT)23(T)13 F: GGCTTCAAAGTAGAATAAAG 10 31 75–108 0.71 0.39 50 AF257481R: AATCTTTTCCTTACTGTAGC
RtU7 (GATA)37 F: GCATTATTACAGCATTCTGGAT22 46 152–295 0.89 0.91 50 AF257482R: TTAATGGCTGGATAGATTTACC
RtSB3 (GT)14(CT)(GT)2 F: GAGATCCATGTGTATTTATCG 7 44 172–205 0.75 0.91 60–55* AF257479R: CCACTGCGATTCTGACCTGTC
RtSB14 (GT)12(GTT)16 F: TGTGTCCAGCAATGAATGTTA 4 19 174–191 0.71 0.63 65–55* AF257478R: GCAGAGTTACAGCCAAGGAA
RtSB80 (TA)13 F: ACAGCTATATCCGACCAC 9 45 199–250 0.75 0.78 58° AF257480R: GGAGGACATAAGTTCAATAA
†Number of individuals genotyped; Ta, annealing temperature; *Initial annealing temperature for RtSB3 and RtSB14).
MEC1052.fm Page 1938 Saturday, October 7, 2000 11:46 AM
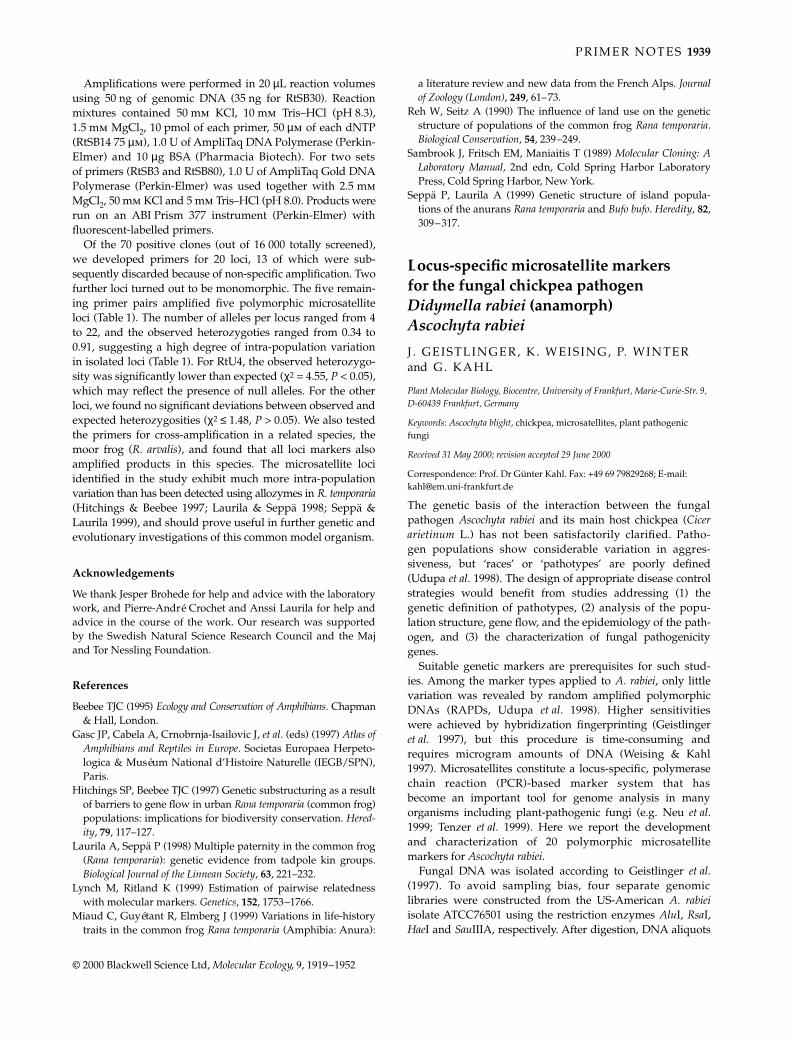
P R I M E R N O T E S 1939
© 2000 Blackwell Science Ltd, Molecular Ecology, 9, 1919–1952
Amplifications were performed in 20 µL reaction volumesusing 50 ng of genomic DNA (35 ng for RtSB30). Reactionmixtures contained 50 mm KCl, 10 mm Tris–HCl (pH 8.3),1.5 mm MgCl2, 10 pmol of each primer, 50 µm of each dNTP(RtSB14 75 µm), 1.0 U of AmpliTaq DNA Polymerase (Perkin-Elmer) and 10 µg BSA (Pharmacia Biotech). For two setsof primers (RtSB3 and RtSB80), 1.0 U of AmpliTaq Gold DNAPolymerase (Perkin-Elmer) was used together with 2.5 mmMgCl2, 50 mm KCl and 5 mm Tris–HCl (pH 8.0). Products wererun on an ABI Prism 377 instrument (Perkin-Elmer) withfluorescent-labelled primers.
Of the 70 positive clones (out of 16 000 totally screened),we developed primers for 20 loci, 13 of which were sub-sequently discarded because of non-specific amplification. Twofurther loci turned out to be monomorphic. The five remain-ing primer pairs amplified five polymorphic microsatelliteloci (Table 1). The number of alleles per locus ranged from 4to 22, and the observed heterozygoties ranged from 0.34 to0.91, suggesting a high degree of intra-population variationin isolated loci (Table 1). For RtU4, the observed heterozygo-sity was significantly lower than expected (χ2 = 4.55, P < 0.05),which may reflect the presence of null alleles. For the otherloci, we found no significant deviations between observed andexpected heterozygosities (χ2 ≤ 1.48, P > 0.05). We also testedthe primers for cross-amplification in a related species, themoor frog (R. arvalis), and found that all loci markers alsoamplified products in this species. The microsatellite lociidentified in the study exhibit much more intra-populationvariation than has been detected using allozymes in R. temporaria(Hitchings & Beebee 1997; Laurila & Seppä 1998; Seppä &Laurila 1999), and should prove useful in further genetic andevolutionary investigations of this common model organism.
Acknowledgements
We thank Jesper Brohede for help and advice with the laboratorywork, and Pierre-André Crochet and Anssi Laurila for help andadvice in the course of the work. Our research was supportedby the Swedish Natural Science Research Council and the Majand Tor Nessling Foundation.
References
Beebee TJC (1995) Ecology and Conservation of Amphibians. Chapman& Hall, London.
Gasc JP, Cabela A, Crnobrnja-Isailovic J, et al. (eds) (1997) Atlas ofAmphibians and Reptiles in Europe. Societas Europaea Herpeto-logica & Muséum National d’Histoire Naturelle (IEGB/SPN),Paris.
Hitchings SP, Beebee TJC (1997) Genetic substructuring as a resultof barriers to gene flow in urban Rana temporaria (common frog)populations: implications for biodiversity conservation. Hered-ity, 79, 117–127.
Laurila A, Seppä P (1998) Multiple paternity in the common frog(Rana temporaria): genetic evidence from tadpole kin groups.Biological Journal of the Linnean Society, 63, 221–232.
Lynch M, Ritland K (1999) Estimation of pairwise relatednesswith molecular markers. Genetics, 152, 1753–1766.
Miaud C, Guyétant R, Elmberg J (1999) Variations in life-historytraits in the common frog Rana temporaria (Amphibia: Anura):
a literature review and new data from the French Alps. Journalof Zoology (London), 249, 61–73.
Reh W, Seitz A (1990) The influence of land use on the geneticstructure of populations of the common frog Rana temporaria.Biological Conservation, 54, 239–249.
Sambrook J, Fritsch EM, Maniaitis T (1989) Molecular Cloning: ALaboratory Manual, 2nd edn, Cold Spring Harbor LaboratoryPress, Cold Spring Harbor, New York.
Seppä P, Laurila A (1999) Genetic structure of island popula-tions of the anurans Rana temporaria and Bufo bufo. Heredity, 82,309–317.
91120001092PRIMER NOTESPRIMER NOTESPRIMER NOTES0000Graphicraft Limited, Hong Kong
Locus-specific microsatellite markers for the fungal chickpea pathogen Didymella rabiei (anamorph) Ascochyta rabiei
J . GEISTLINGER, K . WEISING, P. WINTER and G. KAHL
Plant Molecular Biology, Biocentre, University of Frankfurt, Marie-Curie-Str. 9, D-60439 Frankfurt, Germany
Keywords: Ascochyta blight, chickpea, microsatellites, plant pathogenic fungi
Received 31 May 2000; revision accepted 29 June 2000
Correspondence: Prof. Dr Günter Kahl. Fax: +49 69 79829268; E-mail: [email protected]
The genetic basis of the interaction between the fungalpathogen Ascochyta rabiei and its main host chickpea (Cicerarietinum L.) has not been satisfactorily clarified. Patho-gen populations show considerable variation in aggres-siveness, but ‘races’ or ‘pathotypes’ are poorly defined(Udupa et al. 1998). The design of appropriate disease controlstrategies would benefit from studies addressing (1) thegenetic definition of pathotypes, (2) analysis of the popu-lation structure, gene flow, and the epidemiology of the path-ogen, and (3) the characterization of fungal pathogenicitygenes.
Suitable genetic markers are prerequisites for such stud-ies. Among the marker types applied to A. rabiei, only littlevariation was revealed by random amplified polymorphicDNAs (RAPDs, Udupa et al. 1998). Higher sensitivitieswere achieved by hybridization fingerprinting (Geistlingeret al. 1997), but this procedure is time-consuming andrequires microgram amounts of DNA (Weising & Kahl1997). Microsatellites constitute a locus-specific, polymerasechain reaction (PCR)-based marker system that hasbecome an important tool for genome analysis in manyorganisms including plant-pathogenic fungi (e.g. Neu et al.1999; Tenzer et al. 1999). Here we report the developmentand characterization of 20 polymorphic microsatellitemarkers for Ascochyta rabiei.
Fungal DNA was isolated according to Geistlinger et al.(1997). To avoid sampling bias, four separate genomiclibraries were constructed from the US-American A. rabieiisolate ATCC76501 using the restriction enzymes AluI, RsaI,HaeI and SauIIIA, respectively. After digestion, DNA aliquots
MEC1052.fm Page 1939 Saturday, October 7, 2000 11:46 AM
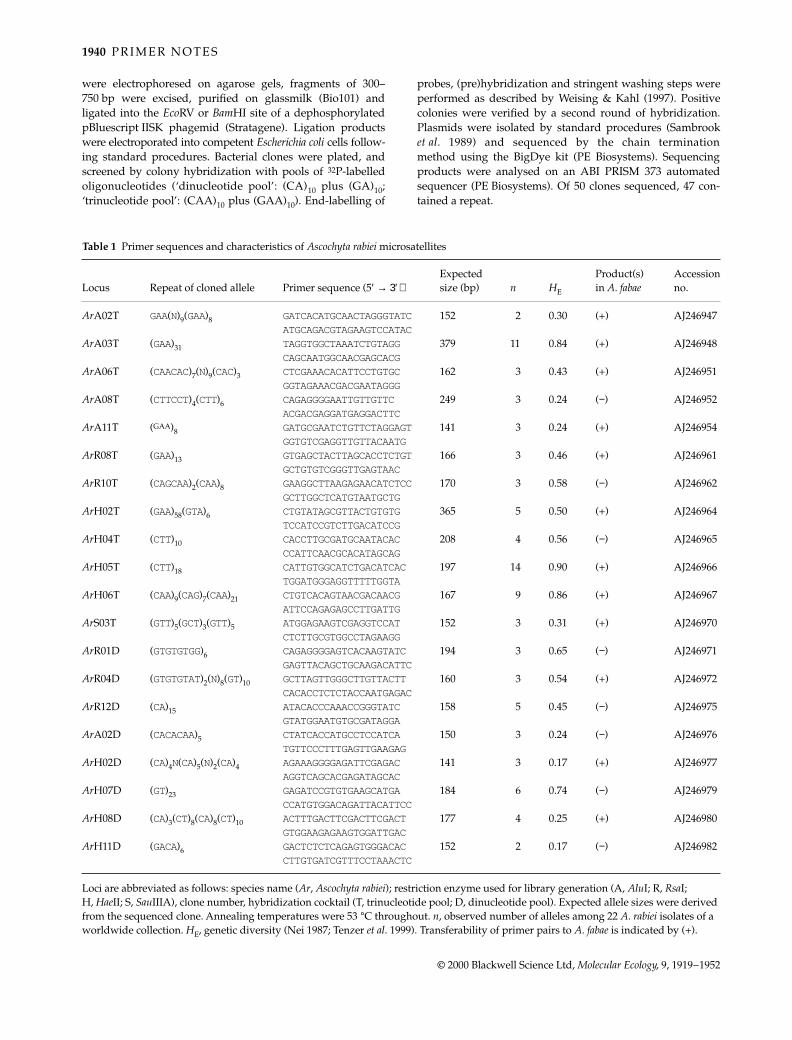
1940 P R I M E R N O T E S
© 2000 Blackwell Science Ltd, Molecular Ecology, 9, 1919–1952
were electrophoresed on agarose gels, fragments of 300–750 bp were excised, purified on glassmilk (Bio101) andligated into the EcoRV or BamHI site of a dephosphorylatedpBluescript IISK phagemid (Stratagene). Ligation productswere electroporated into competent Escherichia coli cells follow-ing standard procedures. Bacterial clones were plated, andscreened by colony hybridization with pools of 32P-labelledoligonucleotides (‘dinucleotide pool’: (CA)10 plus (GA)10;‘trinucleotide pool’: (CAA)10 plus (GAA)10). End-labelling of
probes, (pre)hybridization and stringent washing steps wereperformed as described by Weising & Kahl (1997). Positivecolonies were verified by a second round of hybridization.Plasmids were isolated by standard procedures (Sambrooket al. 1989) and sequenced by the chain terminationmethod using the BigDye kit (PE Biosystems). Sequencingproducts were analysed on an ABI PRISM 373 automatedsequencer (PE Biosystems). Of 50 clones sequenced, 47 con-tained a repeat.
Table 1 Primer sequences and characteristics of Ascochyta rabiei microsatellites
Locus Repeat of cloned allele Primer sequence (5′ → 3′)Expected size (bp) n HE
Product(s) in A. fabae
Accessionno.
ArA02T GAA(N)9(GAA)8 GATCACATGCAACTAGGGTATC 152 2 0.30 (+) AJ246947ATGCAGACGTAGAAGTCCATAC
ArA03T (GAA)31 TAGGTGGCTAAATCTGTAGG 379 11 0.84 (+) AJ246948CAGCAATGGCAACGAGCACG
ArA06T (CAACAC)7(N)9(CAC)3 CTCGAAACACATTCCTGTGC 162 3 0.43 (+) AJ246951GGTAGAAACGACGAATAGGG
ArA08T (CTTCCT)4(CTT)6 CAGAGGGGAATTGTTGTTC 249 3 0.24 (−) AJ246952ACGACGAGGATGAGGACTTC
ArA11T (GAA)8 GATGCGAATCTGTTCTAGGAGT 141 3 0.24 (+) AJ246954GGTGTCGAGGTTGTTACAATG
ArR08T (GAA)13 GTGAGCTACTTAGCACCTCTGT 166 3 0.46 (+) AJ246961GCTGTGTCGGGTTGAGTAAC
ArR10T (CAGCAA)2(CAA)8 GAAGGCTTAAGAGAACATCTCC 170 3 0.58 (−) AJ246962GCTTGGCTCATGTAATGCTG
ArH02T (GAA)58(GTA)6 CTGTATAGCGTTACTGTGTG 365 5 0.50 (+) AJ246964TCCATCCGTCTTGACATCCG
ArH04T (CTT)10 CACCTTGCGATGCAATACAC 208 4 0.56 (−) AJ246965CCATTCAACGCACATAGCAG
ArH05T (CTT)18 CATTGTGGCATCTGACATCAC 197 14 0.90 (+) AJ246966TGGATGGGAGGTTTTTGGTA
ArH06T (CAA)9(CAG)7(CAA)21 CTGTCACAGTAACGACAACG 167 9 0.86 (+) AJ246967ATTCCAGAGAGCCTTGATTG
ArS03T (GTT)5(GCT)3(GTT)5 ATGGAGAAGTCGAGGTCCAT 152 3 0.31 (+) AJ246970CTCTTGCGTGGCCTAGAAGG
ArR01D (GTGTGTGG)6 CAGAGGGGAGTCACAAGTATC 194 3 0.65 (−) AJ246971GAGTTACAGCTGCAAGACATTC
ArR04D (GTGTGTAT)2(N)8(GT)10 GCTTAGTTGGGCTTGTTACTT 160 3 0.54 (+) AJ246972CACACCTCTCTACCAATGAGAC
ArR12D (CA)15 ATACACCCAAACCGGGTATC 158 5 0.45 (−) AJ246975GTATGGAATGTGCGATAGGA
ArA02D (CACACAA)5 CTATCACCATGCCTCCATCA 150 3 0.24 (−) AJ246976TGTTCCCTTTGAGTTGAAGAG
ArH02D (CA)4N(CA)5(N)2(CA)4 AGAAAGGGGAGATTCGAGAC 141 3 0.17 (+) AJ246977AGGTCAGCACGAGATAGCAC
ArH07D (GT)23 GAGATCCGTGTGAAGCATGA 184 6 0.74 (−) AJ246979CCATGTGGACAGATTACATTCC
ArH08D (CA)3(CT)8(CA)8(CT)10 ACTTTGACTTCGACTTCGACT 177 4 0.25 (+) AJ246980GTGGAAGAGAAGTGGATTGAC
ArH11D (GACA)6 GACTCTCTCAGAGTGGGACAC 152 2 0.17 (−) AJ246982CTTGTGATCGTTTCCTAAACTC
Loci are abbreviated as follows: species name (Ar, Ascochyta rabiei); restriction enzyme used for library generation (A, AluI; R, RsaI; H, HaeII; S, SauIIIA), clone number, hybridization cocktail (T, trinucleotide pool; D, dinucleotide pool). Expected allele sizes were derived from the sequenced clone. Annealing temperatures were 53 °C throughout. n, observed number of alleles among 22 A. rabiei isolates of a worldwide collection. HE, genetic diversity (Nei 1987; Tenzer et al. 1999). Transferability of primer pairs to A. fabae is indicated by (+).
MEC1052.fm Page 1940 Saturday, October 7, 2000 11:46 AM
P R I M E R N O T E S 1941
© 2000 Blackwell Science Ltd, Molecular Ecology, 9, 1919–1952
Using the Primer 3 computer program (Rozen & Skaletsky1997), primers could be designed to microsatellite-flankingregions of 37 clones. PCR was performed in 25 µL volumescontaining 1.6 mm MgCl2, 0.2 mm dCTP, dGTP and dTTP,0.02 mm dATP, 0.06 µL [α32P]dATP, 75 mm Tris–HCl (pH 9),20 mm (NH4)2SO4, 0.01% Tween-20, 5 pmol of each primer,0.5 units Taq DNA polymerase (Eurogentec) and 10 ng of tem-plate DNA. After initial denaturation (95 °C, 20 s), PCR wasrun for 35 cycles (94 °C for 20 s, 53 °C for 25 s, 67 °C for 23 s)in a Perkin-Elmer 2400 thermocycler. Products were separatedon 6% sequencing gels and autoradiographed (Sambrooket al. 1989).
Primer functionality was initially tested on three A. rabieiisolates, and one isolate of A. fabae. Using an annealingtemperature of 53 °C, single bands of the expected sizewere obtained for 26 loci. Twenty-four primer pairs also ampli-fied one or more products from A. fabae. Whether thesefragments contain microsatellites and/or are polymorphicwithin A. fabae remains to be examined. Twenty markerloci were selected to genotype 22 A. rabiei isolates fromthe USA, Pakistan, Syria, Turkey and Tunisia. Each of theseconstituted a unique clonal lineage as defined by its finger-print haplotype (Geistlinger et al. 1997). The Popgenecomputer package (Yeh & Boyle 1997) was used to calculateallele frequencies and to determine Nei’s expected geneticdiversity valves for haploid organisms (Nei 1987; Tenzer et al.1999; Table 1). All loci were polymorphic, with 2–14 alleles andgenetic diversity values of 0.17–0.90.
With up to 14 alleles among 22 isolates, these micro-satellites are more variable than other types of molecularmarkers applied to A. rabiei. Locus-specific primers notonly ensure a high reproducibility of results, but also allowthe analysis of mixed samples. Groppe & Boller (1997) havespecifically amplified a microsatellite locus from the fungalendophyte Epichloe in the presence of contaminating hostDNA. Following a similar strategy, microsatellite markerscould be used to type A. rabiei isolates directly fromindividual lesions. The distribution of A. rabiei pathotypesin the field could then be monitored more efficiently,avoiding the lengthy procedures of single-sporing andculturing.
Acknowledgements
We acknowledge the support from the Gesellschaft für Tech-nische Zusammenarbeit (GTZ) (grant 89.7860.3-01.130).
References
Geistlinger J, Maqbool S, Kaiser WJ, Kahl G (1997) Detection ofmicrosatellite fingerprint markers and their Mendelianinheritance in Ascochyta rabiei. Mycological Research, 101, 1113–1121.
Groppe K, Boller T (1997) PCR assay based on a microsatellite-containing locus for detection and quantification of Epichloeendophytes in grass tissue. Applied and Environmental Microbiology,63, 1543–1550.
Nei M (1987) Molecular Evolutionary Genetics. Columbia UniversityPress, New York.
Neu C, Kaemmer D, Kahl G, Fischer D, Weising K (1999)Polymorphic microsatellite markers for the banana pathogenMycosphaerella fijiensis. Molecular Ecology, 8, 523–525.
Rozen S, Skaletsky HJ (1997) PRIMER 3. Available at http://www-genome.wi.mit.edu/genome_software/other/primer3.html
Sambrook J, Fritsch EF, Maniatis T (1989) Molecular Cloning.A Laboratory Manual. Cold Spring Harbor Laboratory Press,Cold Spring Harbor, New York.
Tenzer I, Ivanissevich S, Morgante M, Gessler C (1999) Identifica-tion of microsatellite markers and their application to populationgenetics of Venturia inaequalis. Phytopathology, 89, 748–753.
Udupa SM, Weigand F, Saxena MC, Kahl G (1998) Genotypingwith RAPD and microsatellite markers resolves pathotypediversity in the ascochyta blight pathogen of chickpea. Theoreticaland Applied Genetics, 97, 299–307.
Weising K, Kahl G (1997) Hybridization-based microsatellite finger-printing of plants and fungi. In: DNA Markers: Protocols,Applications and Overviews (eds Caetano-Anollés G, GresshoffP), pp. 27–54. Wiley & Sons, New York.
Yeh FC, Boyle T (1997) Popgene, Version 1.2. Available at http://www.cgiar.org/cifor/research/projects/project6-2/popgene.html
91120001094PRIMER NOTESPRIMER NOTESPRIMER NOTES0000Graphicraft Limited, Hong Kong
Polymorphic microsatellites in the blue tit Parus caeruleus and their cross-species utility in 20 songbird families
DEBORAH A. DAWSON,* OLIVIER HANOTTE,† CAROLYN GREIG,‡ IAN R. K . STEWART* and TERRY BURKE*
Department of Biology, University of Leicester, Leicester LE1 7RH, UK
Keywords: blue tit, microsatellite, Paridae, passerine, PCR, primer
Received 31 March 2000; revision accepted 2 July 2000
Correspondence: T. Burke. Fax: +44 114 222 0002; E-mail: [email protected] addresses: *Department of Animal and Plant Sciences, University of Sheffield, Sheffield, S10 2TN, UK; †International Livestock Research Institute, PO Box 30709 Nairobi, Kenya; ‡Bodega Marine Laboratory, University of California Davis, PO Box 247, 2099 Westside Road, Bodega Bay, CA 94923, USA
The blue tit, Parus caeruleus, is a hole-nesting woodlandbird that has been the focus of numerous ecological andbehavioural studies. Nine polymorphic blue tit minisatelliteloci have previously been cloned in our laboratory (Verheyenet al. 1994). We have now cloned a series of polymorphicmicrosatellite loci in this species and also tested their utilityin a wide range of other oscine passerine birds.
DNA was extracted according to the method described byBruford et al. (1998). A genomic library was prepared, enrichedfor (CA)n, (GA)n and (AT)n, as described by Armour et al. (1994)using modifications suggested by Gibbs et al. (1997). Detailsof the eight characterized loci are provided in Table 1.
Each 15-µL PCR reaction contained 20–50 ng of DNA, 0.5 µmof each primer, 2.5 mm MgCl2 (except Pca3 and Pca8 whichrequired 3.0 mm MgCl2), 0.1 mm of each dNTP and 0.25 unitsof Taq DNA polymerase (Thermoprime Plus, Advanced Bio-technologies) in the PCR buffer (final concentration: 20 mm(NH4)2SO4, 75 mm Tris–HCl pH 8.8, 0.15 mg/mL DNAase-free
MEC1052.fm Page 1941 Saturday, October 7, 2000 11:46 AM
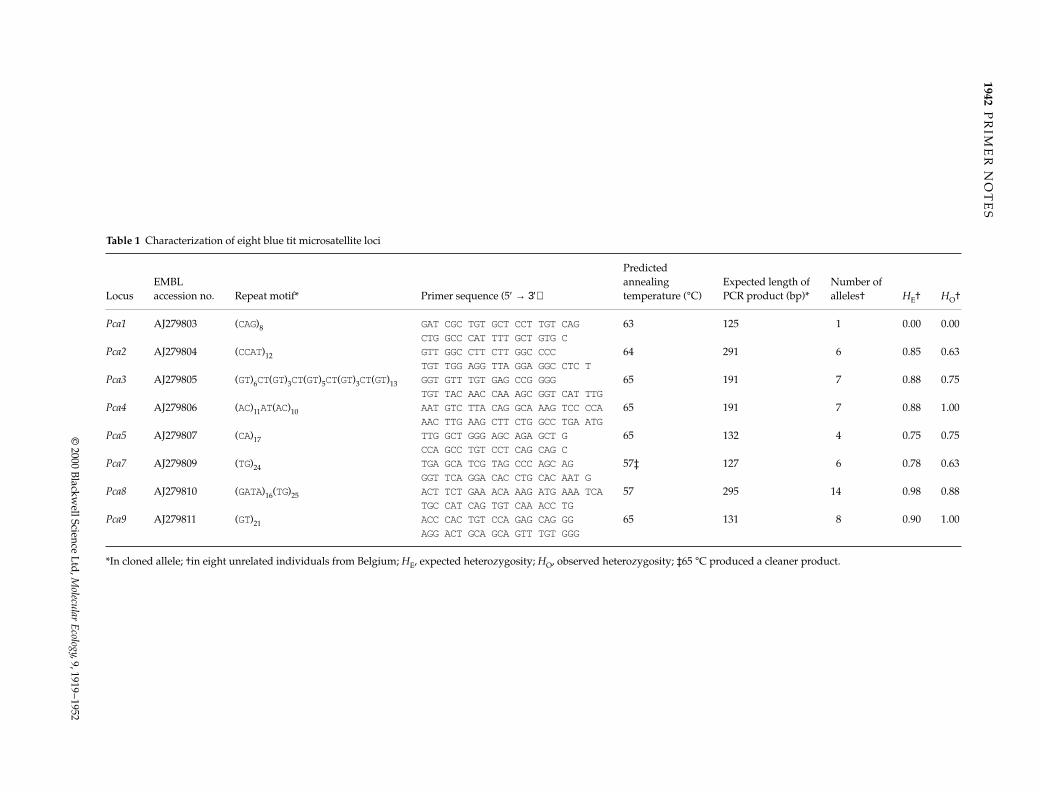
1942P
RIM
ER
NO
TE
S
© 2000 B
lackwell Science L
td, M
olecular Ecology, 9, 1919–1952
Table 1 Characterization of eight blue tit microsatellite loci
LocusEMBL accession no. Repeat motif* Primer sequence (5′ → 3′)
Predicted annealing temperature (°C)
Expected length ofPCR product (bp)*
Number ofalleles† HE† HO†
Pca1 AJ279803 (CAG)8 GAT CGC TGT GCT CCT TGT CAG 63 125 1 0.00 0.00CTG GCC CAT TTT GCT GTG C
Pca2 AJ279804 (CCAT)12 GTT GGC CTT CTT GGC CCC 64 291 6 0.85 0.63TGT TGG AGG TTA GGA GGC CTC T
Pca3 AJ279805 (GT)6CT(GT)3CT(GT)5CT(GT)3CT(GT)13 GGT GTT TGT GAG CCG GGG 65 191 7 0.88 0.75TGT TAC AAC CAA AGC GGT CAT TTG
Pca4 AJ279806 (AC)11AT(AC)10 AAT GTC TTA CAG GCA AAG TCC CCA 65 191 7 0.88 1.00AAC TTG AAG CTT CTG GCC TGA ATG
Pca5 AJ279807 (CA)17 TTG GCT GGG AGC AGA GCT G 65 132 4 0.75 0.75CCA GCC TGT CCT CAG CAG C
Pca7 AJ279809 (TG)24 TGA GCA TCG TAG CCC AGC AG 57‡ 127 6 0.78 0.63GGT TCA GGA CAC CTG CAC AAT G
Pca8 AJ279810 (GATA)16(TG)25 ACT TCT GAA ACA AAG ATG AAA TCA 57 295 14 0.98 0.88TGC CAT CAG TGT CAA ACC TG
Pca9 AJ279811 (GT)21 ACC CAC TGT CCA GAG CAG GG 65 131 8 0.90 1.00AGG ACT GCA GCA GTT TGT GGG
*In cloned allele; †in eight unrelated individuals from Belgium; HE, expected heterozygosity; HO, observed heterozygosity; ‡65 °C produced a cleaner product.
ME
C1052.fm
Page 1942 S
aturday, October 7, 2000 11:46 A
M
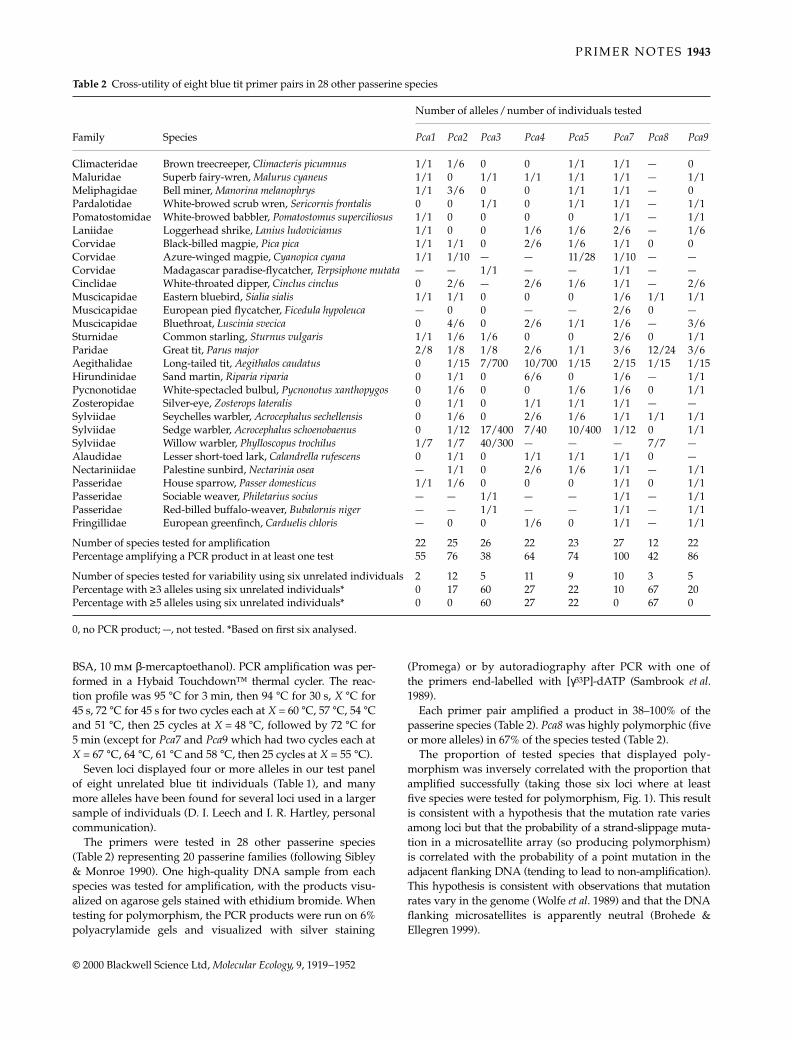
P R I M E R N O T E S 1943
© 2000 Blackwell Science Ltd, Molecular Ecology, 9, 1919–1952
BSA, 10 mm β-mercaptoethanol). PCR amplification was per-formed in a Hybaid Touchdown™ thermal cycler. The reac-tion profile was 95 °C for 3 min, then 94 °C for 30 s, X °C for45 s, 72 °C for 45 s for two cycles each at X = 60 °C, 57 °C, 54 °Cand 51 °C, then 25 cycles at X = 48 °C, followed by 72 °C for5 min (except for Pca7 and Pca9 which had two cycles each atX = 67 °C, 64 °C, 61 °C and 58 °C, then 25 cycles at X = 55 °C).
Seven loci displayed four or more alleles in our test panelof eight unrelated blue tit individuals (Table 1), and manymore alleles have been found for several loci used in a largersample of individuals (D. I. Leech and I. R. Hartley, personalcommunication).
The primers were tested in 28 other passerine species(Table 2) representing 20 passerine families (following Sibley& Monroe 1990). One high-quality DNA sample from eachspecies was tested for amplification, with the products visu-alized on agarose gels stained with ethidium bromide. Whentesting for polymorphism, the PCR products were run on 6%polyacrylamide gels and visualized with silver staining
(Promega) or by autoradiography after PCR with one ofthe primers end-labelled with [γ33P]-dATP (Sambrook et al.1989).
Each primer pair amplified a product in 38–100% of thepasserine species (Table 2). Pca8 was highly polymorphic (fiveor more alleles) in 67% of the species tested (Table 2).
The proportion of tested species that displayed poly-morphism was inversely correlated with the proportion thatamplified successfully (taking those six loci where at leastfive species were tested for polymorphism, Fig. 1). This resultis consistent with a hypothesis that the mutation rate variesamong loci but that the probability of a strand-slippage muta-tion in a microsatellite array (so producing polymorphism)is correlated with the probability of a point mutation in theadjacent flanking DNA (tending to lead to non-amplification).This hypothesis is consistent with observations that mutationrates vary in the genome (Wolfe et al. 1989) and that the DNAflanking microsatellites is apparently neutral (Brohede &Ellegren 1999).
Table 2 Cross-utility of eight blue tit primer pairs in 28 other passerine species
Number of alleles/number of individuals tested
Family Species Pca1 Pca2 Pca3 Pca4 Pca5 Pca7 Pca8 Pca9
Climacteridae Brown treecreeper, Climacteris picumnus 1/1 1/6 0 0 1/1 1/1 — 0Maluridae Superb fairy-wren, Malurus cyaneus 1/1 0 1/1 1/1 1/1 1/1 — 1/1Meliphagidae Bell miner, Manorina melanophrys 1/1 3/6 0 0 1/1 1/1 — 0Pardalotidae White-browed scrub wren, Sericornis frontalis 0 0 1/1 0 1/1 1/1 — 1/1Pomatostomidae White-browed babbler, Pomatostomus superciliosus 1/1 0 0 0 0 1/1 — 1/1Laniidae Loggerhead shrike, Lanius ludovicianus 1/1 0 0 1/6 1/6 2/6 — 1/6Corvidae Black-billed magpie, Pica pica 1/1 1/1 0 2/6 1/6 1/1 0 0Corvidae Azure-winged magpie, Cyanopica cyana 1/1 1/10 — — 11/28 1/10 — —Corvidae Madagascar paradise-flycatcher, Terpsiphone mutata — — 1/1 — — 1/1 — —Cinclidae White-throated dipper, Cinclus cinclus 0 2/6 — 2/6 1/6 1/1 — 2/6Muscicapidae Eastern bluebird, Sialia sialis 1/1 1/1 0 0 0 1/6 1/1 1/1Muscicapidae European pied flycatcher, Ficedula hypoleuca — 0 0 — — 2/6 0 —Muscicapidae Bluethroat, Luscinia svecica 0 4/6 0 2/6 1/1 1/6 — 3/6Sturnidae Common starling, Sturnus vulgaris 1/1 1/6 1/6 0 0 2/6 0 1/1Paridae Great tit, Parus major 2/8 1/8 1/8 2/6 1/1 3/6 12/24 3/6Aegithalidae Long-tailed tit, Aegithalos caudatus 0 1/15 7/700 10/700 1/15 2/15 1/15 1/15Hirundinidae Sand martin, Riparia riparia 0 1/1 0 6/6 0 1/6 — 1/1Pycnonotidae White-spectacled bulbul, Pycnonotus xanthopygos 0 1/6 0 0 1/6 1/6 0 1/1Zosteropidae Silver-eye, Zosterops lateralis 0 1/1 0 1/1 1/1 1/1 — —Sylviidae Seychelles warbler, Acrocephalus sechellensis 0 1/6 0 2/6 1/6 1/1 1/1 1/1Sylviidae Sedge warbler, Acrocephalus schoenobaenus 0 1/12 17/400 7/40 10/400 1/12 0 1/1Sylviidae Willow warbler, Phylloscopus trochilus 1/7 1/7 40/300 — — — 7/7 —Alaudidae Lesser short-toed lark, Calandrella rufescens 0 1/1 0 1/1 1/1 1/1 0 —Nectariniidae Palestine sunbird, Nectarinia osea — 1/1 0 2/6 1/6 1/1 — 1/1Passeridae House sparrow, Passer domesticus 1/1 1/6 0 0 0 1/1 0 1/1Passeridae Sociable weaver, Philetarius socius — — 1/1 — — 1/1 — 1/1Passeridae Red-billed buffalo-weaver, Bubalornis niger — — 1/1 — — 1/1 — 1/1Fringillidae European greenfinch, Carduelis chloris — 0 0 1/6 0 1/1 — 1/1
Number of species tested for amplification 22 25 26 22 23 27 12 22Percentage amplifying a PCR product in at least one test 55 76 38 64 74 100 42 86
Number of species tested for variability using six unrelated individuals 2 12 5 11 9 10 3 5Percentage with ≥3 alleles using six unrelated individuals* 0 17 60 27 22 10 67 20Percentage with ≥5 alleles using six unrelated individuals* 0 0 60 27 22 0 67 0
0, no PCR product; —, not tested. *Based on first six analysed.
MEC1052.fm Page 1943 Saturday, October 7, 2000 11:46 AM
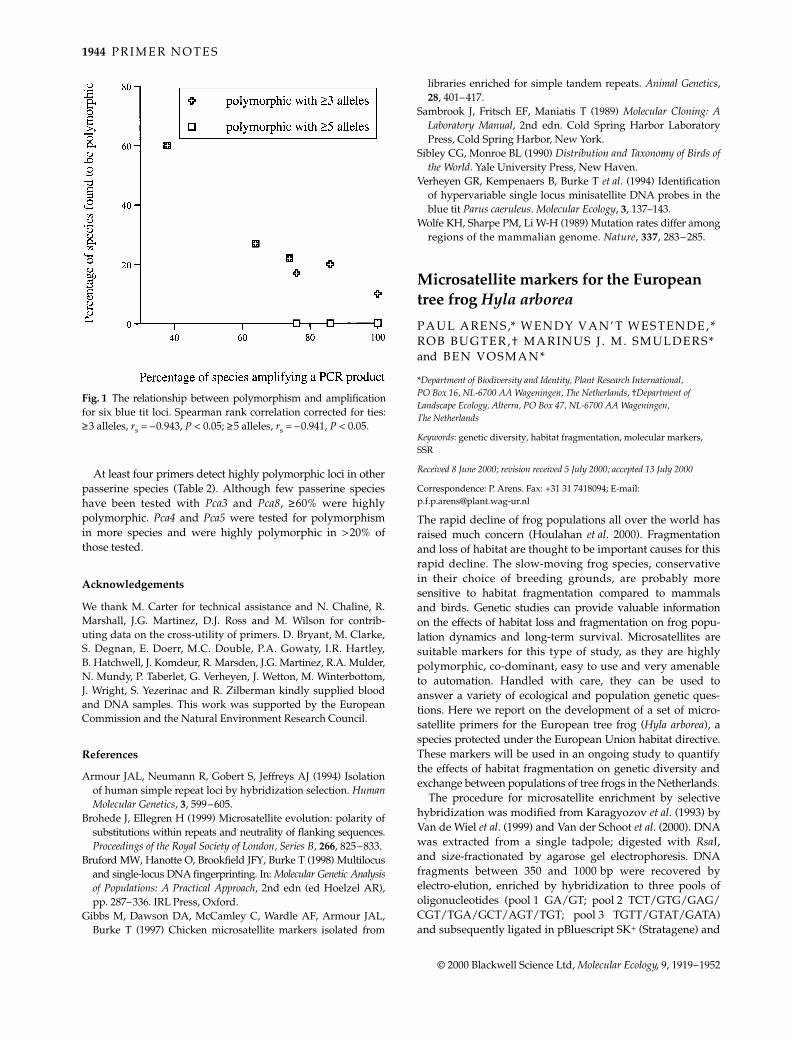
1944 P R I M E R N O T E S
© 2000 Blackwell Science Ltd, Molecular Ecology, 9, 1919–1952
At least four primers detect highly polymorphic loci in otherpasserine species (Table 2). Although few passerine specieshave been tested with Pca3 and Pca8, ≥60% were highlypolymorphic. Pca4 and Pca5 were tested for polymorphismin more species and were highly polymorphic in >20% ofthose tested.
Acknowledgements
We thank M. Carter for technical assistance and N. Chaline, R.Marshall, J.G. Martinez, D.J. Ross and M. Wilson for contrib-uting data on the cross-utility of primers. D. Bryant, M. Clarke,S. Degnan, E. Doerr, M.C. Double, P.A. Gowaty, I.R. Hartley,B. Hatchwell, J. Komdeur, R. Marsden, J.G. Martinez, R.A. Mulder,N. Mundy, P. Taberlet, G. Verheyen, J. Wetton, M. Winterbottom,J. Wright, S. Yezerinac and R. Zilberman kindly supplied bloodand DNA samples. This work was supported by the EuropeanCommission and the Natural Environment Research Council.
References
Armour JAL, Neumann R, Gobert S, Jeffreys AJ (1994) Isolationof human simple repeat loci by hybridization selection. HumanMolecular Genetics, 3, 599–605.
Brohede J, Ellegren H (1999) Microsatellite evolution: polarity ofsubstitutions within repeats and neutrality of flanking sequences.Proceedings of the Royal Society of London, Series B, 266, 825–833.
Bruford MW, Hanotte O, Brookfield JFY, Burke T (1998) Multilocusand single-locus DNA fingerprinting. In: Molecular Genetic Analysisof Populations: A Practical Approach, 2nd edn (ed Hoelzel AR),pp. 287–336. IRL Press, Oxford.
Gibbs M, Dawson DA, McCamley C, Wardle AF, Armour JAL,Burke T (1997) Chicken microsatellite markers isolated from
libraries enriched for simple tandem repeats. Animal Genetics,28, 401–417.
Sambrook J, Fritsch EF, Maniatis T (1989) Molecular Cloning: ALaboratory Manual, 2nd edn. Cold Spring Harbor LaboratoryPress, Cold Spring Harbor, New York.
Sibley CG, Monroe BL (1990) Distribution and Taxonomy of Birds ofthe World. Yale University Press, New Haven.
Verheyen GR, Kempenaers B, Burke T et al. (1994) Identificationof hypervariable single locus minisatellite DNA probes in theblue tit Parus caeruleus. Molecular Ecology, 3, 137–143.
Wolfe KH, Sharpe PM, Li W-H (1989) Mutation rates differ amongregions of the mammalian genome. Nature, 337, 283–285.
91120001095PRIMER NOTESPRIMER NOTESPRIMER NOTES0000Graphicraft Limited, Hong Kong
Microsatellite markers for the European tree frog Hyla arborea
PAUL ARENS,* WENDY VAN’T WESTENDE,* ROB BUGTER,† MARINUS J . M. SMULDERS* and BEN VOSMAN*
*Department of Biodiversity and Identity, Plant Research International, PO Box 16, NL-6700 AA Wageningen, The Netherlands, †Department of Landscape Ecology, Alterra, PO Box 47, NL-6700 AA Wageningen, The Netherlands
Keywords: genetic diversity, habitat fragmentation, molecular markers, SSR
Received 8 June 2000; revision received 5 July 2000; accepted 13 July 2000
Correspondence: P. Arens. Fax: +31 31 7418094; E-mail: [email protected]
The rapid decline of frog populations all over the world hasraised much concern (Houlahan et al. 2000). Fragmentationand loss of habitat are thought to be important causes for thisrapid decline. The slow-moving frog species, conservativein their choice of breeding grounds, are probably moresensitive to habitat fragmentation compared to mammalsand birds. Genetic studies can provide valuable informationon the effects of habitat loss and fragmentation on frog popu-lation dynamics and long-term survival. Microsatellites aresuitable markers for this type of study, as they are highlypolymorphic, co-dominant, easy to use and very amenableto automation. Handled with care, they can be used toanswer a variety of ecological and population genetic ques-tions. Here we report on the development of a set of micro-satellite primers for the European tree frog (Hyla arborea), aspecies protected under the European Union habitat directive.These markers will be used in an ongoing study to quantifythe effects of habitat fragmentation on genetic diversity andexchange between populations of tree frogs in the Netherlands.
The procedure for microsatellite enrichment by selectivehybridization was modified from Karagyozov et al. (1993) byVan de Wiel et al. (1999) and Van der Schoot et al. (2000). DNAwas extracted from a single tadpole; digested with RsaI,and size-fractionated by agarose gel electrophoresis. DNAfragments between 350 and 1000 bp were recovered byelectro-elution, enriched by hybridization to three pools ofoligonucleotides (pool 1 GA/GT; pool 2 TCT/GTG/GAG/CGT/TGA/GCT/AGT/TGT; pool 3 TGTT/GTAT/GATA)and subsequently ligated in pBluescript SK+ (Stratagene) and
Fig. 1 The relationship between polymorphism and amplificationfor six blue tit loci. Spearman rank correlation corrected for ties:≥3 alleles, rs = –0.943, P < 0.05; ≥5 alleles, rs = –0.941, P < 0.05.
MEC1052.fm Page 1944 Saturday, October 7, 2000 11:46 AM

PR
IME
R N
OT
ES
1945
© 2000 B
lackwell Science L
td, M
olecular Ecology, 9, 1919–1952
Table 1 Characterization of Hyla arborea microsatellite markers and their products
Microsatellite locus Repeat*Predicted product length (bp) Primer sequences (forward, reverse)
PCR conditions†
Number of alleles (bp)
Allelicrange HO/HE
EMBL number
WHA1–9§ (CA)20 144 5′-CGTTTGGACGTGATGCTG-3′ 60NP 5 126–136 0.75/0.76 AJ4039855′-GAGGAGTTTCTTCACAAGGGG-3′
WHA1–20§ (GT)18 194 5′-GTCCCTTCCTGAATAAGTGTCG-3′ 55NP 3 189–193 0.67/0.57 AJ4039865′-CCATTCCCTCCTGGCTTT-3′
WHA1–25§ (GT)20 109 5′-AAGAATCTGCCGCAAAGAAG-3′ 55NP 4 111–117 0.83/0.74 AJ4039875′-TAGGAAGGGACAGGAGGTCA -3′
WHA1–54 (CA)19 144 5′-CCTGGTCATGCTACACGCTA-3′ 60NP 2‡ 129–145 0.00/0.21 AJ4039885′-GACAACAACCCCCAATAATCC -3′
WHA1–60 (GT)22 165 5′-TAGGTCATGTATAGCCTGTT-3′ 55LP 7 153–169 0.67/0.85 AJ4039895′-TCTGTTTACTTCAGGGGT-3′
WHA1–61 (TG)7 ... (AT)6 149 5′-CAGGTCCAAGCTCTCTCCC-3′ 60LP 2‡ 142–150 0.08/0.16 AJ4039905′-GCACATTCACATTATATAGACAACACA-3′
WHA1–67§ (CA)21 214 5′-GCTTTACACATGGGGGTAT-3′ 55LP 6 202–226 0.50/0.78 AJ4039915′-CACTCCTTTTAGAGTATGTTGTTG-3′
WHA1–103§ (GT)21 234 5′-CAAAGTGACAATGTGGGGTCTCAT-3′ 60NP 4 230–244 1.00/0.80 AJ4039925′-ATAGCATCAAATCCAGCCGTAGG-3′
WHA1–104 (GT)22 291 5′-ACTTGGGACAGCCAGTATGTTTT-3′ 60NP 5 264–292 0.50/0.74 AJ4039935′-TGAGCTGGTGGGTATAACCTAAC-3′
WHA1–133 (CA)24–1 185 5′-ATGCCCCTCATAGAACACATACAA-3′ 55LP 2‡ 145–157 0.08/0.08 AJ4039945′-GGGCTGCGGGTACAGTAGTG -3′
WHA1–140§ (GT)25 123 5′-ATGTGCCATAGAAATGAAGG-3′ 55NP 6 112–132 0.67/0.76 AJ4039955′-AGGCTTGCTGCTATTATGTC -3′
WHA5–22A (CAA)6 ... (CAG)6 244 5′-TTACAGCAACAGCAAATGG-3′ 50NP 2 235–241 0.42/0.34 AJ4039965′-ATCAGGGACTGGGTCTGT-3′
WHA5–29 (ACC)74–20 332 5′-TTCATCCATTCTCATCTCTTCTCA-3′ 60LP 2‡ 330–336 0.00/0.16 AJ4039975′-ACATGGGGCCCTTCTACC-3′
WHA5–57 (GGT)6 260 5′-TTGTCCTGACATGCACACCT -3′ 60LP 2 262–332 0.00/0.29 AJ4039985′-CGTGTCTAACCCCAGCTCAT-3′
WHA5–201 (CAC)13–1 ... (CAC)8–1 248 5′-TCATGGACTGTCGTCATGGT-3′ 60LP 4 238–247 0.42/0.56 AJ4039995′-AGGTAAATGGAATCTGGGTGTG-3′
*Stretches shorter than five repeats have not been taken into account; ‘—’ denotes mismatch. †50, 55 or 60: annealing temperature; NP (normal programme): 3 min at 94 °C, 35 cycles (15 s at 94 °C, 45 s at the annealing temperature, 60 s at 72 °C), then 20 min at 72 °C or LP (long programme): 3 min at 94 °C, 35 cycles (45 s at 94 °C, 45 s at the annealing temperature, 105 s at 72 °C), then 20 min at 72 °C, using a Hybaid Touchdown cycler. ‡Only polymorphic between Dutch and Croatian samples. §Label on forward primer is recommended to simplify patterns and thus scorability.
ME
C1052.fm
Page 1945 S
aturday, October 7, 2000 11:46 A
M
1946 P R I M E R N O T E S
© 2000 Blackwell Science Ltd, Molecular Ecology, 9, 1919–1952
transformed to E. coli DH5α (Life Technologies). Colonies weretransferred onto Hybond N+ membranes and screened byhybridization to a mixture of the appropriate oligonucleotides.Two hundred positive clones (25% of the total number) wereobtained, of which 130 were sequenced using a Taq DyeDeoxyTerminator Cycle Sequencing Kit and an ABI 377 sequencer(PE Biosystems). About 30% of the sequences contained longcompound microsatellites interspersed with stretches of non-repeat DNA forming mini-satellite types of arrays. Similarresults were also obtained for Rana arvalis microsatellites(Arens et al., unpublished data); this contrasts to other animalspecies (Chorthippus parallelus and Metrioptera brachyptera) andplant species (Populus nigra, Ilex aquifolium and Maianthemumbifolium) where microsatellites were isolated in a similar way(unpublished data). In particular, (GAT) motifs were foundin these kinds of arrays, forming 16% of the trinucleotide-enriched clones (for typical examples, see EMBL accessionnumbers AJ400838 and AJ400839). Primers were designedusing the software package Primer 0.5 (Whitehead Institutefor Biomedical Research). In total, 37 primer pairs were testedon a set of 12 randomly chosen individuals from differentpopulations from the east of the Netherlands and one indi-vidual from Croatia. Initial amplification was performedin 20 µL containing 75 mm Tris–HCl pH 9.0,1.5 mm MgCl2,20 mm (NH4)2SO4, 0.01% (w/v) Tween-20, 100 µm of eachdNTP, 200 nm of each primer, 16 ng template DNA and0.1 unit Goldstar DNA polymerase (Eurogentec). Raisingthe MgCl2 concentration to 1.75 mm was necessary to pre-vent frequent sample drop-out for most microsatellite loci.Products were separated on a 6% denaturing acrylamidegel. After visualization with silver staining (SilverSequence, Promega), the patterns were analysed for thepresence of polymorphisms and the quality of the bandingpattern according to Smulders et al. (1997). Only patternsof quality 1 (weak or no stutter bands, well-scorable) orquality 2 (‘stutter’ bands present, but product still scorable)are amenable for use in population studies. In total, 15 H.arborea microsatellite loci were found to produce unambi-guously scorable products (Table 1). Only 11 loci were foundto be polymorphic among the 12 Dutch samples. Animalsfrom the test set belong to Dutch populations that mayhave gone through a bottleneck, as low numbers of animalswithin these populations were counted some 30–40 yearsago. Higher numbers of alleles per locus might be expectedin populations elsewhere. Since inter-species amplificationof microsatellites within Hyla and Rana species is very limited(Call & Hallett 1998; our personal observations), develop-ment of microsatellite markers for individual species isnecessary. This set of microsatellite loci will provide valuablemarkers for population genetic and ecological studies in theEuropean tree frog.
Acknowledgements
We would like to thank Eduard Kletec̆ki (Croatian NaturalHistory Museum, Zagreb) for providing the Croatian sample.The Ministry of Agriculture, Nature Management and Fisher-ies funded this work through a Wageningen University andResearch Centre expertise development program.
References
Call DR, Hallett JG (1998) PCR primers for microsatellite loci inthe anurans Rana luteiventris and Hyla regilla. Molecular Ecology,7, 1085–1087.
Houlahan JE, Findlay CS, Benedict RS, Meyer AH, Kuzmin SL(2000) Quantitative evidence for global amphibian populationdeclines. Nature, 404, 752–755.
Karagyozov L, Kalcheva ID, Chapman M (1993) Construction ofrandom small-insert genomic libraries highly enriched for simplesequence repeats. Nucleic Acids Research, 21, 3911–3912.
Smulders MJM, Bredemeijer G, Rus-Kortekaas W, Arens P,Vosman B (1997) Use of short microsatellites from databasesequences to generate polymorphisms among Lycopersiconesculentum cultivars and accessions of other Lycopersiconspecies. Theoretical and Applied Genetics, 94, 264–272.
Van der Schoot J, Pospízková M, Vosman B, Smulders MJM (2000)Development and characterisation of microsatellite markers inblack poplar (Populus nigra L.). Theoretical and Applied Genetics,101, 317–322.
Van de Wiel C, Arens P, Vosman B (1999) Microsatellite retrievalin lettuce (Lactuca sativa L.). Genome, 42, 139–149.
91120001096PRIMER NOTESPRIMER NOTESPRIMER NOTES0000Graphicraft Limited, Hong Kong
Isolation and characterization of microsatellite loci in smallmouth bass, Micropterus dolomieu (Teleostei: Centrarchidae), and cross-species amplification in spotted bass, M. punctulatusT. P. MALLOY, JR , R . A. VAN DEN BUSSCHE, W. D. COUGHLIN and A. A. ECHELLE
Oklahoma Cooperative Fish and Wildlife Research Unit, and Department of Zoology, Oklahoma State University, Stillwater, OK, USA 74078
Keywords: microsatellites, Micropterus dolomieu, PCR, primers, smallmouth bass
Received 23 May 2000; revision accepted 7 July 2000
Correspondence: A.A. Echelle, Department of Zoology, Oklahoma State University, Stillwater, OK 74078, USA. Fax: (405) 744 5006; E-mail: [email protected]
Members of the genus Micropterus are endemic to eastern andcentral North America. They have high economic importancein these areas as game fish, which has resulted in extensiveintroduction of species and within-species stocks outside theirnative ranges. Allozyme data indicated that most of the geneticdiversity within smallmouth bass, Micropterus dolomieu, iscentred in the Interior Highlands region of North America andthat populations in the remainder of the native range of thespecies, northward into Canada and eastward into the EasternHighlands, contributed little to the genetic diversity of thespecies (Stark & Echelle 1998). Recent introductions of non-native M. dolomieu into reservoirs in the Interior Highlandsregion have created the need for multiple intraspecific markersto assess effects of introductions on native populations.We report here the isolation and characterization of 11 poly-morphic microsatellite loci in M. dolomieu and the successful
MEC1052.fm Page 1946 Saturday, October 7, 2000 11:46 AM
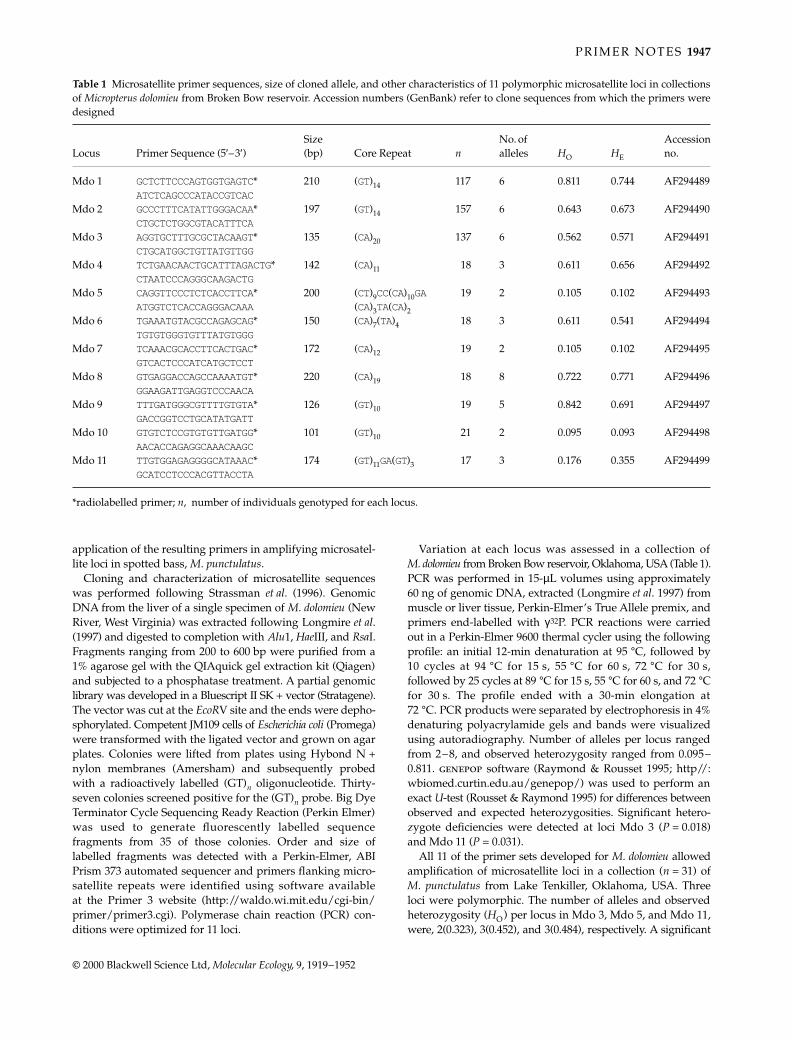
P R I M E R N O T E S 1947
© 2000 Blackwell Science Ltd, Molecular Ecology, 9, 1919–1952
application of the resulting primers in amplifying microsatel-lite loci in spotted bass, M. punctulatus.
Cloning and characterization of microsatellite sequenceswas performed following Strassman et al. (1996). GenomicDNA from the liver of a single specimen of M. dolomieu (NewRiver, West Virginia) was extracted following Longmire et al.(1997) and digested to completion with Alu1, HaeIII, and RsaI.Fragments ranging from 200 to 600 bp were purified from a1% agarose gel with the QIAquick gel extraction kit (Qiagen)and subjected to a phosphatase treatment. A partial genomiclibrary was developed in a Bluescript II SK + vector (Stratagene).The vector was cut at the EcoRV site and the ends were depho-sphorylated. Competent JM109 cells of Escherichia coli (Promega)were transformed with the ligated vector and grown on agarplates. Colonies were lifted from plates using Hybond N +nylon membranes (Amersham) and subsequently probedwith a radioactively labelled (GT)n oligonucleotide. Thirty-seven colonies screened positive for the (GT)n probe. Big DyeTerminator Cycle Sequencing Ready Reaction (Perkin Elmer)was used to generate fluorescently labelled sequencefragments from 35 of those colonies. Order and size oflabelled fragments was detected with a Perkin-Elmer, ABIPrism 373 automated sequencer and primers flanking micro-satellite repeats were identified using software availableat the Primer 3 website (http://waldo.wi.mit.edu/cgi-bin/primer/primer3.cgi). Polymerase chain reaction (PCR) con-ditions were optimized for 11 loci.
Variation at each locus was assessed in a collection ofM. dolomieu from Broken Bow reservoir, Oklahoma, USA (Table 1).PCR was performed in 15-µL volumes using approximately60 ng of genomic DNA, extracted (Longmire et al. 1997) frommuscle or liver tissue, Perkin-Elmer’s True Allele premix, andprimers end-labelled with γ32P. PCR reactions were carriedout in a Perkin-Elmer 9600 thermal cycler using the followingprofile: an initial 12-min denaturation at 95 °C, followed by10 cycles at 94 °C for 15 s, 55 °C for 60 s, 72 °C for 30 s,followed by 25 cycles at 89 °C for 15 s, 55 °C for 60 s, and 72 °Cfor 30 s. The profile ended with a 30-min elongation at72 °C. PCR products were separated by electrophoresis in 4%denaturing polyacrylamide gels and bands were visualizedusing autoradiography. Number of alleles per locus rangedfrom 2–8, and observed heterozygosity ranged from 0.095–0.811. genepop software (Raymond & Rousset 1995; http//:wbiomed.curtin.edu.au/genepop/) was used to perform anexact U-test (Rousset & Raymond 1995) for differences betweenobserved and expected heterozygosities. Significant hetero-zygote deficiencies were detected at loci Mdo 3 (P = 0.018)and Mdo 11 (P = 0.031).
All 11 of the primer sets developed for M. dolomieu allowedamplification of microsatellite loci in a collection (n = 31) ofM. punctulatus from Lake Tenkiller, Oklahoma, USA. Threeloci were polymorphic. The number of alleles and observedheterozygosity (HO) per locus in Mdo 3, Mdo 5, and Mdo 11,were, 2(0.323), 3(0.452), and 3(0.484), respectively. A significant
Table 1 Microsatellite primer sequences, size of cloned allele, and other characteristics of 11 polymorphic microsatellite loci in collectionsof Micropterus dolomieu from Broken Bow reservoir. Accession numbers (GenBank) refer to clone sequences from which the primers weredesigned
Locus Primer Sequence (5′–3′)Size (bp) Core Repeat n
No. of alleles HO HE
Accession no.
Mdo 1 GCTCTTCCCAGTGGTGAGTC* 210 (GT)14 117 6 0.811 0.744 AF294489ATCTCAGCCCATACCGTCAC
Mdo 2 GCCCTTTCATATTGGGACAA* 197 (GT)14 157 6 0.643 0.673 AF294490CTGCTCTGGCGTACATTTCA
Mdo 3 AGGTGCTTTGCGCTACAAGT* 135 (CA)20 137 6 0.562 0.571 AF294491CTGCATGGCTGTTATGTTGG
Mdo 4 TCTGAACAACTGCATTTAGACTG* 142 (CA)11 18 3 0.611 0.656 AF294492CTAATCCCAGGGCAAGACTG
Mdo 5 CAGGTTCCCTCTCACCTTCA* 200 (CT)9CC(CA)10GA 19 2 0.105 0.102 AF294493ATGGTCTCACCAGGGACAAA (CA)3TA(CA)2
Mdo 6 TGAAATGTACGCCAGAGCAG* 150 (CA)7(TA)4 18 3 0.611 0.541 AF294494TGTGTGGGTGTTTATGTGGG
Mdo 7 TCAAACGCACCTTCACTGAC* 172 (CA)12 19 2 0.105 0.102 AF294495GTCACTCCCATCATGCTCCT
Mdo 8 GTGAGGACCAGCCAAAATGT* 220 (CA)19 18 8 0.722 0.771 AF294496GGAAGATTGAGGTCCCAACA
Mdo 9 TTTGATGGGCGTTTTGTGTA* 126 (GT)10 19 5 0.842 0.691 AF294497GACCGGTCCTGCATATGATT
Mdo 10 GTGTCTCCGTGTGTTGATGG* 101 (GT)10 21 2 0.095 0.093 AF294498AACACCAGAGGCAAACAAGC
Mdo 11 TTGTGGAGAGGGGCATAAAC* 174 (GT)11GA(GT)3 17 3 0.176 0.355 AF294499GCATCCTCCCACGTTACCTA
*radiolabelled primer; n, number of individuals genotyped for each locus.
MEC1052.fm Page 1947 Saturday, October 7, 2000 11:46 AM
1948 P R I M E R N O T E S
© 2000 Blackwell Science Ltd, Molecular Ecology, 9, 1919–1952
heterozygote deficiency was detected at locus Mdo 11(P = 0.015). Our results indicate that microsatellite loci identi-fied from M. dolomieu may be useful with other species ofMicropterus.
Acknowledgements
The authors thank K. Brown, A.F. Echelle, J. Long, M. Scott, andD. Rutledge for assistance with tissue collection and S. Hoofer fortechnical laboratory assistance. We also thank personnel at theRecombinant DNA/Protein Resource Facility at Oklahoma StateUniversity for DNA sequencing and primer synthesis. Fundingwas provided by the Federal Aid in Sport Fish Restoration Actunder Project F-41-R of the Oklahoma Department of WildlifeConservation. The Oklahoma Cooperative Fish and WildlifeResearch Unit is a cooperative program of the United StatesGeological Survey (Biological Resources Division), the OklahomaDepartment of Wildlife Conservation, and Oklahoma StateUniversity.
References
Longmire JL, Maltbie M, Baker RJ (1997) Use of ‘Lysis Buffer’ inDNA isolation and its implication for museum collections.Occasional Papers, Museum, Texas Tech University, 163, 1–3.
Raymond M, Rousset F (1995) genepop (Version 1.2): a popu-lation genetics software for exact tests and ecumenicism. Journalof Heredity, 86, 248–249.
Rousset F, Raymond M (1995) Testing heterozygote excess anddeficiency. Genetics, 140, 1413–1419.
Stark WJ, Echelle AA (1998) Genetic structure and systematicsof smallmouth bass, with emphasis on Interior Highlandspopulations. Transactions of the American Fisheries Society, 127,393–416.
Strassman JE, Solis CR, Peters JM, Queller DC (1996) Strategiesfor finding and using highly polymorphic DNA micro-satellite loci for studies of genetic relatedness and pedigrees.In: Molecular Zoology: Advances, Strategies, and Protocols(eds Ferraris JD, Palumbi SR), pp. 163–180. Wiley-Liss, Inc,New York.
91120001097PRIMER NOTESPRIMER NOTESPRIMER NOTES0000Graphicraft Limited, Hong Kong
Isolation of microsatellite markers from the Adonis blue butterfly (Lysandra bellargus)G. L . HARPER, S . P IYAPATTANAKORN, D. GOULSON and N. MACLEAN
School of Biological Sciences, Southampton University, Biomedical Sciences Building, Bassett Crescent East, Southampton SO16 7PX, UK
Keywords: Lycaenidae, Lysandra bellargus, microsatellites, PCR
Received 25 June 2000; revision accepted 18 July 2000
Correspondence: G.L. Harper. Fax: +44 (0) 23 80594269; E-mail: [email protected]
The adonis blue butterfly, Lysandra bellargus, is at the northernedge of its range in the UK. A series of discontinuous meta-populations are found in Southern England on south-facing
calcareous grassland. The butterfly is extremely sensitive tohabitat and climatic change, as exemplified by its severe declinefollowing a drought in 1976 (Thomas 1983). Details concerningthe population dynamics of the butterfly are available fromvarious UK conservation bodies, making the butterfly idealfor studies investigating the relationships between spatialand temporal population structure and genetic diversity.
Microsatellites are currently the favoured marker for studiesof intra-specific genetic variation. However, their isolationfrom Lepidoptera is unusually difficult, and to date veryfew studies have successfully used microsatellite markers inthis insect group (e.g. Meglecz et al. 1998; Saccheri et al. 1998;Keyghobadi et al. 1999).
Other studies have applied a genomic library approachto the isolation of lepidopteran microsatellites, with limitedsuccess (e.g. Keyghobadi et al. 1999; Meglecz & Solignac 1998).Here we describe use of an enriched genomic library con-structed for CA/GT dinucleotide repeats. Fragments of300–700 bp were isolated from MboI-digested genomic DNA, ofwhich 3 µg was ligated to 9 µg of MboI adaptor molecule (seeKandpal et al. 1994). The ligated product was PCR-amplifiedin a 50 µL reaction, using a single adaptor oligonucleotide asa primer. The reaction mixture contained 10 ng of templateDNA, 2.5 U Taq DNA polymerase (ABgene), 1.25 mm of primer,20 mm (NH4)SO4, 75 mm Tris–HCl, pH 8.8, 0.01% (v/v) Tween®-20, 1.5 mm MgCl2, 0.25 mm dNTPs (ABgene). The PCR con-ditions were: 94 °C for 4 min, then 35 cycles of 94 °C for 30 s,55 °C for 30 s, 72 °C for 120 s, and a final period at 72 °C for10 min. PCR product (2 µg) was hybridized to a biotin-labelled(CA)15 probe (1 µg) (Genosys) by incubation overnight at50 °C in a 100 µL volume containing 0.5 m sodium phosphate,pH 7.4, plus 0.5% SDS. Enrichment was carried out usingstreptavidin-coated magnetic beads (Promega). A magneticparticle concentrator (Promega) was used to capture hybridizedfragments through the biotin–streptavidin bead bond. Enrichedfragments were then released through increasingly stringentwashes (see Mundy & Woodruff 1996). DNA purified from allwashes was subsequently amplified by PCR using an adaptormolecule as a primer, and probed using a 32P-labelled CA/GTpolynucleotide (Pharmacia) to check for levels of enrichment.Fragments in the most enriched PCR product were ligatedinto pGEM®-T Easy (Promega) and used to transform JM109cells (Promega) to construct an enriched library. Recombinantcolonies were screened for (CA)n repeats using a colony-PCR-based approach (PIMA) (see Lunt et al. 1999). The DNA fromeach colony was amplified using three primers: M13 forwardand M13 reverse primers, plus a (CA)n-specific oligonucleotide(5′-TGTGGCGGCCGC(TG)8V-3′ ). Extra amplification prod-ucts were present in 43 clones and these were sequencedusing Big Dye Terminators (PE-Applied Biosystems) on aPerkin-Elmer ABI 377 automated sequencer. Regions con-taining distinct microsatellites (<6 CA/GT) were found in13 clones, of which four were too close to the linker to allowfor primer design and were discarded.
Primers were designed for nine microsatellites and testedon DNA from 36 Lysandra bellargus extracted as described byAlijanabi & Martinez (1997). Of these, five proved to be poly-morphic (Table 1), one was monomorphic, and another threeawait optimization. All PCR amplifications were performed
MEC1052.fm Page 1948 Saturday, October 7, 2000 11:46 AM
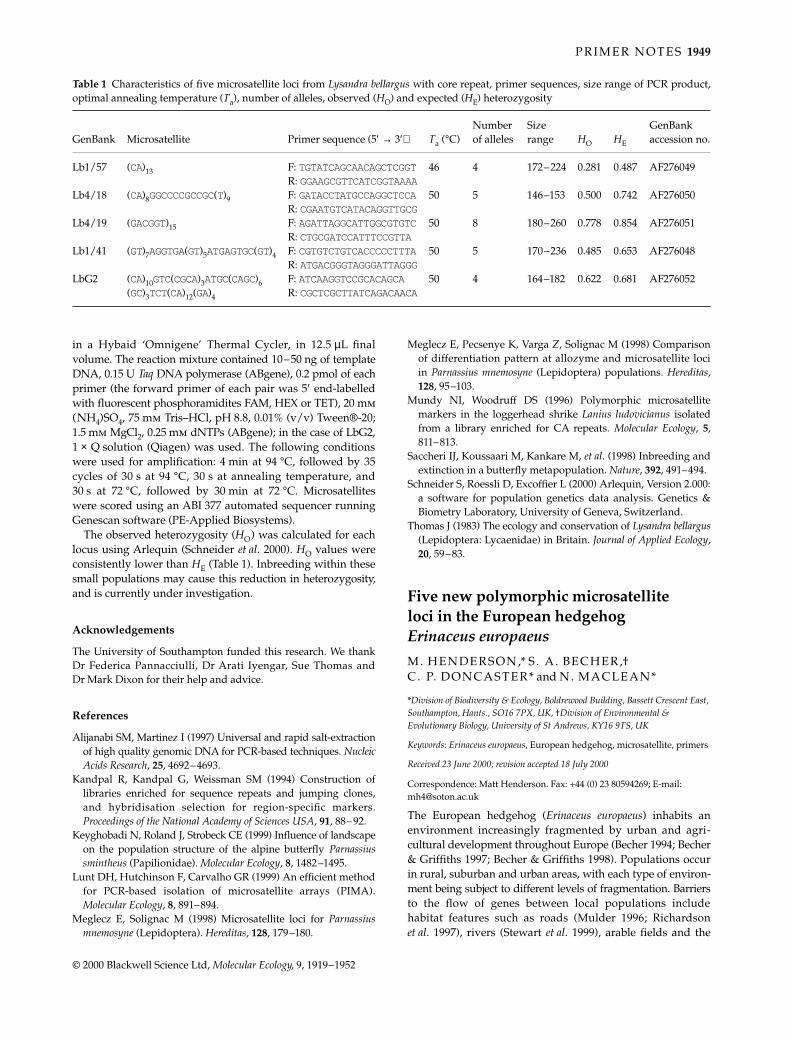
P R I M E R N O T E S 1949
© 2000 Blackwell Science Ltd, Molecular Ecology, 9, 1919–1952
in a Hybaid ‘Omnigene’ Thermal Cycler, in 12.5 µL finalvolume. The reaction mixture contained 10–50 ng of templateDNA, 0.15 U Taq DNA polymerase (ABgene), 0.2 pmol of eachprimer (the forward primer of each pair was 5′ end-labelledwith fluorescent phosphoramidites FAM, HEX or TET), 20 mm(NH4)SO4, 75 mm Tris–HCl, pH 8.8, 0.01% (v/v) Tween®-20;1.5 mm MgCl2, 0.25 mm dNTPs (ABgene); in the case of LbG2,1 × Q solution (Qiagen) was used. The following conditionswere used for amplification: 4 min at 94 °C, followed by 35cycles of 30 s at 94 °C, 30 s at annealing temperature, and30 s at 72 °C, followed by 30 min at 72 °C. Microsatelliteswere scored using an ABI 377 automated sequencer runningGenescan software (PE-Applied Biosystems).
The observed heterozygosity (HO) was calculated for eachlocus using Arlequin (Schneider et al. 2000). HO values wereconsistently lower than HE (Table 1). Inbreeding within thesesmall populations may cause this reduction in heterozygosity,and is currently under investigation.
Acknowledgements
The University of Southampton funded this research. We thankDr Federica Pannacciulli, Dr Arati Iyengar, Sue Thomas andDr Mark Dixon for their help and advice.
References
Alijanabi SM, Martinez I (1997) Universal and rapid salt-extractionof high quality genomic DNA for PCR-based techniques. NucleicAcids Research, 25, 4692–4693.
Kandpal R, Kandpal G, Weissman SM (1994) Construction oflibraries enriched for sequence repeats and jumping clones,and hybridisation selection for region-specific markers.Proceedings of the National Academy of Sciences USA, 91, 88–92.
Keyghobadi N, Roland J, Strobeck CE (1999) Influence of landscapeon the population structure of the alpine butterfly Parnassiussmintheus (Papilionidae). Molecular Ecology, 8, 1482–1495.
Lunt DH, Hutchinson F, Carvalho GR (1999) An efficient methodfor PCR-based isolation of microsatellite arrays (PIMA).Molecular Ecology, 8, 891–894.
Meglecz E, Solignac M (1998) Microsatellite loci for Parnassiusmnemosyne (Lepidoptera). Hereditas, 128, 179–180.
Meglecz E, Pecsenye K, Varga Z, Solignac M (1998) Comparisonof differentiation pattern at allozyme and microsatellite lociin Parnassius mnemosyne (Lepidoptera) populations. Hereditas,128, 95–103.
Mundy NI, Woodruff DS (1996) Polymorphic microsatellitemarkers in the loggerhead shrike Lanius ludovicianus isolatedfrom a library enriched for CA repeats. Molecular Ecology, 5,811–813.
Saccheri IJ, Koussaari M, Kankare M, et al. (1998) Inbreeding andextinction in a butterfly metapopulation. Nature, 392, 491–494.
Schneider S, Roessli D, Excoffier L (2000) Arlequin, Version 2.000:a software for population genetics data analysis. Genetics &Biometry Laboratory, University of Geneva, Switzerland.
Thomas J (1983) The ecology and conservation of Lysandra bellargus(Lepidoptera: Lycaenidae) in Britain. Journal of Applied Ecology,20, 59–83.
91120001098PRIMER NOTESPRIMER NOTESPRIMER NOTES0000Graphicraft Limited, Hong Kong
Five new polymorphic microsatellite loci in the European hedgehog Erinaceus europaeusM. HENDERSON,* S . A . BECHER,† C . P. DONCASTER* and N. MACLEAN*
*Division of Biodiversity & Ecology, Boldrewood Building, Bassett Crescent East, Southampton, Hants., SO16 7PX, UK, †Division of Environmental & Evolutionary Biology, University of St Andrews, KY16 9TS, UK
Keywords: Erinaceus europaeus, European hedgehog, microsatellite, primers
Received 23 June 2000; revision accepted 18 July 2000
Correspondence: Matt Henderson. Fax: +44 (0) 23 80594269; E-mail: [email protected]
The European hedgehog (Erinaceus europaeus) inhabits anenvironment increasingly fragmented by urban and agri-cultural development throughout Europe (Becher 1994; Becher& Griffiths 1997; Becher & Griffiths 1998). Populations occurin rural, suburban and urban areas, with each type of environ-ment being subject to different levels of fragmentation. Barriersto the flow of genes between local populations includehabitat features such as roads (Mulder 1996; Richardsonet al. 1997), rivers (Stewart et al. 1999), arable fields and the
Table 1 Characteristics of five microsatellite loci from Lysandra bellargus with core repeat, primer sequences, size range of PCR product,optimal annealing temperature (Ta), number of alleles, observed (HO) and expected (HE) heterozygosity
GenBank Microsatellite Primer sequence (5′ → 3′) Ta (°C)Number of alleles
Size range HO HE
GenBank accession no.
Lb1/57 (CA)13 F: TGTATCAGCAACAGCTCGGT46 4 172–224 0.281 0.487 AF276049R: GGAAGCGTTCATCGGTAAAA
Lb4/18 (CA)8GGCCCCGCCGC(T)9 F: GATACCTATGCCAGGCTCCA50 5 146–153 0.500 0.742 AF276050R: CGAATGTCATACAGGTTGCG
Lb4/19 (GACGGT)15 F: AGATTAGGCATTGGCGTGTC50 8 180–260 0.778 0.854 AF276051R: CTGCGATCCATTTCCGTTA
Lb1/41 (GT)7AGGTGA(GT)5ATGAGTGC(GT)4 F: CGTGTCTGTCACCCCCTTTA50 5 170–236 0.485 0.653 AF276048R: ATGACGGGTAGGGATTAGGG
LbG2 (CA)10GTC(CGCA)3ATGC(CAGC)6(GC)3TCT(CA)12(GA)4
F: ATCAAGGTCCGCACAGCA 50 4 164–182 0.622 0.681 AF276052R: CGCTCGCTTATCAGACAACA
MEC1052.fm Page 1949 Saturday, October 7, 2000 11:46 AM
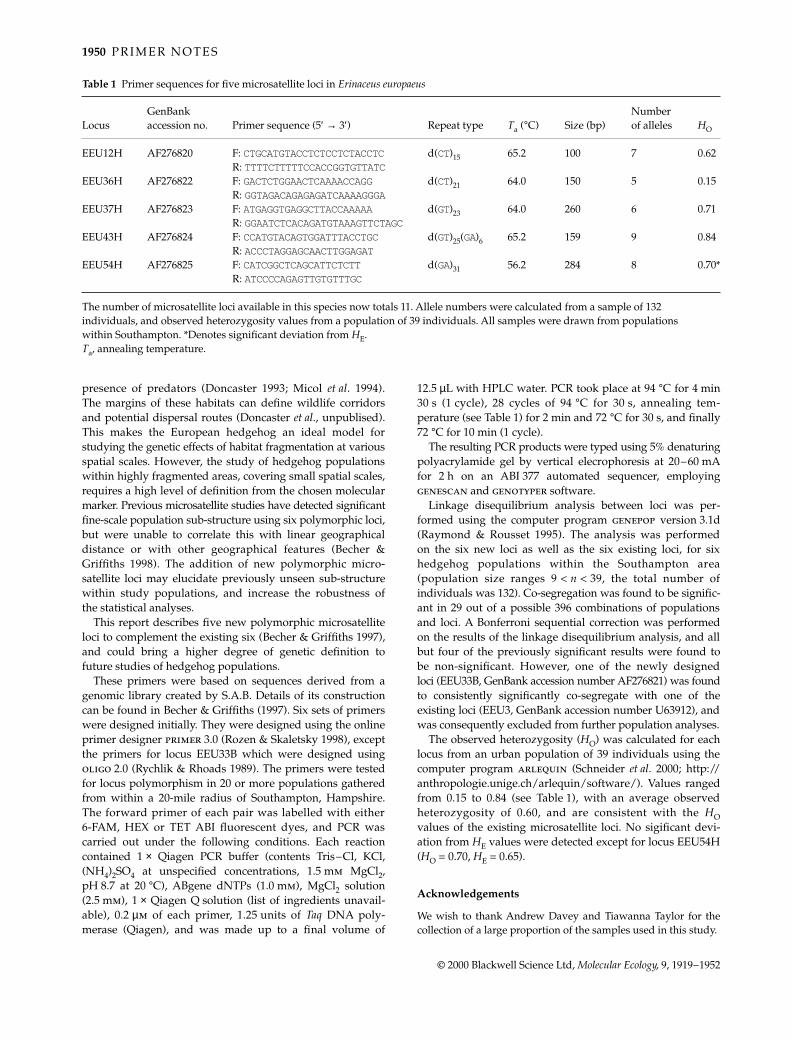
1950 P R I M E R N O T E S
© 2000 Blackwell Science Ltd, Molecular Ecology, 9, 1919–1952
presence of predators (Doncaster 1993; Micol et al. 1994).The margins of these habitats can define wildlife corridorsand potential dispersal routes (Doncaster et al., unpublised).This makes the European hedgehog an ideal model forstudying the genetic effects of habitat fragmentation at variousspatial scales. However, the study of hedgehog populationswithin highly fragmented areas, covering small spatial scales,requires a high level of definition from the chosen molecularmarker. Previous microsatellite studies have detected significantfine-scale population sub-structure using six polymorphic loci,but were unable to correlate this with linear geographicaldistance or with other geographical features (Becher &Griffiths 1998). The addition of new polymorphic micro-satellite loci may elucidate previously unseen sub-structurewithin study populations, and increase the robustness ofthe statistical analyses.
This report describes five new polymorphic microsatelliteloci to complement the existing six (Becher & Griffiths 1997),and could bring a higher degree of genetic definition tofuture studies of hedgehog populations.
These primers were based on sequences derived from agenomic library created by S.A.B. Details of its constructioncan be found in Becher & Griffiths (1997). Six sets of primerswere designed initially. They were designed using the onlineprimer designer primer 3.0 (Rozen & Skaletsky 1998), exceptthe primers for locus EEU33B which were designed usingoligo 2.0 (Rychlik & Rhoads 1989). The primers were testedfor locus polymorphism in 20 or more populations gatheredfrom within a 20-mile radius of Southampton, Hampshire.The forward primer of each pair was labelled with either6-FAM, HEX or TET ABI fluorescent dyes, and PCR wascarried out under the following conditions. Each reactioncontained 1 × Qiagen PCR buffer (contents Tris–Cl, KCl,(NH4)2SO4 at unspecified concentrations, 1.5 mm MgCl2,pH 8.7 at 20 °C), ABgene dNTPs (1.0 mm), MgCl2 solution(2.5 mm), 1 × Qiagen Q solution (list of ingredients unavail-able), 0.2 µm of each primer, 1.25 units of Taq DNA poly-merase (Qiagen), and was made up to a final volume of
12.5 µL with HPLC water. PCR took place at 94 °C for 4 min30 s (1 cycle), 28 cycles of 94 °C for 30 s, annealing tem-perature (see Table 1) for 2 min and 72 °C for 30 s, and finally72 °C for 10 min (1 cycle).
The resulting PCR products were typed using 5% denaturingpolyacrylamide gel by vertical elecrophoresis at 20–60 mAfor 2 h on an ABI 377 automated sequencer, employinggenescan and genotyper software.
Linkage disequilibrium analysis between loci was per-formed using the computer program genepop version 3.1d(Raymond & Rousset 1995). The analysis was performedon the six new loci as well as the six existing loci, for sixhedgehog populations within the Southampton area(population size ranges 9 < n < 39, the total number ofindividuals was 132). Co-segregation was found to be signific-ant in 29 out of a possible 396 combinations of populationsand loci. A Bonferroni sequential correction was performedon the results of the linkage disequilibrium analysis, and allbut four of the previously significant results were found tobe non-significant. However, one of the newly designedloci (EEU33B, GenBank accession number AF276821) was foundto consistently significantly co-segregate with one of theexisting loci (EEU3, GenBank accession number U63912), andwas consequently excluded from further population analyses.
The observed heterozygosity (HO) was calculated for eachlocus from an urban population of 39 individuals using thecomputer program arlequin (Schneider et al. 2000; http://anthropologie.unige.ch/arlequin/software/). Values rangedfrom 0.15 to 0.84 (see Table 1), with an average observedheterozygosity of 0.60, and are consistent with the HOvalues of the existing microsatellite loci. No sigificant devi-ation from HE values were detected except for locus EEU54H(HO = 0.70, HE = 0.65).
Acknowledgements
We wish to thank Andrew Davey and Tiawanna Taylor for thecollection of a large proportion of the samples used in this study.
Table 1 Primer sequences for five microsatellite loci in Erinaceus europaeus
LocusGenBank accession no. Primer sequence (5′ → 3′) Repeat type Ta (°C) Size (bp)
Number of alleles HO
EEU12H AF276820 F: CTGCATGTACCTCTCCTCTACCTC d(CT)15 65.2 100 7 0.62R: TTTTCTTTTTCCACCGGTGTTATC
EEU36H AF276822 F: GACTCTGGAACTCAAAACCAGG d(CT)21 64.0 150 5 0.15R: GGTAGACAGAGAGATCAAAAGGGA
EEU37H AF276823 F: ATGAGGTGAGGCTTACCAAAAA d(GT)23 64.0 260 6 0.71R: GGAATCTCACAGATGTAAAGTTCTAGC
EEU43H AF276824 F: CCATGTACAGTGGATTTACCTGC d(GT)25(GA)6 65.2 159 9 0.84R: ACCCTAGGAGCAACTTGGAGAT
EEU54H AF276825 F: CATCGGCTCAGCATTCTCTT d(GA)31 56.2 284 8 0.70*R: ATCCCCAGAGTTGTGTTTGC
The number of microsatellite loci available in this species now totals 11. Allele numbers were calculated from a sample of 132 individuals, and observed heterozygosity values from a population of 39 individuals. All samples were drawn from populations within Southampton. *Denotes significant deviation from HE. Ta, annealing temperature.
MEC1052.fm Page 1950 Saturday, October 7, 2000 11:46 AM

P R I M E R N O T E S 1951
© 2000 Blackwell Science Ltd, Molecular Ecology, 9, 1919–1952
References
Becher SA (1994) Population genetics of the European hedgehog(Erinaceus europaeus). PhD Thesis, University of Oxford.
Becher SA, Griffiths R (1997) Isolation and characterization ofsix polymorphic microsatellite loci in the European hedgehogErinaceus europaeus. Molecular Ecology, 6, 89–90.
Becher SA, Griffiths R (1998) Genetic differentiation among localpopulations of European hedgehog (Erinaceus europaeus) inmosaic habitats. Molecular Ecology, 7, 1599–1604.
Doncaster CP (1993) Influence of predation threat on the foragingpattern: the hedgehog’s gambit. Review of Ecology, 48, 207–213.
Micol T, Doncaster CP, Mackinlay LA (1994) Correlates of localvariation in the abundance of hedgehogs Erinaceus europaeus.Journal of Animal Ecology, 63, 851–860.
Mulder J (1996) Waarom lopen egels op de weg? Zoogdier, 7(3),20–24.
Raymond M, Rousset F (1995) genepop (Version1.2): populationgenetics software for exact tests and ecumenicism. Journal ofHeredity, 86, 248–249.
Richardson JH, Shore RF, Treweek JR, Larkin SBC (1997) Aremajor roads a barrier to small mammals? Journal of Zoology,London, 243, 840–846.
Rozen S, Skaletsky HJ (1998) primer 3.0, Whitehead Institute forBiomedical Research, Cambridge, MA.
Rychlik W, Rhoads RE (1989) A computer program for choosingoptimal oligonucleotides for filter hybridisation, sequencingand in vitro amplification of DNA. Nucleic Acids Research, 17,8543–8551.
Schneider S, Roessli D, Excoffier L (2000) arlequin, Version 2.000:a software for population genetics data analysis. Genetics &Biometry Laboratory, University of Geneva, Switzerland.
Stewart WA, Dallas JF, Piertney SB, Marshall F, Lambin X, Telfer S(1999) Metapopulation genetic structure in the water vole,Arvicola terrestris, in NE Scotland. Biological Journal of theLinnean Society, 68, 159–171.
91120001102PRMIER NOTESPRMIER NOTESPRMIER NOTES0000Graphicraft Limited, Hong Kong
Polymorphic microsatellite loci from the lettuce root aphid, Pemphigus bursariusN. J . MILLER,*† A. J . B IRLEY†‡ and G. M. TATCHELL*
*Horticulture Research International, Wellesbourne, Warwick, CV35 9EF, UK, †School of Biosciences, The University of Birmingham, Edgbaston, Birmingham B15 2TT, UK
Keywords: Aphididae, microsatellites, Pemphigus bursarius
Received 20 May 2000; revision received 5 July 2000; accepted 24 July 2000
Correspondence: G. M. Tatchell. Fax: +44 1789 470552; E-mail: [email protected]‡Present address: Queensland Institute of Medical Research, The Bancroft Centre, 300 Herston Rd, Herston 4006, Queensland, Australia.
Pemphigus bursarius is an occasional pest of agriculture withan annual life cycle that alternates between sexual reproductionon black poplars (Populus nigra) and parthenogenetic repro-duction on the root systems of various Compositae, includinglettuce. In general, aphids exhibit low allozyme variability(e.g. Tomiuk & Wöhrmann 1980), possibly as a consequence
of the response of parthenogenetic lineages to natural selection(Hales et al. 1997). Microsatellite loci are typically more variablethan allozymes (Tautz 1989) and are likely to provide a moreinformative system for the study of aphid populations.
A microsatellite-enriched P. bursarius genomic library wasconstructed according to the methods of Edwards et al. (1996).Simultaneous enrichment was carried out for a variety ofmicrosatellite motifs by using oligonucleotides with thefollowing sequences: (AT)15, (GT)15, (GA)15, (GC)15, (GCC)10,(CAA)10, (ATT)10, (CATA)10 and (ATAG)10. Enriched DNAwas digested with MluI, cloned into the BssHII site of pJV1(Edwards et al. 1996) and used to transform E. coli DH10B(Life Technologies). Plasmid DNA was extracted from 96positive clones, digested with XhoI and separated on agarosegels to determine the size of the cloned fragment. Thirty-sixclones with inserts >100 bp were chosen at random for sequen-cing. Clones were sequenced using a Big Dye dye-terminatorkit (Applied Biosystems), following the manufacturer’sinstructions, with pUC19 universal forward primer. Sequenceswere detected using an ABI 377 DNA sequencer (AppliedBiosystems).
Genomic DNA was extracted from 27 P. bursarius fundatrices(stem mothers, foundresses) collected from Lombardy poplars(P. nigra var. italica) growing at Horticulture Research Inter-national using a Puregene kit (Gentra Systems) according tothe manufacturer’s instructions. The use of fundatrices as asource of DNA ensured that all individuals were from differentclones. Microsatellite loci were amplified in a 20 µL PCRreaction containing 10–50 ng of DNA, 1 unit of Taq DNApolymerase (Boehringer), 200 µm each dNTP, 0.25 µm eachprimer, 10 mm Tris, 50 mm KCl and 2.0–3.5 mm MgCl2, overlaidwith 30 µL of mineral oil (Sigma). Amplification was carriedout in a Hybaid TR1 thermal cycler using a cycle programmeof 3 min at 95 °C followed by 35 cycles of 95 °C for 1 min, theprimer annealing temperature for 1 min and 72 °C for 1 min,followed by a final incubation at 72 °C for 30 min. The forwardmember of each primer pair was labelled at the 5′ end withone of the fluorescent dyes 6-FAM, TET or HEX by the supplier(Genosys). Amplified loci were separated through 4% poly-acrylamide gels at 3 kV for approximately 1 h in an ABI 377DNA sequencer. Amplified fragment sizes were estimated bycomparison to TAMRA-labelled GS350 size standards (AppliedBiosystems) co-loaded with each sample, using genescan 2.1(Applied Biosystems). Unbiased allele frequencies and expectedheterozygosities (HE) were calculated using the genepop 3.1computer program (Raymond & Rousset 1995).
Sequencing of 36 clones yielded 32 different sequences, 15 ofwhich (50%) contained a microsatellite. Although enrichmentwas carried out for several repeat motifs, the majority of clonedmicrosatellites had a (GCC)n/(CCG)n motif. It is unclear whe-ther this is an artefact of the enrichment process or reflects thedistribution of repeat types in the P. bursarius genome. Primerswere designed to amplify seven of the microsatellites andeach primer pair was tested at annealing temperatures rangingfrom 50 to 64 °C in 2 °C increments and at MgCl2 concentra-tions from 0.5 to 4.0 mm in 0.5 mm increments. Five primersets successfully amplified the target locus at their optimumannealing temperatures and MgCl2 concentrations. However,primer set Pb 29 required the inclusion of a proprietary
MEC1052.fm Page 1951 Saturday, October 7, 2000 11:46 AM
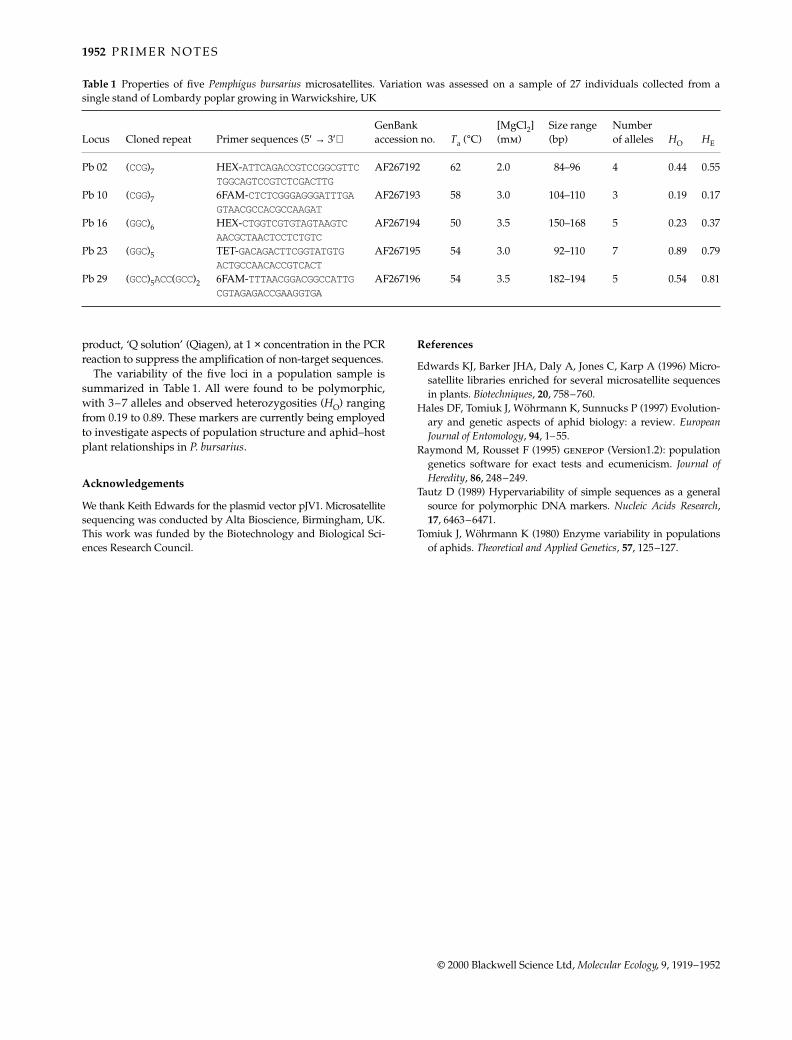
1952 P R I M E R N O T E S
© 2000 Blackwell Science Ltd, Molecular Ecology, 9, 1919–1952
product, ‘Q solution’ (Qiagen), at 1 × concentration in the PCRreaction to suppress the amplification of non-target sequences.
The variability of the five loci in a population sample issummarized in Table 1. All were found to be polymorphic,with 3–7 alleles and observed heterozygosities (HO) rangingfrom 0.19 to 0.89. These markers are currently being employedto investigate aspects of population structure and aphid–hostplant relationships in P. bursarius.
Acknowledgements
We thank Keith Edwards for the plasmid vector pJV1. Microsatellitesequencing was conducted by Alta Bioscience, Birmingham, UK.This work was funded by the Biotechnology and Biological Sci-ences Research Council.
References
Edwards KJ, Barker JHA, Daly A, Jones C, Karp A (1996) Micro-satellite libraries enriched for several microsatellite sequencesin plants. Biotechniques, 20, 758–760.
Hales DF, Tomiuk J, Wöhrmann K, Sunnucks P (1997) Evolution-ary and genetic aspects of aphid biology: a review. EuropeanJournal of Entomology, 94, 1–55.
Raymond M, Rousset F (1995) genepop (Version1.2): populationgenetics software for exact tests and ecumenicism. Journal ofHeredity, 86, 248–249.
Tautz D (1989) Hypervariability of simple sequences as a generalsource for polymorphic DNA markers. Nucleic Acids Research,17, 6463–6471.
Tomiuk J, Wöhrmann K (1980) Enzyme variability in populationsof aphids. Theoretical and Applied Genetics, 57, 125–127.
Table 1 Properties of five Pemphigus bursarius microsatellites. Variation was assessed on a sample of 27 individuals collected from asingle stand of Lombardy poplar growing in Warwickshire, UK
Locus Cloned repeat Primer sequences (5′ → 3′)GenBank accession no. Ta (°C)
[MgCl2](mm)
Size range(bp)
Numberof alleles HO HE
Pb 02 (CCG)7 HEX-ATTCAGACCGTCCGGCGTTCAF267192 62 2.0 84–96 4 0.44 0.55TGGCAGTCCGTCTCGACTTG
Pb 10 (CGG)7 6FAM-CTCTCGGGAGGGATTTGAAF267193 58 3.0 104–110 3 0.19 0.17GTAACGCCACGCCAAGAT
Pb 16 (GGC)6 HEX-CTGGTCGTGTAGTAAGTC AF267194 50 3.5 150–168 5 0.23 0.37AACGCTAACTCCTCTGTC
Pb 23 (GGC)5 TET-GACAGACTTCGGTATGTG AF267195 54 3.0 92–110 7 0.89 0.79ACTGCCAACACCGTCACT
Pb 29 (GCC)5ACC(GCC)2 6FAM-TTTAACGGACGGCCATTG AF267196 54 3.5 182–194 5 0.54 0.81CGTAGAGACCGAAGGTGA
MEC1052.fm Page 1952 Saturday, October 7, 2000 11:46 AM