high-throughput quantification of a novel thiazolidinedione mcc-555 in rat plasma by ultra-fast...
TRANSCRIPT

Hpp
Na
b
c
d
e
a
ARR2AA
KMUHRP
1
datDN
lLdg
mf
0d
Talanta 78 (2009) 506–512
Contents lists available at ScienceDirect
Talanta
journa l homepage: www.e lsev ier .com/ locate / ta lanta
igh-throughput quantification of a novel thiazolidinedione MCC-555 in ratlasma by ultra-fast liquid chromatography and its application inharmacokinetic studies
ing Suna,b,c,1, Guocai Lud,1, Mei Line, Guorong Fana,b,c,∗, Yutian Wua,b,c
Department of Pharmaceutical Analysis, School of Pharmacy, Second Military Medical University, No. 325 Guohe Road, Shanghai 200433, PR ChinaShanghai Key Laboratory for Pharmaceutical Metabolite Research, No. 325 Guohe Road, Shanghai 200433, PR ChinaShanghai Research Centre for Drug (Chinese Materia Medica) Metabolism, No. 325 Guohe Road, Shanghai 200433, PR ChinaCenter for New Drug Evaluation, Institute of Basic Medical Science, Second Military Medical University, No. 800 XiangYin Road, Shanghai 200433, ChinaShanghai Institute for Drug Control, No. 615 Liuzhou Road, Shanghai 200233, PR China
r t i c l e i n f o
rticle history:eceived 4 August 2008eceived in revised form6 November 2008ccepted 29 November 2008vailable online 6 December 2008
eywords:CC-555FLC
a b s t r a c t
MCC-555 is a novel thiazolidinedione which reduces plasma glucose concentrations in Type 2 diabetesmellitus models due to enhancement of insulin sensitivity. A highly sensitive and selective quantitativemethod to accurately determine MCC-555 in rat plasma is crucial to the success of pharmacokineticstudies of MCC-555. To this purpose we have developed and validated a high-throughput method in a96-well plate format using ultra-fast liquid chromatography (Shimadzu Prominence UFLCTM system) forthe determination of MCC-555 in rat plasma. MCC-555 along with the internal standard resveratrol wasextracted from 50 �l of rat plasma by liquid–liquid extraction using ethyl acetate. Baseline separationof MCC-555 and resveratrol was achieved using UFLC technology on a C18 stationary-phase columnwith 2.2 �m particle size. The influences of flow rate, column temperature and mobile phase pH onchromatographic performance were investigated. Comparing to the conventional HPLC method, UFLC
PLCat plasmaharmacokinetics
showed many advantages including reduced run time, less solvent consumption and increased sensitivity.The UFLC method was sensitive with a lower limit of quantification of 0.002 �g/ml, with good linearity(r > 0.999) over the linear range of 0.002–2.0 �g/ml. The intra- and inter-run precision was less than 8.6%and accuracy ranged from −6.4 to 8.2% for quality control samples. The extraction recovery from plasmawas no less than 80%. The validation and sample analysis results show that the method is precise, accurate
t pha
and well suited to suppor. Introduction
Thiazolidinediones (TZDs) represent a new class of oral anti-iabetic agents. Two of these, rosiglitazone and pioglitazone,
re approved by the U.S. Food and Drug Administration for thereatment of non-insulin-dependent diabetes mellitus (NIDDM).espite the clear clinical benefit of these drugs as a treatment forIDDM, the use of the current generation of thiazolidinediones isAbbreviations: UFLC, ultra-fast liquid chromatography; HPLC, high-performanceiquid chromatography; LC-MS, liquid chromatography tandem mass spectrometry;LOQ, lower limit of quantification; TZDs, thiazolidinediones; NIDDM, non-insulin-ependent diabetes mellitus; PPAR-�, peroxisome proliferatsor-activated receptoramma; IS, internal standard; QCs, quality control samples.∗ Corresponding author at: Second Military Medical University, School of Phar-acy, 325 Guohe Road, Shanghai 200433, China. Tel.: +86 21 2507 0388;
ax: +86 21 2507 0388.E-mail address: [email protected] (G. Fan).
1 These two authors equally contributed to this work.
039-9140/$ – see front matter © 2008 Elsevier B.V. All rights reserved.oi:10.1016/j.talanta.2008.11.044
rmacokinetic studies in rats involving three dose administrations.© 2008 Elsevier B.V. All rights reserved.
associated with side effects of clinical importance, such as weightgain, edema and anemia [1,2]. In addition, there is a growing con-cern about the reported deleterious effects of thiazolidinediones onbone cell function and the skeleton [3–6]. For these reasons, signifi-cant efforts are ongoing to develop novel thiazolidinediones, whichretain their insulin sensitizing activity, but are devoid of activitiesthat cause adverse effects.
MCC-555 (5-[[6-(2-fluorbenzyl)-oxy-2-naphy] methyl]-2,4-thiazolidinedione) (Fig. 1) is a member of a new class of peroxisomeproliferatsor-activated receptor gamma (PPAR-�) ligands with dis-tinct anti-diabetic [7]. MCC-555 has been reported to be over50-fold more potent than rosiglitazone in decreasing blood glu-cose levels in rodent models of NIDDM, and 5- to 10-fold lesseffective than rosiglitazone in inducing adipogenesis in mouse
preadipocytes [8,9]. These effects may be explained by the ability ofMCC-555 to act as a PPAR-� agonist, partial agonist, or antagonist,depending on cell context, and can be attributed to its abilityto recruit PPAR-� coactivators, distinct from those recruited byrosiglitazone [10].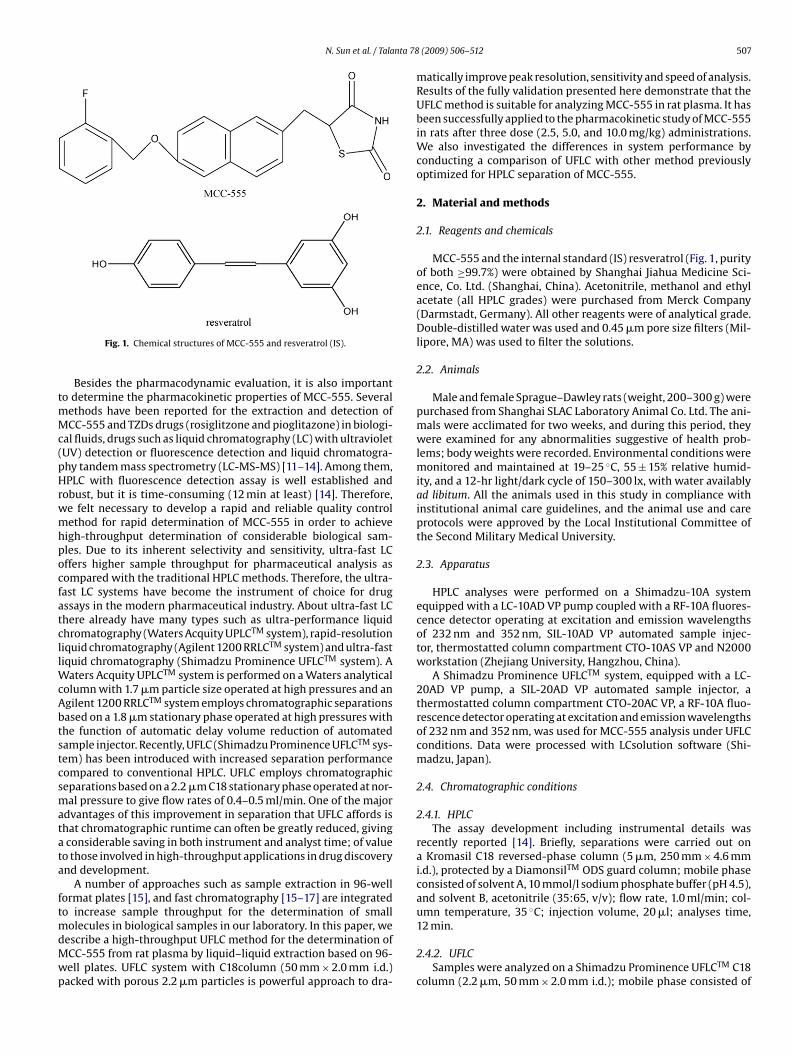
N. Sun et al. / Talanta 78
tmMc(pHrwmhpocfatcllWcAbtstcsmatata
ftmdMwp
12 min.
Fig. 1. Chemical structures of MCC-555 and resveratrol (IS).
Besides the pharmacodynamic evaluation, it is also importanto determine the pharmacokinetic properties of MCC-555. Several
ethods have been reported for the extraction and detection ofCC-555 and TZDs drugs (rosiglitzone and pioglitazone) in biologi-
al fluids, drugs such as liquid chromatography (LC) with ultravioletUV) detection or fluorescence detection and liquid chromatogra-hy tandem mass spectrometry (LC-MS-MS) [11–14]. Among them,PLC with fluorescence detection assay is well established and
obust, but it is time-consuming (12 min at least) [14]. Therefore,e felt necessary to develop a rapid and reliable quality controlethod for rapid determination of MCC-555 in order to achieve
igh-throughput determination of considerable biological sam-les. Due to its inherent selectivity and sensitivity, ultra-fast LCffers higher sample throughput for pharmaceutical analysis asompared with the traditional HPLC methods. Therefore, the ultra-ast LC systems have become the instrument of choice for drugssays in the modern pharmaceutical industry. About ultra-fast LChere already have many types such as ultra-performance liquidhromatography (Waters Acquity UPLCTM system), rapid-resolutioniquid chromatography (Agilent 1200 RRLCTM system) and ultra-fastiquid chromatography (Shimadzu Prominence UFLCTM system). A
aters Acquity UPLCTM system is performed on a Waters analyticalolumn with 1.7 �m particle size operated at high pressures and angilent 1200 RRLCTM system employs chromatographic separationsased on a 1.8 �m stationary phase operated at high pressures withhe function of automatic delay volume reduction of automatedample injector. Recently, UFLC (Shimadzu Prominence UFLCTM sys-em) has been introduced with increased separation performanceompared to conventional HPLC. UFLC employs chromatographiceparations based on a 2.2 �m C18 stationary phase operated at nor-al pressure to give flow rates of 0.4–0.5 ml/min. One of the major
dvantages of this improvement in separation that UFLC affords ishat chromatographic runtime can often be greatly reduced, givingconsiderable saving in both instrument and analyst time; of value
o those involved in high-throughput applications in drug discoverynd development.
A number of approaches such as sample extraction in 96-wellormat plates [15], and fast chromatography [15–17] are integratedo increase sample throughput for the determination of small
olecules in biological samples in our laboratory. In this paper, we
escribe a high-throughput UFLC method for the determination ofCC-555 from rat plasma by liquid–liquid extraction based on 96-ell plates. UFLC system with C18column (50 mm × 2.0 mm i.d.)acked with porous 2.2 �m particles is powerful approach to dra-(2009) 506–512 507
matically improve peak resolution, sensitivity and speed of analysis.Results of the fully validation presented here demonstrate that theUFLC method is suitable for analyzing MCC-555 in rat plasma. It hasbeen successfully applied to the pharmacokinetic study of MCC-555in rats after three dose (2.5, 5.0, and 10.0 mg/kg) administrations.We also investigated the differences in system performance byconducting a comparison of UFLC with other method previouslyoptimized for HPLC separation of MCC-555.
2. Material and methods
2.1. Reagents and chemicals
MCC-555 and the internal standard (IS) resveratrol (Fig. 1, purityof both ≥99.7%) were obtained by Shanghai Jiahua Medicine Sci-ence, Co. Ltd. (Shanghai, China). Acetonitrile, methanol and ethylacetate (all HPLC grades) were purchased from Merck Company(Darmstadt, Germany). All other reagents were of analytical grade.Double-distilled water was used and 0.45 �m pore size filters (Mil-lipore, MA) was used to filter the solutions.
2.2. Animals
Male and female Sprague–Dawley rats (weight, 200–300 g) werepurchased from Shanghai SLAC Laboratory Animal Co. Ltd. The ani-mals were acclimated for two weeks, and during this period, theywere examined for any abnormalities suggestive of health prob-lems; body weights were recorded. Environmental conditions weremonitored and maintained at 19–25 ◦C, 55 ± 15% relative humid-ity, and a 12-hr light/dark cycle of 150–300 lx, with water availablyad libitum. All the animals used in this study in compliance withinstitutional animal care guidelines, and the animal use and careprotocols were approved by the Local Institutional Committee ofthe Second Military Medical University.
2.3. Apparatus
HPLC analyses were performed on a Shimadzu-10A systemequipped with a LC-10AD VP pump coupled with a RF-10A fluores-cence detector operating at excitation and emission wavelengthsof 232 nm and 352 nm, SIL-10AD VP automated sample injec-tor, thermostatted column compartment CTO-10AS VP and N2000workstation (Zhejiang University, Hangzhou, China).
A Shimadzu Prominence UFLCTM system, equipped with a LC-20AD VP pump, a SIL-20AD VP automated sample injector, athermostatted column compartment CTO-20AC VP, a RF-10A fluo-rescence detector operating at excitation and emission wavelengthsof 232 nm and 352 nm, was used for MCC-555 analysis under UFLCconditions. Data were processed with LCsolution software (Shi-madzu, Japan).
2.4. Chromatographic conditions
2.4.1. HPLCThe assay development including instrumental details was
recently reported [14]. Briefly, separations were carried out ona Kromasil C18 reversed-phase column (5 �m, 250 mm × 4.6 mmi.d.), protected by a DiamonsilTM ODS guard column; mobile phaseconsisted of solvent A, 10 mmol/l sodium phosphate buffer (pH 4.5),and solvent B, acetonitrile (35:65, v/v); flow rate, 1.0 ml/min; col-umn temperature, 35 ◦C; injection volume, 20 �l; analyses time,
2.4.2. UFLCSamples were analyzed on a Shimadzu Prominence UFLCTM C18
column (2.2 �m, 50 mm × 2.0 mm i.d.); mobile phase consisted of

5 nta 78
sBa
2
mitas
wt0ssbadt
2
weHatpatftAfpesm
2
gaaeibmo
a6piasTmapp
08 N. Sun et al. / Tala
olvent A, 10 mmol/l sodium phosphate buffer (pH 4.5), and solvent, acetonitrile (40:60, v/v); flow rate, 0.5 ml/min; column temper-ture, 35 ◦C; injection volume, 5 �l; analysis time, 2 min.
.5. Preparation of standards and quality control samples
The stock solution of MCC-555 (1.0 mg/ml) was prepared inethanol. Working standard solutions of MCC-555 were obtained
n the concentrations of 0.1, 1.0, 10.0, and 100 �g/ml by further dilu-ions of the stock solution with methanol. Resveratrol was preparedt a concentration of 4 �g/ml in methanol. All the solutions weretored at −20 ◦C.
Calibration standards were prepared by spiking blank rat plasmaith working standard solutions of MCC-555. The effective concen-
rations in standard plasma samples were 0.002, 0.005, 0.01, 0.02,.05, 0.1, 0.2, 0.5, 1.0 and 2.0 �g/ml. One calibration curve was con-tructed on each analysis day using freshly prepared calibrationtandards. The quality control samples (QCs) were prepared withlank plasma at low, middle and high concentrations of 0.04, 0.4nd 1.4 �g/ml and stored at −20 ◦C after preparations. The stan-ards and quality controls were extracted on each analysis day withhe same procedure for plasma samples as described below.
.6. Sample preparation
Samples were prepared using liquid–liquid extraction in 96-ell format plates. The liquid transfer steps were completed by
ight-channel pipetting tools (Eppendorf Research®, Eppendorf AG,amburg, Germany) except when adding 1000 �l of extractiongent. Plasma samples (50 �l) were transferred to the 2-ml Arc-icWhite 96-well polypropylene plate using 100-�l eight-channelipetting tool. A 50 �l aliquot of 2 �g/ml internal standard solutionnd a 100 �l aliquot of 0.3 mol/l Na2HPO4 solution were transferredo each well of the 96-well plate with the exception of the blanks,ollowed by capping and vortex mixing for 1 min. Following addi-ion of 1000 �l of ethyl acetate, the wells were capped with therctiSeal mat; vortex mixed for 3 min, and centrifuged at 1047 × g
or 10 min. The ethyl acetate layer was transferred to the respectiveositions of new 2-ml ArcticWhite 96-well plates. These samplextracts were evaporated at 45 ◦C under a stream of nitrogen, recon-tituted with 50 �l of 60/40 acetonitrile/water, capped and vortexixed before analysis.
.7. Pharmacokinetic studies
Sprague–Dawley rats were divided into three groups (80 rats/perroup) and received 2.5, 5 and 10 mg/kg oral doses of MCC-555 insuspension using 0.5%carboxy methyl cellulose via gastric gav-
ge. All rats were fasted overnight with free water supply beforexperiments and had access to water and food 4 h after drug admin-stration. Dose volumes were calculated based on the pretreatmentody weights of the animals, rounded to the nearest 0.01 ml andeasured carefully in calibrated syringe to minimize the variability
f dosing.Blood samples were collected by decapitation under slight ether
nesthesia at different time points (0.25, 0.5, 0.75, 1, 1.5, 2, 3, 4,, 8, 10, 12, 24, 36, 48, and 72 h) after administration (5 rats/timeoint). Each collected blood sample was immediately transferred
nto a heparinized 1.5 ml microcentrifuge tube and centrifugedt 2992 × g for 6 min at room temperature. The resulting plasmaamples were immediately frozen at −20 ◦C for further analysis.
he plasma concentration–time data were analyzed and phar-acokinetic parameters were estimated by non-compartmentalnalysis. The merit of the non-compartmental analysis is to evaluateharmacokinetic parameters without the restriction of the com-artment model based on the test plasma concentrations. Because
(2009) 506–512
some differences can be obtained using different mathematicsmethods or soft wares when pharmacokinetic parameters are esti-mated by the compartment model.
3. Results and discussion
High-performance liquid chromatography has been used for theanalysis of MCC-555 biological samples. Recently, an improvementin chromatographic performance has been achieved by the intro-duction of UFLC. The van Deemter equation indicates that, whenthe particle size decreases to less than 2.5 �m there is a significantgain in efficiency and that efficiency does not diminish at increasedflow rates or linear velocities. Thus, UFLC takes full advantageof chromatographic principles to run separations using columnspacked with smaller particles (2.2 �m), with superior resolutionand shorter analysis time. In our experiment, a 50 mm column sub-mitted to an isocratic flow rate of 0.5 ml/min for 2 min was usedto obtain the chromatograms. The very narrow chromatographicpeaks generated by UPLC, resulted in an increase in the chromato-graphic efficiency and sensitivity.
As mentioned before, the aim of this study was to develop UFLCmethod for determination of MCC-555 in rat plasma. To purifycomplex sample matrix and concentrate MCC-555, a liquid–liquidextraction procedure was developed as a first step of this study.Sample extraction in 96-well format plates and fast chromatog-raphy are integrated to increase sample throughput for thedetermination of small molecules in biological samples in our lab-oratory. The second major point concerning with UFLC methoddevelopment was to avoid co-elution of other compounds withMCC-555 and resveratrol, resulting in reasonable value of LLOQ.To solve this problem influence of column temperature, flow rateand mobile phase pH was studied. Developed procedures were fur-ther validated, and their applicability was verified on analysis ofMCC-555.
3.1. Optimization of sample preparation
Low throughput on the currently available assays is generallydue to labor-intensive sample preparation, while this limiting fac-tor was significantly improved in this paper. In order to increasesample throughput, the liquid–liquid extraction in 96-well formatplates was used, which resulted in shorter sample preparation time.Furthermore, it should be noted that only 50 �l of plasma wasrequired for method development. To select a good organic solventas the extract agent, a number of solvents have been tried includ-ing ethyl acetate, dichloromethane, acetone, diethyl ether or theirmixtures; the only aim was to get a best extraction recovery andto remove the endogenous materials that might interfere with thepeaks of MCC-555 and IS. The extraction efficiency of ethyl acetatewas about 80%, and the chromatograms were free from any endoge-nous substances in peaks of MCC-555 and IS. So we selected ethylacetate as the extraction agent. The extraction procedure withoutand with adding 10 mmol/l sodium phosphate buffer (100 �l) wasalso compared, and the latter gave a higher recovery.
3.2. UFLC method development
3.2.1. Choice of internal standardA synthetic intermediate of MCC-555 used to be the internal
standard in reported paper [14]. However, owing to the difficultyto get the synthetic intermediate of MCC-555 by commercial pur-
chase, we thought that it was necessary to find the new internalstandard for pharmacokinetic studies. In the course of the selec-tion of the internal standard telmisartan, naproxen, rosiglitazoneand metoprolol had been tried. These compounds can be separatedfrom MCC-555 with good resolution, but all failed partly for the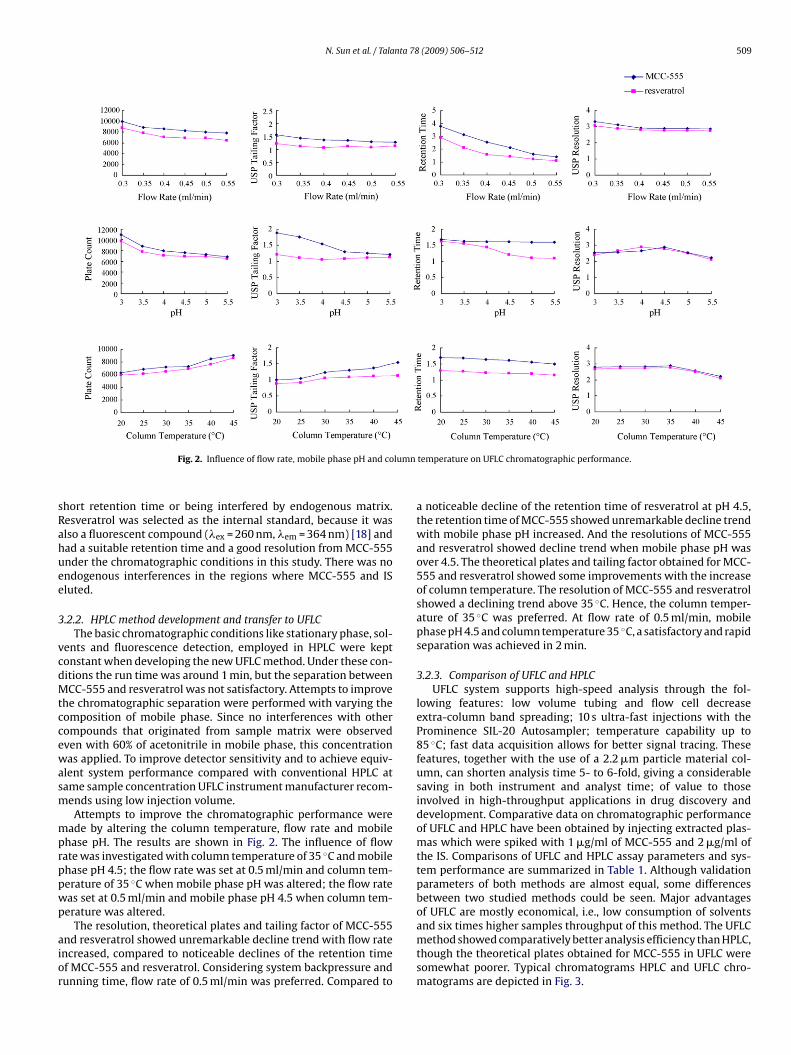
N. Sun et al. / Talanta 78 (2009) 506–512 509
lumn
sRahuee
3
vcdMtccewasm
mprppwp
aior
Fig. 2. Influence of flow rate, mobile phase pH and co
hort retention time or being interfered by endogenous matrix.esveratrol was selected as the internal standard, because it waslso a fluorescent compound (�ex = 260 nm, �em = 364 nm) [18] andad a suitable retention time and a good resolution from MCC-555nder the chromatographic conditions in this study. There was nondogenous interferences in the regions where MCC-555 and ISluted.
.2.2. HPLC method development and transfer to UFLCThe basic chromatographic conditions like stationary phase, sol-
ents and fluorescence detection, employed in HPLC were keptonstant when developing the new UFLC method. Under these con-itions the run time was around 1 min, but the separation betweenCC-555 and resveratrol was not satisfactory. Attempts to improve
he chromatographic separation were performed with varying theomposition of mobile phase. Since no interferences with otherompounds that originated from sample matrix were observedven with 60% of acetonitrile in mobile phase, this concentrationas applied. To improve detector sensitivity and to achieve equiv-
lent system performance compared with conventional HPLC atame sample concentration UFLC instrument manufacturer recom-ends using low injection volume.Attempts to improve the chromatographic performance were
ade by altering the column temperature, flow rate and mobilehase pH. The results are shown in Fig. 2. The influence of flowate was investigated with column temperature of 35 ◦C and mobilehase pH 4.5; the flow rate was set at 0.5 ml/min and column tem-erature of 35 ◦C when mobile phase pH was altered; the flow rateas set at 0.5 ml/min and mobile phase pH 4.5 when column tem-erature was altered.
The resolution, theoretical plates and tailing factor of MCC-555nd resveratrol showed unremarkable decline trend with flow ratencreased, compared to noticeable declines of the retention timef MCC-555 and resveratrol. Considering system backpressure andunning time, flow rate of 0.5 ml/min was preferred. Compared to
temperature on UFLC chromatographic performance.
a noticeable decline of the retention time of resveratrol at pH 4.5,the retention time of MCC-555 showed unremarkable decline trendwith mobile phase pH increased. And the resolutions of MCC-555and resveratrol showed decline trend when mobile phase pH wasover 4.5. The theoretical plates and tailing factor obtained for MCC-555 and resveratrol showed some improvements with the increaseof column temperature. The resolution of MCC-555 and resveratrolshowed a declining trend above 35 ◦C. Hence, the column temper-ature of 35 ◦C was preferred. At flow rate of 0.5 ml/min, mobilephase pH 4.5 and column temperature 35 ◦C, a satisfactory and rapidseparation was achieved in 2 min.
3.2.3. Comparison of UFLC and HPLCUFLC system supports high-speed analysis through the fol-
lowing features: low volume tubing and flow cell decreaseextra-column band spreading; 10 s ultra-fast injections with theProminence SIL-20 Autosampler; temperature capability up to85 ◦C; fast data acquisition allows for better signal tracing. Thesefeatures, together with the use of a 2.2 �m particle material col-umn, can shorten analysis time 5- to 6-fold, giving a considerablesaving in both instrument and analyst time; of value to thoseinvolved in high-throughput applications in drug discovery anddevelopment. Comparative data on chromatographic performanceof UFLC and HPLC have been obtained by injecting extracted plas-mas which were spiked with 1 �g/ml of MCC-555 and 2 �g/ml ofthe IS. Comparisons of UFLC and HPLC assay parameters and sys-tem performance are summarized in Table 1. Although validationparameters of both methods are almost equal, some differencesbetween two studied methods could be seen. Major advantagesof UFLC are mostly economical, i.e., low consumption of solvents
and six times higher samples throughput of this method. The UFLCmethod showed comparatively better analysis efficiency than HPLC,though the theoretical plates obtained for MCC-555 in UFLC weresomewhat poorer. Typical chromatograms HPLC and UFLC chro-matograms are depicted in Fig. 3.
510 N. Sun et al. / Talanta 78 (2009) 506–512
Table 1Comparison of UFLC and HPLC assay parameters and system performance.
UFLC assay HPLC assay
Column Shimadzu C18 column(50 mm × 2.0 mm,2.2 �m)
Kromasil C18 column(250 mm × 4.6 mm,5 �m)
Flow rate (ml/min) 0.5 1.0Injection volume (�l) 5 20Total run time (min) 2 12MCC-555 elution time (min) 1.62 10.72Total solvent consumption 0.4 ml of water 0.6 ml
of acetonitrile4.2 ml of water 7.8 mlof acetonitrile
USP resolution 2.89 1.86TUL
3
obtocwdpccs
3
ft5T
F1us0Hbsr1
Fig. 4. Representative chromatograms for MCC-555 (I) and resveratrol (IS) from (A)
ailing factor 1.30 1.42SP plate count 5788 4856LOQ (�g/ml) 0.002 0.005
.3. UFLC method validation
A full validation was performed to evaluate the performancef the method in accordance to the recommendations publishedy FDA [19]. Validation runs were conducted on three consecu-ive days. Each validation run consisted of a minimum of one setf calibration standards and six sets of QC plasma samples at threeoncentrations. The results from QC plasma samples in three runsere used to evaluate the precision and accuracy of the methodeveloped. The peak area ratios of MCC-555/IS of unknown sam-les were then interpolated from the calibration curve to give theoncentrations of MCC-555. During routine analysis, each analyti-al run included a set of calibration standards, a set of QC plasmaamples in duplicate and plasma samples to be determined.
.3.1. SelectivitySelectivity was studied by comparing chromatograms of six dif-
erent batches of blank plasma obtained from six subjects withhose of corresponding standard plasma samples spiked with MCC-55 and resveratrol and plasma sample after oral doses of MCC-555.ypical chromatograms obtained in rat plasma are shown in Fig. 4.
ig. 3. The comparison of UFLC and HPLC chromatograms of test plasma (I: MCC-555,�g/ml; IS: resveratrol, 2 �g/ml). UFLC: Shimadzu Prominence UFLCTM C18 col-mn (2.2 �m, 50 mm × 2.0 mm i.d.); mobile phase consisted of solvent A, 10 mmol/lodium phosphate buffer (pH 4.5), and solvent B, acetonitrile (40:60, v/v); flow rate,.5 ml/min; column temperature, 35 ◦C; injection volume, 5 �l; analysis time, 2 min.PLC: Kromasil C18 reversed-phase column (5 �m, 250 mm × 4.6 mm i.d.), protectedy a DiamonsilTM ODS guard column; mobile phase consisted of solvent A, 10 mmol/lodium phosphate buffer (pH 4.5), and solvent B, acetonitrile (35:65, v/v); flowate, 1.0 ml/min; column temperature, 35 ◦C; injection volume, 20 �l; analyses time,2 min.
a blank plasma sample; (B) a plasma sample with added MCC-555 at a LLOQ level(0.002 �g/ml) and resveratrol (2 �g/ml); (C) a plasma sample from a rat 1 h after thedose of 5 mg/kg (concentration 1.166 �g/ml). The retention times of MCC-555 andIS were 1.62 and 1.12 min, respectively.
As can be seen from these figures, no significant interfering peakswere observed at the retention times of MCC-555 and IS. The fastanalysis speed with a total analysis time less than 2.0 min (1.62 minfor MCC-555 and 1.12 min for IS) enabled high sample throughputto be achieved.
3.3.2. Linearity and sensitivityA weighted (1/x) linear regression was used to perform stan-
dard calibration. The mean calibration equation was y = 8.4798(R.S.D. = 8.7%, n = 5)x − 0.0286 (R.S.D. = 2.3%, n = 5), where y repre-sents the peak area ratios of the analyte to the IS and x representsthe plasma concentration of analyte in �g/ml. Calibration curvesshowed an excellent linearity in the range of 0.002–2.0 �g/ml withthe concentration coefficients consistently greater than 0.999.
The lower limit of quantitation (LLOQ) of the assay [20], definedas the lowest concentration on the standard curve that can bequantitated with accuracy within 15% of nominal and precision notexceeding 15%, was 0.002 �g/ml for MCC-555. The reproducibilityof LLOQ was determined by examining five LLOQ samples indepen-dent from the standard curve. A typical chromatogram of an LLOQsample is shown in Fig. 4.
3.3.3. Precision and accuracyPrecision and accuracy were evaluated by analyzing the LLOQ,
low, mid, and high concentration quality control samples (0.002,0.004, 0.08 and 1.4 �g/ml). Precision was expressed as relative stan-dard deviation (R.S.D. %) and accuracy expressed as percent relativeerror (R.E. %). Intra-run precision and accuracy were determinedby repeated analysis of a set of standards on 1 day (n = 5), whileinter-run precision and accuracy by repeated analysis on three con-secutive days (n = 5 series per day). The R.S.D. and R.E. should be lessthan 15%, except at the LLOQ where it should not exceed 20% [21].
The data of intra-run and inter-run precision and accuracy forthe method are listed in Table 2. The intra-run precision (R.S.D.) forLLOQ, low, mid and high QC levels of MCC-555 were 5.4%, 4.9%, 7.6%and 2.3%, respectively, with an accuracy (R.E.) within −4.8% to 7.4%,and that of inter-run analysis were 6.7%, 8.6%, 3.4%, 6.2%, respec-

N. Sun et al. / Talanta 78 (2009) 506–512 511
Table 2Precision and accuracy for the determination of MCC-555 in rat plasma (intra-run:n = 5; inter-run: n = 5 series per day, 3 days).
Concentration (�g/ml) Precision R.S.D. (%) Accuracy R.E. (%)
Spiked Observed (mean ± S.D.)
Intra-run0.002 (LLOQ) 0.002 ± 0.0003 5.4 6.60.04 (low) 0.004 ± 0.001 4.9 −4.80.8 (middle) 0.079 ± 0.007 7.6 7.41.4 (high) 1.38 ± 0.62 2.3 5.3
Inter-run0.002 (LLOQ) 0.002 ± 0.0005 6.7 8.2
tia
3
matr
80a
3
safftaiaesc9
lsfwsT
3
a
TS
S
SLFP
pharmacokinetic properties of MCC-555 in rats obtained from thepresent study closely matched the reported in previous studies indogs [14]. The elimination kinetics for MCC-555 in rats followingthree doses administration was not greatly different from our pre-vious MCC-555 pharmacokinetic study in dogs conducted at the
0.04 (low) 0.004 ± 0.003 8.6 4.90.8 (middle) 0.082 ± 0.013 3.4 −6.41.4 (high) 1.41 ± 0.79 6.2 −3.8
ively, with an accuracy (R.E.) within −6.4% to 8.2%. The results ofntra-run and inter-run analysis indicated that UFLC method wereccurate, reliable and reproducible.
.3.4. Extraction recoveryExtraction recovery of MCC-555 was determined by dividing the
ean response obtained from blank plasma samples spiked withnalyte before extraction with those from blank plasma sampleso which analyte was added after extraction. This procedure wasepeated in five replicates for the three QC concentrations.
The extraction recoveries of MCC-555 from rat plasma were3.4 ± 5.0%, 87.3 ± 2.9%, and 85.9 ± 4.5% at concentration levels of.04, 0.4 and 1.4 �g/ml and the mean extraction recovery of resver-trol was 81.6 ± 2.7%.
.3.5. StabilitySample stability in plasma was investigated as follows using QC
amples. Short-term stability was examined by analyzing samplest room temperature for 24 h. Long-term stability study was per-ormed by analyzing samples stored for 2 months at −20 ◦C. Forreeze–thaw stability study, the samples were left 1 h to thaw, andhen refrozen for 24 h. This cycle was repeated three times andnalysis was done after the third freeze–thaw cycle. The stabil-ty of MCC-555 in reconstituted extracts during runtime in the LCuto-injector was tested performing a second analysis of the samextracts left 8 h at room temperature. The criterion for an acceptabletability of compounds in plasma samples under different storageonditions is that the relative recovery of the drug should be at least0% of the initial concentration [22].
MCC-555 was found to be stable in rat plasma samples for ateast 24 h when stored at room temperature and for 2 months whentored at −20 ◦C. And the stock solutions of resveratrol were stableor at least 12 h when stored at room temperature and for 2 monthshen stored at −20 ◦C. Table 3 summarizes the results of all stability
tudies which all well met the criterion for stability measurements.he method is therefore proved to be applicable for routine analysis.
.3.6. Sample dilutionThe effect of diluting samples with MCC-555 concentrations
bove the standard curve range was examined. Plasma samples
able 3tability of MCC-555 in rat plasma at three QC levels (n = 5).
tability Mean recovery (%)
0.04 (�g/ml) 0.4 (�g/ml) 1.4 (�g/ml)
hort-term stability 96.2 ± 4.1 99.7 ± 3.1 97.4 ± 2.2ong-term stability 98.9 ± 2.4 100 ± 1.8 98.6 ± 2.5reeze–thaw stability 98.2 ± 4.8 99.6 ± 3.0 98.4 ± 1.8ost-preparative stability 99.0 ± 2.8 99.3 ± 1.2 101 ± 1.3
Fig. 5. Mean plasma concentration–time profiles of MCC-555 (A) and mean plasmaconcentration–time profiles (semilogarithm) of MCC-555 (B) after three doses torats (2.5, 5 and 10 mg/kg). Symbols represented the observed data (mean ± S.D., 5rats/time point).
with MCC-555 concentrations up to 2 �g/ml were diluted 5-foldwith blank rat plasma and processed along with standards and QCsamples. The precision (R.S.D. %) at each dilution ranged from 3.2to 10.7 c/o and accuracy (RE %) ranged from −5.6 to 8.2 c/o. Plasmasamples from the pharmacokinetics study of MCC-555 in rats thathad MCC-555 concentrations above the quantification range weretherefore diluted with blank plasma and then prepared and ana-lyzed as described above.
3.4. Pharmacokinetics of MCC-555
Plasma concentrations of MCC-555 in rats following oral dosingat 2.5, 5, or 10 mg/kg were shown in Fig. 5, and corresponding meanpharmacokinetic parameters were listed in Table 4. Compartmentalmodel analysis indicated that the MCC-555 pharmacokinetic profileafter oral dosing fitted well to a two compartmental model. Basedon the weighted regression analysis of the pooled data, Cmax andAUC0∼∞ values increased as the dose increased in a linear man-ner (r2 > 0.99), with both being proportional to the administereddosages in rats. There were no significant differences between maleand female rats for all pharmacokinetic characteristics studied. Fol-lowing a single oral administration MCC-555 reached peak plasmaconcentration rapidly with a Tmax of 3 h for all three doses. The
Table 4Pharmacokinetic parameters obtained after three doses administrations of MCC-555in rats (mean ± S.D., 5 rats/time point).
Parameter a 2.5 mg/kg 5 mg/kg 10 mg/kg
t1/2 (h) 12.6 ± 4.2 13.7 ± 2.1 14.4 ± 3.8Tmax (h) 3.0 ± 0.00 3.0 ± 0.00 3.0 ± 0.00Cmax (�g/ml) 2.2 ± 0.7 3.7 ± 0.4 7.3 ± 1.2AUC0∼72 (�g h/ml) 18.0 ± 3.8 32.8 ± 2.9 66.7 ± 4.1AUC0∼∞ (�g h/ml) 18.2 ± 2.9 33.5 ± 3.6 67.3 ± 3.7MRT (h) 8.4 ± 0.7 9.8 ± 0.3 8.2 ± 0.5
a t1/2: half-life of elimination; Tmax: time to maximum concentration; Cmax: maxi-mum plasma concentration; AUC0–t: area under the concentration–time curve fromzero up to last quantifiable sample; AUC0∼∞: area under the concentration–timecurve from zero up to infinity; MRT: mean residence time.

5 nta 78
simvpdo
4
ntUoTtmefwUMh
A
mPP
[
12 N. Sun et al. / Tala
ame three doses (i.e. t1/2 = 12.6–14.4 h in rats vs. t1/2 = 12.5–16.4 hn dogs). However, Mean Residence Time (MRT) for MCC-555 was
uch shorter in rat at three doses (i.e. MRT = 8.2–9.8 h in ratss. MRT = 15.7–19.1 h in dogs). The observed species difference inharmacokinetics observed might be attributable to the intrinsicifferences in the hepatic conjugation reactions involving the stere-selective disposition.
. Conclusion
A sensitive, selective and rapid UFLC method for the determi-ation of MCC-555 in rat plasma is described for the first time. Inhis paper, we have demonstrated that the use of the reversed phaseFLC method resulted in improvements over the initial HPLC meth-ds in terms of run time for MCC-555 than commonly used HPLC.he narrow peaks gained using the UFLC approach enable the detec-ion of analytes at very low concentrations and with high resolution,
aking it appear preferable to HPLC. A sample preparation methodmploying liquid–liquid extraction based on 96-well format platesor the determination of MCC-555 concentrations in rat plasmaas developed and validated over the range of 0.002–2 �g/ml. TheFLC method has been applied to the pharmacokinetic studies ofCC-555 in rats and proved to be reproducible and reliable for the
igh-throughput pharmacokinetic studies.
cknowledgements
This work was supported by Shanghai Key Laboratory for Phar-aceutical Metabolites Research and Fundamental Research Key
roject founded by Science & Technology department of Shanghai,.R. China, Grant No. 03JC14005.
[
[[
(2009) 506–512
References
[1] A.L. Werner, M.T. Travaglini, Pharmacotherapy 21 (2001) 1082.[2] P.S. Gillies, C.J. Dunn, Drugs 60 (2000) 333.[3] B. Lecka-Czernik, E.J. Moerman, D.F. Grant, J.M. Lehmann, S.C. Manolagas, R.L.
Jilka, Endocrinology 143 (2002) 2376.[4] S.O. Rzonca, L.J. Suva, D. Gaddy, D.C. Montague, B. Lecka-Czernik, Endocrinology
145 (2004) 401.[5] M.A. Soroceanu, D. Miao, X.Y. Bai, H. Su, D. Goltzman, A.C. Karaplis, J. Endocrinol.
183 (2004) 203.[6] A.A. Ali, R.S. Weinstein, S.A. Stewart, A.M. Parfitt, S.C. Manolagas, R.L. Jilka,
Endocrinology (2004) 1226.[7] O.P. Lazarenko, S.O. Rzonca, L.J. Suva, B. Lecka-Czernik, Bone 38 (2006)
74.[8] M.J. Reginato, S.T. Bailey, S.L. Krakow, C. Minami, S. Ishii, H. Tanaka, M.A. Lazar,
J. Biol. Chem. 273 (1998) 32679.[9] L. Pickavance, P.S. Widdowson, P. King, S. Ishii, H. Tanaka, G. Williams, Br. J.
Pharmacol. 125 (1998) 767.[10] R. Upton, P.S. Widdowson, S. Ishii, H. Tanaka, G. Williams, Br. J. Pharmacol. 125
(1998) 1708.[11] A.M. Muxlow, S. Fowles, P. Russell, J. Chromatogr. B 752 (2001) 77.12] B.L. Kolte, B.B. Raut, A.A. Deo, M.A. Bagool, D.B. Shinde, J. Chromatogr. B 788
(2003) 37.[13] J. He, Y.F. Hu, L.F. Duan, Z.R. Tan, L.S. Wang, D. Wang, W. Zhang, Z. Li, J. Liu, J.H.
Tu, Y.M. Yao, Hong-Hao Zhou, J. Pharm. Biomed. Anal. 43 (2007) 580.[14] N. Sun, M. Lin, G.R. Fan, Z.Y. Hong, G.C. Lu, J. Chromatogr. B 835 (2006) 35.[15] J. Wen, Y.W. Wu, L.L. Zhang, Y.P. Qi, G.R. Fan, Y.T. Wu, Z. Li, J. Chromatogr. B 867
(2008) 153.[16] C. Wang, G.R. Fan, M. Lin, Y. Chen, W.Q. Zhao, Y.T. Wu, J. Chromatogr. B 854
(2007) 48.[17] Y. Chen, H.J. Miao, M. Lin, G.R. Fan, Z.Y. Hong, H.L. Wu, Y.T. Wu, J. Chromatogr. B
844 (2006) 268.[18] I. Durán-Merás, T. Galeano-Díaz, D. Airado-Rodríguez, Food Chem. 109 (2008)
825.
[19] USFDA, 2001, http://www.fda.gov/cder/guidance/4252fnl.htm.20] International Conference on Harmonization, Draft Guideline on ValidationProcedures Definitions and Terminology, Federal Register, vol. 60, IFPMA,Switzerland, 1995, p. 11260.
21] S.M. Pathak, A.R. Kumar, P. Musmade, N. Udupa, Talanta 76 (2008) 338.22] H.G. Gika, G.A. Theodoridis, I.D. Wilson, J. Chromatogr. A 1189 (2008) 314.