high-technology entrepreneurship in silicon valley
TRANSCRIPT

High-Technology Entrepreneurship in Silicon Valley
Opportunities and Opportunity Costs1
Robert W. Fairlie2 Department of Economics
Engineering 2 Bldg. University of California Santa Cruz, CA 95060
Aaron K. Chatterji Fuqua School of Business
Duke University 1 Towerview Drive Durham, NC 27708 [email protected]
July 2008 Abstract: The economic expansion of the late 1990s undoubtedly created many opportunities for business creation in Silicon Valley, but the opportunity cost of starting a business was also high during this period because of the exceptionally tight labor market. A new measure of entrepreneurship derived from matching monthly files from the Current Population Survey (CPS) is used to provide the first test of the hypothesis that entrepreneurship rates were high in Silicon Valley during the "Roaring 90s." Unlike previous measures of firm births based on large, nationally representative datasets, the new measure captures business creation at the individual-owner level, includes both employer and non-employer business starts, and focuses on only hi-tech industries. Estimates from the matched CPS data indicate that hi-tech entrepreneurship rates were lower in Silicon Valley than the rest of the United States during the period from January 1996 to February 2000. Controlling for the large concentration of immigrants and highly-educated workforce does not change the conclusion. Examining the post-boom period, we find that entrepreneurship rates in Silicon Valley increased from the late 1990s to the early 2000s. In contrast, trends in entrepreneurship rates in the United States were constant over this period. Although Silicon Valley may be an entrepreneurial location overall, the extremely tight labor market of the late 1990s, especially in hi-tech industries, may have suppressed business creation during this period.
1 This research was funded by the U.S. Small Business Administration and Kauffman Foundation. The views expressed here are those of the authors and not necessarily those of the SBA or Kauffman Foundation. We would like to thank the seminar participants at the Small Business Administration for helpful comments and suggestions. Oded Gurantz and Aparna Venkataraman provided excellent research assistance. 2 Corresponding author

1. Introduction
The late 1990s were characterized by a state of rapidly rising stock prices, lucrative stock options,
IPOs, venture capital deals and exceptionally tight labor markets. The NASDAQ rose from 1,059 on
January 2, 1996 to 5,049 on March 10, 2000. Remarkably, the national unemployment rate dropped
below 4 percent in April 2000. The late 1990s were also characterized by a marked increase in the use of
computers and the Internet by individuals and firms. Both the number of personal computers and the
number of people using the Internet increased by roughly 100 million from 1996 to 2001 in the United
States (International Telecommunications Union 2005).
Silicon Valley, California played a major role in the expansion of ICTs in the 1990s. The large
concentration of hi-tech industries in the corridor between San Francisco and San Jose is well known, and
much emphasis was placed on the role of entrepreneurs and startups, especially in hi-tech industries and
regions such as Silicon Valley in contributing to economic growth in the 1990s. The media dubbed it the
"dot com" boom. There was the impression that most people were interested in becoming an entrepreneur
or involved in some type of startup.3
However, although the conventional wisdom is that entrepreneurship was extremely high during
the late 1990s in hi-tech locations such as Silicon Valley, there is no evidence in the academic literature
from large-scale nationally representative data supporting this claim. While the economic expansion of
the 1990s undoubtedly created many opportunities for entrepreneurship and startups, but there also
existed several factors that may have actually suppressed entrepreneurship and business creation during
this period. After all, the late 1990s represented a period in which the unemployment rate was falling
rapidly, wage and salary earnings were rising, stock options and signing bonuses were becoming
increasingly common, and investing in the stock market paid substantial returns. In short, the opportunity
costs to entrepreneurship may have been unusually high during this period. Therefore, it is an open
3 See "Understanding Silicon Valley: The Anatomy of an Entrepreneurial Region" Kenney 2000, "The Silicon Valley Edge: A Habitat for Innovation and Entrepreneurship" Lee, et al. 2000, and "The Soul of a New Economy," New York Times, December 29, 1997 for a few examples.

2
question as to whether this was a period of heightened entrepreneurship or one in which the returns to
working at firms were too great.
To address this limitation in the literature, a new measure of entrepreneurial activity is used to
study business creation from 1996 to 2005 in Silicon Valley. Microdata from matched monthly files from
the Current Population Survey (CPS) are used to estimate the rate of entrepreneurship. Although the
cross-sectional CPS data are commonly used to estimate static rates of business ownership, the matched
data allow for the creation of a dynamic measure of entrepreneurship that captures the rate of business
formation at the individual owner level. A major advantage of these data is that all new business owners
are captured, including those who own incorporated or unincorporated businesses, and those who are
employers or non-employers. Recent measures of entrepreneurial activity or firm formation typically
include only larger, employer firm births (see Advanced Research Technologies, LLC, 2005 and Burton:
Center for American Progress 2005 for example). Employer firms represent only 25 percent of all
existing firms (U.S. Small Business Administration 2001, Headd 2005), and a significant number of new
employer firms start as non-employer firms (Davis, et. al. 2006). Another advantage of these data is that
the analysis can focus on hi-tech industries instead of just aggregate business creation.
The large sample sizes and detailed demographic information available in the matched CPS allow
for a comparison of entrepreneurship rates in Silicon Valley to the rest of the country and an empirical
analysis of the determinants of entrepreneurship.4 Drawing from the prior literature in economics and
management, several important hypotheses regarding entrepreneurship in Silicon Valley are tested. First,
was entrepreneurship higher in Silicon Valley than the rest of the United States in the economic
expansion of the late 1990s? The rapidly growing economy may have created many opportunities for
startups, but wage and salary earnings and the opportunity cost of capital were also rising rapidly during
this period. Second, Silicon Valley has a highly-educated population and large concentration of
immigrants, which are both associated with higher rates of entrepreneurship. Were entrepreneurship rates
4 Business-level datasets typically used to estimate firm formation include no information or only limited information on the entrepreneur.

3
higher in Silicon Valley than the rest of the United States after controlling for these differences in
demographic characteristics and other characteristics such as previous employment status and industrial
structure? Finally, did the downturn of the early 2000s reverse an upward trend in entrepreneurship or did
entrepreneurship rise in Silicon Valley? The comparison to the post-boom period may shed light on
whether entrepreneurship was dampened in Silicon Valley in the late 1990s by the unusually tight labor
market.
We find that entrepreneurship rates were lower in Silicon Valley than the rest of the United States
during the period from January 1996 to February 2000, even after controlling for the large concentration
of immigrants and a highly-educated workforce. In the post boom period, we find that entrepreneurship
rates in Silicon Valley increased while the national rate stayed constant. While our results challenge the
conventional wisdom about Silicon Valley in the late 1990s, we also contribute to the academic literature
on entrepreneurship in economics and management. Below, we discuss how prior work has separately
emphasized the role of both entrepreneurial opportunities and opportunity costs in influencing
entrepreneurial activities. In this paper, we bring together these perspectives to motivate our empirical
approach. We then present our results and conclusions.
2. Theoretical Perspectives on Entrepreneurial Opportunities
This paper begins with the observation that numerous entrepreneurial opportunities were said to
have existed in Silicon Valley during the late 1990s, but we have little robust empirical evidence that
these opportunities were exploited by individuals. There is a substantial academic literature in economics
and management on entrepreneurial opportunities that we consider below to motivate our empirical
analysis.
Prior management research has argued that entrepreneurship requires the existence and
exploitation of entrepreneurial opportunities (Shane and Venkataraman 2000). While most prior research
on entrepreneurship focused on individual level characteristics, scholars have recently investigated the
role of available opportunities in influencing entrepreneurial activities (Eckhardt and Shane 2003). The
key question in this emerging literature is: Upon recognizing an entrepreneurial opportunity, why do

4
some individuals exploit the opportunity while others choose not to? Shane and Venkataraman
(2000:223) argue that the expected payoff from an entrepreneurial opportunity is weighed against “the
opportunity cost of other alternatives”.
Similarly, in the economics literature, a theoretical analysis of the choice to become a business
owner has generally been based upon the relative earnings that a worker could obtain there in comparison
with his or her earnings at a wage and salary job. The standard theoretical model of the entrepreneurial
decision in the economics literature posits that two major opportunity costs to starting a business are
wages in the labor market and returns to investing unspent capital (Evans and Jovanovic 1989). There is
also some empirical evidence that opportunity costs are an important factor in the decision to become an
entrepreneur (Evans and Leighton 1989), and that it is often weighed against the expected size of the new
venture (Cassar, 2006) or the expected returns (Bhide, 2000). Furthermore, Evans and Leighton (1989)
find that low wages are associated with entry into entrepreneurship, using evidence from the National
Longitudinal Survey and the Current Population Survey.
This logic provides several insights that are useful for thinking about entrepreneurship in the late
1990s and subsequent downturn in Silicon Valley and the rest of the United States. First, the economic
boom of the 1990s provided strong consumer and firm demand for products and services provided by
startups, thus increasing entrepreneurial earnings. Although economic growth may have increased the
returns to entrepreneurship nationally, Silicon Valley entrepreneurs may have gained even more because
of the especially strong local economic conditions during this period.
Second, the increased use of the personal computer and Internet in the late 1990s may have also
altered the production function, and the rapidly falling price of technology may have decreased the price
of physical capital. Previous research indicates that high levels of investment in personal computers by
small businesses during the late 1990s. Estimates from the 1998 Survey of Small Business Finances
indicate that more than 75 percent of small businesses used computers (Bitler, Robb and Wolken 2001,
and Bitler 2002), and estimates from the 2000 Computer and Internet Usage Supplement (CIUS) to the
Current Population Survey (CPS) indicate high rates of computer ownership among self-employed

5
business owners (U.S. Small Business Administration 2003). Small- and medium-sized businesses are
also found to make relatively large investments in computers and communication equipment (Buckley
and Montes 2002) and 25 to 45 percent of total capital expenditures are for computers among relatively
young employer firms (Haltiwanger 2004).5 There is also direct evidence that access to personal
computers increases entrepreneurship (Fairlie 2005). Personal computers may make it easier for a
potential entrepreneur to create an experimental business plan, obtain information about tax codes and
legal regulations, conduct research on production techniques and competition, and may be useful to new
business owners for accounting, inventory, communications, and advertising.6
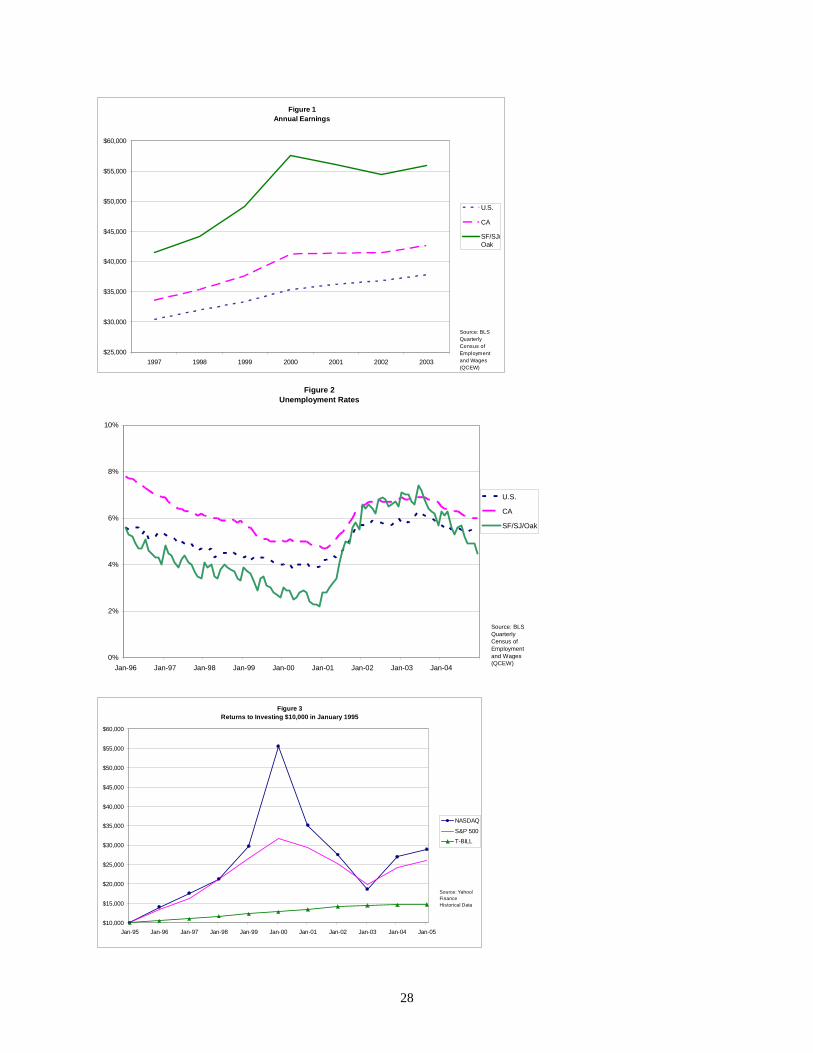
On the other hand, earnings in the wage and salary sector were increasing very rapidly during this
period (increasing w) placing downward pressure on entrepreneurship. Figure 1 displays average annual
earnings in the San Francisco/San Jose/Oakland metropolitan area, California and the United States. In
the San Francisco Bay Area, mean earnings rose from $42,000 to more than $58,000, which was far
higher than mean earnings in California or the United States. The unemployment rate also dropped
rapidly over this period of time (see Figure 2). The unemployment rate in the San Francisco Bay Area
fell to a remarkable low of 2.2 percent in December 2000. Overall, the late 1990s were a period when the
returns to the wage and salary sector were at unprecedented levels.7
Another factor creating downward pressure on entrepreneurship was the opportunity cost of
capital. The returns to investing in the stock market were extremely high during this time period. Figure
3 displays the returns to investing in a few different assets over the 1996 to 2004 period. Investing
$10,000 in the NASDAQ in 1995 would have grown to $45,000 from 1996 to 2000, and investing
$10,000 in the SP 500 would have grown to nearly $22,000. Of course, investing in a less risky asset
5 Large investments in computer equipment, however, may only occur after the initial stages of business formation. Investments in computers per employee increase rapidly with firm size (Buckley and Montes 2002), and computer investment as a share of total capital expenditures increases rapidly with firm age, at least through the first five years (Haltiwanger 2004). 6 Estimates from the Survey of Small Business Finances indicate that the four most common uses of computers in small businesses are for administrative purposes, bookkeeping, email and managing inventory (Bitler 2002). 7 There is also evidence of high levels of job mobility among hi-tech workers in Silicon Valley suggesting a dynamic labor market (i.e. Fallick, Fleishman and Rebitzer 2006). On the other hand, high levels of job mobility might also result in a higher chance of starting a business.

6
would have paid smaller returns, but many investors were placing a lot of money in the stock market at
this point in time, and investing this money in a startup meant missing out on those returns.
The booming stock market, however, also increased personal wealth. In the presence of liquidity
constraints, higher levels of wealth may have made it easier for entrepreneurs to find the required startup
capital to launch new ventures. Startup capital may have been much easier to find during the late 1990s,
especially in hi-tech areas such as Silicon Valley.8 Figure 4 displays the number of venture capital deals
made in the United States over time. The number of deals rose from less than 500 per quarter in 1995 to
more than 2,000 per quarter in the early 2000s.
Although the late 1990s in Silicon Valley, California and the rest of the United States may have
provided many opportunities for entrepreneurship, the increasing returns to entrepreneurship may have
been offset by increasing returns to working for a firm and investing money. In the end, there is no clear
theoretical prediction from economic or management theory regarding whether the boom of the 1990s
was a time of heightened entrepreneurship. While economic theory provides us with a simple model to
weigh the benefits of entrepreneurship against the costs, it reveals no clear predictions about
entrepreneurship rates in a “boom” economy like that of 1990s Silicon Valley. While management
scholars have focused on entrepreneurial opportunities, they have often deemphasized the opportunity
costs of entrepreneurship which may influence the exploitation of these opportunities.
THE UNIQUENESS OF SILICON VALLEY
Several scholars have identified particular characteristics of entrepreneurship in Silicon Valley
that are very difficult to measure empirically. One common argument is that the entire environment or
"habitat" in the region appears to be favorable for innovation and entrepreneurship. Various studies have
emphasized the role of a highly educated and mobile workforce, a risk taking and failure tolerant culture,
an open business environment that encourages creative thinking, leading research universities and
8 Strong network ties in Silicon Valley may have also increased access to financial capital. See Shane and Cable (2002) for evidence on the impact of network ties on financing of new firms.

7
institutes, extensive complementary services in law and venture capital, quality of life, and other factors
that contribute to an unusually entrepreneurial environment in Silicon Valley (Lee, at al. 2000).
Although there are many reasons to suspect that Silicon Valley differs from rest of the United
States in the creation of hi-tech businesses, these factors are notoriously difficult to measure. Admittedly,
the matched CPS data are not ideal for examining these questions. Instead, our empirical strategy is to
compare entrepreneurship in Silicon Valley in the pre period (late 1990s) to entrepreneurship in Silicon
Valley in the post period (early 2000s) to implicitly control for these difficult-to-measure factors.
Although the factors listed above did not change much during our sample period, economic conditions
sharply declined, reducing the opportunity cost of entering entrepreneurship. The pre/post comparison
isolates the impact of changing opportunity costs on entrepreneurship by controlling for the factors that
make Silicon Valley unique.
In sum, we employ the logic of entrepreneurial opportunities and opportunity costs to assess the
level of high technology entrepreneurship in Silicon Valley from 1996-2005. We provide the first formal
test of the conventional wisdom that there was more high technology entrepreneurship in Silicon Valley
during the “bubble” period of the late 1990s, and argue that the higher opportunity cost of entering
entrepreneurship in Silicon Valley may have actually resulted in lower entrepreneurship rates than
previously asserted, especially after controlling for demographics. Additionally, another test of the
importance of opportunity costs comes from examining the post boom period. Specifically, as
opportunity costs decreased in the post-boom period, we might find that entrepreneurship in Silicon
Valley actually increased as more individuals exploited entrepreneurial opportunities.
Our study makes several theoretical and empirical contributions to the extant literature. First, we
extend the insights from previous work by investigating the existence and exploitation of entrepreneurial
opportunities. We also emphasize the point that increases in the number of entrepreneurial opportunities
are often associated with increases in the opportunity cost of exploitation, which complicates the
theoretical and empirical relationship between opportunities and entrepreneurial activity. Finally, we
introduce and implement a new measure of entrepreneurship which indicates that Silicon Valley, long

8
described as the most important location for entrepreneurship in the world, was not as entrepreneurial
during the strong economic growth period of the late 1990s as previously assumed. These novel results,
if confirmed in other studies, will have an impact on both academic and popular views of
entrepreneurship in the United States.
In the next section, we discuss our data and then proceed to introduce our measure of
entrepreneurship, the empirical approach, and results. We conclude with implications for future research
and limitations of our data.
3. Data
Although research on entrepreneurship is growing rapidly, there are very few national datasets
that provide information on recent trends in business formation. Using matched data from the 1996-2005
Current Population Surveys (CPS), we create a new measure of entrepreneurship. The new measure of
entrepreneurship captures the rate of business creation at the individual owner level.9 The underlying
datasets that are used to create the entrepreneurship measure are the basic monthly files to the Current
Population Survey (CPS). By linking the CPS files over time, longitudinal data can be created, which
allows for the examination of business creations. These surveys, conducted monthly by the U.S. Bureau
of the Census and the U.S. Bureau of Labor Statistics, are representative of the entire U.S. population and
contain observations for more than 130,000 people. Combining the 1996 to 2005 monthly data creates a
sample size of more than 8 million adult observations.
Households in the CPS are interviewed each month over a 4-month period. Eight months later
they are re-interviewed in each month of a second 4-month period. Thus, individuals who are interviewed
in January, February, March and April of one year are interviewed again in January, February, March and
April of the following year. The rotation pattern of the CPS, thus allows for matching information on
individuals from month to month for 75% of all respondents to each survey. To match these data, we use
the household and individual identifiers provided by the CPS and remove false matches by comparing
9 National and state-level estimates are reported in Fairlie (2008) as the "The Kauffman Index of Entrepreneurial Activity (KIEA)."

9
race, sex and age codes from the two months. All non-unique matches are also removed from the dataset.
Monthly match rates are generally between 94 and 96 percent, and false positive rates are very low.
Because match rates are so high for month to month matches, self-employment rates and the demographic
characteristics of matched individuals do not differ substantially from the original representative CPS
sample. There are only slight differences between the matched sample and the full sample with the
matched sample generally being slightly younger, less educated and more disadvantaged.
MEASURING ENTREPRENEURSHIP
Potential measures of the number of existing business owners or businesses are readily available
from several nationally representative government datasets. For example, the Economic Census: Survey
of Business Owners provides estimates of the total number of businesses every 5 years, and the CPS
provides estimates of the total number of self-employed business owners every month.10 Typical
measures of business ownership based on these data, however, do not capture the dynamic nature that is
generally implied when defining entrepreneurship. In particular, they do not measure business formation
at the time the business is created.11
To estimate the entrepreneurship rate, we first identify all individuals who do not own a business
as their main job in the first survey month. By matching CPS files, we then identify whether they own a
business as their main job with 15 or more usual hours worked in the following survey month. The
entrepreneurship rate is thus defined as the percentage of the population of non-business owners that start
a business each month.12 To identify whether they are business owners in each month we use information
on their main job defined as the one with the most hours worked. Thus, individuals who start side or
casual businesses will not be counted if they are working more hours on a wage and salary job. The 15 or
10 Regularly published estimates from the CPS by the U.S. Bureau of Labor Statistics, such as those reported in Employment and Earnings, however, exclude incorporated business owners, which represent roughly one third of all business owners. 11 The Total Entrepreneurial Activity (TEA) index used in the Global Entrepreneurship Monitor captures individuals who are involved in either the startup phase or managing a business that is less than 42 months old (Reynolds, Bygrave and Autio 2003). 12 Exit rates from business ownership can also be estimated, but the sample sizes become substantially smaller when conditioning on business ownership in the first survey month. The CPS does not provide any information on the reason for exit, and many exits can be considered successful and do not represent business closures (Headd 2003).

10
more hours restriction also rules out the possibility of business ownership as "disguised unemployment"
(Carter and Sutch 1994).13 A disadvantage of commonly used sources of data based on tax records, such
as the Survey of Business Owners and non-employer business statistics, is that a large share of businesses
are very small scale and do not represent the primary work activity of the owner (e.g. captures
consultants).
A measure of business starts that has been commonly used in the previous literature is employer
firm births from the Statistics of U.S. Businesses (SUSB) created by the U.S. Census Bureau.14 Reports
presenting results for detailed geographical areas have been published recently, such as Advanced
Research Technologies, LLC (2005) report to the U.S. Small Business Administration (SBA) and Burton:
Center for American Progress (2005). The exclusion of non-employer firms, however, is likely to lead to
a substantial undercount of the rate of entrepreneurship because non-employer firms represent 75 percent
of all firms (U.S. Small Business Administration 2001, Headd 2005) and a significant number of new
employer firms start as non-employer firms (Davis, et. al. 2006). Estimates of business formation from
the CPS do not suffer from this problem because they include all new employer and non-employer firms.
One difference between estimates of business creation in the CPS and those from business-level
sources is caused by the difference between business owners and businesses. In other words, we do not
expect the total number of business owners and the total number of businesses to be perfectly comparable
at a point in time so the rate of creation could also differ. Multiple businesses owned by one individual
count only once in individual-level data and businesses with multiple owners count only once in business-
level data. These discrepancies are relatively minor, however. Estimates from the 1992 CBO indicate that
the total number of business owners is only 12 percent larger than the total number of businesses (U.S.
Census Bureau 1997). Similarly, Boden and Nucci (1997) find that less than 3 percent of small business
records in the CBO pertain to owners of multiple businesses.
TECHNOLOGY
13 See Fairlie (2005) for a detailed analysis of entrepreneurship rates by different hours criteria.

11
A refinement to the measure possible with the CPS is focusing on hi-tech workers. Using the
detailed industry codes available in the CPS we can narrow the sample to only hi-tech and related
industries. Although total business creation is important and can also be examined, we focus on hi-tech
because of the potential for revenue generation and the character of Silicon Valley. For the main analysis,
we include workers in all industries related to information, computers, software, pharmaceuticals,
scientific and technical services. A complete list is available in Appendix A. We also check the
robustness of results using alternative definitions of hi-tech and report some results for all businesses for
comparison. Our main findings are not sensitive to the exclusion of specific industries.
Hi-tech industries represent 23 percent of the workforce in Silicon Valley, which is more than
double the percentage for the rest of the United States. As expected, we also find that workers in these
industries are also very educated. Nearly 50 percent of workers in these industries have at least a 4-year
college degree. For all other industries, only 27 percent of workers have at least a 4-year college degree.
4. Entrepreneurship in Silicon Valley
As noted above, there is no evidence in the previous literature from a large, nationally
representative dataset on patterns of entrepreneurship in Silicon Valley. Figure 6 and Table 1 report
estimates of entrepreneurship rates for Silicon Valley, the rest of California, the California total, and the
United States from the matched CPS data.15 Estimates are reported for January 1996 to February 2000,
which is defined as the economic boom period, and from March 2000 to December 2005, which is
defined as the post-boom period. The cutoff between time periods coincides with the highest point
reached by the NASDAQ, which was on March 10, 2000.
Entrepreneurship rates were lower in Silicon Valley than the national average during the boom
period of the late 1990s. From January 1996 to February 2000, the entrepreneurship rate in Silicon
Valley was 0.39 percent compared to 0.43 percent in the United States. The rate of entrepreneurship for
14 Estimates from the SUSB are reported by the Small Business Administration, Office of Advocacy (see www.sba.gov/advo/research/data.html).

12
Silicon Valley indicates that 390 per 100,000 hi-tech workers started a business each month during this
period. Silicon Valley also had a lower entrepreneurship rate during this period than the California total.
Another interesting pattern that emerges from the data is that Silicon Valley has a higher entrepreneurship
rate in the 6 year period after the peak of the NASDAQ than during the economic boom of the late 1990s.
The entrepreneurship rate increased from 0.39 percent to 0.41 percent.16 The U.S. rate also increased, but
only slightly between the two periods. These findings are inconsistent with the common perception that
the late 1990s were a period of unbridled entrepreneurship in Silicon Valley. The high returns to wage
and salary work in Silicon Valley may have dampened the number of individuals creating new businesses.
The comparison of entrepreneurship rates between Silicon Valley and the United States is
different when examining total business creation. Table 1.B reports estimates of entrepreneurship rates
for Silicon Valley, the rest of California, the California total, and the United States from the matched CPS
data including all industries. Total business creation rates were slightly higher in Silicon Valley than the
national average during the boom period of the late 1990s. From January 1996 to February 2000, the
entrepreneurship rate in Silicon Valley was 0.31 percent compared to 0.29 percent in the United States.
Following the trend for hi-tech entrepreneurship, total business creation rates increased in Silicon Valley
from the pre- to post-boom periods. These trends resulted in total entrepreneurship rates that were higher
in Silicon Valley than in the United States in the post-boom period. Similar to the findings for hi-tech
industries, however, we do not find evidence that total entrepreneurship rates were substantially higher in
Silicon Valley than elsewhere during the economic boom of the late 1990s. Overall business creation was
only slightly higher during this period and increased substantially above the national rate only in the post-
boom period. We return to focusing on hi-tech industries.
5. Entrepreneurship in the Late 1990s
15 We follow the convention of defining Silicon Valley as the San Jose, San Francisco and Oakland MSAs (see Fallick, Fleischman and Rebitzer 2006 for example). Entrepreneurship rates were lower for the San Jose MSA alone, but the rate is not as precisely estimated because of smaller sample sizes. 16 An examination of annual entrepreneurship rates from 1996 to 2005 does not reveal a clear time trend other than higher rates in the post boom period.

13
The initial examination of estimates from the CPS reveals that hi-tech entrepreneurship rates were
lower in Silicon Valley than the rest of the country during the late 1990s. In this section, we further
investigate the finding of a relatively low rate of entrepreneurship in Silicon Valley during the strong
economic growth period of the late 1990s. Following this analysis, we examine entrepreneurship rates in
the post-boom period. The first question to address is how does Silicon Valley compare to other large
MSAs around the country in terms of rates of business creation during the late 1990s?
COMPARISON TO OTHER MSAS
Recent estimates of business creation indicate large regional differences across the United States
(Advanced Research Technologies 2005). Interestingly, San Francisco and San Jose, however, are not the
cities with the highest levels of entrepreneurial activity. The average rate of new employer firm births per
1,000 labor force from 1990 to 2001 was 3.554 in San Jose and 3.963 in San Francisco placing these
cities at the 125th and 74th ranked cities out of 394 cities in the United States. The highest ranked cities
were Glenwood Springs, CO, Cape Coral, FL, and Bend, OR. These estimates of business formation,
however, cover the entire 1990s and include all industries, but only include employer firm startups.
Estimates from the CPS may reveal different regional patterns because they focus on hi-tech industries
and include all hi-tech business starts with and without employees. The inclusion of non-employer
startups in the CPS may be especially important for hi-tech industries.
To focus on the late 1990s and hi-tech industries, entrepreneurship rates are estimated for the
largest MSAs in the United States by combining data from January 1996 to February 2000. Table 2
reports estimates for the 20 largest MSAs for this period. In the boom period of the late 1990s, the
entrepreneurship rate in Silicon Valley was in the top half of the distribution of the largest MSAs in the
United States. However, there were many large MSAs that had higher hi-tech entrepreneurship rates than
Silicon Valley. Silicon Valley was ranked 9th out of 20 MSAs. The comparison across MSAs reveals that
Silicon Valley did not have one of the highest rates of entrepreneurship during the late 1990s. In fact,
many large MSAs had higher rates in the late 1990s, which may be due to the exceptionally tight labor
market in Silicon Valley during this period.
14
CONTROLLING FOR DEMOGRAPHIC CHARACTERISTICS
Differential rates of entrepreneurship in Silicon Valley than the rest of the United States during
the late 1990s may be partly due to who lives there and works in hi-tech industries. For example, Silicon
Valley has a large concentration of immigrants and entrepreneurship rates are higher among immigrants
than the native-born (Schuetze and Antecol 2006). The importance of immigrants to Silicon Valley has
been noted in the previous literature (Saxenian 1999, 2000). Silicon Valley is also known to have a very
highly educated workforce and education is found to be positively correlated with entrepreneurship
(Moutray 2007, van der Sluis, van Praag and Vijverberg 2004). Thus, the difference between
entrepreneurship rates in Silicon Valley and the United States may be even larger once the large
concentration of immigrants, high education levels, and other demographic characteristics of the
workforce are taken into consideration. To investigate this question further, we first compare the
demographic characteristics of Silicon Valley residents to the national average.
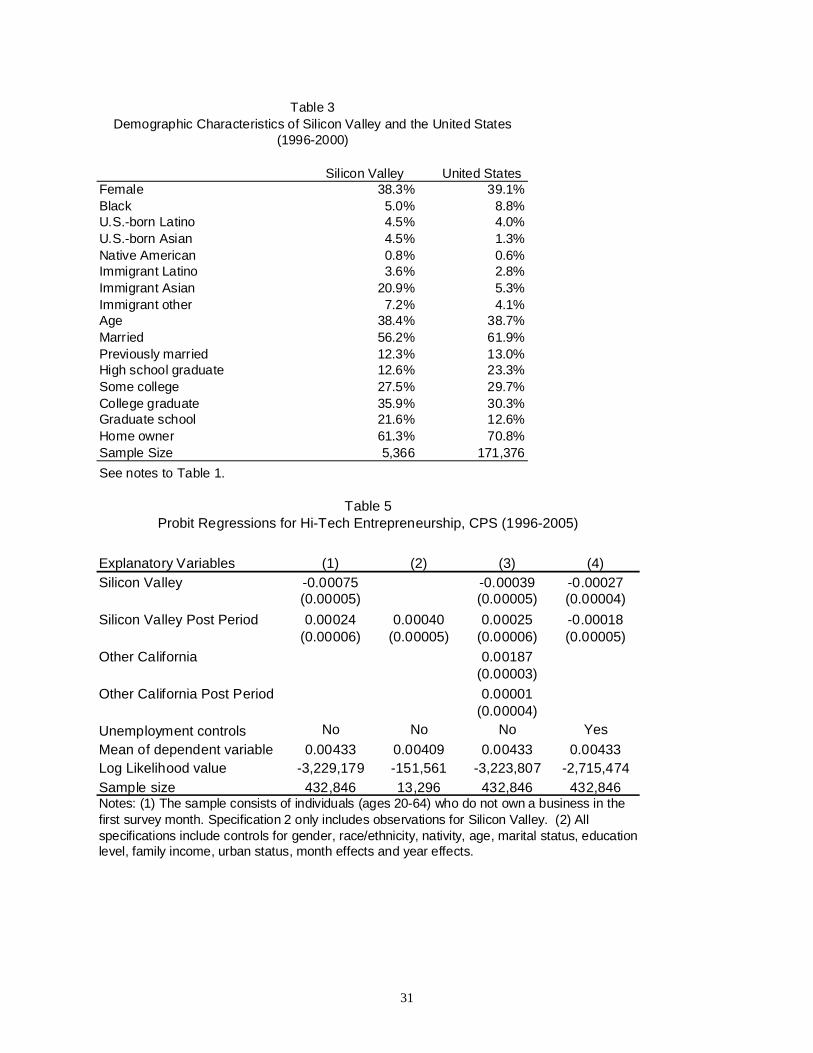
Table 3 reports estimates for several demographic characteristics of the hi-tech workforce for
Silicon Valley and the United States.17 Nearly 32 percent of hi-tech workers living in Silicon Valley are
immigrants, with 20.9 percent coming from Asian countries. In contrast, the U.S. hi-tech workforce is 12
percent immigrant with 5.3 percent from Asian countries. The Silicon Valley workforce also has a larger
concentration of U.S. born Asians and slightly higher concentration of U.S. born Latinos, but has a lower
concentration of African-Americans than the United States total. Another major difference between
Silicon Valley and the rest of the United States is the education level of the hi-tech workforce. In Silicon
Valley, 57.5 percent of the workforce has a college or graduate degree compared to the 42.9 percent in the
United States. Controlling for a potentially more entrepreneurial population living in Silicon Valley may
result in even lower entrepreneurship rates relative to the United States.
AN EMPIRICAL MODEL OF ENTREPRENEURSHIP: IDENTIFYING THE DETERMINANTS OF
ENTREPRENEURSHIP
17 The patterns are similar when examining the total population in Silicon Valley and the United States.

15
To control for differences between Silicon Valley and the rest of the United States in these and
other factors, multivariate regressions for hi-tech entrepreneurship are estimated. These regressions are
useful for identifying the determinants of entrepreneurship. The determinants of entrepreneurship can be
explored by using the detailed demographic and employment information available in the CPS. The
effects of gender, race/ethnicity, nativity, age, education, marital status, employment status, region, urban
status, and home ownership on the probability of entrepreneurship are examined. The inclusion of these
variables controls for geographical differences in demographic and employment characteristics and
changes over time in these characteristics. Although estimates of entrepreneurship rates have been
created from the CPS, the determinants of entrepreneurship at the micro level have not been explored
using the underlying data. Furthermore, a large literature explores the regional characteristics associated
with firm formation, but these studies do not have information on the characteristics of individual
business owners and focus on employer firm formation. Individual-level analyses using microdata
improve on MSA-level analyses because they control directly for individual differences and implicitly for
the main metropolitan area differences in detailed demographic and employment characteristics. In other
words, the use of microdata accounts for MSA-level variation in the same measures.
Table 4 reports marginal effects estimates from several probit regressions for the probability of
entrepreneurship in hi-tech industries.18 The base specification is reported in the first column. The probit
estimates indicate that women are less likely to become hi-tech entrepreneurs than men controlling for
other characteristics. African-Americans, U.S.-born Latinos and Asians are also less likely to start
businesses in high-tech industries, and Native Americans are more likely to start hi-tech businesses, all
else equal. Immigrants are also less likely to start businesses controlling for other factors. Latino, Asian
and other immigrants are all less likely to start hi-tech businesses, which may be the result of visa
requirements focusing on employment. When all industries are included, immigrants are typically found
to have higher rates of entrepreneurship (Schuetze and Antecol 2006, Fairlie 2008). To our knowledge,
18 Marginal effects are estimated using the coefficient estimates and the full sample distribution. They provide an estimate of the effect of a 1 unit change in the explanatory variable on the probability of entrepreneurship.

16
this is the first estimate of the effect of immigration on hi-tech entrepreneurship from nationally
representative data.
The relationship between entrepreneurship and age is quadratic, first increasing with age and then
declining with age. The strongest relationship is between education and entrepreneurship. The
probability of hi-tech entrepreneurship increases sharply with each higher level of education. For
example, individuals with a graduate degree are 0.15 percentage points more likely to start a business than
just having a college degree. The general and specific knowledge and skills acquired through formal
education may be useful for starting a business. The owner's level of education may also serve as a proxy
for his/her overall ability or as a positive signal to potential customers, lenders or other businesses making
it easier to start a business. Home owners are less likely to enter self-employment.19
As noted above, for a few of these determinants of entrepreneurship, Silicon Valley differs from
the rest of the United States. Two major differences are that Silicon Valley has a larger concentration of
immigrants and has a more educated population than the rest of the United States. Immigrants are less
likely to start hi-tech businesses, which could explain why Silicon Valley has a lower rate of
entrepreneurship than the United States. On the other hand, Silicon Valley has a more educated
population than the rest of the United States putting upward pressure on entrepreneurship rates. In the
end, the lower rate of entrepreneurship in Silicon Valley than the United States displayed in Table 1 and
Figure 6 may just be due to lower concentrations of the types of individuals who are likely to start
businesses.
In addition to the control variables, Specification 1 includes a dummy variable for Silicon Valley.
The estimates indicate that after controlling for immigration, education and other demographic
characteristics, Silicon Valley has an even lower rate of entrepreneurship than the United States. The
coefficient estimate is large, negative and statistically significant. It implies that rate of entrepreneurship
19 Previous studies find that home prices, home ownership and property restitution increase the likelihood of business creation and self-employment (Black, de Meza and Jeffreys 1996, Johansson 2000, Earle and Sakova 2000, and Fairlie 2005). The results may differ for hi-tech industries because of higher levels of wealth and lower levels of capital needed to start businesses.

17
in Silicon Valley was 0.078 percentage points lower than the rest of the country. The actual
entrepreneurship rates were 0.39 percent for Silicon Valley and 0.43 percent for the United States
implying a difference of 0.035 percentage points. Thus, we find that on balance the demographic
characteristics of hi-tech workers (e.g. more educated workforce) are favorable to entrepreneurship and
that entrepreneurship is relatively lower in Silicon Valley than our previous estimates indicated.
In Specification 2, we control for whether the individual was unemployed or not in the labor force
in the first survey year. The coefficient estimates indicate that the unemployed and those not in the labor
force are more likely than wage and salary workers to start businesses in the following month. The
unemployed and individuals not in the labor force may face different incentives for entrepreneurship,
especially if they are job losers. More specifically, they have a lower opportunity cost of starting a
business because of the lost returns to tenure and experience on their jobs. More importantly, however,
we find that the coefficient on Silicon Valley is smaller, although it remains negative and statistically
significant. After controlling for initial employment and demographic characteristics, we find that Silicon
Valley has an entrepreneurship rate that is 0.036 percentage points lower than the rest of the United
States.
There are two important implications from this finding. First, lower initial unemployment rates
partially capture the higher opportunity costs associated with starting a business in Silicon Valley during
the boom. Once these partial opportunity costs are controlled for, the difference between
entrepreneurship rates in Silicon Valley and the rest of the United States become smaller. Second,
controlling for demographic characteristics and employment characteristics, which capture some of the
opportunity costs, does not change the initial finding of a lower entrepreneurship rate in Silicon Valley
than in the rest of the United States.
The rest of California also has a higher rate of entrepreneurship than Silicon Valley and the
United States. To compare Silicon Valley to the United States outside of California, we include a dummy
variable for other parts of California in Specification 3. The coefficient on Silicon Valley is now
interpreted as the difference between the entrepreneurship rate in Silicon Valley and the United States

18
outside of California. We find that entrepreneurship rates were lower in Silicon Valley than the United
States outside of California. The difference is smaller in absolute values, but remains negative and
statistically significant. Even removing the rest of California, we continue to find that Silicon Valley had
lower business formation rates in hi-tech industries in the late 1990s than the rest of the country.
Taken together, these regression estimates clearly indicate that Silicon Valley in the "Roaring
90s" was not a place and time of exceptionally high rates of entrepreneurship. Although Silicon Valley
has a larger concentration of immigrants, which places downward pressure on hi-tech entrepreneurship
rates, the highly educated workforce, which is associated with higher rates of hi-tech entrepreneurship,
and other factors more than offset the effect. The result is that entrepreneurship rates continue to be lower
in Silicon Valley than the United States during the late 1990s.
ADDITIONAL ESTIMATES
We check the sensitivity of results to several additional specifications and samples. One concern
is that we are comparing Silicon Valley partly to rural areas in the rest of the United States, which might
not be appropriate. As a robustness check, we exclude individuals living in rural areas from the sample.
The determinants of entrepreneurship in rural areas may also differ from the determinants in more urban
areas. Specification 4 of Table 4 reports estimates. The coefficients are not sensitive to the exclusion of
these observations, which represent 11.8 percent of the full sample of hi-tech workers. The exclusion of
individuals living in rural areas from the regressions results in a slightly smaller coefficient on the Silicon
Valley dummy variable (0.0032). The coefficients, however, remain large, negative and statistically
significant indicating lower rates of entrepreneurship in Silicon Valley than the U.S. total. Thus, the
estimates for the comparison to the rest of the United States are not sensitive to the inclusion of rural
areas.
Although not reported, we also check the sensitivity of results to larger metropolitan areas.
Excluding small metropolitan areas, we find a coefficient estimate of -0.000746, which is similar to what
we find using the full sample (reported in Specification 1). The coefficient remains positive and
statistically significant. We also check the sensitivity to hours worked. Restricting entrepreneurship to
19
individuals with at least 30 hours worked per week, we also find similar results for the Silicon Valley
coefficient. Finally, we estimate the regressions using a logit model and a linear probability model and
find similar marginal effect estimates. Overall, the reported estimates are not sensitive to alternative
specifications, samples and estimation techniques.
6. Entrepreneurship in Silicon Valley in the Post-Boom Period
Entrepreneurship rates in Silicon Valley rose from 0.39 percent in the January 1996 to February
2000 period to 0.41 percent in the March 2000 to December 2005 period (see Table 1). This finding is
consistent with the hypothesis that large opportunity costs in terms of a very tight labor market in Silicon
Valley in the late 1990s may have suppressed entrepreneurship during this period. As the labor market
worsened after March 2000 in Silicon Valley, we would expect to see entrepreneurship rates rise. The
change in labor market conditions was also much more pronounced in Silicon Valley than the rest of the
United States, which is consistent with the finding that entrepreneurship rates increased by less in the
United States from the pre- to post-boom periods.
This comparison between the pre- and post-boom periods is useful for testing our hypothesis
regarding the importance of opportunity costs in determining entrepreneurship rates. The comparison of
pre to post periods implicitly controls for all of the factors that are unique to Silicon Valley, such as the
extreme concentration of established hi-tech firms, the presence of several leading universities and
research institutes, and the distinct social networks among entrepreneurs. The major change in the post
boom period was a decline in the local economy, resulting in a substantial drop in the opportunity costs of
starting a business. Thus, an increase in entrepreneurship rates in Silicon Valley from the pre to post
periods provides further evidence that entrepreneurship rates were suppressed in Silicon Valley during the
"Roaring 90s" due to an exceptionally tight labor market.
To explore this question more carefully, however, we need to confirm that the increase in
entrepreneurship in Silicon Valley between the two time periods was not due to changes in demographic
characteristics. We estimate probit regressions that include the full sample of observations from the
beginning of 1996 to the end of 2005 and interactions with time periods (see Table 5). Specification 1

20
includes the basic set of controls for demographic characteristics. Entrepreneurship increased in Silicon
Valley from the boom period to the post-boom period relative to changes in the national rate of
entrepreneurship. The entrepreneurship rate in Silicon Valley increased by 0.024 percentage points after
controlling for demographic characteristics and changes in the U.S. entrepreneurship rate. This estimated
change is identical to the actual change in the entrepreneurship rate of 0.024 percentage points.
Specification 2 reports estimates from a sample for only Silicon Valley. In this specification, the
rest of the U.S. is not used as the comparison group. We are simply comparing entrepreneurship rates in
Silicon Valley in the post to the pre periods after controlling for changes in demographic characteristics.
The estimated change in entrepreneurship rates is positive and larger than the previous estimates. Thus,
removing the implicit controls for the slight upward trend in the U.S. rate results in a larger increase in
entrepreneurship rates in the post-boom period in Silicon Valley. We return to including the rest of the
United States to control for changes in the macro-economy over this period.
The estimates reported in Table 1 indicate that other parts of California also experienced an
increase in entrepreneurship rates in the post period. To control for these trends, we include a dummy
variable for the rest of California and interactions with the post period (Specification 3). The estimates on
the Silicon Valley post variable do not change relative to the main specification. Entrepreneurship rates
in Silicon Valley increase in the post period as the opportunity costs decline.
To partially address this question, we include additional controls for previous unemployment and
non-labor force participation in Specification 4. As discussed above, the inclusion of these variables
partially controls for opportunity costs. The inclusion of these controls changes the sign on the post-
Silicon Valley dummy from positive to negative. Higher entrepreneurship rates in Silicon Valley in the
post-boom period disappear when we control for different rates of unemployment. As noted above, the
unemployment rate in Silicon Valley rose from slightly more than 2 percent in the beginning of 2001 to
7.4 percent at its peak in the middle of 2003 (see Figure 2). The U.S. unemployment rate also rose over
this period, but the increase was much smaller. The U.S. unemployment rate did not become nearly as
high as the unemployment rate in Silicon Valley in the early 2000s. The combination of increasing

21
entrepreneurship rates in Silicon Valley from the pre- to post-boom periods and the decline in coefficient
estimates after controlling for initial unemployment provides additional evidence supporting the
hypothesis that entrepreneurship rates were suppressed in the boom of the late 1990s in Silicon Valley.20
7. Conclusions
This study provides one of the first estimates of entrepreneurship rates in Silicon Valley during
the so-called "Roaring 90s." The few previous estimates of entrepreneurship in Silicon Valley from large,
nationally representative datasets do not focus on the strong economic growth period of the late 1990s, do
not include new firms without employees, do not focus on hi-tech industries, or cannot control for
detailed demographic characteristics of the entrepreneurs. Thus, the hypothesis that Silicon Valley was
and is a place of a high level of entrepreneurial spirit has not been previously tested. To test this
hypothesis a new measure of entrepreneurship that includes all types of new businesses in hi-tech
industries is created by matching monthly Current Population Surveys (CPS) from 1996 to 2005.
Estimates from the matched CPS indicate that hi-tech entrepreneurship rates were lower in
Silicon Valley than the rest of the United States during the rapid economic expansion of the late 1990s.
Entrepreneurship rates were lower in Silicon Valley during this period even after controlling for the large
concentration of immigrants, which places downward pressure on rates of business creation in hi-tech
industries. Entrepreneurship rates in Silicon Valley appear to have been suppressed by the exceptionally
tight labor markets during this period. Unemployment rates, for example, were extremely low during the
late 1990s dampening entrepreneurship rates.
Interestingly, estimates from matched CPS data indicate that entrepreneurship rates increased
from the boom period of the late 1990s to the early 2000s in Silicon Valley relative to the United States.
The entrepreneurship rate in Silicon Valley increased by 0.02 percentage points from the late 1990s to the
post-boom period. This is an interesting new finding. Entrepreneurship was higher after the dot com bust
than in the late 1990s in Silicon Valley. But, even after controlling for demographic and employment
characteristics Silicon Valley continued to have lower entrepreneurship rates than the United States.
20 The results are not sensitive to the inclusion of rural or small metropolitan areas.

22
The substantial returns to the labor market in Silicon Valley may have depressed business creation,
especially during the strong economic growth period of the late 1990s.
Implications for Theory and Practice
Besides our provocative empirical findings, our work provides several useful insights for the
academic literature on entrepreneurship. First, our results suggest that in a strong economy, the number of
entrepreneurial opportunities could indeed increase without commensurate increases in actual
entrepreneurship. This result is driven by higher opportunity costs to entrepreneurship that dissuade some
individuals from leaving salaried labor. Future theoretical research in management should thus consider
the role of opportunity costs in the entrepreneurial decision. Future empirical research in economics and
management should investigate the measures and results in this paper more closely and in different
contexts.
Our work also has implications for public policy. Many cities in the United States and around the
world are trying to emulate the Silicon Valley experience. The findings from this analysis indicate that, at
least in terms of potentially creating high rates of entrepreneurship, the demographic characteristics of the
population and economic conditions are important. In particular, having a large concentration of
immigrants and a highly-educated workforce are likely to lead to more entrepreneurial activity. But, there
is another component to Silicon Valley that is more difficult to measure -- the entire environment or
"habitat" appears to be favorable for innovation and entrepreneurship (Lee, et al. 2000). A highly
educated and mobile workforce, a risk taking and failure tolerant culture, open business environment,
location of top universities and research institutes, extensive support services, quality of life, and other
characteristics of the area appear to contribute to the success of Silicon Valley (Lee, at al. 2000).
Likewise, other work has posited that new venture creation is more common in “clusters” co-
located with valuable resources (Stuart and Sorenson, 2003). Stuart and Sorenson (2003) argue that “the
local nature of social capital suggests that new ventures will more likely begin in regions that offer ample
supplies of the necessary resources.” Since incipient entrepreneurs require social connections with

23
potential resource providers, and resources are geographically concentrated, some areas are predicted to
have higher founding rates than others (Sorenson and Audia, 2000).
However, these sociological drivers of clustering are difficult to separate from the economic
spillovers that result from agglomeration (Krugman, 1991). Industry agglomeration can also lead to the
related phenomenon of entrepreneurial spawning (Gompers, Lerner, and Sharfstein, 2005; Chatterji,
2008), where former employees of incumbent firms start new ventures in the same industry. Employees
gain valuable knowledge working at the parent firm, related to specific technologies and markets, which
enable them to identify new entrepreneurial opportunities. These spawned ventures are often located near
the original parent firm, adding to the agglomeration effects discussed above.
Future research should examine these regional dimensions of entrepreneurship further, utilizing
different datasets and empirical approaches. Our paper provides some empirical evidence that regional
differences in entrepreneurship can be driven by the interplay between opportunities and opportunity
costs in particular areas. However, the crucial role of social capital and agglomeration economies is
difficult to measure in our data, leaving many opportunities for future work.

24
References
Advanced Research Technologies, LLC. 2005. "The Innovation-Entrepreneurship NEXUS: A National Assessment of Entrepreneurship and Regional Economic Growth and Development," U.S. Small Business Administration, Office of Advocacy Report. Bhide, A.V., 2000. The Origin and Evolution of New Businesses. Oxford University Press, New York. Bitler, Marianne P. 2002. "Does PC Use Pay? Computers and Small Business Performance," RAND Working Paper. Bitler, Marianne, Alicia Robb, and John Wolken, 2001. “Financial Services Used by Small Businesses: Evidence from the 1998 Survey of Small Business Finances” Federal Reserve Bulletin, Vol. 87, April 2001. Black, Jane, David de Meza, and David Jeffreys. (1996). "House Prices, The Supply of Collateral and the Enterprise Economy." The Economic Journal. 106 (434):60-75. Buckley, Patricia, and Sabrina Montes. 2002. "Main Street in the Digital Divide Age: How Small and Medium-Sized Businesses are Using the Tools of the New Economy," U.S. Department of Commerce, Economics and Statistics Administration, Washington, D.C.: USGPO. Carter, Susan B., and Richard Sutch. 1994. "Self-employment in the Age of Big Business: Toward an Appreciation of an American Labor Market Institution," Working Papers on the History of Retirement, History of Retirement Project, University of California. Cassar, G. 2006. Entrepreneur opportunity costs and intended venture growth. Journal of Business Venturing, 21(5): 610-632. Chatterji, Aaron K. 2008. “Spawned with A Silver Spoon?: Entrepreneurial Performance and Innovation in the Medical Device Industry.” Strategic Management Journal, forthcoming Council of Economic Advisers, 2001, Economic Report of the President, 2001 (Washington, DC: U.S. GPO). Davis, Steven J., John Haltiwanger, Ron Jarmin, C.J. Krizan, Javier Miranda, Al Nucci and Kristen Sandusky. 2006. "Measuring the Dynamics of Young and Small Businesses: Integrating the Employer and Nonemployer Universes," CES Working Paper No. 06-04, February. Earle, John S., and Zuzana Sakova. 2000. "Business start-ups or disguised unemployment? Evidence on the character of self-employment from transition economies," Labour Economics, 7:(5): 575–601. Eckhardt, J. T. and S. A. Shane (2003). Opportunities and Entrepreneurship. 29: 333-349 Evans, D. S. and L. S. Leighton (1989). "Some empirical aspects of entrepreneurship." American Economic Review 79(3): 519-535. Evans, David and Boyan Jovanovic. 1989. "An estimated model of entrepreneurial choice under liquidity constraints", Journal of Political Economy 97(4):808-27.
25
Fairlie, Robert W. 2005. "The Personal Computer and Entrepreneurship" Management Science, 52 (2): 187-203. Fairlie, Robert W. 2006. "Entrepreneurship among Disadvantaged Groups: Women, Minorities and the Less Educated,” The Life Cycle of Entrepreneurial Ventures, International Handbook Series on Entrepreneurship, Volume 3, ed. Simon C. Parker. New York: Springer. Fairlie, Robert W. 2008. The Kauffman Index of Entrepreneurial Activity: 1996-2007, The Kauffman Foundation: Kansas City. Fallick, Bruce, Charles A. Fleischman, and James B. Rebitzer. 2006. "Job-Hopping in Silicon Valley: Some Evidence Concerning the Microfoundations of a High-Technology Cluster," Review of Economics and Statistics, August 2006, Vol. 88, No. 3, Pages 472-481. Goldfarb, Brent D., David Kirsh, and Michael D. Pfarrer. 2005. "Searching for Ghosts: Business Survival, Unmeasured Entrepreneurial Activity and Private Equity Investment in the Dot-Com Era," University of Maryland, Robert H. Smith School Research Paper No. RHS 06-027. Gompers, P., Lerner, J., & Scharfstein, D. 2005. Entrepreneurial Spawning: Public Corporations and the Genesis of New Ventures, 1986 to 1999. Journal of Finance, 60(2): 577-614. Haltiwanger, John. 2004. "What do we know (and not know) about the contribution of young businesses to economic growth," Presentation at the Entrepreneurship in the 21st Century Conference, March 26, 2004, U.S. Small Business Administration, Office of Advocacy. Headd, Brian. 2003. "Redefining Business Success: Distinguishing Between Closure and Failure." Small Business Economics 21(1): 51-61. Headd, Brian. 2005. "Business Estimates from the Office of Advocacy: A Discussion of Methodology," U.S. Small Business Administration, Office of Advocacy Working Paper Headd, Brian. 2005. "Measuring Microenterprise: Data on Self-Employment and Nonemployers," Working Paper. International Telecommunications Union. 2005. World Telecommunication Indicators Database. Johansson, Edvard. “Self-Employment and Liquidity Constraints: Evidence from Finland.” Scandinavian Journal of Economics, 102(1), March, 2000: 123-134. Kenney, Martin. 2000. Understanding Silicon Valley: The Anatomy of an Entrepreneurial Region, Stanford: Stanford University Press. Krugman, P. 1991. Increasing returns and economic geography. Journal of Political Economy, 99(3): 483. Lee, Chong-Moon, William F. Miller, Marguerite Gong Hancock, and Henry S. Rowen. 2000. "The Silicon Valley Habitat," in The Silicon Valley Edge: A Habitat for Innovation and Entrepreneurship, eds. Chong-Moon Lee, William F. Miller, and Henry S. Rowen, Stanford: Stanford University Press. Lee, Chong-Moon, William F. Miller, Henry S. Rowen. 2000. The Silicon Valley Edge: A Habitat for Innovation and Entrepreneurship, Stanford: Stanford University Press.
26
Moutray, Chad. 2007. "Educational Attainment and Other Characteristics of the Self-Employed: An Examination using the Panel Study of Income Dynamics Data," U.S. Small Business Administration Working Paper. Parker, Simon C. 2004. The Economics of Self-Employment and Entrepreneurship. Cambridge: Cambridge University Press. Reynolds, Paul D., William D. Bygrave, and Erkko Autio. 2003. Global Entrepreneurship Monitor: 2003 Executive Report. Babson College, London Business School and the Kauffman Foundation. Saxenian, Annalee. 1999. Silicon Valley’s New Immigrant Entrepreneurs, San Francisco: Public Policy Institute of California. Saxenian, Annalee. 2000. "Networks of Immigrant Entrepreneurs," in The Silicon Valley Edge: A Habitat for Innovation and Entrepreneurship, eds. Chong-Moon Lee, William F. Miller, and Henry S. Rowen, Stanford: Stanford University Press. Schuetze, Herbert J., and Heather Antecol. 2006. "Immigration, Entrepreneuership and the Venture Start-up Process,” The Life Cycle of Entrepreneurial Ventures, International Handbook Series on Entrepreneurship, Volume 3, ed. Simon C. Parker. New York: Springer. Shane, Scott, and Daniel Cable. "Network Ties, Reputation, and the Financing of New Ventures." Management Science 48, no. 3 (2002): 364-81. Shane, S. and S. Venkataraman (2000). "The Promise of Entrepreneurship as a Field of Research." Academy of Management Review 25(1): 217-226. Sorenson, O. & Audia, P. G. 2000. The Social Structure of Entrepreneurial Activity: Geographic Concentration of Footwear Production in the United States, 1940-1989. American Journal of Sociology, 106(2): 424. Stuart, T. & Sorenson, O. 2003. The geography of opportunity: spatial heterogeneity in founding rates and the performance of biotechnology firms. Research Policy, 32(2): 229-253. U.S. Small Business Administration, Office of Advocacy. 2001. "Private Firms, Establishments, Employment, Annual Payroll and Receipts by Firm Size, 1998-2001" Table reported at http://www.sba.gov/advo/stats/us_tot.pdf. U.S. Small Business Administration, Office of Advocacy. "Self-Employment and Computer Usage," April 2003. van der Sluis, J., van Praag, M., and Vijverberg, W. 2004. Education and Entrepreneurship in Industrialized Countries: A Meta-Analysis. Tinbergen InstituteWorking Paper no. TI 03–046/3, Amsterdam: Tinbergen Institute. Zhang, Junfu. 2006. "Easier Access to Venture Capital in Silicon Valley: Some Empirical Evidence," Public Policy Institute of California Working Paper.

27
Appendix A Hi-Tech and Related Industries
2002 DESCRIPTION 2002 CENSUS NAICS CODE CODE 2190 Pharmaceutical and medicine manufacturing 3254 3360 Computer and peripheral equipment manufacturing 3341 3370 Communications, audio, and video equipment mfging 3342, 3343 3380 Navigational, measuring, electromedical, & control instruments 3345 manufacturing 3390 Electronic component and product manufacturing, n.e.c. 3344, 3346 3580 Aircraft and parts manufacturing 336411 to 336413 3590 Aerospace products and parts manufacturing 336414, 336415, 336419 3960 Medical equipment and supplies manufacturing 3391 4190 Electrical goods, merchant wholesalers 4236 4380 Drugs, sundries, & chemical & allied products, 4242, 4246 merchant wholesalers 4585 Wholesale electronic markets, agents & broker 4251 4790 Radio, TV, and computer stores 443112, 44312 5590 Electronic shopping 454111 5591 Electronic 454112 Information 6470 Newspaper publishers 51111 6480 Publishing, except newspapers & software 5111 exc. 51111 6490 Software publishing 5112 6570 Motion pictures and video industries 5121 6590 Sound recording industries 5122 6670 Radio and television broadcasting and cable 5151, 5152, 5175 6675 Internet publishing and broadcasting 5161 6680 Wired telecommunications carriers 5171 6690 Other telecommunications services 517 exc. 5171, 5175 6692 Internet service providers 5181 6695 Data processing, hosting, & related services 5182 6770 Libraries and archives 51912 6780 Other information services 5191 exc. 51912 7290 Architectural, engineering, and related services 5413 7370 Specialized design services 5414 7380 Computer systems design & related services 5415 7390 Management, scientific, & technical consulting services 5416 7460 Scientific research and development services 5417 7490 Other professional, scientific, & technical services 5419 exc 54194
28
Figure 1
Annual Earnings
$25,000
$30,000
$35,000
$40,000
$45,000
$50,000
$55,000
$60,000
1997 1998 1999 2000 2001 2002 2003
U.S.
CA
SF/SJ/Oak
Source: BLS Quarterly Census of Employment and Wages (QCEW)
Figure 2
Unemployment Rates
0%
2%
4%
6%
8%
10%
Jan-96 Jan-97 Jan-98 Jan-99 Jan-00 Jan-01 Jan-02 Jan-03 Jan-04
U.S.
CA
SF/SJ/Oak
Source: BLS Quarterly Census of Employment and Wages (QCEW)
Figure 3Returns to Investing $10,000 in January 1995
$10,000
$15,000
$20,000
$25,000
$30,000
$35,000
$40,000
$45,000
$50,000
$55,000
$60,000
Jan-95 Jan-96 Jan-97 Jan-98 Jan-99 Jan-00 Jan-01 Jan-02 Jan-03 Jan-04 Jan-05
NASDAQ
S&P 500
T-BILL
Source: Yahoo! Finance Historical Data

29
Figure 4Venture Capital Deals
-
500
1,000
1,500
2,000
2,500
1995/Qtr 1 1996/Qtr 1 1997/Qtr 1 1998/Qtr 1 1999/Qtr 1 2000/Qtr 1 2001/Qtr 1 2002/Qtr 1 2003/Qtr 1 2004/Qtr 1Source: PWC MoneyTree Survey
Figure 5
U.S. Entrepreneurship Rates (1996-2005)
0.0%
0.1%
0.2%
0.3%
0.4%
0.5%
1996 1997 1998 1999 2000 2001 2002 2003 2004 2005
Figure 6Entrepreneurship Rates for Hi-Tech Industries by Geographical Area (1996-2005)
0.0%
0.1%
0.2%
0.3%
0.4%
0.5%
0.6%
0.7%
0.8%
Silicon Valley Rest of California California Total U.S. Total
1/1996-2/2000 3/2000-12/2005

30
Entrep. Sample Entrep. Sample Entrep. Sample Entrep. SampleYear Index Size Index Size Index Size Index Size
1/1996-2/2000 0.39% 5,366 0.59% 15,217 0.53% 20,583 0.43% 171,376
3/2000-12/2005 0.41% 8,069 0.62% 19,820 0.55% 27,889 0.44% 265,687
California Total
Table 1
Notes: (1) Estimates calculated using matched data from the Current Population Survey. (2) The entrepreneurship rate is the percent of individuals (ages 20-64) who do not own a business in the first survey month that start a business in the following month with 15 or more hours worked. (3) All observations with allocated labor force status, class of worker, and hours worked variables are excluded.
Entrepreneurship Rates for Hi-Tech Industries by Geographical Area (1996-2005)
Silicon Valley Rest of California U.S. Total
Entrep. Sample Entrep. Sample Entrep. Sample Entrep. SampleYear Index Size Index Size Index Size Index Size
1/1996-2/2000 0.31% 29,158 0.37% 155,091 0.36% 184,249 0.29% 2,223,833
3/2000-12/2005 0.35% 40,860 0.35% 214,949 0.35% 255,809 0.29% 3,459,028
California Total
Table 1.B
Notes: (1) Sample includes all industries. (2) See notes to Table 1.
Entrepreneurship Rates by Geographical Area (1996-2005)
Silicon Valley Rest of California U.S. Total
Entrep. Sample
MSA or PMSA Index Size
New York, NY PMSA 1.14% 3,952
Los Angeles-Long Beach, CA PMSA 0.77% 8,143
Phoenix-Mesa, AZ MSA 0.59% 2,300
San Diego, CA MSA 0.49% 1,657
Orange County, CA PMSA 0.46% 2,016
Seattle-Bellevue-Everett, WA PMSA 0.45% 2,232
Washington, DC-MD-VA-WV PMSA 0.44% 5,254
Baltimore, MD PMSA 0.40% 1,017
Silicon Valley 0.39% 5,366
Minneapolis-St., Paul, MN-WI MSA 0.38% 2,417
Atlanta, GA MSA 0.38% 2,358
Boston, MA-NH PMSA 0.35% 4,028
Houston, TX PMSA (Chambers County not in sample) 0.34% 1,818
Riverside-San Bernardino, CA PMSA 0.32% 895
St. Louis, MO-IL MSA (Crawford County, MO [part] not 0.29% 1,003
Philadelphia, PA-NJ PMSA 0.28% 4,063
Chicago, IL PMSA (Dekalb County not in sample) 0.25% 6,943
Nassau-Suffolk, NY PMSA 0.22% 1,791
Detroit, MI PMSA 0.22% 2,622
Dallas, TX PMSA 0.22% 3,017
Table 2Hi-Tech Entrepreneurship Rates for the Largest MSAs (1996-2000)
See notes to Table 1.
31
Silicon Valley United StatesFemale 38.3% 39.1%Black 5.0% 8.8%U.S.-born Latino 4.5% 4.0%U.S.-born Asian 4.5% 1.3%Native American 0.8% 0.6%Immigrant Latino 3.6% 2.8%Immigrant Asian 20.9% 5.3%Immigrant other 7.2% 4.1%Age 38.4% 38.7%Married 56.2% 61.9%Previously married 12.3% 13.0%High school graduate 12.6% 23.3%Some college 27.5% 29.7%College graduate 35.9% 30.3%Graduate school 21.6% 12.6%Home owner 61.3% 70.8%Sample Size 5,366 171,376
Table 3Demographic Characteristics of Silicon Valley and the United States
(1996-2000)
See notes to Table 1.
Explanatory Variables (1) (2) (3) (4)Silicon Valley -0.00075 -0.00039 -0.00027
(0.00005) (0.00005) (0.00004)Silicon Valley Post Period 0.00024 0.00040 0.00025 -0.00018
(0.00006) (0.00005) (0.00006) (0.00005)Other California 0.00187
(0.00003)Other California Post Period 0.00001
(0.00004)Unemployment controls No No No YesMean of dependent variable 0.00433 0.00409 0.00433 0.00433Log Likelihood value -3,229,179 -151,561 -3,223,807 -2,715,474Sample size 432,846 13,296 432,846 432,846Notes: (1) The sample consists of individuals (ages 20-64) who do not own a business in the first survey month. Specification 2 only includes observations for Silicon Valley. (2) All specifications include controls for gender, race/ethnicity, nativity, age, marital status, education level, family income, urban status, month effects and year effects.
Table 5Probit Regressions for Hi-Tech Entrepreneurship, CPS (1996-2005)

32
Explanatory Variables (1) (2) (3) (4)Female 0.00026 -0.00086 -0.00084 -0.00080
(0.00002) (0.00002) (0.00002) (0.00002)Black -0.00162 -0.00178 -0.00170 -0.00166
(0.00004) (0.00004) (0.00004) (0.00004)U.S.-born Latino -0.00222 -0.00232 -0.00258 -0.00233
(0.00006) (0.00006) (0.00006) (0.00006)U.S.-born Asian -0.00452 -0.00465 -0.00495 -0.00444
(0.00013) (0.00012) (0.00012) (0.00012)Native American 0.00258 0.00148 0.00137 0.00162
(0.00010) (0.00010) (0.00010) (0.00010)Immigrant Latino -0.00250 -0.00323 -0.00351 -0.00308
(0.00008) (0.00008) (0.00008) (0.00008)Immigrant Asian -0.00289 0.04520 0.04351 0.03909
(0.00005) (0.00066) (0.00066) (0.00069)Immigrant other -0.00012 -0.05339 -0.05150 -0.04565
(0.00004) (0.00079) (0.00079) (0.00083)Age (00s) -0.02395 0.04520 0.04351 0.03909
(0.00066) (0.00066) (0.00066) (0.00069)Age squared 0.04154 -0.05339 -0.05150 -0.04565
(0.00077) (0.00079) (0.00079) (0.00083)High School graduate -0.00003 0.00089 0.00095 0.00101
(0.00006) (0.00006) (0.00006) (0.00007)Some college 0.00167 0.00244 0.00244 0.00261
(0.00006) (0.00006) (0.00006) (0.00007)College graduate 0.00326 0.00420 0.00424 0.00423
(0.00006) (0.00006) (0.00006) (0.00007)Graduate school 0.00517 0.00572 0.00579 0.00565
(0.00006) (0.00006) (0.00006) (0.00007)Home owner -0.00124 -0.00098 -0.00092 -0.00110
(0.00002) (0.00002) (0.00002) (0.00002)Unemployed 0.00814 0.00805 0.00808
(0.00003) (0.00003) (0.00003)Not in the labor force 0.01417 0.01416 0.01393
(0.00002) (0.00002) (0.00003)Silicon Valley -0.00078 -0.00036 -0.00010 -0.00032
(0.00005) (0.00004) (0.00004) (0.00004)Other California 0.00141
(0.00003)Mean of dependent variable 0.00425 0.00425 0.00425 0.00420Log Likelihood value -1277838 -1059632 -1058265 -962082Sample size 171,376 171,376 171,376 151,238
Table 4Probit Regressions for Hi-Tech Entrepreneurship, CPS (1996-2000)
Notes: (1) The sample consists of individuals in hi-tech industries (ages 20-64) who do not own a business in the first survey month. (2) Additional controls include month, year, andurban status dummies.