high-speed railways in china: a look at traffic · china transport topics no. 11 december 2014 1...
TRANSCRIPT

China Transport Topics No. 11 December 2014
1
High-Speed Railways in China: A Look at Traffic
Gerald Ollivier, Richard Bullock, Ying Jin and Nanyan Zhou
World Bank Office, Beijing
In terms of high speed rail (HSR) network length, no country comes close to China. The second ranked country in 2013 had an HSR network one quarter of the size of China’s. By July 1, 2014, China Railways was running over 1,330 pairs of HSR trains a day on both this dedicated network and on upgraded conventional lines. By October 1, 2013, it had put in operation a passenger dedicated HSR network of 12,183 kilometers. More lines are being built and upgraded to connect all cities of more than 500,000 people through rapid rail (services with a maximum speed of at least 160 km/h) by 2015. Since the new generation of HSR lines only started operating in 2008, this represents a radical change in the provision of passenger services by China Railways in a very short time. But building new infrastructure or providing services is not an end in itself. Whether traffic would materialize was the subject of much debate when the HSR program was announced, primarily on the grounds of affordability, and whether such speed was justified. However insights into HSR usage have just started to emerge. Questions which can begin to be answered include: What is the traffic level and how does it compare to air traffic? Who is travelling on HSR? Have the train services benefited ordinary citizens? And how HSR has affected personal mobility? These answers are important for informing policy and regulations, as well as optimizing the train services. As of October 1, 2014, over 2.9 billion passengers are estimated to have taken a trip in a China Rail - High Speed train (called CRH services), with traffic growing from 128 million in 2008 to 672 million in 2013, or about 39 percent growth per annum since 2008. In 2013, 530 million of those CRH trips took place on passenger dedicated HSR lines. In 2013, China HSR lines carried slightly more HSR passenger-km (214 billion) than the rest of the world combined. This represented about 2.5 times the HSR passenger-km of Japan, the second largest country in terms of HSR traffic. These are substantial numbers for a system that is still in its early days. This note takes a look at the HSR traffic, puts it in a global perspective and examines two case study areas: one of the busiest routes, and a relatively lightly-used intercity route, to illustrate how passengers have responded to new HSR services. Introduction
It is important to first place the development of the Chinese HSR network in its broader context. China is unique in many of its characteristics, be it for its sheer land area (9.6 m km2), the long distances between North and South, East and West, the current stage in its economic development (GDP of US$ 6,807 per capita in 2013) or its substantial population density (141 people per km2), particularly in its Central and Eastern Provinces. It has many well-interspaced
large cities of more than 500,000 inhabitants located at distances that are well suited for HSR (between 200 and 900 km). China is at a turning point in its urbanization, a strategic time to put in place the transportation backbone that will stimulate complementarity among its cities and their overall competitiveness. While in 2013, 53 percent of the population (700 million) was urbanized, by 2030, an expected 70 percent of the population (about one billion
Pub
lic D
iscl
osur
e A
utho
rized
Pub
lic D
iscl
osur
e A
utho
rized
Pub
lic D
iscl
osur
e A
utho
rized
Pub
lic D
iscl
osur
e A
utho
rized

China Transport Topics No. 11 December 2014
2
Chinese) will live in cities. The cities with a population of more than 500,000 and one million, numbering 221 and 81 respectively during the 2010 census, are expected to continue growing while others will join their ranks. Those cities will seek to develop their service industries and play a major role in the growing domestic economy. Their competitiveness will be strongly influenced by the quality of their rail, expressway and air connections to innovation networks and to supply chains, both national and international. China is also seeking to rebalance its growth geographically to reduce poverty and enhance inclusiveness. After three decades of rapid development in the Eastern Provinces, the development of the Central and Western Provinces has become a prime objective of Chinese policy makers, with improved connectivity expected to play a central role in such rebalancing. For example, by year end, the lagging province of Guizhou will be connected by HSR to the advanced province of Guangdong, opening new opportunities for both provinces and bringing Guiyang, its capital, within four to five hours of Guangzhou. As these changes take place, international benchmarks show that the average distance Chinese people travel is likely to increase multifold as its GDP per capita increases. If the average Chinese individual were to travel as much as the average Japanese, European or American, the distance they travel would be multiplied by four, five or ten respectively by 2030 compared to the level in 2012. Such increase would come in part from the many in the population who currently travel very infrequently, and will travel more as their income allows. As the Chinese economy grows in sophistication and the population becomes more affluent, the service level will also need to be raised. While new transport needs are emerging and existing transport needs are growing, the network of China Railways is one of the most densely used in the world. Between 2000 and 2013, China Railways experienced robust rail traffic growth.
Rail passenger traffic grew by 5.5 percent per annum reaching 2.1 billion passengers and 1,060 billion passenger-km in 2013. Rail freight grew by six percent per annum reaching 4.0 billion tons and 2,903 billion ton-km in 2013. These are large volumes compared to the size of its rail network (103,100 km in 2013), particularly considering that China railways carry a mix of high volumes of passengers and freight. As a result, China’s densely used rail network has about three times the traffic density of US railways and more than ten times that of European railways in 2011/2012. Such combination of rapidly growing traffic and of high existing traffic density called for major new investments in order for railways to continue playing a substantial role in the Chinese economy. The Mid-to-Long Term Railway Network Plan adopted in 2004, and updated in 2008, laid out such a railway development plan through 2020, including the connection of all provincial capitals and cities above 500,000 people to a rapid rail network of 45,000 km, including about 16,000 km of dedicated high speed rail lines. This program was subsequently accelerated to achieve most of these objectives by 2015. HSR in China Definitions of HSR differ but, generally, railways with a maximum speed of 250 km/h or more are considered as HSR. According to Order No. 34, 2013 from China’s Ministry of Railways, HSR lines generally refer to newly built passenger dedicated lines with (actual or reserved) speed of 250 km/h and above. Rapid rail includes lines that can be operated at maximum speed of at least 160 km/h. The sixth round of a series of “speed-up” campaigns, completed in April 2007, saw the introduction of China Rail-High Speed (CRH) services operated by China Railways. It included improved schedules and tracks (about 6,000 km or so were upgraded) on a number of busy corridors and the introduction of a new generation of trains able to operate at top speed of 250 km/h. A section of track between Qinhuangdao and Shenyang had been built as a

China Transport Topics No. 11 December 2014
3
trial in 2003, using conventional loco-hauled services, and saw its maximum speed increased from 200 to 250 km/h in 2007. At that point, most CRH trains still had to share heavily-used tracks with freight trains resulting in still moderate station-to-station speed, even if top speed had markedly improved. With a 10-hour trip, the average speed between Beijing and Shanghai had improved to about 132 km/h. In 2008, the first of a new generation of passenger dedicated HSR lines (PDL) started operating. In particular, the Beijing–Tianjin intercity HSR line opened in August 2008 with a maximum speed of 350 km/h and an average station-to-station speed of 240 km/h. It combined fully dedicated tracks mostly on viaducts with electric multiple units (EMUs) and quickly established itself as a competitive form of transport, carrying over 16 million passengers in its first year of operation. In 2009, the WuGuang service started operating between Guangzhou and Wuhan via Changsha as the first major long-distance route (1,079 km of mainline). By December 2012, both the 1,318 km JingHu (Beijing South – Shanghai Hongqiao) and 2,281 km JingGuang (Beijing West – Guangzhou South) passenger dedicated high speed lines became operational, connecting the three most vibrant economic clusters in China. Those lines operate at much higher average speed, station-to-station, than most of their international counterparts, thanks primarily to their dedicated lines, with the caveat that many stations are located outside central areas, and thus require additional connection time. A 693 km trip between Beijing West Station and Zhengzhou East Station can be completed in two hours 24 minutes, for an average station-to-station speed of 289 km/h. A 1,318 km trip between Beijing and Shanghai can be completed in four hours 48 minutes, for an average speed of 275 km/h. Since then, the Chinese HSR network has continued to expand to reach 12,183 line-km as of October 1, 2014 (Figure 1 also shows a number of new mixed-use lines operating at 200 km/h). It
will continue to grow rapidly as many more lines are under construction1. CRH trains meanwhile operate on both the new passenger dedicated lines and connecting upgraded conventional lines.
Figure 1. Length of China HSR and 200 km/h lines by year by category 2008-2014 (October). Source: Yearbooks of China
Transportation & Communications, China Railway Yearbooks, and Planning & Statistics Department of CRC
At the end of October 2014, most of the metropolitan regions in China are either connected, or in the process of being connected, to lines with a maximum speed of 200 km/h or above. The map on the next page shows the HSR routes that are operational, under construction, or in the current plan2 of China Railway Corporation (CRC). It also illustrates how the network effects are starting to emerge, by providing opportunities to connect cities through combinations of lines, with, for example, direct trains between Beijing and Xi’an via Zhengzhou.
1 Xinhua News, Mar 05, 2014. see:
http://news.xinhuanet.com/fortune/2014-03/05/c_119626642.htm 2 This map includes projects as listed in China Transportation
and Communications Year Books (2007 to 2013). Commencement of civil works signifies the beginning of construction although land acquisition precedes beginning of construction.
-
2,000
4,000
6,000
8,000
10,000
12,000
14,000
16,000
2008200920102011201220132014(Oct)
Cu
mu
lati
ve o
per
atio
nal
le
ngt
h (
km)
200km/h Mixed
200km/h PDL
250km/h
350km/h

China Transport Topics No. 11 December 2014
4
Figure 2. China Railway-HSR and new 200 km/h Railways (Operational, under construction and planned3, as of October 1, 2014)
Mapped by the authors based on data from China Transportation and Communications Year Books China Railway Yearbooks, and Planning & Statistics Department of CRC
3 Lines shorter than 50km are not shown on the map.
Part of the Lanzhou-Urumqi Railway will in part follow a 200km/h speed standard.

China Transport Topics No. 11 December 2014
5
In terms of sheer length, the Chinese HSR network is by far the largest in the world, followed by Spain (2,515 km at end 20134), Japan (2,388 km at end 2013), and France (2,036 km). However China is also much larger as a country and considering population densities and territorial spread, France may provide a useful benchmark as its core network is reaching overall maturity. If China was to develop as many kilometers of HSR line per inhabitant as France today, its HSR network would reach 43,000 km.
On July 1, 2014, China railway introduced a new summer service schedule with 2,447 pairs of trains, including 1,330 pairs of CRH trains, per day. Aside from increasing the CRH capacity, the new schedule allowed a shift towards more HSR services and an increase in the number of freight trains on conventional tracks, which was one of the original goals of developing the HSR network.
The new service schedule nonetheless raised some public concerns. The number of trains dispatched was not differentiated between high and low traffic periods, and few discounts were provided for tickets during lower demand periods. This may result in vacant seats during off-peak periods, while tickets will remain difficult to obtain during peak periods. A growing number of conventional rail services also were also replaced by CRH services, reducing options for people of low to middle incomes who may be less time-sensitive but more price-sensitive. These concerns could be addressed in part by introducing additional flexibility in pricing with discounted tickets during off-peak periods.
All CRH trains are operated with Electric Multiple Unit trains (EMU) consisting of eight or 16 carriages with a train capacity ranging from 494 seats to 1299 seats. Based on CRC train schedules (October 2014), up to 101 pairs of CRH trains are operated daily on busy routes and up to eight pairs of trains per hour are operated during peak hours. Traffic density on such routes is estimated
4 European Union, 2014, EU Transport in Figures. Defined as
lines on which trains can go faster than 250 km/h at some point during the Journey.
at about 30-40 million passengers. Two types of services are provided; express trains stop only at major cities while other trains stop at intermediate stations. On medium density routes, 40 to 50 pairs of trains are operated daily.
Fares vary depending on the speed of the services. Second class fares for 200 to 250 km/h HSR services are about US$ 0.045 per km, similar to intercity bus fares. Second class fares for 300 to 350 km/h HSR services are US$ 0.077 per km lower or comparable to discounted air fares. This is three to four times those on conventional express trains, but such conventional train tickets are often difficult to get and the level of service is significantly lower. This is about one quarter of the fares applied in other HSR countries 5 , reflecting in part the substantial traffic densities and occupancy rates, and the lower cost base for construction and operation. Traffic Two types of traffic volumes are reported through different sources. One reflects the traffic volume on CRH trains (referred to as “CRH traffic”). The second reflects the traffic volume on the HSR lines (referred to as “HSR lines”). While in 2008, most CRH trains operated on upgraded conventional lines, this has rapidly changed over recent years. Overall, about 79 percent of CRH passengers used HSR lines by 2013, while only six percent did in 2008. During the period 2008-2013, total rail passenger volume continued to grow at 7.6 percent annually, but with a change in traffic composition. While conventional rail traffic grew at 1.5 percent annually, CRH traffic grew at 39 percent per annum since 2008. Unlike what was originally anticipated, as of 2013, CRH services had not yet led to a reduction in overall conventional train traffic at a network level. Rather, it provided for an accelerated growth in rail traffic, which the previous network, close to its full capacity, was
5 France: 0.24 to 0.31 US$/km; Germany 0.34 US$/km; Japan:
0.29-0.31 US$/km, based on official travel websites.

China Transport Topics No. 11 December 2014
6
unable to achieve. By October 1, 2014, CRH delivered an estimated 2.9 billion trips, with an estimated 1.9 billion on HSR lines. In 2013, CRH reached an estimated 672 million trips or 32 percent of all rail trips. HSR lines carried 530 million trips, or about 25 percent of all rail trips, on less than 11 percent of the rail network (Figure 3). HSR lines carried a total of 214.1 billion passenger-km and CRH trains 221.7 billion passenger-km. The average CRH trip was 330 km, a number growing steadily as a result of the opening of long lines like JingGuang in December 2012. The large number of passenger on short intercity CRH trains lowers the average.
Figure 3. Rail Passenger Traffic Including CRH and HSR Line Traffic, Source: China Statistics for 2008-2012, Planning & Statistics Department of CRC for 2013. The two busiest lines are the JingHu (Beijing – Shanghai) and JingGuang (Beijing – Guangzhou), each estimated to carry over 100 million passengers in 2014. Few of these passengers travelled end-to-end and the average trip length in both corridors is about 500 kilometers. The first long distance line, WuGuang (about 969 km), now part of JingGuang, carried around 50 million passengers p.a. in 2013, of whom about 14 million came from interline traffic (illustrating network effects), and about half of whom appear
to have transferred from the conventional services with the other half being generated6. Based on the People’s Railway Post in January 2014, the average seat occupancy was 70 percent. The average traffic density7 has increased from 2.8 million in its first year to the current 22.5 million passengers, which is substantial for a system in its early years of existence (Figure 4).
Figure 4. HSR Lines Traffic Densities, Source: China Statistics for 2008-2012, Planning & Statistics Department of CRC for 2013.
While HSR has experienced stronger growth than air transport, the two modes remain quite different in their features. In 2013, twice as many domestic trips were taken on CRH services (672 million) than by air (327 million domestic trips). While air trips have grown continuously at about 13 percent per annum between 2008 and 2013, CRH service growth has been substantially faster at 39 percent. But the average air trip was substantially longer at 1,363 km in 2012 and is lengthening, presumably as short air routes (below 800 km) tend to be cancelled when faced with HSR competition.
6 Although this service has had a significant impact on air
travel in the corridor, particularly between Changsha and Guangzhou, passengers transferring from air are a relatively small part (under 5%) of the total patronage. 7 Defined as the passenger-kilometers divided by the
average length of HSR lines in operation for the year.
0
500
1000
1500
2000
2500
2008 2009 2010 2011 2012 2013
Pas
sen
ger
(mill
ion
)
Year
CRH Total Rail HSR
0.0
5.0
10.0
15.0
20.0
25.0
2008 2009 2010 2011 2012 2013
Ave
rage
tra
ffic
den
sity
(mill
ion
)
Year

China Transport Topics No. 11 December 2014
7
For short trips (under, say, 150 kilometers), car and bus often remain competitive, especially if the HSR station is located far from the city center, while for trips of over four hours on HSR lines (over 1,000 km), air is still an attractive option. Nevertheless, the reliability, frequency and comfort of CRH services create strong competition for most middle-distance trips. For short-distances, a number of cities have started using CRH as a commuting option, like Baoding connecting to Beijing and Shijiazhuang (Hebei). While the HSR network in China will rapidly reach maturity, HSR traffic is still in its early days as shown by the experience of Japan and France, the two leaders in HSR traffic volumes outside China. Japan, the pioneer in HSR, opened its first and busiest line, the Tokaido Shinkansen between Tokyo and Osaka, 50 years ago on October 1, 1964. This project was supported by a World Bank loan. Japan National Railways and its successors managed to grow their HSR traffic markedly for the first 12 years of full operations (12.5 % per annum), experienced contraction between 1976 and 1981, followed by rapid growth between 1981 and 1991 and then slower growth over the following twenty years (Figure 5). Japan reached 322 million passengers in 2012 on a network of 2,388 km, with a cumulative level of over 10 billion passengers over 50 years. The average trip was 267 km in 2012, for a total level of 86 billion passenger-km. The Tokaido Shinkansen carried about 143 million trips a year in 2012 with about 320 trains a day with an average speed of 213 km/h and a maximum speed of 270 km/h. France, the leader in terms of HSR traffic in Europe, launched its first and most successful line between Lyon and Paris in 1981. In 2013, France accounted for about 46 percent of HSR passenger-kilometers in the EU, with 2,036 km of HSR lines. In 2012, 57 percent of rail passenger-kilometers in France were on HSR services.
Figure 5. HSR Traffic in Japan, Source: Japan High-Speed Rail Passenger Traffic Statistics Report
Like Japan, France experienced a high level of HSR traffic growth of nine percent in its first 30 years of operations, reaching 51 billion passenger-km in 2012 and about 114 million passengers (Figure 6). The line between Paris and Lyon operates at an average speed of 195 km/h. Newer lines like the LGV East opened in 2007 have average speeds comparable to new lines in China, but most traffic remains on earlier lines at this point.
Figure 6. HSR Traffic in France, Source: INSEE and Les comptes des transports en 2012-2013
Judging from both of these examples and from the expected mobility increase in China, the current level of traffic is relatively strong. In 2013, the HSR passenger density in China after five years of operations (22.5 million) was close
0
50
100
150
200
250
300
350
19
64
19
68
19
72
19
76
19
80
19
84
19
88
19
92
19
96
20
00
20
04
20
08
20
12
An
nu
al H
SR P
asse
nge
r Tr
affi
c (m
illio
ns)
Years
0
10000
20000
30000
40000
50000
60000
19
84
19
86
19
88
19
90
19
92
19
94
19
96
19
98
20
00
20
02
20
04
20
062
008
20
10
20
12
Pas
sen
ger-
km (
mill
ion
)
Years

China Transport Topics No. 11 December 2014
8
to that of France (25 million of HSR passenger-km per km of line 8 ) after its 32 years of operation. While it will take longer to reach the current level in Japan (36 million), China’s current level also compares favorably with the level in Japan at the same stage of development.
Considering the overall development context of China, traffic can be expected to continue its rapid growth over the coming two decades, with levels closely related to the pace of economic development. This network also offers high transport capacity, a feature particularly relevant during the peak traffic periods in China at which time all transport systems are used at their maximum level. Experience in France indicates traffic could be further expanded by offering differentiated pricing strategies based on occupancy rates. Case Studies: HSR Services on Jilin-Changchun and Tianjin-Jinan
To better understand the characteristics of ridership, CRC together with the World Bank and the Third Railway Survey and Design Institute (Tianjin) carried out on-board train passenger surveys of the HSR and conventional train services along the Changchun-Jilin and Tianjin-Jinan corridors in May 20139, collecting 1,001 questionnaires. The survey collected information on passengers, including both local train journeys within the case study area and longer distance trips going beyond it.
The two HSR services had been operating broadly in line with their design specifications, had reached stable passenger flows, and had significantly improved the accessibility of the cities and towns they connect. Also, they did not have other fast rail services running in parallel, which made it easier to observe the effects.
8 The number of passenger-km in France also includes
passengers travelling in EMU on upgraded track, which are not HSR lines. This is insignificant on the Sud-Est services but much more so for the TGV Atlantique. 9 See the full report “Regional Economic Impact of
High Speed Rail in China” on World Bank website.
The first case study is the Changchun-Jilin intercity services, with a route length of 110 km. It is a branch line connecting to the Harbin to Dalian trunk line. Changchun and Jilin are respectively the largest and the second largest cities of Jilin Province in Northeast China with a legacy of old heavy industries. This HSR line also connects to Longjia Airport midway between the two cities. This line, in nature and scale, is similar to many of the new HSR extensions to come. The services have been running for nearly three years, now reaching 45 pairs of trains per day carrying nine million passengers in both directions per annum. The short journey time attracts commuting, business and leisure travelers.
The second case study is between Tianjin and Jinan, which is a part of the northern section of the Beijing-Shanghai HSR. The Beijing-Shanghai HSR is a primary trunk line in the “4+4” national HSR network10, connecting two mega city regions at either end. Between Tianjin and Jinan, the Beijing-Shanghai HSR is the only fast rail connection. The train services attract significant business and leisure travel ranging in distance from 150 to 1,500 km. In total, there were over 70 pairs of CRH trains daily on this section, carrying over 36 million passengers annually in 2013.
Train passengers: HSR vs conventional trains
The predominant group of passengers was between 25 and 55 year old for both HSR and conventional trains. On the intercity route of Changchun-Jilin, there were no significant differences in the proportion of the under 25’s or the over 55’s. Conventional trains were used proportionately more by the under 25’s on the Tianjin-Jinan trains, which may result from student fare discounts being restricted to conventional trains only (Figure 7). Men accounted approximately for 60% of the passengers and women 40% on both HSR and conventional trains.
10
i.e. four east-west corridors and four north-south corridors across China; see Figure 2.

China Transport Topics No. 11 December 2014
9
Figure 7. Age Distribution of Passengers
Business trips accounted for 62% of the total trips on Tianjin-Jinan HSR and 45% of the total on Changchun-Jilin HSR, percentages that were substantially higher than on the ordinary trains (51% and 28% respectively). The strong business activity on the Tianjin-Jinan and Beijing to Shanghai route explains the high rate on that segment. There was minimal daily work commuting use on the Tianjin-Jinan HSR, whilst it accounted for 43% of business trips on Changchun-Jilin, reflecting the much shorter distance range on Changchun-Jilin relative to Tianjin-Jinan. At 28% and 46% respectively leisure trips represented a substantial part of all HSR trips, even though the share was smaller than in the case of conventional trains (Figure 8).
Figure 8. Trip Purpose
As expected given the characteristics of each line, short-distance trips (<300km) accounted for 97% on Changchun-Jilin. On Tianjin-Jinan, the short (<300km), medium (300~800km), and long distance (>800km) accounted for 13%, 35% and 52% respectively11. Again, the patterns on the conventional trains were similar.
The survey results provide an initial indication that the CRH services are used by a relatively broad range of income levels, with a majority of travelers coming from the higher income quintile. In 2012, the average per capita annual income of urban households was RMB2,238 per month, and RMB4,722 per month (US$1=RMB6.1) for the upper quintile. On Changchun-Jilin HSR, the average self-reported monthly personal income12 was around RMB4,300 compared with 3,200 on the conventional train13. The equivalent values on the Tianjin-Jinan HSR were RMB6,700 and 4,500 respectively. On Changchun-Jilin, over 70% of the HSR passengers reported a monthly income of less than RMB5,000 compared to 85% passengers on conventional trains. On Tianjin-Jinan HSR, 50% reported an income of less than 5,000 (Figure 9).
Caution is of course required with the self-reported income figures, as richer individuals tend to understate their incomes to some extent in all countries14. In addition, values would likely be substantially different if calculated during peak periods during which migrant workers travel the most. The income distribution of train passengers would be worth examining in more depth in future monitoring.
11
Based on the passengers surveyed in the vicinity of Jinan.
Over the Beijing – Shanghai corridor as a whole, the proportion of long-distance is rather less. 12
In the Chinese context this is generally understood as the monthly average take-home pay or regular receipts from pension and properties. 13
The average on conventional trains drops to 2,200 if
passengers from Jiutai, a coal mining town with significantly higher incomes are excluded. 14
See, e.g. review by Chris Bramall (2001). The Quality of China’s Household Income Surveys. SOAS working paper. http://eprints.soas.ac.uk/10693/1/QualityofChinasHouseholdIncomeSurveys.pdf
0%
10%
20%
30%
40%
50%
0 20 40 60 80
Age
Changji-HSR Changji-Ordinary
Jinghu-HSR Jinghu-Ordinary
45% 46
9%
28
58%
14
62%
28
10%
51
37%
12%
0%
20%
40%
60%
80%
100%
Business Leisure Other
Changji-HSR Changji-Ord
Jinghu-HSR Jinghu-Ord

China Transport Topics No. 11 December 2014
10
Figure 9. Monthly Income (RMB)
The transport mode used to access HSR stations reflects a key difference in where the stations are placed in the cities. In both Changchun and Jilin, the HSR serves existing rail stations close to the city center. On Changchun-Jilin, 43% of HSR passengers accessed the stations by public transport and 9% on foot. The stations on the Beijing-Shanghai HSR are placed outside existing built-up areas and not all the planned metro and fast bus access has been completed yet. At present, only 29% HSR passengers reached the stations by public transport and 1% on foot. There were also other factors at play. For instance, the means of access may also be related to the fact that there is a much higher proportion of business trips on Tianjin-Jinan, where 11% of passengers access by company cars (as opposed to 2% on Changchun-Jilin; Figure 10). In both cases, a high percentage of access took place by taxis.
Because of the longer journey distances on Tianjin-Jinan, HSR passengers were on average spending 4.3 days away from home, compared with 2.8 days on Changchun-Jilin HSR. On both corridors, the HSR passengers stayed approximately one day less away from home than for those on conventional trains. Faster travel and more frequent services were likely to have contributed to this, as some passengers were able to trade off higher fares against other travel
expenses. This might in part explain why there were a significant number of HSR passengers with modest incomes.
Figure 10. Connecting Modes to Railway Stations
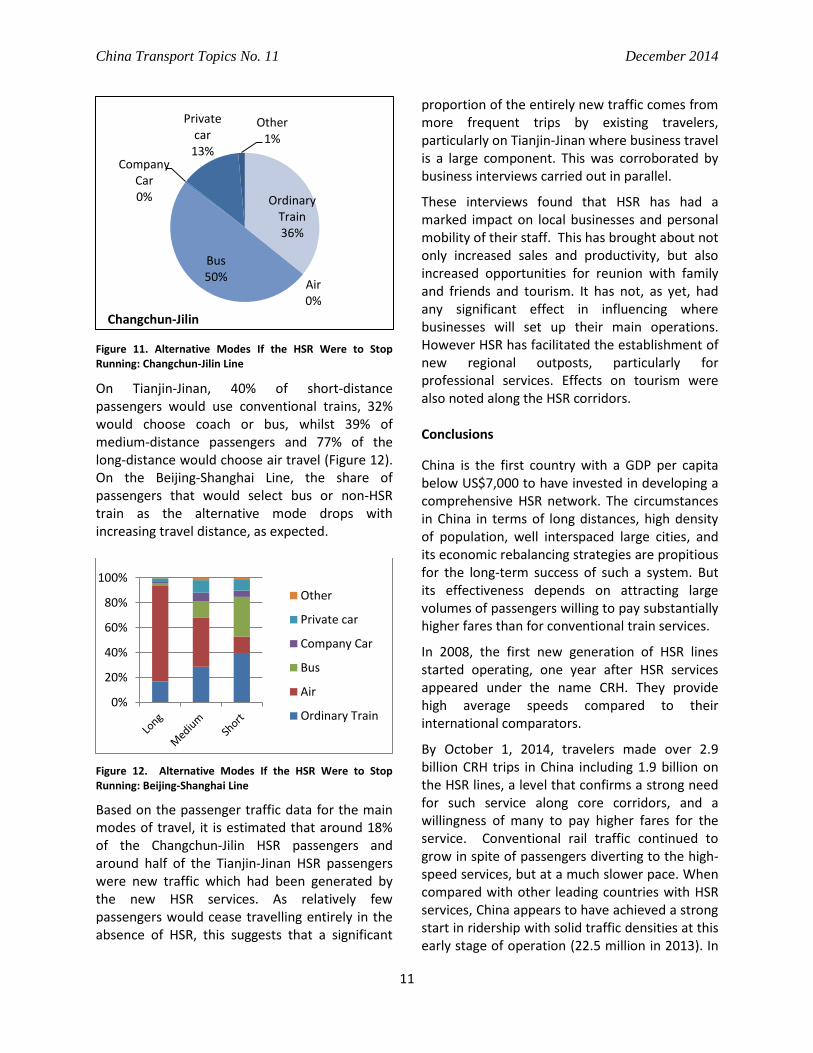
The survey asked what the passengers would do if the HSR services were to stop. Only about 10 percent of the passengers said that they would no longer be travelling, although, based on the increase in total traffic by all modes, many would clearly only reduce their travel frequency. Among the rest, on Changchun-Jilin, half of the passengers would choose coach or bus, 36% conventional trains and 13% car (Figure 11).
0%
20%
40%
60%
80%
100%
<2000 2001-5000 5001-10000
10001-20000 >20001
Walk 9%
Taxi 41%
Public transport
43%
Company car 2%
Private car 5%
Changchun-Jilin
Walk 1%
Taxi 38%
Public transport
29%
Company car
11%
Private car
18%
Other 3%
Beijing-Shanghai
China Transport Topics No. 11 December 2014
11
Figure 11. Alternative Modes If the HSR Were to Stop Running: Changchun-Jilin Line
On Tianjin-Jinan, 40% of short-distance passengers would use conventional trains, 32% would choose coach or bus, whilst 39% of medium-distance passengers and 77% of the long-distance would choose air travel (Figure 12). On the Beijing-Shanghai Line, the share of passengers that would select bus or non-HSR train as the alternative mode drops with increasing travel distance, as expected.
Figure 12. Alternative Modes If the HSR Were to Stop Running: Beijing-Shanghai Line
Based on the passenger traffic data for the main modes of travel, it is estimated that around 18% of the Changchun-Jilin HSR passengers and around half of the Tianjin-Jinan HSR passengers were new traffic which had been generated by the new HSR services. As relatively few passengers would cease travelling entirely in the absence of HSR, this suggests that a significant
proportion of the entirely new traffic comes from more frequent trips by existing travelers, particularly on Tianjin-Jinan where business travel is a large component. This was corroborated by business interviews carried out in parallel.
These interviews found that HSR has had a marked impact on local businesses and personal mobility of their staff. This has brought about not only increased sales and productivity, but also increased opportunities for reunion with family and friends and tourism. It has not, as yet, had any significant effect in influencing where businesses will set up their main operations. However HSR has facilitated the establishment of new regional outposts, particularly for professional services. Effects on tourism were also noted along the HSR corridors. Conclusions
China is the first country with a GDP per capita below US$7,000 to have invested in developing a comprehensive HSR network. The circumstances in China in terms of long distances, high density of population, well interspaced large cities, and its economic rebalancing strategies are propitious for the long-term success of such a system. But its effectiveness depends on attracting large volumes of passengers willing to pay substantially higher fares than for conventional train services.
In 2008, the first new generation of HSR lines started operating, one year after HSR services appeared under the name CRH. They provide high average speeds compared to their international comparators.
By October 1, 2014, travelers made over 2.9 billion CRH trips in China including 1.9 billion on the HSR lines, a level that confirms a strong need for such service along core corridors, and a willingness of many to pay higher fares for the service. Conventional rail traffic continued to grow in spite of passengers diverting to the high-speed services, but at a much slower pace. When compared with other leading countries with HSR services, China appears to have achieved a strong start in ridership with solid traffic densities at this early stage of operation (22.5 million in 2013). In
Ordinary Train 36%
Air 0%
Bus 50%
Company Car 0%
Private car
13%
Other 1%
Changchun-Jilin
0%
20%
40%
60%
80%
100%
Other
Private car
Company Car
Bus
Air
Ordinary Train

China Transport Topics No. 11 December 2014
12
2013, China HSR lines carried slightly more passenger-kilometers as the rest of the world combined, 2.5 times that of Japan and four times that of France, the second and third respectively in terms of traffic volumes.
A large proportion of HSR riders belong to the 25-55 age group, with many travelling for business (62% based on Tianjin-Jinan case study), with HSR facilitating an increase in trip frequency for businesses. The average length of travel for CRH passengers is about 330 km in 2013, but actual length varies substantially per line. A broad range of travelers of different income levels choose the HSR for its comfort, convenience, safety and punctuality over existing alternatives. Users perceive it as facilitating reunions with family and friends, tourism and access to job opportunities15.
The self-reported income levels from the on-train survey suggests that the majority of passengers had income of less than RMB5,000 per month (50 to 70% of users in the two case studies). The HSR passengers’ average income was higher than that of non-HSR trains by 35% to 50%. In many ways, the HSR appears to have filled a gap in the type of services previously offered.
Understanding and addressing passenger needs will be critical to achieve the full impact of the HSR network. While initial results are encouraging, HSR remains a major investment that requires high traffic density to be justified economically and financially.
This can be achieved by working closely with cities to develop carefully areas around stations in a way that leverages the gain in accessibility provided by HSR. This is now officially encouraged by State Council Directive #2014(37) on “Land Comprehensive Development in Supporting Railway Construction” issued in August 2014.
15
http://blogs.worldbank.org/transport/node/656 and http://www.worldbank.org/content/dam/Worldbank/document/EAP/China/high_speed-rail-%20in-china-en.pdf
It also requires careful attention to the overall door-to-door trip experience for travelers. This includes dealing with aspects that sometimes extend beyond the remit of railways, for example by improving the access to and from the station, and, in particular, reducing the current waiting time for taxis at stations or ensuring good frequency for public transport services. It also includes optimizing train frequencies and city pairing based on emerging trip patterns and user surveys, introducing flexible ticket prices reflecting peak/off-peak periods, and introducing convenient e-ticketing services. By focusing on these aspects, and on the efficient and effective operation of the HSR network, HSR in China can be expected to continue to experience substantial growth for many years to come.
Gerald Ollivier is a Sr. Transport Specialist from the Beijing Office of the World Bank, leading or co leading teams working on Bank supported railway projects in China.
Dick Bullock is a transport consultant specializing in railway business planning, financial modelling and project evaluation.
Ying Jin is Deputy Director of Martin Centre for Architectural and Urban Studies, Cambridge University and Fellow of Robinson College, Cambridge.
Nanyan Zhou is a transport consultant working with the World Bank and specializing in railway and traffic engineering.
This note is part of the China Transport Note Series to share experience about the transformation of the Chinese transport sector. For comments, please contact Gerald Ollivier ([email protected]).
Any findings, interpretations and conclusions expressed herein are those of the authors and do not necessarily reflect the views of the World Bank. Neither the World Bank nor the authors guarantee the accuracy of any data or other information contained in this document and accept no responsibility whatsoever for any consequence of their use.
The boundaries, colors, denominations, and other information shown on any map in this work do not imply any judgment on the part of The World Bank concerning the legal status of any territory or the endorsement or acceptance of such boundaries