high-speed rail economics, urbanization and housing
TRANSCRIPT

Contact: [email protected], [email protected], [email protected]
High-Speed Rail Economics, Urbanization and Housing Affordability Revisited: Evidence from the Shinkansen System
Jerry Nickelsburg Anderson School of Management
University of California, Los Angeles
Saurabh Ahluwalia Anderson School of Management
University of New Mexico
Yang Yang International Monetary Fund
August 24, 2018
Abstract: In this study we re-examine the impact of the Shinkansen in Japan from 1964 to 2010. To identify the effects of Shinkansen, we examine, separately and jointly, the entire system as it evolved over time under different economic conditions. We construct a prefecture-level dataset for Japan with macroeconomic and socio-demographic variables, as well as information on the opening and operation of each Shinkansen line. The evidence suggests that high-speed rail has a negative impact on prefecture land prices and population growth, and it increases urbanization. Evidence of high-speed rail induced urban expansion increasing housing affordability and reducing urban density is found. Key Words: High-speed rail, Urbanization, Real estate, Shinkansen
JEL Codes: O10, R10

2
Introduction High-speed rail has become the vogue transportation infrastructure investment in the world today. China leads the way with an ambitious program of trunk routes including plans for long-range high-speed rail to Europe. Projects in India, Malaysia, Thailand, Morocco and the US are underway. While there are many reasons to build high-speed rail—an alternative to highway or airport infrastructure, cleaner transportation, convenience, and the replacement of existing congested rail service—an oft-heard argument is that high-speed rail will lead to greater economic growth and job creation. Less heard, but equally important, is the logic that led to the first major high-speed rail line, the Tokaido Line in Japan; that of easing congestion and improving commuting in the Tokyo region. We revisit the longest operating high- speed rail system, the Japanese Shinkansen, here in a study of land prices, population dispersion and GDP growth, and draw implications for affordable housing for some of the world’s most dense and least affordable cities The economic impact of high-speed rail (HSR) has been analyzed and critiqued by many researchers. For example; Sands (1993), Givoni (2006), De Rus and Nombela (2007), Gourvish (2010), Abalante and Bel (2012), Preston (2012), Nickelsburg and Ahluwalia (2012), and Chen (2018). Individual country studies of HSR include Wang et al (2009), Banerjee, Duflo and Qian (2009), and Qin (2014) on China; Haynes (1997), Sasaki, Ohashi and Ando (1997), and Banister and Berechman (2000) on Japan; Dargay and Clark (2012) on Britain and Vickerman (1996), Gutierrez Gonzalez and Gomez (1996), Gutierrez (2001), Puga (2002), Barron et al (2009) and Socorro and Viecens (2013) on Europe. The results of the research cited above are mixed but generally conclude that the connectivity of markets (economies of scale) and the lowering of the cost of business travel are weakly related to more rapid economic growth. However, the relationship between housing affordability and HSR has not been well studied. Though Baum-Snow’s (2007) study of highways and urban sprawl is instructive with respect to population distribution, HSR is different in two ways; it transforms far-outlying regions into reasonable commuting time locations, and it typically carries only passengers and not freight. Identifying how HSR affects housing affordability requires separating out that part which is related to induced economic growth in the region surrounding the rail corridor, and that which is related to lower cost commuting. More generally, transportation infrastructure and economic growth studies must deal with an identification problem. Namely, is the transportation infrastructure, in this case HSR, caused by regional economic growth or is it a causal factor of it. Fishlow’s (1965) seminal work on railroads in the U.S. Midwest contended that the rail lines were laid down in response to and not because of westward population migration, and therefore, were not causal factors in economic growth. Canning and Fay (1993) addressed this identification problem with a cross-country analysis of rates of return to rail and road construction and found them to be highly

3
variable and only somewhat related to the degree and vintage of the industrial sector affected. Rephann and Isserman (1994) found similar results for highway infrastructure in West Virginia. Boopen (2006) examined infrastructure in developing Sub-Saharan Africa and concluded it was a causal factor in economic growth. Atak, Bateman, Haynes and Margo (2010) revisited Fishlow using an instrumental variables analysis and concluded that about half of the urbanization, and therefore economic growth was attributable to the railroad. Faber’s (2011) identification strategy was a hypothetical least-cost spanning tree network in a study of Chinese highways; and Donaldson and Hornbeck (2016) addressed identification with a Ricardian trade “market access” approach measuring the effect of the railway system on agricultural land values in America. Nevertheless, these and other quasi-experimental control observation studies have not settled the question of causality between economic growth and the newer transportation technology; HSR1 nor have they been able to causally relate it to urban sprawl and housing affordability. The strategy herein is related to Canning and Fay (1993) in that it employs the variation in the treatment (HSR) over all Japanese prefectures and over time. Specifically, we re-examine the impact of the Shinkansen in Japan. The HSR system in Japan grew, on average, with one new line every four years between1964 to 2004. This spans a period of rapid growth and a period of stagnation in the Japanese economy. In addition, through the time period of our study, there were many prefectures that did not have a Shinkansen line operating within their borders and many that had a Shinkansen line for only part of the period. By examining the entire system as it evolved over time; including non-Shinkansen prefectures as controls; capturing different economic regimes both separately and jointly; and analyzing the difference between both real estate values and economic growth from their expected values due to other factors, we are able to solve the identification problem. In post-World War II Japan, many prefectures were growing rapidly but most were not early beneficiaries of HSR. This was because the initial system was designed to be an alternative to congestion on certain city pairs (e.g. Tokyo-Nagoya-Osaka). In addition, some prefectures along the rail lines were predominately rural at the time of HSR introduction (e.g. Shizuoka), and others, though they were industrial and growing rapidly, were not favorably placed between the target cities (e.g. Chiba). By studying the entire evolution of the Shinkansen, this work adds to the body of knowledge on HSR’s urban economic impact. We have created a unique set of data on the long experience of the Shinkansen with which to ask the above questions. We benefit from a more extensive data series with more treatments than previous HSR
1 See also Esteban Martin (1988), Reitvelt et al (2001), Graham (2007), Elhorst and Oosterhaven (2008), Preston and Wall (2008), Graham and Melo (2010), and Preston (2012) on agglomeration effects,

4
studies such as those of Chen and Abreau (2014), Nakamura and Ueda (1989), and Hirota (1985). The study empirically analyzes, compares and contrasts HSR treatment variables in two distinct economic regimes in Japan: the rapid growth period and the stagnation period. The span of the study allows our findings to be generalizable across different sets of economic conditions and helps to understand the broader macro-economic impacts. This study also adds to the literature by studying the impact of HSR on housing affordability and urban sprawl. The article proceeds with a brief history of the Japanese Shinkansen followed by two simple models that can incorporate the impact of HSR, a description of the data, and the results. The Shinkansen At the end of World War II much of Japan’s infrastructure and capital stock were in shambles. As described by Roderick Smith; “When the Occupational forces arrived in Japan in 1945 they were stunned to see the extent of urban destruction caused by the bombing…Resources had been absorbed by the war effort with the result that both equipment and infrastructure were in a grievous state.” A key to recovery was rebuilding and upgrading the transportation system. The nationalized railway company, JNR, added electrification, dual tracks and other upgrades to the national system, and in particular, to the Tokaido line linking the populous metropolises of Tokyo and Osaka. However, by the mid 1950’s the rail system was reaching capacity. Though the general consensus was that road and air travel would replace rail as the dominant transportation mode, executives at JNR made the case for an all passenger, high-speed rail line (HSR). In 1958 a government panel was formed and they recommended construction of a high-speed passenger rail line to relieve congestion on the Tokaido corridor, to relieve commuter congestion in Tokyo, and to facilitate economic growth2. Construction began in 1959 and was completed in 1964 in time for the opening of the Olympic Games. Construction of the rail line was financed through bonds and a World Bank loan. JNR was able to achieve the financial and governmental support by demonstrating that it was using established high-speed rail technology through the engineering expertise gained from the Asia Express; a rail line they built and operated from 1934 to 1943 in the colony of Manchuko which had been carved out of the Chinese region of Manchuria3.
2 See for example: Smith (2003) and Wakuda (1997) for a description of the infrastructure issues and decisions. 3 See Jackson (1913), and Young (1998) for a description of the Japanese railway in Manchuria.

5
The objective of the Tokaido Line was to relieve pressure on an overcrowded rail transport network between the three largest Japanese cities, Tokyo, Osaka and Nagoya. It was also viewed as a relief valve for crowded conditions in Tokyo as it reduced the cost of commuting from outlying villages and cities. The Tokaido line has often been cited as one of the most successful HSR lines for both its role in reducing congestion and its role in generating economic growth4 Subsequent to the introduction of the Tokaido Line, Japan began building the Sanyo line linking Osaka to Fukuoka with completion in 1972 and an extension in 1975. The Tohoku Line was completed in four segments, 1982, 1985, 1991, and 2002. The Joetsu line opened in 1982 and the Hokaruku opened in 1997. The last line represented in our data set is the Kyushu Line opening in 2004. This construction ultimately linked most of the large Japanese cities into the high-speed rail Shinkansen network. Upgrades and improvements to the network have continued and new technologies introduced as they have been developed. The expansion of this system provides a backdrop for counterfactuals in an analysis of HSR systems in that there were on average four years between the opening of new lines, and there were many prefectures, including ones with large cities, that did not have HSR during at least part of the period 1964 to 2010. Hypotheses HSR is designed for the faster moment of people, and potentially some goods and services, across different geographies. It makes regional markets function more efficiently by reducing transport frictions between them, and by allowing the supply and demand for different products, services and labor to more efficiently match. The effect of HSR on a prefecture’s economic growth is closely related to the effect of HSR on housing and land prices. If HSR induced faster economic growth in the prefecture it is operating in then an associated increase in land prices would reflect both migration towards the higher economic growth region, as well as migration from surrounding areas to higher economic growth region due to reduced commuting costs. However, if HSR did not induce higher economic growth, then the demand for commercial space and housing for a newly employed labor force would be absent. Even though at some locations within a prefecture, for example near train stations, land prices may rise, in general land prices in the wider region ought to fall below that expected absent HSR, as HSR increases the supply of land available to the now larger viable geography of the city. To capture the effect on overall GDP we formulate our hypotheses as follows: 4 See for example: Okada (1994), Matsuda (1993), Girvoni (2006), Gourvish (2010).

6
H1a: Prefectures with Shinkansen will have relatively higher GDP and/or GDP growth rates than other comparable prefectures. H1b: Prefectures with Shinkansen will have relatively higher GDP and/or GDP growth during the years the prefecture had Shinkansen compared to the years it did not. To capture the effect on land prices due to HSR induced migration we formulate our hypotheses as follows: H2a: Prefectures with Shinkansen will see a rise in housing/land prices conditioned on a positive prefecture GDP growth response. H2b: Prefectures with Shinkansen will see a decrease in housing/land prices conditioned on the prefecture GDP growth rates being statistically unaffected by the presence of HSR. Theoretical Models To organize the analysis, we propose two simple models, one of GDP and the other of housing location choice. These models embody all of the macro behavior we expect to see or refute in our analysis, and therefore, by Occam’s Razor, are the appropriate models for this study. For GDP assume that for each prefecture i, output, Yi is given by:
𝑌𝑖 = 𝐴𝑖𝐾𝑖𝛼𝐿𝑖
(1−𝛼)Π𝑗=1
𝑛 𝑇𝑖,𝑗𝛾(𝑖,𝑗)
Where Y is income, A is TFP, K is capital stock, L is labor and T is a vector of variables describing the impact of transportation infrastructure on the production of Y. Dividing by L and taking logs:
𝑦𝑖 = 𝑎𝑖 + 𝛼 𝑙𝑜𝑔 (𝐾𝑖
𝐿𝑖) + Σ𝑗𝛾𝑖,𝑗 𝑙𝑜𝑔 (
𝑇𝑖,𝑗
𝐿𝑖)
Taking time differences yields:
𝑦𝑖(𝑡) − 𝑦𝑖(𝑡 − 1) = (𝑎𝑖(𝑡) − 𝑎𝑖(𝑡 − 1)) + 𝛼 (𝑙𝑜𝑔 (𝐾𝑖(𝑡)
𝐿𝑖(𝑡)) − 𝑙𝑜𝑔 (
𝐾𝑖(𝑡 − 1)
𝐿𝑖(𝑡 − 1)))
+ Σ𝑗𝛾𝑖,𝑗 (𝑙𝑜𝑔 (𝑇𝑖,𝑗(𝑡)
𝐿𝑖(𝑡)) − 𝑙𝑜𝑔 (
𝑇𝑖,𝑗(𝑡 − 1)
𝐿𝑖(𝑡 − 1)))
The first term (a(t)-a(t-1)) picks up technological and process change by prefecture and will be captured by year/prefecture fixed effects. Our data set for Tj includes

7
population density, measures of distance from the terminus of the HSR line, Shinkansen dummy variables and the existence of a significant seaport. Prefecture GDP and prefecture tax revenue are the measures of income used in the study. Population, public and private capital stocks fill out the data set for these regressions. To analyze the geographic impacts, we organized the regressions to be consistent with a simple choice of location model embodying a utility function decreasing in commuting time. Let: 𝑈 = 𝑈(𝐼, 𝐶, 𝑅) Be the utility function with ∂U/∂I > 0 and ∂U/∂C <0 Where I is income, C is transportation cost including the value of time spent commuting, and R defined as a vector of the amenities for the worker’s domicile. For any given income, job location and pair of potential residence locations (1,2), if C1 < C2 and R1 ≥ R2 then the worker resides in location 1. The worker then maximizes U over the set of possible domicile locations. Location j is chosen whenever U(I,Cj,Rj) > U(I,Ci,Ri) for all i ≠ j. We abstract here from the fact that the introduction of the Shinkansen could provide new job opportunities such that I increases along the line and is higher than that of the worker’s current job. The presence of the Shinkansen in proximity to location j lowers the cost Cj in time spent, and depending on the fare schedule and subsidies, may lower it absolutely. Then: If Rj – Ri is sufficiently small then there exists a Cj such that U(I,Cj,Rj) > U(I,Ci,Ri). This is an important point because it highlights that C is the policy lever that can make, as was anecdotally reported for the Tokaido Shinkansen, housing that was not considered affordable because of commuting costs, now affordable, and may therefore ease the pressure on urban home prices. The Data The primary source of the data is the Statistics Bureau of the Ministry of Internal Affairs and Communications, Japan. GDP data are from the Cabinet Office, Japan5. GDP Data are from the time period 1955 to 2010. 1955 was the first year for which we were able to obtain GDP at the prefecture level. 2010 is the last year for which we collected data for various variables. Data for public and private capital stock is based on database constructed by Kyoji Fukao and Ximing Yue (2000)5. 5 We thank Saito Yukiko and Makoto Hazama for their invaluable help in translating the GDP data pages from Japanese to English. 6 Land price data is available for download from https://tochidai.info/.

8
Data on land prices are from the Ministry of Land, Infrastructure, Transport and Tourism. We only have access to digitized data starting from year 19836. Therefore, we investigate the effect of the Shinkansen on land prices only over the period 1983 - 2010. The fixed effect data on airports and seaports, and on prefectures containing the final terminus or the penultimate terminus for a Shinkansen line were constructed by the authors. GDP data were matched for each prefecture with corresponding data on various economic variables including population, area population densities and capital stock. Data on Shinkansen lines were coded for each prefecture for each year as 0 or 1 where 1 signified the prefecture had an operational Shinkansen line for at least part of that year. The time period during which the Shinkansen was under construction was coded as 0 to discount any temporary effects due to increased level of construction. If a prefecture had more than one Shinkansen it was still coded as 1. Nominal GDP numbers were converted to real GDP numbers by dividing by Japan’s CPI index. To account for different regimes in Japanese data corresponding to periods of rapid growth and stagflation we segmented the data set. Analysis is performed on two time periods 1955-1997 and 1998-2010. The first period corresponds to the “high growth” period in Japan, while the latter period is one of very low to negative growth. The analyses describe below are for varying time periods depending on data availability and the criteria above. The GDP analyses begin in 1955, prior to the first Shinkansen line operating, while others examine a subset of the years subsequent to 1964. Empirical Results Economic growth The first set of regressions investigates the impact of high-speed rail infrastructure on prefecture level rates of economic growth. This is an essential step in assessing how HSR affects housing affordability. If it were to induce faster economic growth, then land prices would reflect both in-migration due to this economic stimulus, as well as in-migration by commuters previously living in cities further down the rail line. On the other hand, if HSR is not economic growth inducing, then although in some locations, particularly those near rail stations, it will induce an increase in land prices, in general a larger amount of land will be available for the residential market and the impact on aggregate prices might be unambiguously negative. The data employed are from 1955 to 1995, a period of rapid growth throughout Japan and a period for which measures of public and private capital stock by prefecture exist. The results for the change in real GDP by prefecture are revealing (Table 1). The coefficient of private capital is significant and positive, as expected. Investment

9
increased the rate of growth of GDP. However, increases in population (the potential labor force) had the opposite effect. Moreover, the presence of the Shinkansen also reduced prefecture GDP growth rates. An explanation of the increase in population and decrease in GDP growth rates is that the new migrants had lower productivity than the previous population. Our housing choice theory is that lower productivity workers ought to respond to the shorter commuting times to obtain lower housing prices. This is due both to an income effect and the fact that many city amenities are luxury goods. Similarly, higher income workers may now find it more attractive to live in the urban core taking their higher consumption demand with them (Rietveld et al (2001)). Though decreasing returns may also explain the result, this is controlled for with the non-Shinkansen prefectures. The regressions on GDP/Capita are similar (Table 2). Private investment increases GDP/Capita growth rates, but the presence of the Shinkansen (and a major port) reduces it. In the GDP growth rate regressions public investment reduced (or was negatively correlated with) prefecture growth rates. On a per-capita basis this result goes away. The coefficients remain negative, but, they are not statistically significant. This is evidence in favor of both the Fishlow (1965), and Canning and Fay (1993) theory of infrastructure being added in response to economic growth and not as a catalyst to it, and with HSR inducing urban sprawl to include additional, less expensive land to dense urban regions. While our analysis does not support a growth rate impact of high-speed rail, it is possible that the introduction of high-speed rail provides a one-time boost to the level of GDP and GDP/Capita while leaving the growth rates unchanged. The next set of regressions (Table 3) asks of the data whether or not the level of prefecture GDP is affected by the presence of a Shinkansen line. As with the first set of regressions the data are from 1955 to 1995 and include measures of prefecture capital stock. When controlling for the other factors in the production function, it is found that the Shinkansen had no significant impact on the level of prefecture GDP. All three variables measuring permanent impacts, the presence of a Shinkansen, the prefecture being the terminus of the Shinkansen line and the prefecture being the first prefecture after the terminus on the Shinkansen line were not significant. This is not to say that the Shinkansen had no effect. It is possible that the financing of the lines though bond issues and in the case of the Tokaido line a World Bank loan, squeezed out other public infrastructure. It may also be the case that the results in Table 3 obtain because high-speed rail altered the location within the prefecture of the population, and of private and public investments, and they rather than the presence of the Shinkansen per se generated increased economic activity. Those three factors are highly significant in the regression. However separate from those channels, an effect is not observed. Fixed effects for each of the first five years following the introduction of the Shinkansen to a prefecture are significant and positive. This suggests that there is a

10
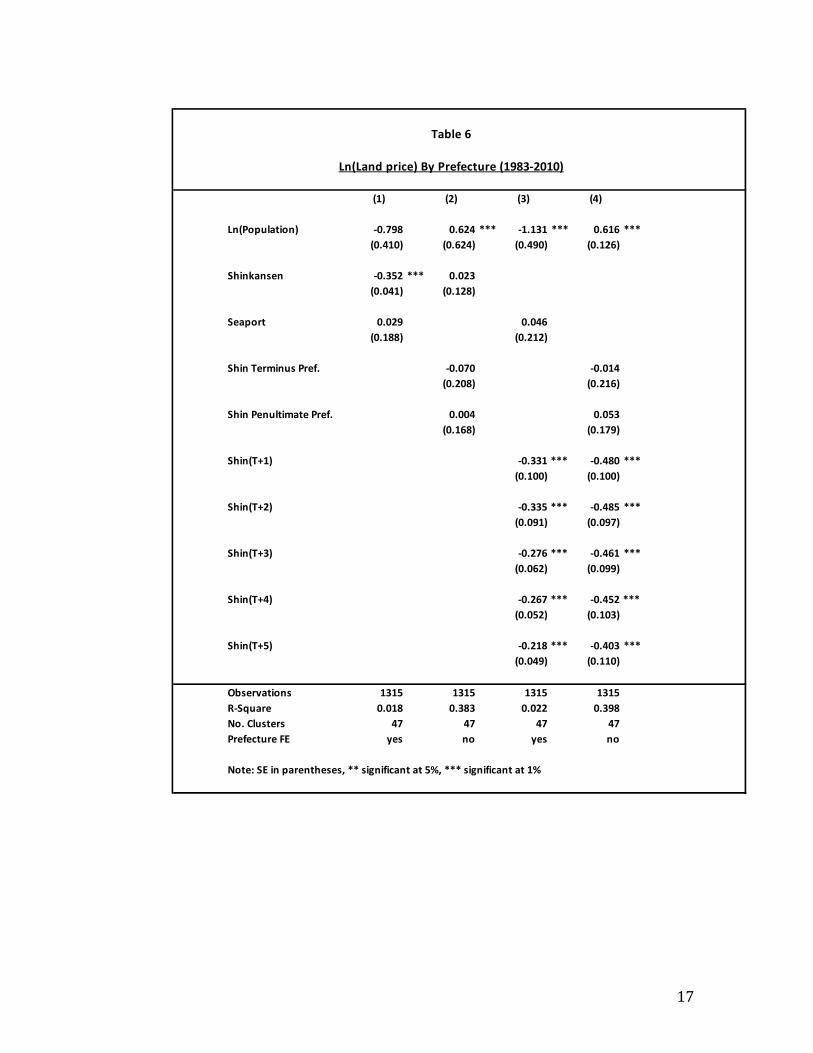
temporary impact on prefecture GDP in the years immediately following the opening of the line. The effect may well be the building of infrastructure and housing for migrants who are choosing to live elsewhere due to the reduced cost of commuting. Once the capital investment is in place, the effect is manifested in the private capital variable and no longer associated (statistically) with the presence of the Shinkansen. Housing Affordability Job and income growth create the basis for household formation and therefore the demand for housing. In prefectures with high income growth one would expect declining housing affordability. On the other hand, in a stagnant or declining economy one would expect the opposite. As Japan experienced both in distinct episodes in our data, we are able to address the potentially asymmetric effects of HSR on affordability. Although no significant increase in GDP growth rates in prefectures with a Shinkansen line was found, the dispersion of populations due to the Shinkansen lowering commuting costs might well be related to the overall national economic environment. To analyze this aspect of HSR and housing affordability we segmented the differential growth experiences in Japan. We use 1997/1998 as the break between growth episodes. After 1997, the Japanese economy cooled considerably, but the expansion of the Shinkansen system to more prefectures continued. Table 4 presents regressions for the rapid growth period with GDP/capita as the dependent variable. The coefficient on population density is significant and negative. This likely occurred because lower productivity individuals moved further out increasing density (and decreasing per-capita GDP of the prefectures they moved to) and high productivity individuals stayed in or moved into the more amenity rich city increasing GDP/capita in the city core. The evidence suggests that while higher productivity individuals may have moved in, on net, more people moved out to the outlying regions. This result combined with the negative and statistically significant coefficient for the Shinkansen is further evidence that the Shinkansen was creating more housing for lower income people in the exurb prefectures relative to those that did not have a Shinkansen. Table 5 presents the same regressions for the slow growth episode. The results are similar to the rapid growth period. The coefficient on the Shinkansen fixed effect remains negative and statistically significant. The coefficient on population density is also negative and significant, and the magnitude of the coefficient is greater than in the fast growth period. We would expect this, as when economic prospects are not as good, the value of time is lower. Therefore, living in the denser, costlier city becomes relatively less attractive and commuting by high-speed rail to a distant suburb becomes relatively more attractive. The final evidence on housing affordability and high-speed rail comes from land prices. When more land is added to the available residential stock, other things being equal, the price of land will fall. If overall metropolitan economic activity is not

11
affected by the presence of the Shinkansen, and prices for land decline, then we conclude that high-speed rail was a partial solution to housing affordability as it evidently increased the reasonably usable land to supply housing. We find that Shinkansen connections negatively affected land prices in Japanese prefectures. We regressed the log of land price on the Shinkansen variable. The results are presented in Table 6. We find that a Shinkansen connection in the previous year reduced land prices by 33% in the current year. Regressions using changes in land prices rather than log-levels show similar results (Table 7). A decentralization story would be consistent with the results we find: the Shinkansen helped Japanese cities to decentralize, which in return reduced the property prices in cities from what they otherwise might have been. Conclusion That HSR increases the convenience of living in outlying suburbs of crowded and expensive cities is self-evident. What has not been heretofore clear is whether or not HSR may serve as one of the solutions to a lack of affordable housing. Were HSR to induce rapid economic growth along the line, it is possible that housing nearby would be more rather than less expensive. In this study we examined the experience in Japan, and we found that over a fifty-five years period, the Shinkansen eased land costs and relieved some of the pressure on home prices in major cities. Though we focus on Japan in order to study the most extensive system of HSR over the longest period of time, the single country analysis might be limited due to factors specific to Japan. Future studies should look at data from multiple countries to test the sensitivity of our results. Our analysis also showed that there may be a temporary boost to GDP growth rates as the infrastructure and housing associated with a newly built HSR along the rail line is constructed. Thus, temporary economic gains may be obtained from building an HSR line, gains that may be used by policy makers to offset idle resources during an economic downturn. Though more micro studies are needed to confirm the generality of our results, our findings point to a promising new avenue for affordable housing policy. Planners crafting policy ought to evaluate the optimal allocation of scarce housing resources by weighing the costs and benefits of building transportation infrastructure that adds residential land against the costs and benefits of building additional residential units on existing city land closer to the city center.

12

13

14
Table 3
Ln(GDP) By Prefecture (1955-1995)
(1) (2) (3) (4)
Ln(Population) 0.235 ** 0.454 *** 0.219 ** .453 ***
(0.105) (0.030) (0.104) (0.035)
Ln(Private K) 0.994 *** 0.804 *** 0.986 *** 0.807 ***
(0.048) (0.037) (0.048) (0.036)
Ln(Public K) -0.366 *** -0.197 *** -0.363 *** -0.198 ***
(0.052) (0.037) (0.053) (0.037)
Shinkansen -0.034 -0.019
(0.030) (0.026)
Seaport 0.117 0.021 0.108 0.018
(0.067) (0.027) (0.075) (0.026)
Shin Terminus Pref. 0.014 0.013
(0.040) (0.041)
Shin Penultimate Pref. -0.034 -0.035
(0.034) (0.035)
Shin(T+1) 0.065 *** 0.082 ***
(0.017) (0.018)
Shin(T+2) 0.079 *** 0.095 ***
(0.017) (0.019)
Shin(T+3) 0.056 ** 0.076 ***
(0.024) (0.023)
Shin(T+4) 0.072 ** 0.093 ***
(0.027) (0.031)
Shin(T+5) 0.054 ** 0.073 **
(0.026) (0.028)
Observations 1910 1910 1910 1910
R-Square 0.968 0.978 0.969 0.979
No. Clusters 47 47 47 47
Prefecture FE yes no yes no
Note: SE in parentheses, ** significant at 5%, *** significant at 1%

15
Table 4
ΔLn(GDP/Capita) By Prefecture (1955-1997)
(1) (2) (3) (4)
Population Density -0.166 *** 0.000 -0.271 *** -0.029 ***
(0.000) (0.000) (0.000) (0.000)
ΔLn((GDP/Capita)(t-1)) 0.328 *** 0.358 *** 0.352 *** 0.377 ***
(0.026) (0.022) (0.027) (0.023)
Shinkansen -0.24 *** -0.014 ***
(0.004) (0.002)
Seaport -0.031 *** -0.007 ** -0.039 *** -0.009 ***
(0.005) (0.003) (0.002) (0.002)
Shin Terminus Pref. 0.003 0.002
(0.002) (0.001)
Shin Penultimate Pref. 0.003 0.000
(0.002) (0.001)
Shin(T+1) 0.015 0.015
(0.018) (0.017)
Shin(T+2) -0.007 -0.007
(0.012) (0.012)
Shin(T+3) 0.031 *** 0.031 ***
(0.007) (0.007)
Shin(T+4) -0.025 ** -0.025 **
(0.011) (0.010)
Shin(T+5) 0.007 0.006
(0.006) (0.006)
Observations 1974 1974 1974 1974
R-Square 0.163 0.154 0.156 0.151
No. Clusters 47 47 47 47
Prefecture FE yes no yes no
Note: SE in parentheses, ** significant at 5%, *** significant at 1%

16
Table 5
ΔLn(GDP/Capita) By Prefecture (1998-2010)
(1) (2) (3) (4)
Population Density -0.891 *** 0.00 -0.890 *** 0.00
(0.000) (0.000) (0.000) (0.000)
ΔLn((GDP/Capita)(t-1)) -.115 *** -.097 *** -.113 *** -.093 ***
(0.026) (0.026) (0.026) (0.026)
Shinkansen -.007 *** -.004 **
(0.001) (0.002)
Seaport 0.00 -0.001
(0.006) (0.006)
Shin Terminus Pref. 0.004 0.002
(0.002) (0.003)
Shin Penultimate Pref. 0.001 -0.001
(0.002) (0.002)
Shin(T+1) -0.004 0
(0.008) (0.007)
Shin(T+2) 0.024 0.028
(0.021) (0.019)
Shin(T+3) -0.021 -0.018
(0.033) (0.031)
Shin(T+4) -.025 *** -.021 ***
(0.006) (0.004)
Shin(T+5) 0.004 0.008
(0.021) (0.022)
Observations 561 561 561 561
R-Square 0.016 0.011 0.025 0.018
No. Clusters 47 47 47 47
Prefecture FE yes no yes no
Note: SE in parentheses, ** significant at 5%, *** significant at 1%
17
Table 6
Ln(Land price) By Prefecture (1983-2010)
(1) (2) (3) (4)
Ln(Population) -0.798 0.624 *** -1.131 *** 0.616 ***
(0.410) (0.624) (0.490) (0.126)
Shinkansen -0.352 *** 0.023
(0.041) (0.128)
Seaport 0.029 0.046
(0.188) (0.212)
Shin Terminus Pref. -0.070 -0.014
(0.208) (0.216)
Shin Penultimate Pref. 0.004 0.053
(0.168) (0.179)
Shin(T+1) -0.331 *** -0.480 ***
(0.100) (0.100)
Shin(T+2) -0.335 *** -0.485 ***
(0.091) (0.097)
Shin(T+3) -0.276 *** -0.461 ***
(0.062) (0.099)
Shin(T+4) -0.267 *** -0.452 ***
(0.052) (0.103)
Shin(T+5) -0.218 *** -0.403 ***
(0.049) (0.110)
Observations 1315 1315 1315 1315
R-Square 0.018 0.383 0.022 0.398
No. Clusters 47 47 47 47
Prefecture FE yes no yes no
Note: SE in parentheses, ** significant at 5%, *** significant at 1%

18
Table 7
ΔLn(Land price) By Prefecture (1984-2010)
(1) (2) (3) (4)
ΔLn(Population) 1.095 *** 1.109 *** 1.1026 *** 1.0784 ***
(0.287) (0.262) (0.278) (0.252)
Shinkansen -0.071 *** -0.004
(0.014) (0.005)
Seaport 0.003 0.001
(0.003) (0.002)
Shin Terminus Pref. 0.014 ** 0.011 **
(0.005) (0.005)
Shin Penultimate Pref. 0.010 0.007
(0.006) (0.005)
Shin(T+1) -0.026 -0.027 **
(0.018) (0.011)
Shin(T+2) 0.006 0.001
(0.018) (0.016)
Shin(T+3) 0.023 0.019
(0.033) (0.031)
Shin(T+4) 0.019 0.015
(0.021) (0.019)
Shin(T+5) 0.059 0.054
(0.033) (0.031)
Observations 1267 1267 1267 1267
R-Square 0.013 0.010 0.010 0.011
No. Clusters 47 47 47 47
Prefecture FE yes no yes no
Note: SE in parentheses, ** significant at 5%, *** significant at 1%

19
Appendix: Data Description
ShinkansenDummy variable =1, if for the year Shinkansen was present in the
prefecture.
LagShin1Dummy variable =1, if Shinkansen started in that prefecture one
year ago.
LagShin2 Dummy variable =1, if Shinkansen started in that prefecture two
years ago.
LagShin3Dummy variable =1, if Shinkansen started in that prefecture three
years ago.
LagShin4Dummy variable =1, if Shinkansen started in that prefecture four
years ago.
LagShin5Dummy variable =1, if Shinkansen started in that prefecture five
years ago.
GDP Real Gross Domestic Product
GDPGrowth GDP Growth at time t is defined as (GDPt -GDPt-1)/(GDPt-1)
GDPPerCapita GDP/Population
GDPPerCapitaGrowthGDPPerCapita Growth at time t is defined as (GDPPerCapitat -
GDPPerCapitat-1)/(GDPPerCapitat-1)
Private K Private Capital Stock
Public K Public Capital Stock
Data Dictionary I

20
Population GrowthPopulation Growth at time t is defined as (Populationt -
Populationt-1)/(Populationt-1)
PopDensityUrban Urban Population/Urban Area
PopDensityRural Rural Population/Rural Area
AirportDummy variable =1, if a class 2 or class 1 airport is in the
prefecture for the year.
Seaport Dummy variable =1, if a seaport is in the prefecture for the year.
LastDummy variable =1, if the prefecture is the last terminal on a
Shinkandsen line.
SecondLastDummy variable =1, if the prefecture is the second last terminal
on a Shinkandsen line.
Data Dictionary II

21
References Abalante, Daniel and Germa Bel. 2012. High-Speed Rail: Lessons For Policy Makers From Experiences Abroad. Public Administration Review. 72:3:336-349.
Atak, Jeremy, and Fred Bateman, Michael Haines, and Robert A. Margo. 2010. Did Railroads Induce or Follow Economic Growth. Social Science History. 34:2. 171-197. Banerjee, Abhijit, Esther Duflo and Nancy Qian. 2012. On the road: Access to transportation infrastructure and economic growth in China," National Bureau of Economic Research WP17897. Banister, David and Joseph Berechman. 2000. Transport Investment and Economic Development. London and New York: Routledge.
Barron, Ignacio and Javier Campos, Phelippe Gagnepain, Chris Nash, Andreu Ulied, and Roger Vickerman. 2009. Economic Analysis of High Speed Rail in Europe. Ed. Gines de Rus. Fundacion BBVA, Bilbao Spain.
Baum-Snow, Nathaniel. 2007. Did Highways Cause Suburbanization, The Quarterly Journal of Economics. 122:2,1 775-805. Canning, David, and Marianne Fay. 1993. "The Effect of Infrastructure Networks on Economic Growth." New York: Columbia University, Department of Economics. Cervero, Robert and Michael Bernick . 1996. High-Speed Rail and Development of California’s Central Valley: Comparative Lessons and Public Policy Considerations. IURD Working Paper 675.
Chen, Chia-Lin. 2018. Tram development and urban transport integration in Chinese
cities: A case study of Suzhou. Economics of Transportation.
Chen, Guineng and João Abreau e Silva. 2014. Estimating the provincial economic
impacts of high-speed rail in Spain: An application of structural equation modeling.
Procedia – Social And Behavioral Sciences. 111:157-165.
Dargay, J.M. and Clark, S., 2012. The determinants of long distance travel in Great
Britain. Transportation Research Part A: Policy and Practice, 46:3. 576-587.
De Rus, Ginés and Gustavo Nombela. 2007. Is Investment In High Speed Rail Socially
Profitable? Journal of Transport Economics and Policy. 41:1:3-23.
Elhorst, J. Paul and Jan Oosterhaven. 2008. Integral cost-benefit analysis of Maglev
projects under market imperfections. Journal of Transport and Land Use. 1:1:65-87.
Esteban Martin, Victor. 1988. La Alta Velocidad Ferroviaria en La Unión Europea.

22
Su Impacto Urbano en Francia y España. Geographicalia. 36:19-32.
Faber, Benjamin. 2014. Trade Integration, Market Size, and Industrialization: Evidence from China's National Trunk Highway System. The Review of Economic Studies. Fishlow, Albert. 1965 American Railroads and the Transformation of the Ante Bellum Economy. Harvard University Press, Cambridge, MA. Fukao, Kyoji and Ximing Yue. 2000. "Sengo nihon kokunai ni okeru keizaishusoku to seisanyoso tonyu," (Economic Convergence and Factor Inputs in Post-War Japan), Economic Review, 51:2. Givoni, Moshe. 2006. Development and Impact of the Modern High-Speed Train: A Review. Transport Reviews. 26:5. 593-611.
Gourvish, Terry. 2010. The high speed rail revolution: History and Prospects. High
Speed Two Limited (HS2 Ltd). London.
Graham, Daniel J. 2007. Agglomeration, Productivity, and Transport Investment.
Journal of Transport Economics and Policy. 41:3:317-343.
Graham, Daniel J. and Patricia Melo. 2010. Advice on the Assessment of Wider
Economic Impacts: A Report for HS2. Imperial College, London.
Gutierrez, J., Gonzalez, R., and Gomez G. 1996. The European High-Speed Train Network. Journal of Transport Geography. 4. 227-238.
Gutierrez, J. 2001. Location, Economic Potential and Daily Accessibility: An Analysis of the Accessibility Impact of the High-Speed Line Madrid-Barcelona-French Border. Journal of Transport Geography. 9. 229-242.
Haynes, Kingsley. 1997. Labor markets and regional transportation improvements: the case of high-speed trains. The Annals of Regional Science. 31. 57–76.
Hirota, Ryosuke. 1985. Japon L’Effet Shinkansen. Transports. 310:678-687.
Jackson, Luis. 1913. Rambles in Japan and China. Railway and Locomotive Engineering. 26:3. 90-92.
Matsuda, M. 1993. Shinkansen: the Japanese dream. in: J. Whitelegg, S. Hultén and F. Torbjörn, Eds. High Speed Trains: Fast Tracks to the Future. Leading Edge Hawes. North Yorkshire. 111–120.
Nakamura, Hideo and Takayuki Ueda. 1989. The Impacts of the Shinkansen On Regional Development. Transport Policy, Management and Technology Towards 2001: Selected Proceedings. Fifth World Congress on Transport Research.

23
Yokahama, Japan. 3:95-111.
Nickelsburg, Jerry and Saurabh Alhuwalia. 2012. California High Speed Rail and Economic Development: Lessons From Japan. UCLA Anderson Forecast. June:97-107.
Okada, Hiroshi. 1994. Features and Economic and Social Effects of The Shinkansen. Japan Railway and Transport Review. 3:9-16.
Puga, Diego. 2002. European regional policies in light of recent location theories. Journal of Economic Geography. 2:4. 373-406. Preston, John and Graham Wall. 2008. The Ex Ante and Ex Post Economic and Social Impacts of the Introduction of High-speed Trains in South East England. Planning Practice and Research. 23:3:403-422. Preston, John, 2012. High Speed Rail in Britain: about time or a waste of time? Journal of Transport Geography. 22:308-311. Qin, Yu. 2011. Counties Left Behind: The Distributional Impact of High-Speed Rail in China, Working Paper. Cornell University. Rephann, Terrance and Andrew Isserman. 1994. New Highways as Economic Development Tools: An Evaluation Using Quasi-Experimental Methods. Regional Science and Urban Economics. 24:6. 723-751. Rietveld, Piet, Frank R. Bruinsma, Hadewijch T. Van Delft and Barry Ubbels. 2001. Economic Impact of High Speed Trains: Experiences in Japan and France, Expectations In The Netherlands. Research Memorandum. Faculteit der Economische Wetenschappen en Bedrijfskunde. 2001-20. Sasaki, Komei, Tadahiro Ohashi, and Asao Ando. 1997. High-speed Rail Impact on regional systems: Does the Shinkansen contribute to dispersion? The Annals of Regional Science. 31:77-98. Sands, Brian. 1993. “The Development Effects of High-Speed Rail Stations and Implications for California.” Built Environment 19:3/4. 257-284.
Socorro, P., Viecens, F., 2013. The effects of airline and high speed train integration. Transportation Research Part A: Policy and Practice. 49. 160–177.
Seetanah Boopen. 2006. Transport Infrastructure and Economic Growth: Evidence from Africa Using Dynamic Panel Estimates. The Empirical Economics Letters. 5:1. 37-52.

24
Smith, Roderick A. 2003. The Japanese Shinkansen: Catalyst For The Renaissance of Rail. Journal of Transport History. 24:2. 222-237.
Vickerman, Roger. 1997. High-Speed Rain in Europe: Experience and Issues for Future Development. The Annals of Regional Science. 31. 21-38.
Wang, Jiaoe, Fengjun Jin, Huihui Mo, and Fahui Wang. 2009. Spatiotemporal evolution of China’s railway network in the 20th century: An accessibility approach. Transportation Research Part A: Policy and Practice. 43:8. 765-778.
Wakuda, Yasuo. 1997. Railway Modernization and Shinkansen. Japan Railway and Transport Review. 10. 60-63.
Young, Louise. 1998. Japan’s Total Empire: Manchuria and The Culture of Wartime Imperialism, University of California Press. Berkeley, CA.