high speed rail contribution to sustainable mobility
TRANSCRIPT

HAL Id: dumas-00793156https://dumas.ccsd.cnrs.fr/dumas-00793156
Submitted on 21 Feb 2013
HAL is a multi-disciplinary open accessarchive for the deposit and dissemination of sci-entific research documents, whether they are pub-lished or not. The documents may come fromteaching and research institutions in France orabroad, or from public or private research centers.
L’archive ouverte pluridisciplinaire HAL, estdestinée au dépôt et à la diffusion de documentsscientifiques de niveau recherche, publiés ou non,émanant des établissements d’enseignement et derecherche français ou étrangers, des laboratoirespublics ou privés.
High speed rail contribution to sustainable mobilityThomas Baron
To cite this version:Thomas Baron. High speed rail contribution to sustainable mobility. Business administration. 2009.<dumas-00793156>

0
THOMAS BARONMémoire de stage de fin d’études – Septembre 2009
MASTER 2 TRANSPORTS URBAINS ET REGIONAUX DE PERSONNES
STUDY ON HIGH SPEED RAIL CONTRIBUTION TO SUSTAINABLE
MOBILITY

1

2
Fiche bibliographique
[Intitulé du diplôme] Master Professionnel Transports Urbains et Régionaux de Personnes (TURP) [Tutelles] - Université Lumière Lyon 2 - Ecole Nationale des Travaux Publics de l'Etat (ENTPE) [Titre] La contribution de la grande vitesse au développement durable
[Sous-titre] [Auteur] Thomas BARON [Membres du Jury (nom et affiliation)] Patrick BONNEL, LET ENTPE Aurélie JEHANNO, SYSTRA Conseil Guillaume MARTINETTI, SYSTRA Conseil [Nom et adresse du lieu du stage] SYSTRA Conseil 93, rue de la victoire 75009 Paris
[Résumé] Dans un contexte de changement climatique et d’augmentation de la mobilité avec des contraintes budgétaires croissantes, seuls les projets respectant les piliers du développement durable (économique, social et environnemental) pourront être envisagés. Il s’agit donc de montrer aux autorités décisionnaires en quoi la Grande Vitesse ferroviaire répond par rapport aux autres modes de transport concurrents à ces critères. L’étude comprend une analyse multicritère pour comparer l’impact des lignes à grande vitesse avec ses concurrents selon des aspects environnementaux, économiques et sociaux. Ensuite une présentation du bilan carbone comme nouvel outil d’évaluation des projets de transport dans le domaine environnemental est donnée. [Mots clés] Grande Vitesse Développement durable Bilan Carbone
Diffusion : - papier : [oui/non]* - électronique : [oui/non]* (* : Rayer la mention inutile) Confidentiel jusqu'au : 01/09/2012
[Date de publication] Septembre 2009
[Nombre de pages] 106
[Bibliographie (nombre)] 4

3
Publication data form
[Entitled of Diploma] Master Degree Diploma in Urban and Regional Passenger Transport Studies [Supervision by authorities] - Université Lumière Lyon 2 - Ecole Nationale des Travaux Publics de l'Etat (ENTPE) [Title] High Speed Rail contribution to Sustainable Mobility. [Subtitle] [Author] Thomas BARON [Members of the Jury (name and affiliation)] Patrick BONNEL, LET ENTPE Aurélie JEHANNO, SYSTRA Conseil Guillaume MARTINETTI, SYSTRA Conseil [Place of training] SYSTRA Conseil 93, rue de la victoire 75009 Paris
[Summary] In a context of climate change, increase in mobility and growing budgetary constraints, projects that fit with the pillars of sustainable development will be the only to be envisaged. This study aims to demonstrate to authorities the advantages of High Speed Rail as a comparison with other transport modes within the framework of sustainable development. The study contains a muti-criteria comparison of High Speed Rail with its main concurrent for environmental, economical and society aspects. Then a presentation of a carbon balance methodology as a new tool to evaluate transport projects in the fields of environment. [Key Words] High Speed Rail Sustainable Development Carbon Balance
Distribution statement : - Paper : [yes / no]* - Electronic : [yes / no]* (* Scratch the useless mention) Declassification date : 01/09/2012
[Publication date] September 2009
[Nb of pages] 106
[Bibliography] 4

4
Remerciements
Je tiens à adresser mes remerciements à ma tutrice de stage, Aurélie JEHANNO, ainsi qu’à ses collègues Dan PEPION et Guillaume MARTINETTI pour leur encadrement leur disponibilité, et leurs conseils avisés.
Je remercie également toute l’équipe de SYSTRA Conseil pour leur accueil chaleureux et leur aide tout au long du stage. Je remercie notamment son directeur Hubert METGE et son adjointe Nadège BOURGIS pour m’avoir fait confiance en retenant ma candidature.
Je souhaite également remercier mes interlocuteurs des départements Génie Civil et Ouvrages d’art et Equipements et Systèmes de Transport de SYSTRA pour l’ensemble des données qu’ils m’ont fournies et pour le travail conséquent accompli pour cela.
Je remercie Messieurs Bruno FAIVRE D’ARCIER et Patrick BONNEL responsables du master Transports Urbains et Régionaux de Personnes pour m’avoir permis de concrétiser mon orientation professionnelle et pour leurs précieux conseils.
Enfin, je tiens à remercier l’ensemble de la 17ème promotion du master TURP pour l’année passée, et l’ensemble des souvenirs accumulés.

5
SOMMAIRE :
REMERCIEMENTS..............................................................................................................................4
PRESENTATION DU STAGE ET DE L’ENTREPRISE .................................................................7
1 Présentation de l’étude.........................................................................................................................7
2 Les Origines de SYSTRA..........................................................................................................................8
3 SYSTRA aujourd’hui...............................................................................................................................8
INTRODUCTION.............................................................................................................................. 10
HIGH SPEED RAIL AND SUSTAINABLE DEVELOPMENT.................................................... 11
1 High Speed Rail Definition ...................................................................................................................11
2 High speed Rail Development worldwide.............................................................................................12
3 High Speed Rail and Sustainability .......................................................................................................13 3.1 Definition of sustainability................................................................................................................... 13 3.2 Implications for the transport sector and High Speed Rail.................................................................. 13
I. HIGH SPEED RAIL AND THE ENVIRONMENT .................................................................... 15
1 Insertion in the environment...............................................................................................................16 1.1 Impacts on Natural Habitat ................................................................................................................. 16 1.2 Impact on the fauna ............................................................................................................................ 17
2 Impact on pollution and global warming..............................................................................................18 2.1 Energy consumption............................................................................................................................ 18 2.2 Air pollution and Global Warming....................................................................................................... 20 2.3 Global warming ................................................................................................................................... 23
3 Impact on habitat and living conditions ...............................................................................................24 3.1 Assessment of Noise pollution impact for society............................................................................... 24 3.2 Transport modes contribution to noise pollution ............................................................................... 27 3.3 Solutions to contain noise burden....................................................................................................... 30 3.4 Particular disturbances due to High Speed Rail................................................................................... 34
4 Conclusion ..........................................................................................................................................35
II. HIGH SPEED RAIL AND THE ECONOMY ............................................................................. 36
1 What are the costs of High Speed Transport ........................................................................................37 1.1 Infrastructure costs ............................................................................................................................. 37 1.2 Rolling stock and operating costs ........................................................................................................ 40

6
2 How High Speed Rail can be funded?...................................................................................................43 2.1 Different types of funding sources ...................................................................................................... 44 2.2 Main trends of transport funding........................................................................................................ 44 2.3 Modal comparison of funding experiences ......................................................................................... 45
3 High Speed Rail contribution to the Economy ......................................................................................48 3.1 High Speed Rail and the concurrence.................................................................................................. 48 3.2 Impact on economic activity and regional development .................................................................... 51 3.3 High Speed Rail externalities ............................................................................................................... 57
4 Conclusion ..........................................................................................................................................59
III. HIGH SPEED RAIL AND THE SOCIETY............................................................................... 61
1 Safety .................................................................................................................................................62 1.1 A modal comparison of fatality rates .................................................................................................. 62 1.2 Safety and railways.............................................................................................................................. 65
2 Social Equity........................................................................................................................................67 2.1 Affordability......................................................................................................................................... 67 2.2 Ethic and prices.................................................................................................................................... 70 2.3 Territorial equity.................................................................................................................................. 72
3 Social mutations..................................................................................................................................75 3.1 Impacts on living conditions ................................................................................................................ 75 3.2 Changes in social structures ................................................................................................................ 76 3.3 Impacts on mobility ............................................................................................................................. 76
4 Conclusion ..........................................................................................................................................77
LE BILAN CARBONE, UN OUTIL D’EVALUATION DES PROJETS DE TRANSPORTS.... 79
1 Une nouvelle méthode d’évaluation....................................................................................................79 1.1 Définition du Bilan Carbone................................................................................................................. 79 1.2 Intérêt de la démarche dans les processus d’évaluation et dans le cadre de l’étude......................... 81 1.3 Une nécessaire adaptation aux projets de transport .......................................................................... 82
2 Présentation de la méthodologie de l’étude ........................................................................................85 2.1 Définition de l’étude............................................................................................................................ 85 2.2 Méthodologie utilisée.......................................................................................................................... 86
3 Conclusions et remarques personnelles ...............................................................................................92
CONCLUSION GENERALE ............................................................................................................. 93
TABLE DES ILLUSTRATIONS ...................................................................................................... 94
ANNEXES ........................................................................................................................................... 96
7
Présentation du stage et de l’entreprise
Le présent mémoire a pour objet de présenter le travail accompli durant les 6 mois de stages que j’ai effectués au sein de Systra Conseil. Ce stage s’est déroulé dans le cadre du programme du Master 2 Transports Urbains et Régionaux de Personnes (TURP) de l’Université Lyon II et de l’Ecole Nationale des Travaux Public d’Etat (ENTPE).
1 Présentation de l’étude
L’étude que j’ai réalisée traite de la contribution de la grande vitesse ferroviaire à la mobilité et au développement durable. Elle a été réalisée pour le compte de l’Union Internationale des Chemins de fer (UIC). L’UIC est une association internationale qui représente les entreprises du monde ferroviaires au niveau international. Crée en 1922, elle regroupe aujourd’hui pas moins de 199 entreprises dans le monde. L’UIC défend les intérêts de ces compagnies à travers notamment une action de lobbying assez forte. Par ailleurs, la contribution de l’UIC en termes de publications sur différents thèmes inhérents au monde ferroviaire est assez importante et son important réseau d’adhérents lui permet d’obtenir des informations des entreprises dans le domaine ferroviaire à travers le monde.
L’objet de l’étude pour le client a été de démontrer la supériorité de la grande vitesse ferroviaire sur les mondes concurrents autoroutiers et aériens à travers 2 volets :
• Une étude comparative des avantages des lignes à grande vitesse selon les critères du développement durable. Ce travail qui constitue l’essentiel du présent mémoire est donc un travail de recherche. Il a pour objectif de rassembler les enseignements contenus dans les différentes publications qui ont été publiées sur le sujet.
• La réalisation d’un bilan carbone permettant notamment de connaitre l’impact d’une ligne à grande vitesse durant son cycle de vie en termes d’émissions de gaz à effet de serre. Le bilan carbone comprend également des éléments de comparaison entre les différents projets de LGV auxquels a participé SYSTRA, ainsi qu’une comparaison avec un projet aéroportuaire et un projet autoroutier. L’étude se terminant bien après la rédaction de ce mémoire, les résultats définitifs ne sont pas encore disponibles. Ainsi la partie consacrée au bilan carbone a pour vocation principale d’expliquer le concept et l’intérêt du bilan carbone dans les processus d’évaluation de projets d’infrastructure, ainsi que d’exposer la méthodologie qui a été utilisé pour la réalisation de l’étude.
Au-delà des objectifs liés à la réalisation de l’étude pour le commanditaire, celle-ci présentait un important intérêt en termes de développement interne dans l’entreprise. Elle a notamment permis de mobiliser des connaissances au sein des différentes entités de SYSTRA et de développer des méthodes et des connaissances pour un type d’étude qui est appelé à se développer dans le futur.

8
2 Les Origines de SYSTRA
Le groupe SYSTRA S.A. est né en 1992 de la fusion des filiales d’ingénierie créées, d’une part, par la SNCF en 1957 (SOFRERAIL, Société d’études et de réalisations ferroviaires) et d’autre part, par la RATP en 1961 (SOFRETU, Société d’études et de réalisations de transports urbains).
A l’origine, ces deux sociétés d’ingénierie ont été conçues l’une et l’autre pour diffuser le savoir-faire de leurs maisons-mères sur les marchés extérieurs et apporter une assistance technique aux réseaux étrangers qui le souhaitaient. Leur travail portait soit sur la modernisation ou la réhabilitation de lignes existantes, soit pour la création de lignes nouvelles utilisant des technologies de pointe. Elles ont rapidement acquis une reconnaissance internationale, grâce à leur double expérience de concepteur et d’exploitant. La complémentarité de leurs techniques et de leurs ressources humaines, autant que la nécessité pour chacune d’acquérir une dimension internationale suffisante par le volume de leur chiffre d’affaires pour rejoindre la classe des grandes ingénieries, a amené les deux sociétés à ce rapprochement, mettant ainsi fin à une concurrence tout en conservant la spécificité des cultures techniques respectives : ingénierie des transports urbains et ingénierie ferroviaire et interurbaine.
3 SYSTRA aujourd’hui
Le groupe SYSTRA est un des premiers groupes internationaux d'ingénierie des transports, avec ses six principales filiales : MVA Consultancy au Royaume-Uni, MVA Hong-Kong et Asie, Systra Consulting aux États-Unis, Canarail au Canada, Systra SOTECNI en Italie et Sotec Ingénierie en France (Toulouse).
Le groupe compte environ 1800 salariés pour un chiffre d’affaires consolidé de 226,9 millions d’euros en 2007. Ses activités couvrent toutes les compétences du domaine des transports urbains et ferroviaires : train à grande vitesse, tramway, transport combiné, ferroviaire conventionnel de fret et de voyageurs, dessertes de banlieue, réseaux express régionaux, métro, bus à haut niveau de service (BHNS), systèmes guidés automatiques, systèmes routiers guidés.
Systra intervient à tous les stades de la mise en œuvre d’un projet, de la conception à la réalisation et compte 50 ans d’expérience dans plus de 140 pays et 350 villes. Parmi ses principales références, on peut citer :
• Les métros de Mexico, Santiago du Chili, Caracas, Le Caire, Alger, Manille, Shanghai, Shenzhen, Canton, New Delhi, Bombay, Bangalore…
• Les tramways de Bordeaux, Saint-Etienne, Marseille, Orléans, Rouen, Nice, Nantes, Lille, Toulon, Brest...
• Le tram-train de Mulhouse, de l’île de la Réunion…
• Les systèmes routiers guidés sur pneus à Caen, Rouen, Clermont-Ferrand, Nancy…
• Les métros automatiques de Lille, Orlyval, Toulouse, Rennes, Taipei, Dubaï, Turin, Lausanne...

9
• Les liaisons à grande vitesse Londres-Tunnel sous la Manche, Corée, Taiwan…
• La réorganisation ou création de lignes ferroviaires au Vietnam, au Monténégro, en Bulgarie, en Pologne, au Venezuela…
• Les plans de transport du Caire, de Tunis, Belgrade, Pékin, de Bahreïn…
Mon stage s’est déroulé au sein de Systra Conseil qui s’appelait Planification des Transports jusqu’au mois d’avril 2009. Avant cette période le département était rattaché à la direction de l’ingénierie au même titre que les départements Génie Civil et Ouvrages d’Art (GCOA), Equipements et Systèmes de Transport (EST) et management de projets.
Figure 1 Organigramme du Groupe SYSTRA S.A
Source : SYSTRA
Quatre régions complètent cette organisation matricielle :
La région Amériques, Moyen-Orient, Afrique (AMA) ;
La région Asie Pacifique (APA)
La région Europe ; La région France.

10
Introduction
ans un contexte de changement climatique et d’augmentation de la mobilité, ainsi que de contraintes budgétaires croissantes, les projets respectant les piliers du développement durable (économique, social et environnemental) semblent devoir être privilégiés. Le
développement du réseau ferré à grande vitesse a souvent été présenté par les pouvoirs publics comme un moyen de promouvoir un mode de transport performant et durable. Le TGV est notamment considéré comme ayant un meilleur impact environnemental que les modes routiers et aériens. Le projet de réalisation de 2000 kilomètres de lignes à grande vitesse à l’horizon 2020 dans le cadre du Grenelle de l’environnement en est une bonne illustration.
La décision d’investir dans une infrastructure à grande vitesse est une décision qui peut avoir des conséquences importantes en termes d’aménagement du territoire et d’utilisation des ressources publiques. Il faut également rappeler qu’une ligne à grande vitesse, dans l’absolu, a un impact environnemental négatif. Les oppositions récentes des écologistes, les coûts élevés de la grande vitesse, ou encore l’expérience mitigée de la grande vitesse sur certains territoires ont montré que les résultats et les avantages supposés de la grande vitesse ferroviaire doivent être analysés avec attention. D’autre part, pour définir les choix qui doivent être faits dans le cadre d’un développement durable, il ne suffit pas de lister les avantages ou les coûts supposés de la grande vitesse. Ces éléments doivent être mesurés en comparaison d’autres scénarios ou choix possibles.
Dans ce cadre, on peut se demander dans quelle mesure la grande vitesse ferroviaire peut apporter une contribution au développement durable, et dans quelle mesure elle constitue une alternative préférable aux modes routiers ou aériens concurrents.
Afin de répondre à cette question, la méthode utilisée consistera en une analyse multicritère selon les trois piliers du développement durable du transport ferroviaire à grande vitesse, du transport routier et du transport aérien. L’analyse devra dans la mesure du possible se baser sur des comparaisons internationales pour décontextualiser l’analyse. Après avoir exposé la problématique de la grande vitesse et des transports dans le cadre du développement durable, l’analyse portera successivement sur les trois piliers du développement durable : l’environnement, l’économie et les aspects sociaux.
Dans une deuxième partie, la présentation d’une méthodologie de bilan carbone permettra de comprendre le fonctionnement de ce nouvel outil d’évaluation des projets de transport, ainsi que son intérêt dans le cadre du développement durable et ses éventuelles limites pour l’analyse.
D

11
High Speed Rail and Sustainable Development
s it was ignored by most of people two decades ago, the concept of sustainable development has taken an important place in public debates and communication of enterprises. Nevertheless, its application in concrete policies is less obvious. Thus it is important to
understand what is a sustainable development, and to what extent it has implications in transportation policies and high speed rail development.
1 High Speed Rail Definition
First, it must be noted that this study only deals with “classical” High Speed Rail” operated on rail tracks. Magnetic Levitation Systems (MAGLEV) are not considered here because of their little development over the world.
Contrary to popular belief, giving a clear definition of what is High Speed Rail has proved to be a complicated exercise. The most common idea is that High Speed Rail can be defined as trains operating at very high speed thanks to technical specificities from both tracks and rolling stock. High Speed Rail, according to this general acceptance can be defined as a maximum speed of at least 250 km/h (this figure can be very different from a country to another). Nevertheless this definition doesn’t allow understanding major differences in High Speed services related to variable commercial speed, or differences in operating with conventional rail.
Indeed, commercial speed on High Speed Lines can be far lower than the maximum speed that can be reached on it according to several factors:
• In many cases, trains are operating on conventional rail segments • Speed can be limited for safety reasons (near urban areas, or on viaducts and in tunnels) • Commercial speed is closely related to the number of served stations.
According to these elements, High Speed Lines functions and performances can be completely different. High Speed Rail development worldwide has shown that its concept could be adapted to various local contexts. A comprehensive definition was developed by the UIC with the following requirements:
• High Speed means operations with maximum speed over 250 km/h • Special trains that differ from conventional rolling stock by an increased power/weight ratios
and several characteristics, such as aerodynamics, reliability, safety, etc. • Special dedicated lines which can sustain operations over 220 km/h1 • Upgraded conventional lines that enable to operate up to 220 km/h
1 Speed around 200-220 km/h are considered to be the threshold between conventional and high speed rail
A

12
• A special in cab signaling system, since traditional line side signals are inefficient over 200 km/h
These technical characteristics are broad enough to define the different lines over the world. But more than a specific transport mode, High Speed Rail has to be addressed as a complex system with the following components that differ from conventional railways:
• Infrastructure • Rolling Stock • Signalling Systems • Maintenance Systems • Management • Station Emplacement • Operation Rules • Marketing • Financing • …
In a customer oriented approach, High Speed Rail can be seen as a service more than a technical system. From this point of view, using High Speed Rail refers to several performance indicators, such as commercial speed, frequency, accessibility, comfort, “freedom”; total time travel; price, safety, etc.
2 High speed Rail Development worldwide
Early developments of High Speed Rail took place in Japan in 1964 with the launch of the first “Shinkansen” line that linked Tokyo to Osaka. Important expansion of the High Speed Line network has followed and today Shinkansen network represent 2 304km.
The second high speed line to be launched was inaugurated in Europe for the Rome – Firenze line in 1977, followed by the “LGV Sud Est” in France in 1981. Europe had to become the main contributor to High Speed Rail development in the following decades.
Today, most of the high speed rail network is located in Europe and Japan but it also had development in other countries such as South Korea, Taïwan and China At the beginning of 2008, the worldwide network of lines in operation at 250 km/h or more represented a total of 9 780 kilometers. High Speed Rail is due to have important expansion over the world in the following year with lines in construction or projects in all continents.
The construction of high speed rail networks have complied with 4 main objectives:
• To overcome the limited capacity of conventional railways that were facing a growing demand. This is particularly true for the Shinkansen network but also the KTX network in South Korea and Taiwan.
• To stimulate railway companies that were losing influence on transport markets or that had to prepare to concurrence. This is the case for the introduction of the TGV in France and the German Inter City Express (ICE).

13
• To increase speeds on conventional lines whereas huge investments on infrastructure and use of “classic” material wouldn’t have allow to do so. This reason can mainly be advanced for the Inter City Express (ICE) German network.
• To improve accessibility to remote regions. This is the case for the Sanyo Shinkansen between Osaka and Fukuoka, but also for the AVE line Madrid Seville in Spain.
3 High Speed Rail and Sustainability
3.1 Definition of sustainability
In 1987, a report published by the World Commission on Environment and Development (that was to be called Brundtland report) described sustainable development as a “development that meets the needs of the present without compromising the ability of future generations to satisfy their own needs”. According to the Aalborg Charter, sustainable development aims “to achieve social justice, sustainable economies and environmental sustainability”. This refers to the three pillars of sustainable development that are economics, environment and society.
Numerous interpretations of these definitions have been developed and reflected in political debates. Main approaches of sustainability through its pillars can be described as follow:
• In the fields of economics, sustainability can be seen as an optimal use of resources thanks to efficient markets that enable to improve well being for society. As social fallout in terms of equity comes naturally from optimal allocations in markets, less emphasis has to be made on those problems. Concerning the limits of sustainability due to natural resources two main visions of sustainability exists. Followers of “weak sustainability” explain that scarce resources can be substituted by capital investments. Followers of a “strong sustainability” consider that there is a stock of natural capital that has to be maintained.
• According to ecological aspects, natural resources depletion limits capacities of the environment. In return, it implies limits for economic development.
• Social vision of sustainability emphasizes on distribution of wealth and social inclusion into the economic process that are not to come automatically from economic activity.
3.2 Implications for the transport sector and High Speed Rail
Transport development and acceleration of speed has been one of the driving forces of the evolution of our economic system since the beginning of industrial revolution. As a consequence, it is reckoned that transportation systems have a great importance in economic performance, use of natural resources and social transformations. Thus, transports are often at stake when speaking of sustainable policies. These are some of the implication of the transport sector in Sustainable development:

14
• From an environmental point of view, the increase of mobility, passenger and freight road vehicles, and air transport is designed as to be one of the main contributors to global warming, natural resources depletion and increase in urban annoyances. On the contrary, railways are supposed to offer important advantages compared to air and road transports. Even if its absolute impact on environment is negative, it has been assumed that promotion of modal shift to rail was an effective way to promote environmental sustainability. High Speed Rail as an efficient competitor with air and road transport is supposed to bring many advantages.
• Transports are supposed to support the economic growth by accelerating exchanges. In return, industry, trade and increasing incomes generate traffic and increase use of transport and car ownership. A shadow effect of this mechanism is that traffic increase generates negative external effects (congestion, accidents…) for the Economy. High Speed Rail is supposed to provide both performance to accelerate exchanges and solutions to recede to external effects. On the other hand, supposed benefits of HSR for the Economy have to be balanced by its important costs and the related difficulties to fund it.
• Social aspects of sustainability mainly refer the repartition of economic and environmental fallout of transports to the population. Inclusion of people in the process of sustainable development is a determinant factor to carry out transport policies.
In order to precise those elements, the following multicriteria analysis will compare contribution of the different High Speed Transport systems to the three pillars of development considering different factors.

15
I. High Speed Rail and the Environment
mpacts of human activity on the environment have become gradually an important concern of national and international policies over the last decade. As growing awareness of threats is rising among public opinion, political debates are balanced between the necessity and emergency to take
measures and the reluctance to change our economic model.
Since our way of life appears to be unsustainable, it raises many issues about transports and the related policies that should be carried out in the forthcoming years. Indeed, increasing mobility and reduction of time travel has been a driving force of growth and the related changes in lifestyles. In return, it also had a spectacular impact on resource depletion, environment changes and pollution. According, to this simple relation, impact of High Speed Transport Systems on the environment could raise many concerns. Nevertheless, characteristics and effects of the different transportation systems on the environment can be very different. Therefore, transport policies orientations will have a dramatic effect on the achievement of a sustainable mobility in the forthcoming years.
High Speed Rail is believed to have a better impact on the environment than its main contenders that are road and air transport. However, High Speed Rail, like all transport modes has shadow effects on the environment such as habitat fragmentation, wildlife damages, pollution and disturbances for inhabited areas. Comparison with other modes for these elements is very dependent of the considered scope, and deep investigations are necessary to draw firm conclusions about High Speed Rail environmental contribution to achieve environmental sustainability. The underlying issue of this reflection can be exposed as follow: is High Speed Rail more environmentally friendly than other transportation systems and to what extent can it bring benefits to make compatible sustainability and high speed mobility?
In order to come up with an answer to those problems, the following topics should be analyzed through a modal comparison of high speed transports:
• The impact of transport on Natural habitat • The consequences of modes in energy consumption, pollution and global warming • Disturbances for inhabited areas
To give an overall vision of environmental balance of High Speed Rail and the other modes, an evaluation grid will summarize the results of the different elements integrated into the scope of the study.
I

16
1 Insertion in the environment
Intrusion of transport infrastructure in the environment can have heavy consequences on land intrusion, natural habitat destruction and on ecosystems. Aftermaths for environment are different according to the considered mode of transport.
1.1 Impacts on Natural Habitat
Transport infrastructure impacts on ecosystems correspond to different mechanisms that have to be understood in order to assess possible implications for natural habitats. The range of the possible effects varies with land occupancy.
The ecological network is a concept based on the assumption that it is vital to (re)establish interconnectivity between natural and semi-natural values to counteract physical fragmentation, which is a result of a strong intensification of land use over the last decades. This fragmentation threatens the viability of ecosystems and species populations and thus is threatening nature and biodiversity.
Habitat fragmentation is designed as the major cause of biodiversity depletion at international scale (Convention on Biological Diversity, Rio 1992). The habitat segmentation process causes cascade of adverse effects like: loss of biotope, parceling due to barrier effect and reduction in habitat quality.
Habitat fragmentation mainly affects biodiversity by reduction in the amount of available habitat for plants and animals. Plants and other sessile organisms are usually directly destroyed around the infrastructure areas. Mobile animals (especially birds and mammals) retreat into remnant patches of habitat leading to crowding effects and increased competition. Area is the primary determinant of the number of species in a fragment. The minimal area for species is defined by access to food resources, breeding site and undisturbed area. The minimal area for a common hare is 30 hectares. When hare biotope is reduced, the population density automatically depletes. With isolated areas of 30 ha, the population cannot be maintained any more without outside contributions. Furthermore, a degrading effect on one element of the food chain may unhinge the complete ecosystem (or species in interaction with it). This cumulative effect is known as the domino theory.
At a local scale, habitat fragmentation generates additional effects:
• Effects of building up (soil properties modification, microclimatic changes, water permeability alteration),
• Effects of drainage and water logging (fluctuations of water balance, lowering of the water table),
• Effects of pollution from transport (e.g. grease, phytosanitary products, heavy metals, introduction of exotic plant species, etc.). Habitat modification influences the composition of flora (and obviously fauna). This process generally supports ordinary species with the profit of demanding species and replaces indigenous vegetation by disturbance tolerant species.
As impacts are depending on the total amount of land occupied by the infrastructure, it is important to compare it in order to establish modal comparisons.

17
Tableau 1 Land Take by infrastructures
Source: UIC, ADP, BAA
High Speed Rail has a far less important land take than motorways. It must also be noted that parallel routes can make a significant decrease of land take than motorways and high speed rail tracks taken separately. Concerning the comparison with airports, effects on the environment are quite different since it is not a linear infrastructure. It is also very different according to the airport size, but also the local context. Nevertheless many airports have a higher land take than whole high speed lines. For instance a high speed line of 500 km takes 1600 hectares against 2000 for the Lyon Saint Exupéry Airport.
1.2 Impact on the fauna
Thus, High Speed Lines seem to have the less important impact on natural habitat, but also landscape intrusion. Consequences for the fauna also depend on facilities for animal passages. Increasing importance is given to those passages for linear infrastructures. There are no strong differences from this point of view for new High Speed Lines and highways. Advantage of HSL in this domain comes from the fact that most of the motorway network has been built when such considerations were less important.
High speed transportation systems have also an impact on fauna towards accidents and collision. As HSL are fenced collision mainly concern birds and small animals. In the case of motorway, mammals can also be killed. But continuous traffic plays a role of barrier for animals whereas trains are less predictable for them. Collisions with birds are also an important concern for airports. In all these cases, impact on fauna is limited2.
2 According to the DGAC, about 800 collisions with birds are reported each year for all French airports. For the Madrid Seville a study showed that the annual kill was 36,5 kills/km (57% of birds, 40% mammals and 3% of reptiles and amphibians. It must be noted that important parts of the line was not fenced at that time.
Direct Land Take by Infrastructure
2,5 ha/km 1,3 ha/km
+ Indirect Land Take by Infrastructure
9,3 ha/km 3,2 ha/km
International Airports Roissy CDG 3200 ha Heathrow 1117 ha
National Airports Orly 1528 ha Gatwick 683 ha
Regional Airports Lyon St Ex 2000 ha Nice 370 ha

18
2 Impact on pollution and global warming
The transport sector plays an important role in pollution, resource depletion and global warming. It is the most important contributor to emissions of pollutants gases and substances in the atmosphere. Nevertheless the contribution of the different transport systems to this result is very different.
2.1 Energy consumption
Energy consumption of transport has soared over the last century. Petrol remains the most consumed primary energy in the world and represents 36% of the total energy consumption. Transport sector is the main consumer of petrol with an increasing contribution. In 2002, transport was responsible of 50% of petrol consumption in the world. Road transport is the main responsible of this evolution since it represents 90% of passenger transport and 75% of goods transport in the world. Nevertheless, Air transport consumption has experienced a spectacular increase in energy consumption over the past decades.
Figure 2 Energy Consumption of transports (2001)
Source: IEA, IFP assessment
Comparison of energy efficiency by transport modes reveals that High Speed Rail is the more efficient transport mode, even compared with conventional rail. This can be explain by better load factors and and more important capacity since High Speed Rail energy consumption is significantly higher than for Conventional rail. Plane is the less efficient transport mode, with more than 8 times less passenger kilometers per unit of energy than High Speed Rail.
Of course those figures are deemed to change with technology evolution. New high speed trains have designs that reduce drag and a higher capacity with the use of double deck carriages, as well as lighter materials. All those elements reduce energy consumption of high speed trains (for instance the new AVG of Alstom is supposed to need 15% less energy than a TGV). Concerning cars, a tendency to produce larger and heavier vehicles implies an increase in energy consumption that has to be balanced with technological efforts to increase efficiency of engines. Concerning aviation, use of lighter materials and more aerodynamic designs can reduce energy consumption.
19
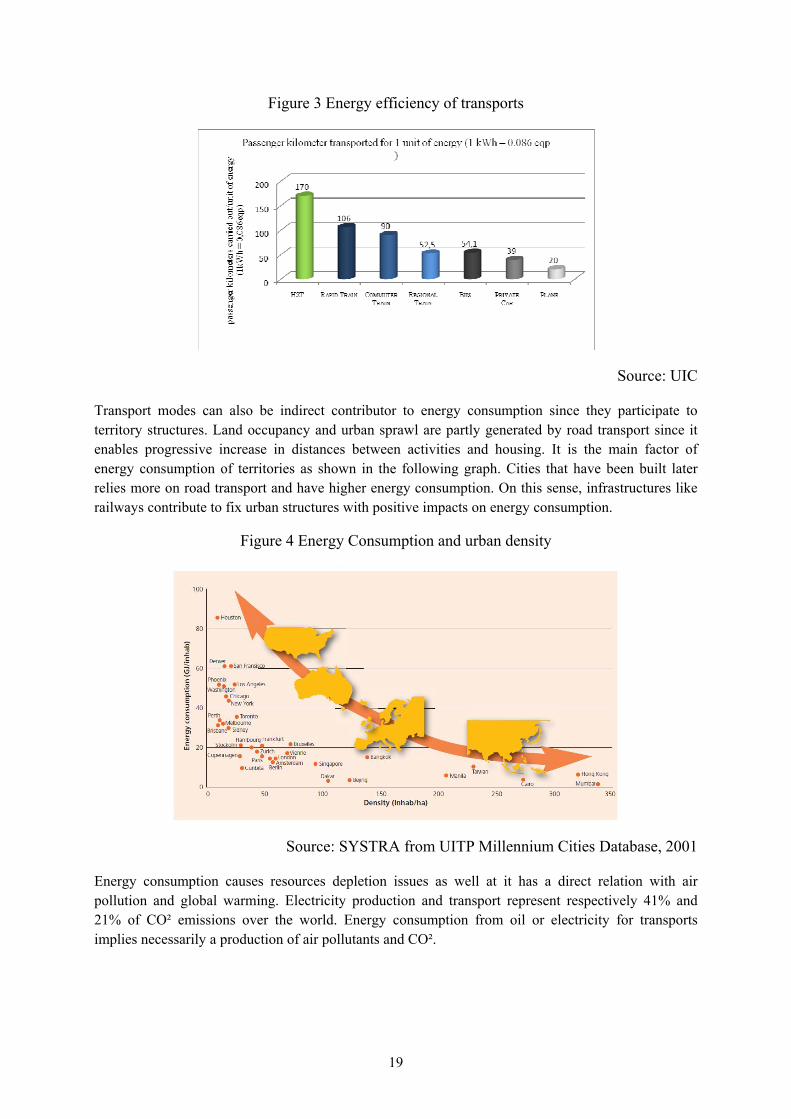
Figure 3 Energy efficiency of transports
Source: UIC
Transport modes can also be indirect contributor to energy consumption since they participate to territory structures. Land occupancy and urban sprawl are partly generated by road transport since it enables progressive increase in distances between activities and housing. It is the main factor of energy consumption of territories as shown in the following graph. Cities that have been built later relies more on road transport and have higher energy consumption. On this sense, infrastructures like railways contribute to fix urban structures with positive impacts on energy consumption.
Figure 4 Energy Consumption and urban density
Source: SYSTRA from UITP Millennium Cities Database, 2001
Energy consumption causes resources depletion issues as well at it has a direct relation with air pollution and global warming. Electricity production and transport represent respectively 41% and 21% of CO² emissions over the world. Energy consumption from oil or electricity for transports implies necessarily a production of air pollutants and CO².

20
2.2 Air pollution and Global Warming
Emissions of air pollutants are dominated by road transport, excepted for SOx emissions. Road transport accounted for 46% of total air pollutants emissions in 2004 in Europe. Air and rail emissions are comparatively very limited. Figures show that global emissions of pollutants decreased in the European Union mainly thanks to regulation. But rail transport is the only mode for which all pollutants emissions have decreased between 1994 and 2004. Technical improvements in road transport enabled to reduce every pollutant emissions but CO² emissions because of traffic growth. On the contrary, all air transport emissions increased in the same period. Rail transport contribution to air pollution is comparatively better than this of road and air transport. Regarding these trends, performance comparison of modes has to be made.
2.2.1 Air Pollution Even if environmental debate often focuses on Global Warming, air pollutants are a main source of concern for both environment and public health. Transports are an important contributor to emissions of acidifying substances, ozone precursors and particulates. Therefore, many policies were carried out that enabled to reduce air pollutant emissions in Europe in spite of increasing traffics.
Air pollutants consequences on environment and health are the following according to the European Environment Agency:
• Acidification of soils and waters because of sulphur oxides, nitrogen oxides and ammonia into the atmosphere with serious impact on ecosystems and materials.
• Formation of ground level ozone because of non methane volatile organic compound (NMVOC), nitrogen oxides (NOX), carbon monoxide (CO) and methane (CH4). This cause adverse effects on human health and ecosystems.
• Airborne particulate matter (PM) provokes respiratory problems, and is a big issue particularly in important cities.
There is a major difference between emissions from High Speed Rail and road and air transport. Indeed, cars and plane produce air pollutants and CO² with their engine, whereas high speed trains hardly emit pollutants since they are running with electricity3. Thus, high speed rail emissions depend on the origin of electricity production, and so, on the electricity mix choices that were made by countries.
3 High Speed Trains emissions from vehicles are insignificant, and can be caused by air conditioning

21
In order to compare the impact of High Speed Rail, car and plane on air pollution, several simulations have been done thanks to the EcoPassenger Tool developed by UIC and IFEU. 3 typical journeys have been chosen to illustrate the diversity of situation of high speed rail operations4.
Figure 5 Comparison of air pollutants emissions for different typical routes in Europe
Paris – Brussels Madrid – Seville Rome – Florence Trip distance in HSR 421 km 470 km 237 km
Emissions from electricity mix
Low (important part of nuclear production) Intermediate High (important part of
fossil energy) Load factor 75%
HSR Car Plane HSR Car Plane HSR Car Plane Energy consumption/pass
(HSR base 100) 100 174 322 100 294 394 100 267 467
Nitrogen Oxides/pass (HSR base 100) 100 1858 2294 100 579 559 100 761 916
Particulate Matter/pass (HSR base 100) 100 1198 523 100 276 103 100 312 145
Non Methane Hydrocarbons/pass (HSR
base 100) 100 1674 3389 100 1333 1857 100 442 875
Source: EcoPassenger
Results for the different cases are given to the next page. Several conclusions can be made from it:
• High Speed Rail emissions are way inferior to those of road and air transport, even with a non favorable electricity production with the chosen hypothesis.
• Important differences can exist between High Speed Services depending on the used electricity mix. Emissions of a Rome Florence trip are 3,8 times more important for Particulate Matter and Non Methan Hydrocarbons than a Paris Brussels trip, and 2,4 times for Nitrogen Oxides.
4 Load factors for high speed rail and trains are the average load factors that are really observed in reality depending on the country and the considered route. For cars, load factor was fixed at 1,5 passenger per car.

22
Figure 6 Energy consumption and air pollution for typical routes in Europe
Source: EcoPassenger

23
2.3 Global warming
Global warming is believed to be the main cause of climate change at a global scale. Transport as the main contributor of greenhouse gases (with electricity production) are determinant in order to set up new mitigation policies for greenhouse gases pollution. As it appears that technological progresses will not be sufficient to contain the increase in emissions, technological choices in transport policies can be part of a solution. Transport performance in GHG emissions depends on the same factors than air pollutants. In order to assess it, the same examples of typical routes have been chosen to compare the respective impact of transport systems.
Figure 7 CO² emissions for typical routes in Europe
Source: EcoPassenger
According to the EcoPassenger carbon assessment tool, a Paris Bruxelles trip emits 4,2kg of carbon dioxide in Thalys Train against 33,1 kg by car and 59 by plane. On the other hand, emissions for a Rome Florence trip is 12,6 kg of CO² per passenger for high speed rail, 33 for car and 58,3 for plane. This difference in results underlines that carbon emissions for transport closely rely on several factors:
• Load factor assumptions can have an important impact on carbon emissions per passenger kilometer. Load factors for High Speed services are extremely variable (70% for the TGV, and 40% for the ICE) and can be much inferior to those of low priced airlines.
• Energetic mix used plays an important role since it determines the emissions from the electric train power. High speed services in France produce significantly less CO² emissions than in Germany or Italy because of the importance of nuclear energy production. So, it conveyed the idea that TGV was almost a non polluting transport system. Nevertheless, this doesn’t take into account fuel rods extraction and waste storing.
• Feeders can influence total emissions for journeys. Most of the time, car journeys use one mode (door to door), whereas trains and plane journeys need additional transport with car or public transports for instance.

24
Even if substantial differences can be observed for High Speed Rail according to those factors, High Speed operation still emits less CO² than cars or planes. However, this comparison doesn’t take into account several elements, including the impact of construction and the variable impact of modal switch.
3 Impact on habitat and living conditions
Transports have heavy consequences on living condition in inhabited areas. They are a main source of annoyance for people that often complain of this. The main disturbance is noise, but transport causes also specific disturbances.
3.1 Assessment of Noise pollution impact for society
For the last decades, noise has become one of the main concern related to transports in developed countries, especially in large built up areas. It is considered as one of the main sources of pollution and has non negligible impacts on life quality, welfare and even health. Like other transport systems, high speed rail causes noise disturbance and vibrations. In order to assess the impact of high speed rail on noise and vibrations disturbance, it is important to precise the importance of noise burden for population and to understand the effect of noise on health.
3.1.1 People exposure to noise Noise, as a main factor of pollution, is difficult to assess since it is a perception closely influenced by several factors that can be related to transport modes (noise duration, sound frequency, sound range…) or not (distance of housing with the infrastructure, people sensitivity and opinions…).
Among the factors related to noise sources, duration and frequency play an important role in noise exposure, regardless to the noise level in decibels. A sporadic noise has a rather different effect on people than a constant noise. Hearing systems react differently depending on the frequency strength (“Noise frequency is the number of vibration per second of the air in which the sound is propagating, and it is measured in Hertz”, WHO)
There is also an obvious relation between noise level and the distance with noise sources. According to the ADEME, each doubling of distance enables to reduce the sound level by 3dB(A) for linear sources of noise such as roads and railways. Several noise sources increase noise level but not as an addition of the respective sound levels. For instance, 2 cars that produce 60dB(A) separately only produce 63dB(A) together (Soberco environment).
Two measures of noise are generally admitted: the maximal noise pressure noted dB(A) that represent the noise perceived instantaneously and the equivalent level LAeq that described a fluctuant noise during a period as equivalent as an instantaneous noise produced with the same energy.
People exposure to noise is extremely variable according to the context in both urban and rural areas. Within the European Union, 80 million of people (22%) are exposed to noise level over 65dB(A) and 8% to levels over 70dB(A) which can have many implications on health and welfare. 45% of Europeans (170 millions) are living in areas without acoustic confort, and 30% are exposed to noise

25
levels over 55dB(A) by night (LAMBERT Jacques, Le bruit en Europe: colloque du conseil national du bruit, Le bruit des transports en Europe: exposition de la population, risques pour la santé et coût pour la collectivité, INRETS, 2000).
Transport as the main contributor to environmental noise has an important role in noise pollution. Contribution from road, rail and air transport are different, as shown in the following charts. It presents the number of people affected by noise in Europe by mode for cities over 250 000 inhabitants.
Figure 8 People exposure to noise in Europe for cities over 250 000 inhabitants
Source: The European Topic Center Land Use an Spatial Information, 2008
Road noise has an overwhelming importance compared to air and rail transport. In cities over 250 000 inhabitants, 55% of people are exposed to noise over 55dB(A) against less than 5% for rail and less than 3% for air transport. During the night, 17% of people are exposed to road noise over 60dB(A) which can have consequences on health. Nevertheless, importance of the road network and traffic must be taken into account.
Noise pollution from transport and other sources have serious consequences over people condition and social welfare. Those adverse health effects have to be explained in order to understand the impact of transport noise pollution on people
3.1.2 Health adverse effects Harmful effects of noise over people result from both occupational and environmental noises such as transport noise. They can be mainly described as negative effects on organism, impairment of capacities and psychological reactions. As they are often caused by combined factors, it is difficult to draw firm causal conclusions between a noise source and adverse health effects. Nevertheless, it can be assumed that the transport sector, as a main factor of noise pollution, has impacts on hearing condition.
Several adverse health effect of noise can be defined according to the World Health Organization (WHO):

26
• Noise-induced hearing impairment. According to the WHO, « hearing impairment is typically defined as an increase in the threshold of hearing ». This can be considered as a severe social handicap.
• Interference with Speech Communication
• Sleep disturbance. Environmental noises can lead to difficulties in falling asleep, awakenings and a degraded quality of sleep. This can have serious consequences on health since uninterrupted sleep is necessary for a good physiological and mental condition. Sleep deprivation causes increased blood pressure, increased heart beat, breathing difficulties…
• Cardiovascular and physiological effects. People exposed to high level noise for extended periods have more risks for myocardial infarction. Noise exposure has an impact on hormonal system that cause increased blood pressure, increased heart rate and vasoconstriction.
• Mental health effects. Noise can contribute to mental disorders. This influence can be assessed by several symptoms: headaches, changes in mood, stress, anxiety, nausea, complaints, social conflicts, but also neurosis, psychosis and hysteria.
• Effects of noise on performance. According to the type of noise and the work being done, noise can produce task impairment and increase the number of mistakes (Smith, 1990). Noise can hamper comprehension, reading, problem solving and memory.
• Effects of Noise on Residential Behavior and Annoyance. Noise has an indirect effect on social behavioral. It can make people change their habits (closing window, turning TV and radio to louder levels, complaining to authorities…) or even contribute to worsen neighborhood relations (unfriendliness, residential mobility, drug consumption, accident rates, changes in mood…).
Those effects are difficult to quantify since they can have many origins. Some people such as children or older people with hearing impairment are more vulnerable for instance. Moreover, they do not really enable to make a sharp difference between discomfort and health condition reactions.
The following chart presents several thresholds for harmful effects. They correspond to noise levels in dB but they also depend on the different aspects of noise that were previously described (noise frequency, duration…). Nevertheless, it seems that physiological risks threshold is reached for prolonged exposure to noise Levels of about 65-70dB.
Figure 9 Noise consequences for Health
Source : DDASS Alsace

27
3.2 Transport modes contribution to noise pollution
Noises generated by transport can have many characteristics depending on interactions between transport modes and their environment and are constantly changing as a result. Effects of noise emissions are closely related to those differences. In order to understand the contribution of transport modes to noise burden for people, it is important to explain how they generate noise and the difference between the different modes.
3.2.1 Different noises for different transports Transport contribution to noise pollution is extremely variable according to transport modes. As shown in the following table, noise levels reached for air, road and rail transport are very different but they are all strong enough to possibly have a significant impact on health. Figures show that air transport is the noisiest, followed by rail and road transport. Nevertheless, they are measured close to noise sources. Frequencies of traffic and distances are to be taken into account. For instance noise emissions close to a busy highway is about 80dB(A), but it is about 65dB(A) 180 meters away from a highway with an average traffic.
Tableau 2 Daily Noises
Noise sources Acoustic pressure (dBA)
Normal talking (indoor) 45-55
Idling car, at 7,5m 45-55
Car, 50km/h, at 7,5m 60-80
Heavy truck, 50km/h, at 7,5m 80-95
Motorcycle, 50km/h, at 7,5m 75-100
Boeing 737 in flight at 5km 85
Freight train, 100km/h, at 7,5m 95-100
TGV Duplex, 250km/h, at 25m 88
TGV Duplex 300km/h, at 25m 92
Jet Plane Taking off over 100 tons, at 100m 110-115
Possible hearing traumatism > 120
Source : STANNERS, BOURDEAU., L’environnement de l’Europe, l’évaluation de Dobris,
Edition Earthscan, NOEMIE, DGAC
Road traffic can be considered as a constant noise (even if traffic flows change according to the hour), whereas train and plane noises are sporadic noises. Thus, people perception for the different modes is different regardless to the noise level. More generally, impact of noise emissions from air, road and rail transport depends on the way those modes generate noise. The following table gives a list of noise sources and influencing factors of noise for air, road and rail.

28
Tableau 3 Transport noise sources and influencing factors
Plane Car Rail Landing and take off engine traction noise
ground noises exhaust rolling noise rolling noise aerodynamic noise
noise sources
transmission
Flight frequencies
type of plane (engine and aerodynamics)
traffic volume
Services frequencies
number of coaches
movement of turbulent air over the
physical structure % of trucks type of engine and coaches
relief (echoes) speed braking system
traffic flow type of tracks (ballast/concrete)
slope tracks state
road surface tracks design (+aménagements)
influence factors
tunnel
Plane noise emissions are mainly generated during landing and taking off. So concerned people are located nearby airports and along land and take off corridors. Ground noises such as taxiing aircraft, engine tests and transport links to the airport are also experienced by people living close to very large airports. Air noise is mainly influenced by flight frequencies and characteristics of aircrafts (engine and aerodynamics). As air noise spreads over large areas, relief can also have an impact (echoes in the mountains for instance).
Road noise is generated by running engine and transmission, exhaust and contact between tires and road surface. Under 50km/h, mechanical noises (engine, transmissions and exhaust) are dominant, but for higher speeds, rolling noise prevails. It is dominated by low frequency noises. Traffic characteristics (volume, speed, and congestion) have an important impact, but the type of vehicles is also at stake. Trucks are noisier than cars especially for mechanical noises which are very important in urban area. The following charts shows that in urban areas, at 50km/h, car noise emissions represent less than 50% of road noises whereas they count for nearly 85% of the fleet share. Road surface (mainly the type of used concrete) can have a substantial impact on noise emission level.
Rail noise is caused by traction, rolling and aerodynamics. Traction noise is generated by engine and auxiliary equipments such as compressors, generators or ventilation. Rolling noise is generated by contact between rails and the wheels, but also some echoes from some structure elements, such as metallic bridges. The importance of these sources depends on speed as shown in the following chart. Under 50 km/h, traction noise is dominant, then rolling noise is more important. Aerodynamics prevails for speed over 300km/h (so it is specific to high speed trains). Other noise sources can exist like curve squeal or brake screech that are very annoying for people because they have high frequencies (whereas other rail noises are mostly low frequency noises).

29
Figure 10 Eurostar Noise: Variation with Speed
Source : ARUP
Factors that can influence noise emissions are affected by services, train types and equipments, and also track design and environment. Frequency of services increases the occurrence of noise events. Traction noise is more important for diesel trains than for electric trains and the number of coaches increases noise emissions as well. Cast iron tread braked wheels have a higer surface roughness and are noisier than disk braked wheels. Rail pad stiffness affects rolling noise too. Concrete slab tracks are noisier than ballast tracks. Beside noise emissions, other effects are experienced such as ground vibrations and sonic booms outside tunnels. Sonic booms are waves propagating at tunnel exits that can be strong enough to disturb people in urban areas (by rattling windows for instance).
Differences in noise emissions induce a different perception for exposed people. Annoyance from transport noise does not impact the same activities with the same importance according to the transport mode.
3.2.2 Rail noise advantage over other modes Recent studies comparing annoyance for transport systems revealed that rail noises are less annoying than road and air noises with identical sound levels. Explanations for this result are to be found both in acoustic and non acoustic factors.

30
Figure 11 Transport mode annoyance differential
Source: UIC
Non acoustic factors are paramount in people reaction toward transport noise:
• People situation (for instance in housing protected by double glazing) change noise exposure regardless to noise source strength and distance.
• Individual factors impact people perception (age, dependency toward transports, noise sensitivity, fear of transports…).
• Social factors that design social groups’ behavior toward noise (expectations, protests, life style…).
For instance, fear of air crashes may increase people’s sensitivity to aircraft noise, as well as fear of flight increase in the future.
Acoustic factors also explain a preference for rail noises. Nevertheless, it depends on the period of time (day or night), of the sound level and of the kind of annoyance considered (hampered activities or behavior annoyance). Rail advantage increases with the sound level. It is more important by night than by day, and in urban areas compared to rural areas. One of the main explanations is that rail traffic is more regular and predictable than road traffic, especially by night. On the contrary, rail sound seems to be slightly more annoying than road noise for outdoor leisure or talking because train passages can last long.
3.3 Solutions to contain noise burden
Transport noise influence over health has led to research implementation to contain it. Several solutions exist to reduce noise emissions for each mode of transport .

31
3.3.1 Possible implementations per mode Up to now, noise evolution in transport has been characterized by two opposing trends: increasing traffics, and nominal reduction in noise emissions from planes, cars and trains. Transport trends indicate that traffics should still increase in the forthcoming years, making noise problems worse. In this context, solutions to contain noise community concern are being developed for each transport system, but noise decrease potentials are different. The following tables give the main solutions for each mode.
Tableau 4 Possible implementations to reduce transport noise
plane car rail
1) reducing noise at source : 1) reducing noise at source 1) traffic planning
aircraft technology (engine and aerodynamics)
car technology (exhaust, engine…) speed restrictions
2) land use planning quieter tyres rerouting of trains
planning permission 2) maintenance and control
retiming of trains
zoning land 3) quieter road surface 2) land use planning
3) changes to operationnal procedures 4) noise barriers 3) technical measures at
sources
noise preferential routes 5) traffic regulation use of vehicles with smooth wheels
managing thrust speed restriction rail tuned absorbers concentrating/sharing noise trucks forbidding low noise locomotive steeper descent angles 4) noise barriers
ways of improvement
5) maintenance
Decrease in aircrafts noise emissions has been impressive. Today, noise level along runways is about 9 times inferior than in the 70’s. The surface exposed to 85 dB(A) is 2,2 km² for an Airbus A320, whereas it was 7 km² for a Douglas DC10. Nevertheless, it did not compensate for the sharp and constant increase in air traffic. Attempts to reduce air noise focused on engine and aerodynamics with great achievements but today, technological solutions to reduce noise at source appears to be more limited. Thus other solutions to enhance the situation mainly consist in managing land use areas (forbid construction in the most exposed areas, provide insulation) and in changing operational procedures (pilots should use throttle so that they limit engine noise during take off, or choose steeper descent angles for landing to shorten landing distances over dense areas). These measures appear to be difficult to set up with the increasing aerial traffic and population.
Road transport noise also increased in the past decades in spite of substantial reduction on engine noise (about 8dB(A) for cars and 11dB(A) for trucks according to HEIFERT Helmut, bruit de la circulation routière: nouvelles connaissances et possibilities de reduction, l’actualité des routes en béton, 2006), exhaust and tires. In addition to these improvements, significant noise reduction can be obtained for rolling noise by using quieter concrete surfaces. Noise barriers, speed limitation and access restrictions for noisy vehicles can be used to protect people in exposed areas.

32
Many noise mitigation methods are being developed for railways. The European Union carried out works on evaluating ways to reduce noise for rail, air and road transport within the framework of working groups and the Environmental Noise Directive. UIC evaluated those measures :
• Solutions from operation such as reduction of speed or redirection of traffic redirection are not really compatible with a performant transport system, especially for High Speed Rail. On top of that, noise level for a day is quite insensitive to small decreases of train passages.
• Land use planning to separate railway and new infrastructure in residential areas would be difficult to introduce.
• Some of the most efficient measures consist in having a smoother contact between rail and wheels to reduce rolling noise. Several technical implementations are possible to achieve this goal. Use of disk braked wheels that are smoother, and so quieter than cast iron breaked wheels should emit 10 dB(A) less. During maintenance operations, rail grinding can make a smoother rolling contact, especially with smooth wheels. Other techniques include wheels treatment and lubrication or use of steerable axes that can help to eliminate curve squeals.
• Use of dampers should reduce rolling noise. It has been assessed that tuned absorbers attached to wheel and rails should reduce noise total rolling noise respectively to 2 and 3 dB(A).
• Use of sound barriers is a traditional solution to protect environment from noise. New lineside noise barriers that absorb noise are more efficient thant reflective barriers. Secondary glazing can be fitted to buildings. Tunnel can also isolate housing from noise emissions even if it is an expansive solution. A more original solution consists in using bogie shrouds on the rolling stock associated with low height barriers along the track.
• Improvements in locomotive sound emissions are mainly efficient for low speed when engine noise dominate.
So, in spite of the increase in traffic volumes, rail seems to have many possibilities to reduce or at least contain noise burden for people.
33
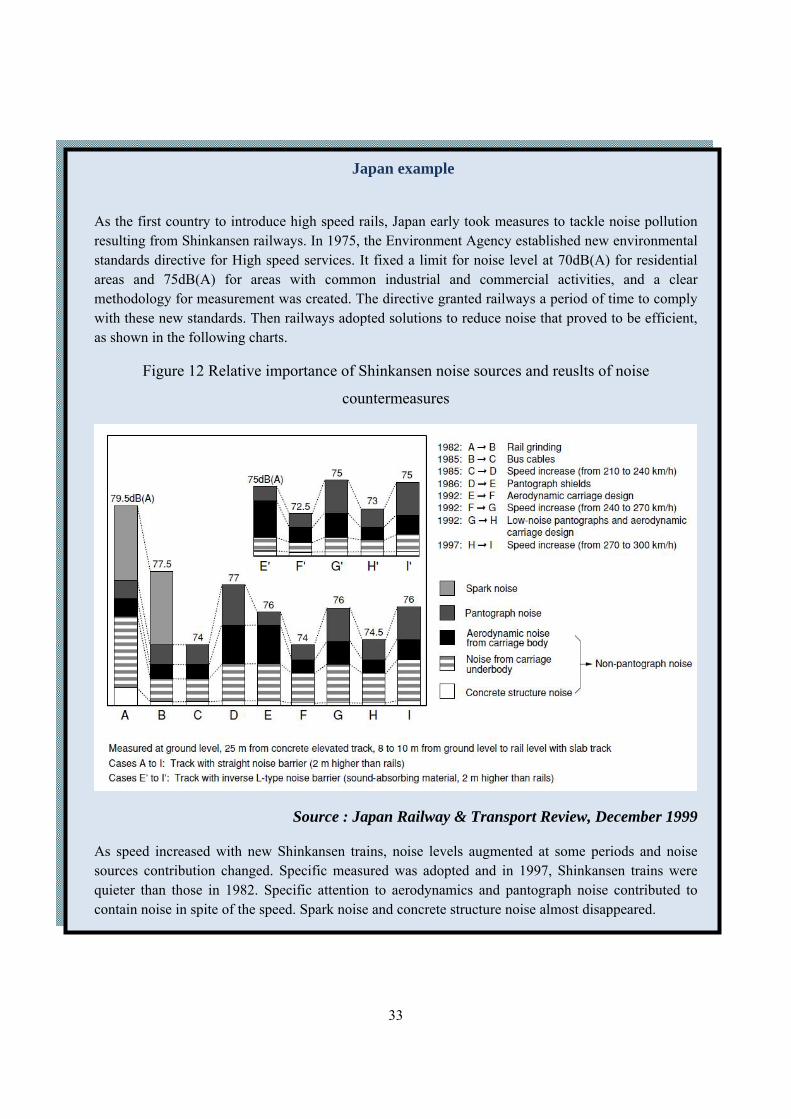
Japan example
As the first country to introduce high speed rails, Japan early took measures to tackle noise pollution resulting from Shinkansen railways. In 1975, the Environment Agency established new environmental standards directive for High speed services. It fixed a limit for noise level at 70dB(A) for residential areas and 75dB(A) for areas with common industrial and commercial activities, and a clear methodology for measurement was created. The directive granted railways a period of time to comply with these new standards. Then railways adopted solutions to reduce noise that proved to be efficient, as shown in the following charts.
Figure 12 Relative importance of Shinkansen noise sources and reuslts of noise
countermeasures
Source : Japan Railway & Transport Review, December 1999
As speed increased with new Shinkansen trains, noise levels augmented at some periods and noise sources contribution changed. Specific measured was adopted and in 1997, Shinkansen trains were quieter than those in 1982. Specific attention to aerodynamics and pantograph noise contributed to contain noise in spite of the speed. Spark noise and concrete structure noise almost disappeared.
34
3.4 Particular disturbances due to High Speed Rail
High speed rail produces several disturbances in the vicinity of inhabited areas that are particular to rail transport or even to high speed operations. Nevertheless their impact is not a main concern as mitigation measures exists.
3.4.1 Vibrations Trains provoke vibrations around rail tracks by impact of the axles on it. Vibrations are caused by the kinetic energy created by those impacts and increase with the speed of train and the weight of axles. Several influence factors can be described:
• Suspension system on the train can absorb more or less of the vibration energy.
• Interaction between rail and axles depends on the rail irregularities and grinding.
• Rail tracks rigidity since their deformation depends on the vibrating soil characteristics. For instance, more rigid slab track generate less vibrations than ballasted tracks.
Vibrations generated by trains are composed of two elements:
• Repeated pulses that correspond to the repeated impact of axles on the tracks. This corresponds to high frequency vibrations (30Hz to 80Hz) and represents the maximum peak in vibrations that is transmitted mainly near the tracks.
• A continuous vibration that corresponds to track deformations. This generated low frequency vibrations (< 10Hz) and depends on the train speed and length. The energy created by this source of vibration is low.
As a consequence, vibrations generated by high speed rail are more important than for conventional passenger trains but inferior to those of freight trains. It mainly represents annoyance risks even if physical damages at very close distance to tracks.
3.4.2 Sonic booms Japanese experience also enabled to point out specific disturbance sources such as sonic booms generated by high speed trains passing through long tunnel on slab track (ballasted tracks generate less vibrations). This problem was first discovered in 1975 with the San’yo Shinkansen trial runs that resulted in protest from residents nearby the track. The sound explosion is caused by compression waves expulsed from tunnel exits. When a high speed train enters a tunnel, sound waves propagate through the tunnel at the speed of sound and are then expulsed at tunnel exit strongly enough to provoke vibrations at doors and windows. Several solutions were found to solve this problem such as tunnel portal hood to reduce the pression wave, shelters with slits between adjacent tunnels, inclined or vertical shafts to bypass compression waves, or aerodynamic nose shapes fo trains to minimize micropressure waves. Outside Japan, sonic boom problems have also been encountered in Germany for the construction of two tunnels on the Nuremberg-Ingolstadt line where solutions from Japanese experience has been applied.

35
4 Conclusion
High Speed Rail has important advantages over road and rail transport concerning environmental issues. If its overall impact is negative (like all transport modes), the environmental damage it causes to environment are generally inferior to those caused by its main contenders.
Several points have to be kept in mind:
• Land occupancy by high speed railway is significantly inferior to highways and to some airports. Nevertheless, as railways air motorways are linear infrastructures, airports are located on a specific point but do not offer any solution to restore natural corridors.
• Impacts of high speed transport on fauna mortality are generally low, even if some risks can exist on very specific areas. The main reason is that technical measures are taken to limit habitat destruction.
• High Speed Rail offers huge advantages in terms of energy consumption, resource depletion, air pollution and global warming. Nevertheless, it has to be kept in mind that those advantages are very variable, depending on energy mixes used in countries. If fossils energy are used to produce electricity, the advantage of high speed rail for air pollution and greenhouse gases emissions is much lower.
• Disturbances caused by railways in urban areas are generally better accepted than disturbances caused by road traffic and planes. Psychological factors, and a better image of railways are also to consider in this result.
Tableau 5 Modal Comparison of performances for environement sustainability
High Speed Rail Road Air
Land Intrusion & habitat fragmentation ‐ ‐ ‐ ‐ Impact on
Natural habitat and landscapes
Impacts on accidents & mortality ‐ ‐ ‐
Energy consumption & resource depletion ‐ ‐ ‐ ‐ ‐ ‐ Global Warming ‐ ‐ ‐ ‐ ‐ ‐
Impact on a global scale
Air pollution ‐ ‐ ‐ ‐ ‐ ‐ Disturbances Noise and vibrations ‐ ‐ ‐ ‐ ‐ ‐ ‐
Positive impact on the environment: + moderate impact; ++ significant impact ; +++ very significant
Negative impact on the environment: - moderate impact; - - significant impact ; - - - very significant

36
II. High Speed Rail and the Economy
igh capacity infrastructure, such as High Speed Railways, Highways and Airports are supposed to have a significant impact on spatial and economic structures of territories. As they are thought to strengthen economic activity, their development has been closely related
to central planning decisions by governments. On this assertion, High Speed Rail investment has been closely associated with domestic and regional policy, but also with industrial strategies. As it first appeared as a way to revitalize railways, High Speed Rail development has been backed by governments and then by European Union to promote a competitive mode of transport to balance the development of other high speed transports (i.e. Highways and Air transport). One of the main purposes of this strategy is to to limit the negative external effects of road and air transport on environment, global warming, congestion, accidents, and so on.
Nevertheless, High Speed Rail development relies on heavy investments that can have a crowding out effect on other transport investments for decades. Cost for infrastructures, rolling stock, operation and maintenance are significantly higher than for conventional rail, especially since there are dedicated tracks. Under this constraint, High Speed Rail contribution to economic development has to be assesed with a cost benefit analysis and compared with other alternatives. This raises several issues on high speed rail network expansion:
• What is the cost of building and operating a High Speed Line? • How High Speed Rail can be funded? • To what extent is investment in High Speed Rail worthwhile and relevant to promote
economic and social development?
To answer to these questions, the following analysis will focus on a comparison with air and road transport:
• to determine their respective costs range and structure. • to have an overview of applications and solutions to fund them • to measure supposed benefits for society including effects on local and regional development,
on real estate market, and economic impact of external effects.
Then, a summarizing evaluation grid of cost and benefits of High Speed Rail, road and rail transport should give a global approach to assess the Economic dimension of High Speed Rail and relevance of public decisions to promote it.
H

37
1 What are the costs of High Speed Transport
High Speed Transport systems represent a huge cost to be funded. This trivial assertion has important consequences in terms of public decision to invest according to available funding capacities and consequences for further investments. As a consequence, it is important to know the cost of high speed rail, road and air transport in order to weight their costs for society. Infrastructure has a cost during their whole life cycle including construction phase as well as operation and maintenance (and even decommission). Even if comparisons and inventory of costs are limited, it is important to give an idea of costs range and structures for principal costs of high speed transport systems.
1.1 Infrastructure costs
According to UIC5, building new HSR infrastructure involves three major types of costs:
• Planning and land acquisition costs: This includes planning costs and land acquisition. It corresponds up to 10% of the final infrastructure, especially when expensive expropriations are necessary. It includes feasibility studies (both technical and economic), technical design, land acquisition and others (such as legal and administrative fees, licenses, permits, etc.)
• Infrastructure construction costs: Terrain preparation and platform building highly relies on land characteristics. This includes civil work and elevated structures such as viaducts, tunnels and bridges. That is why it represents between 10 to 25% of the total investment in new rail infrastructure. In some cases, the need of singular solutions (such as viaducts, bridges or tunnels) to geographic obstacles may easily double this amount (up to 40-50%, in more technically difficult projects).
• Superstructure costs: “Superstructure costs” include rail specific elements such as guideways (tracks) plus the sidings along the line, signaling systems, catenaries and electrification mechanisms, communications and safety installations, etc. Individually considered, each of these elements usually represents between 5-10% of total investment Stations can be considered has part of the system with associated services that can influence the generalized cost of trips (services of quality within the station can lead to decrease the uselessness of waiting time).
Although these three major types of costs are present in all projects, their variability is largely conditioned again by the relationship between the infrastructure to be built in each case with the pre-existing infrastructure. Attending to this criterion, at least five types of HSR projects can be distinguished6:
• Large corridors isolated from other HS lines, such as the Madrid-Seville AVE.
• Network integrated large corridors, such as Paris-Lille as integrated with Paris-Lyon and the French high speed network.
5 CAMPOS MENDEZ Javier, BARRON de Angoiti Ignacio, De Rus Mendoza Ginés, El transporte ferroviario de alta velocidad, una visión econónmica, 2009 6 UIC, Estimation des Ressources et des activités économiques liées à la grande vitesse, prepared for CENIT (Center for Innovation in Transport), Paris, Universitat Politecnica de Catalunya., 2005

38
• Smaller extensions or complements of existing corridors, such as Madrid-Toledo or Lyon- Valence, which are developed to serve nearby medium-size cities.
• Large singular projects, such as the Eurotunnel, the Grand Belt or the bridge over the Messina Strait, and
• Smaller projects complementing the conventional network, including high speed lines that connect airport with nearby cities, or the improvements in conventional infrastructure to accommodate higher speed services, as in Germany or Italy.
Figure 13Average cost per kilometer of new HSR infrastructure
Source: UIC
Maintenance costs of the infrastructure are presented in the following table. Main differences between countries can be explained by the importance of train operations. Indeed, track maintenance is the most important source of maintenance costs. According to the UIC statistics (2006), labor costs represent 45% of track maintenance costs, 50% of equipments maintenance costs, and 55% of maintenance costs for electric traction installations in Europe.

39
Figure 14 Cost of HSR infrastructures maintenance by country
Source: UIC
Relevance of costs comparison with other transport modes is very limited since their function is different. Even if concurrence exists between high speed rail, air and road transport, airports also concern long haul flights and an important part of traffic on motorways is made of short distance trips. Moreover, while HSL and highways are linear infrastructure, airports is not which adds to the difficulty to compare. Nevertheless, it is important to have an idea of range of costs.
The following example gives infrastructure costs for French high speed lines in operation, motorways and airports for both construction and maintenance. It is difficult to draw firm conclusions from this data since they concern specific projects, particularly for maintenance. Moreover, a reliable analysis should analyze those differences with other national and geographical contexts and bring more precision about capacity differences for both motorways and airports. Nevertheless some elements can be given:
• High Speed Lines seem to have comparable construction costs with motorways even if new High Speed Lines cost per kilometer seems slightly superior to those of highways. This can be explained by the superior costs of equipments for railways and the more important constraint of relief for high speed lines that leads to more civil engineering structures. Nevertheless costs ranges are not extremely different and more kilometers of highways have to be built since they are less direct than high speed railways. Cost structure is not so different as many of high speed rail constraints can be applied to motorways. Thus motorways cost evolution follow the same trend of increase as HSL because of increasing constraints
• Maintenance costs of the infrastructure seem to be comparable for High Speed Line and motorways.

40
Figure 15 Comparison of infrastructure costs in France (in € 2005)
Construction Phase High Speed Railtracks highways Airports
LGV in operation: 4,7 – 18,8 M€/km
In construction: 10 – 23 M€/km
16 Projects in France 4,8 - 16 M€ /km
Notre Dame Des Landes airport (capacity 4 Mvoy/year): • Construction cost : 492
M€ Including 115 M€ for runways
Low Cost Terminal Bordeaux Merignac Airport (capacity of 2M
passenger/year) : • 4,5 M€
Maintenance of infrastructures French LGV :
• Total maintenance costs of the infrastructure: 31 180 €/km of single track year (2002)
Highways operated by 6 former semi public companies in France(SEMCA): • Maintenance and
operations: 58 200€(2005)/km per year
• Repair : 26 900€/km
Runway 3 Orly Aiport :
• Resurfacing works: 5,3 M€ (2009)
Average investments per passenger in 2005 for all French airports:
• 2,83€/passenger
Source : UIC, ministère de l’équipement, ADP,
1.2 Rolling stock and operating costs
Acquisition of rolling stocks and the related operation costs are important parts of costs during the life cycle of a high speed line. It reveals many differences between modes in cost structures and ranges.
Differences in HSR development across the world led to important differences in technologies used for the rolling stock in terms of length, composition, mass, weight, power traction, tilting features, etc. UIC has made an assessment of rolling stock acquisition costs for the different technologies used in Europe.

41
Tableau 6 HSR technology in Europe : types of train
Source: UIC
Comparison with air transport reveals that acquisition of planes represent a more significant part of investment costs. Estimated costs per seat for an Airbus A320 is more than 4 times higher than for a TGV. However, it must be noted that second hand aircraft markets exist which reduced sunk costs for companies. There is no evidence of such a market for high speed trains at the moment.7
Tableau 7 Costs comparison of trains and planes
Type of train/plane/car Estimated costs (€ 2002/seat) TGV Réseau 33 000
ICE 1 65 000 Airbus A 320 145 000
Boeing 737-300 140 000
Source: UIC, ENAC
It must also be noted that high speed trains as well as planes have to be replaced or retrofitted. Retrofitting can have an important impact on rolling stock lifespan. Expected lifespan for high speed train or planes generally goes from 30 to 40 years without those operations.
Operating costs of high speed rail are an important part of its overall cost. According to J.Campos, G.de Rus and I.Barron (Economic analysis of High Speed Rail experiences around the world, BBVA foundation, 2002), they can be divided into four main categories:
• Shunting and train operations (that are mainly composed by labour costs)
7 The first Shinkansen Type 0 have been recently withdrawn from service and scrapped.

42
• Maintenance of rolling stock and equipment • Energy • Sales and administration.
Total operating costs depends from operator’s practices and technology that is used, as well as traffic level. The following table gives an assessment of operating and maintenance costs in Europe.
Figure 16 Comparison of operating and maintenance cost by HSR technology in 2002 values
Source: UIC
A comparison with air transportation operating costs reveals confirms a competition with High Speed Trains. Of course, important differences exist between traditional companies and low cost companies. For instance, Easy jet operating costs are 4,5 €/available seat km whereas it is 6,5€8 for Air France in 2008. Those costs are difficult to compare with those of High Speed Trains since their capacity is more important but they travel distance is much inferior (planes consumption is more important during takeoff and landing phases). Average costs per seat seem more relevant even if they have some limits (available seats don’t reflect load factors). Average operation cost per available seat for Easy jet in 2008 was 46,75 €. Thus it seems that operating costs of high speed rail and low costs companies have the same range, with maybe a slight advantage for air transports. Nevertheless, the hides an important trend of growth for operation costs of air transport, because of infrastructure charges increase and rising oil prices.
8 Source: Air France and Easy jet annual reports.

43
Figure 17 Easy Jet Operating Costs in 2008
Source: Easy Jet annual activity report
Figure 18 SNCF TGV operation costs
Source: SNCF
This trend is not expected to stop as oil prices are due to increase in the forthcoming years. Fuel accounted for more than a third of Easy Jet operating costs in 2008 whereas energy only accounts for about 4% for TGV operating costs.
2 How High Speed Rail can be funded?
Regarding the impressive costs of High Speed Rail and other high capacity infrastructure, fund raising appears to be a main issue to set up sustainable transport policies. The issue is not only to raise capital to finance it, but also to determine who will defray expenditure for such an expensive policy. Experiences over the world suggest that several solutions are possible with their own logic, advantages

44
and drawbacks for society. Nevertheless, the last two decades have seen heavy trends in transport funding practices.
2.1 Different types of funding sources
Until the last decades, transport funding of high capacity infrastructure complied with two different logical frame: public interest and welfare and funding by users. Those conceptions of investments were opposed in traditional economics.
In the first case, transport infrastructure is seen as a public good (i.e. non excludable and non rivaled good) and thus, has to be financed by public funds without specific resource allocated to it. Investment decisions lean on economic assessment of projects for all involved stakeholders.
In the second case, revenues from users are sufficient to compensate investment costs and debt service. Most of the time, governments entrust public companies, semi-public companies or more scarcely private companies to build and operate new infrastructure. In this case, economic assessment relates mainly to profitability for investors. For public investors, internal rates of return depend on the level of long term interest rates, plus a risk margin. For private investors, this threshold to invest has to be augmented with a margin to remunerate stakeholders with engaged funds.
More recently, the duality between those two systems has faded away and mixed logic of investment has appeared with the aim to comply both with public interest logic and profitability for investors. This system is partly known as Public Private Partnership (PPP). Public Private Partnership are supposed to bring many advantages:
• It enables public authorities to support less budget expenditure to fund projects. Financing by users enables to save opportunity costs for public funds.
• Risks of increase in costs can be transferred to private sector. Nevertheless, this transfer is negotiated in contracts so that it is difficult to transfer important risks to private investors if the project is not reliable. In other terms, the more risky is the project, the more public subsidy to compensate it will be important.
• Private operators are supposed to have less important construction and maintenance costs for infrastructure.
• Concurrence can bring efficiency if introduced into infrastructure operation. It is important to note that public authorities must have important competences to benefit from PPPs. Secondly, those advantages depends on the negotiations for the contract.
2.2 Main trends of transport funding
Investments in high capacity infrastructures of transport rely as much as possible on operation revenues because of the important related costs and with the underlying justification that users should pay for the added value they are benefiting from. Nevertheless, expected profitability of projects has often proved to be insufficient to enable companies (public or private) to invest their own capital. Thus, public funding has been a first requirement for most of project of high capacity transport, particularly for High Speed Rail. In recent years, with increasing budgetary constraints and national

45
debts, public funding capacity was reduced and more and more projects had to be funded with private capital.
Funding by users has been applied for most of the first high capacity infrastructures, including major airports, motorways with tolls and the first High Speed Lines. Indeed, first high speed rail projects, in France and Japan (i.e. Tokaïdo Shinkansen and South East LGV) were profitable enough to ensure cost recovery for the public companies that built and operated it.
Nevertheless, as most profitable investments are generally done first, expected profitability of the following projects tend to decrease. Then, investments for the following High Speed Lines were partly done with public funds. This is also true for Highways that follow the same trends in costs increase and profitability limits. Thus, most of investments in high capacity infrastructures have been done with the contribution of public funds. It has to be noted that public funding can also correspond to a state strategy of development. For instance, in France, constructions of the first highways in the 50’s were funded with public funds, before the construction of the first highways with tolls within the framework of the post war reconstruction.
Since the last 90’s, a heavy trend can be noticed with the increase in private funding (even if public funding remains the source of capital for investments). The driving force of this evolution has been the reduction of public funds availability and the increasing national debts. This tendency is not due to deflect with the ongoing world economic crisis and the related increase in government deficits9. As a matter of fact, many projects of highways and high speed lines have to be funded with private capitals because of public fund unavailability and the decrease of expected profitability. Many of the new planned High Speed Lines (South Europa Atlantic, Lyon – Turin…) will be funded with Public Private Partnerships. This may seem to be contradictory. Indeed, private investors are looking for higher profitability than public investors. In Public Private Partnership, public subsidies have to compensate for the gap between the expected profitability of the project and the profitability that is necessary to attract private investors. But as private investors are more attracted by the most profitable projects, it seems that they are involved in projects with low expected profitability. This paradox has been explained by Bonnafous10 in the following terms: “as additional costs for public authority to resort to private operator instead of a public operator supposed to be as efficient are more important, when a project profitability is close to this needed for a public operator, this additional cost will be less important if expected profitability is low”. Bonnafous adds that if private operators are more efficient than public operators, expected gains for public authority can be more important if initial profitability is low.
Today, it seems that most of transport infrastructures projects need public funding under several forms. In the case of PPP, public funding is also essential to ensure sufficient profitability to attract investors.
2.3 Modal comparison of funding experiences
Experiences in transport infrastructure funding reveal that many differences of funding practices can be observed between modes, but also for the same mode according to the context. In order to provide a
9 According to the OECD, Gross Public Debt of all OECD countries should increase by 30% between 2007 an 2017 as a result of the economic downturn. 10 A.BONNAFOUS, « financement des infrastructures et partenariats public-privé », 2005

46
sustainable development for transports, it is necessary for high speed infrastructure not to weigh too much on public funding. On the other hand, social equity constraints also impose to ensure funding for less profitable projects.
2.3.1 The case for High Speed Rail High Speed Rail has been mainly funded thanks to public funding. Nevertheless, first projects were profitable enough to be funded by the public operators in Japan and France. In France, the second line, LGV Atlantic, has been the first to be funded with the support of public funds, even if ex post evaluations showed that it was not necessary. In France and Germany, public funding has been split to several public entities (rail operator, infrastructure manager, state, regions…). In Japan, as the commercial success of the Tokkaïdo Shinkansen raised hopes, excessive debts were contracted by the JNR that led to insolvency. As a consequence, the government decided to stop new Shinkansen projects. After the privatization in 1987 and the split of JNR into different regional operators, new investments were decided with major changes in funding policy. In addition to costs reduction measures, central and local governments accepted to fund 50% of the expenditure. The other half of investments remained to the JR companies.
Public Private Partnership is another type of funding that has been used for HSR. It has an increasing importance in new projects such as Lyon Turin, Perpignan Figueras or South Europe Atlantic. An interesting example of PPP was experienced in Taiwan. This project was funded by BOT (Build Operate and Transfer) contract, which also enabled technology and knowledge transfer to this country11. A consortium was chosen to build, maintain and operate the line during 35 years, and after transfer it to the public authority. The market was attributed to THSRC (Taïwan High Speed Rail Consortium) that was in charge of the construction and operation of the infrastructure. Market for the rolling stock, electrification, signaling and communication was won by the Taiwan Shinkansen Corporation. Contribution of public funding represented about 21% of the overall costs. As consortiums were composed of foreign firms, this enabled as well as providing capital for funding, to introduce high speed rail technology in Taiwan according to the experience of other countries where the technology was already implanted. The same transfer has been observed in South Korea where the SNCF provided its experience to create the KTX network.
Regarding the funding of operation, High Speed Rail has been an important factor of revitalizing existing railways in many countries, including France, Japan or Germany. High Speed Rail services have proved to be highly profitable in most of cases. But as expected profitability of projects is decreasing, there is no evidence that the scheme is due to realize in every context. Nevertheless, it must be noted that HSR most of the time has had enough profitability to fund HS operation, but also to fund classical railways that are less profitable for both operators and infrastructure manager. On this sense, HSR are an important component of sustainable railways as illustrated in the following table.
11 Y.H.CHENG, « Transfert de savoir-faire en matière d’exploitation ferroviaire à grande vitesse entre la SNCF et les compagnies ferroviaires implantées à Taiwan et en Corée du Sud », 2002

47
Tableau 8 Infrastructure charges received by the infrastructure manager in France
Infrastructure charges in M€ 1997 1998 1999 2000 2001 2002 TGV - 139 616 634 752 897
Intercity trains 211 126 156 157 154 165 Regional trains 85 94 134 133 144 215
commuter trains (Paris Region) 430 462 471 471 480 488 Freight 132 150 151 149 156 143 Others 34 0 0 0 0 46 Total 892 972 1505 1544 1686 1954
Source : RFF
Japan constitutes an interesting example of potential funding for railway operations. Rail operator can have other activities based on estate property on near stations and railways. Thus they benefit from speculation on real estate markets and from other the revenues of diversified activities (hostels, commercial activities…). In 2004, those activities represented between 30 and 75% of the overall turnover of JR’s operators with an increasing trend.
2.3.2 The case for motorways In the case of motorways, construction (and thus funding practices) of the networks is older than for High Speed Rail. Tradition of funding is very different according to countries.
In some countries such as Germany, motorways respond to a public good philosophy, which implies that funding for road construction, operation and maintenance are mainly done by public bodies. In France the first highways after the Second World War were also financed by state.
In other countries, like France since the 60’s, Spain or Italy motorway networks were funded by users through tolls as construction, maintenance and operation were conceded to private or semi-public companies. Nevertheless the same trends in profitability decrease and increase in costs as for HSR have been experienced for highways, as well as economic difficulties due to the less favorable context after 1973. This led to contribution of public funding in new projects and attempts to institute cross subsidies between profitable concessions and less profitable in some countries like France.
Thus, funding constraints on motorways development appears to be important today and with exception of some particular project, expected profitability of motorway project are insufficient to be made without any public funding or subsidy.
2.3.3 The case for airports With the exception of some important airports that are owned by private capital (for instance airports of the British Airport Authority), airports capitals are owned mainly by public entities that fund their activity. Nevertheless this funding is made by the infrastructure manager (often owned by public capitals) with own capitals and debts. Gross operating margin of airports activity are important enough to operate without subsidies in most of cases. Infrastructure constructions for the first big airports were funded only with operation revenues and taxes. In 2006, subventions for airports represented less than 10% of the total investment expenditure according to the DGAC.

48
Tableau 9 Ownership of airports in Europe
Source : ADV, Schipol Group, SAGAT, GESAC, SEA Milano, Manchester Airport plc, Apt
Genova
Nevertheless funding of airports activity and growth is threatened by three main factors:
• Airports expenses have soared over the past decades. According to the UCCEGA, investments per passenger of regional airports are 3 to 5 times higher than 30 years ago.
• Today, states are reluctant to provide funding for airports • As a consequence of the two previous points, airports manager indebtedness has increased. In
2006, debts of French airports was 3,8 times higher than their gross self financing capacity.
Concerning the operators, airlines activities are traditionally profitable even if the past decade has been difficult with companies’ bankruptcies and mergers. Cross subsidies systems exist to make sure that unprofitable routes are still served such as the FIATA (Fonds d’Intervention pour les Aéroports et le Transport Aérien) in France.
3 High Speed Rail contribution to the Economy
In spite of heavy costs, high speed transports are supposed to provide important benefits for the economic system at global, regional and local scales. Relevance of a transport mode within this framework also relies on its ability to attract demand on the transport market.
3.1 High Speed Rail and the concurrence
High Speed Rail theoretical benefits for society greatly relies on its commercial success, both to be economically sustainable regarding its high investment costs, and to catch demand from other modes with supposed more negative external impact. Experiences over the world have proven that

49
characteristics of transports lead to specific market share structure12 depending on travel time and distance.
3.1.1 Modal shift from air and road Train success as far as modal shift is concerned fluctuates in function of distances and time travel. Its field of relevance is usually comprised between 300 and 800 km. Under 300 km, it is considered that car is dominating while air plane is dominating beyond 800 km. If distances are significant it is important to note that time travel is one of the most important factor in the modal choice.
The graphic below shows rail market shares according to rail travel time. The shorter the travel time, the higher the probability that a traveler would prefer to take the train rather than the plane. We can note that even a slight improvement of the travel time can lead to important market share profit.
Tableau 10 Market share of air and rail transport
Source:SNCF
According to available data in Europe and Japan, it is possible to state that under 1h30, High Speed Trains are totally dominating the market against planes. For instance, the High Speed service connection enables to reach Brussels in less than 1 hour and 20 minutes from Paris. It led Air France to suspend their service on that aerial link because of the TGV dominating position. When time travel is about 2 hours and 2 hours and a half, the modal shared of HS is then comprised between 70 and 90% (it is the case on the following links : Madrid-Sevilla, Paris –London, Paris-Lyon; Roma-Bologna, Tokyo-Osaka…). Relevance of high speed rail for trips under one hour is not obvious depending on the time to access TGV, quality of road infrastructures and congestion.
When time travel is upper than 3 hours, market share of train then falls to around 60% (Stockholm-Goteborg…). Beyond 4 hours, the market share of train falls under 50% (Paris-Amsterdam,Rome-Milan…).
3.1.2 Competitive advantages of each transport mode Even if time travel is an important factor in modal choice, other reasons can be explained. Advantages of the different modes of transport can be decribed as follow:
12 This structure can be variable depending on the country, transport network design and people habits.
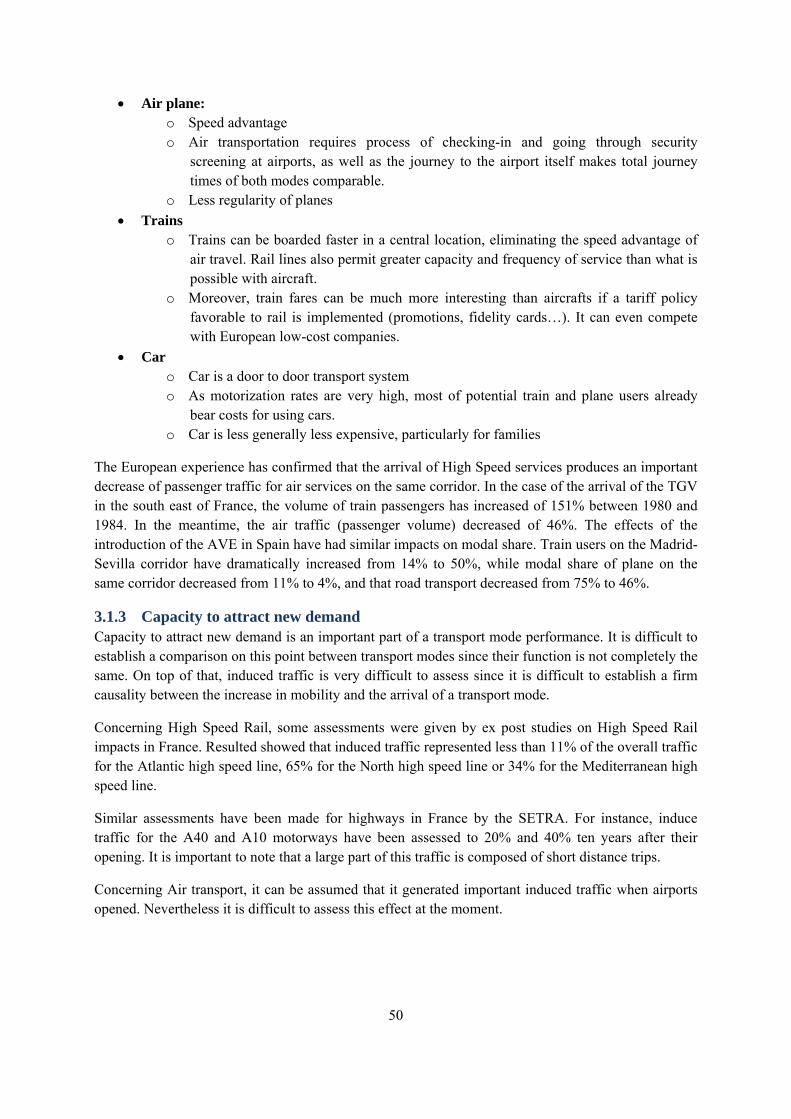
50
• Air plane: o Speed advantage o Air transportation requires process of checking-in and going through security
screening at airports, as well as the journey to the airport itself makes total journey times of both modes comparable.
o Less regularity of planes • Trains
o Trains can be boarded faster in a central location, eliminating the speed advantage of air travel. Rail lines also permit greater capacity and frequency of service than what is possible with aircraft.
o Moreover, train fares can be much more interesting than aircrafts if a tariff policy favorable to rail is implemented (promotions, fidelity cards…). It can even compete with European low-cost companies.
• Car o Car is a door to door transport system o As motorization rates are very high, most of potential train and plane users already
bear costs for using cars. o Car is less generally less expensive, particularly for families
The European experience has confirmed that the arrival of High Speed services produces an important decrease of passenger traffic for air services on the same corridor. In the case of the arrival of the TGV in the south east of France, the volume of train passengers has increased of 151% between 1980 and 1984. In the meantime, the air traffic (passenger volume) decreased of 46%. The effects of the introduction of the AVE in Spain have had similar impacts on modal share. Train users on the Madrid-Sevilla corridor have dramatically increased from 14% to 50%, while modal share of plane on the same corridor decreased from 11% to 4%, and that road transport decreased from 75% to 46%.
3.1.3 Capacity to attract new demand Capacity to attract new demand is an important part of a transport mode performance. It is difficult to establish a comparison on this point between transport modes since their function is not completely the same. On top of that, induced traffic is very difficult to assess since it is difficult to establish a firm causality between the increase in mobility and the arrival of a transport mode.
Concerning High Speed Rail, some assessments were given by ex post studies on High Speed Rail impacts in France. Resulted showed that induced traffic represented less than 11% of the overall traffic for the Atlantic high speed line, 65% for the North high speed line or 34% for the Mediterranean high speed line.
Similar assessments have been made for highways in France by the SETRA. For instance, induce traffic for the A40 and A10 motorways have been assessed to 20% and 40% ten years after their opening. It is important to note that a large part of this traffic is composed of short distance trips.
Concerning Air transport, it can be assumed that it generated important induced traffic when airports opened. Nevertheless it is difficult to assess this effect at the moment.

51
3.2 Impact on economic activity and regional development
What is the impact of infrastructures on global economy and local development? In the fields of geography and economics, infrastructure can be considered as a necessary (sufficient or not) precondition for economic development. But if transport infrastructure enables economic development this does not mean that it has an inherent effect on economy and social development. Many researchers have pointed out in the recent years the myth of “structuring effects of infrastructure” and questioned the effective impact of HS services on economy.
3.2.1 Investing in HS infrastructure, a factor of growth at global scale? Transport investments and the related reductions in time travel has been a driving force of economic development since the first industrial revolution. On this assertion, new high speed transport infrastructure has played a major role in the strong growth that followed the Second World War in most of industrialized countries. Nevertheless, assessment of the impact of a new infrastructure on the Economy remains difficult to calculate at a national scale. Trends of economic growth rely on many factors and effects of a single new infrastructure are too diffused to make a reasonable assessment at such a wide scale13. However, it can be useful to remind the different mechanisms through which high capacity infrastructure (and particularly High Speed Railways) can make a contribution to the Economy on a wide acceptation of the term.
3.2.1.1 The validity of the Keynesian spending multiplier theory It is undeniable that important investment in transportation infrastructure has an effect on economy, especially on global demand. This increase of demand causes an increase in global supply and production. To meet this augmentation, employers will hire staff and this will contribute to a rise of wage bill and of domestic consumption. These new spending will correspond to an increase in production, wages and investment in order to face this demand. This mechanism corresponds to the “spending multiplier” theorized by Keynes at the beginning of the 20th century. Obviously, transportation infrastructure construction provides direct employment related to the project that will generate consumption and revenues for other sectors of the Economy. If this theory is not totally invalidated, this approach has some limit. First of all, it is not sure that public investment in infrastructure is the type of spending that has the more induced effects. Secondly, if spending increase creates budgetary deficit, the loan subscribed to finance the investment will be translated into a budgetary deficit. Besides, it will probably supplant other potential loaners that will have to contract loans with upper interest rates. This is part of the contradiction in this theory, budgetary deficit have indeed an impact on long terms interest rates, especially when State budget is not balanced. Eventually, state loans to finance investments imply that future generations will be in charge of future reimbursement: therefore, if the economic situation is improved on the short term, one can note a deterioration of the financial situation on the long term. To finish, most of these effects are temporary whereas real effects of a transportation modes can be seen a long term.
13 For example, the European Commission (1997) estimated that the priority Trans European Networks (which are dominated by HST schemes) would add 0.25% to the European Union Gross Domestic Product (GDP) and 0.11% to employment over 25 years.
52
3.2.1.2 Traditional approach of transport infrastructure and markets Traditional economics demonstrations of transport influence on market accessibility and growth date from the early development of classical economics. This relation can be exposed through the following mechanism:
Investments in transport infrastructure enable to enhance transport services through reduction of travels costs, time travel or congestion. This reduction in generalized costs of transport implies a direct decrease in transaction costs, and thus an increase in exchanges that was not possible before. This accessibility to new markets favors concurrence, which according to the classical economics lead to specialization, scale economies, innovation and to finish economic growth.
According to this scheme, high speed transports might have a rather different impact on growth. It is obvious that air transport played an important role in exchange development at a global scale. Road Transport supports the economic activity inside and outside regions. High Speed Rail, as well as air transport as been conceived to link big economic centers. Road and Air transport have an important advantage over High Speed Rail since they play a dominant role in freight transport and so in goods markets, whereas High Speed Rail freight transport development is very limited at the moment
Strong interdependence between transports and the Economy implies that transportation systems must follow the trends of economic activity. The challenge of resources depletion and increasing oil prices is giving a clear advantage to high speed rail since air and road transport still do not have solutions to this problems.
3.2.2 Impact of High Speed Rail on regional development
3.2.2.1 Driving force of regional development High speed transports raise great expectations of economic development and dynamism for served territories. Nevertheless, they can be source of economic disparities among regions. Several mechanisms can be at stake in the fields of economic impacts on regional development:
• The more enterprises concentration is strong, the more concurrence is on local markets of goods and factors. Thus a natural tendency for firms should be to scatter in order to flee from concurrence and increase their margin.
• Scales economy and increasing exchange costs are strong incitements that make enterprises move to more important markets where there are more numerous firms. On this sense, high speed transports should help geographic concentration of growth.
From these two opposite effects they factor is the cost of exchange. Costs of exchange which are strongly influenced by transport costs have an influence on economic activity dispersion or concentration. If exchange costs are important, the need to reach local markets will make enterprises scatter geographically. If those costs are reduced, scales economy becomes more important and lead to concentration of activities. On this sense, high speed transportation is a factor of concentration. Nevertheless, concentration can further effects:
• As concentration of markets increases the price of factors, if mobility is sufficient, the decrease in transport costs can implies a new movement of immigration to reach cheaper factors.
• On the contrary, if mobility is insufficient, firms will be incited to scatter to find cheaper workforce.

53
According to those elements, it is necessary to analyze the effects of the different transports modes with past experiences.
3.2.2.2 Empirical evaluation of economic effect of transport for regions Effects of transport infrastructure on territories have revealed that they are leaned to increase main tendencies but that they have a very limited power to inverse them. If this statement can be applied to all transport modes, it remains that substantial differences can be observed between those modes. In addition some very positive economic impacts have also been witnessed as a result of high speed transportation.
Experiences of High Speed Rail worldwide lead to rather different conclusions. In Japan, interesting economic effects has been observed since the launch of the first bullet train in 1964. Important growth of population was recorded in cities served by a station compared to other non served cities near the track and compared to national average. More interestingly, Shinkansen seems to have had important economic effects on cities particularly for services firms as shown in the following tables. Cities with Shinkansen stations have experienced significant growth compared to cities without (decrease in growth after the the opening are due to the severe economic downturn that occurred in Japan). It is also interesting to note that Shinkansen seems to had a substantial impact on growth as a comparison with cities only served by motorways.
Tableau 11 Comparison of cities with and without Shinkansen railway station 10 years before
and 10 years after the opening of the Shinkansen
Sector Annual growth percentage before opening Shinkansen
Annual growth percentage after opening Shinkansen
Cities with a station
Cities without a station
Cities with a station
Cities without a station
Wholesale 12,9% 20,8% 11,6% 8,7% Retail 10,1% 13,5% 10,0% 8,6%
Industry 13,7% 14,2% 9,5% 7,8% Construction 13,8% 14,9% 8,0% 6,4% Population 2,7% 3,4% 1,9% 1,6%
Source : NEI, 1992
Tableau 12 Information exchange industries employment growth in regions with population
increase. 1981-1985
Shinkansen & expressway (%)
Expressway only (%)
Business services (total) 42 12 Information, investigation and advertising
services 125 63
R&D and higher education 27 21 Political institutes 20 11
Other 57 28 Banking services 27 28
Real estate agencies 21 3 Average 22 7

54
Source: Nakamura and Ueda (1989) and Hayes (1997)
Concerning concentration or dispersion of growth, it seems that Shinkansen benefited to a very limited extent to remote areas (Sasaki et al, 1997), as most of the activity remained in large agglomerations. On this sense, medium cities that benefited from Shinkansen such as Kakegawa City (72 000 inhabitants)14 were under the influence of major centers like Tokyo or Osaka.
In France, contribution of High Speed Rail to regional economic development is less direct. It is difficult to establish a causality between economic growth of cities and the arrival of HSR, or even to establish that absence of HSR has reduced potential growth for other. Relocations effects seem to have been observed for big cities like Lyon that attracted firms from other regional centers, such as Grenoble or Geneva. Bonnafous (1987) showed that High speed rail stations were a factor (non determinant) that contributed to location of regional offices or branch. He also demonstrated that firms were moving from Paris to Lyon. Results for medium or small cities served by HSR are mitigated. Examples such as Le Creuzot or Vendome failed to attract firms contrary to Le Mans which succeeded in attracting enterprises. French examples illustrates that transport infrastructure do not bring growth without any relevant policy to stimulate activity.
Concerning highways, the same conclusion can be drawn for France. An ex post evaluation of economic consequences of French highways has been carried out in 1994 by the SETRA15. Even if it would certainly be necessary to compare these experiences with different contexts, several remarks can be made from this study:
• Motorways have led to an increasing access to markets that concerns all sectors of the economy.
• Slight correlation has been observed between highways development and economic growth but no clear causality can be established between those two trends.
• Motorways generate employment that has been estimated for the A10 highway to 3 employees/km and 4 if outsourcing activities are accounted. Nevertheless, an indeterminate part of these were transferred from national road networks. Thus the employment generated by highways is difficult to assess.
• Motorways seem to contribute to the reinforcement of big centers. They can also have refinforce this influence towards urban sprawl, as in the case of Lyon with the opening of the A43 highway. Thus, proximity with a motorway interchange is not a determinant factor of activity by itself.
Thus, development thanks to motorways seems to be dependent on the development of potential by territories.
Airports influence on regional development depends largely on the importance of the considered airport. For instance, major hubs such as Paris CDG, Heathrow or Schipol airports are major economic centers for regions that have a huge weight in employment and activity16. Smaller airports have a rather different impact on both employment and enterprises but can still be a significant pole of 14 H.OKADA, “Features and Economic and Social Effects of the Shinkansen”, Japan Railway & Transport Review, 1994 15 JP.ORUS, F.SICARD, JP.BENOIT, “Conséquences économiques des grandes infrastructures routières”, SETRA-CSTR, 1994. 16 In 2002, Roissy CDG represented 72 000 jobs and accounted for about 10% of GDP of Paris region (débat public, CDG express)

55
activity. On the other hand, indirect economic impacts for regions are less obvious. Sometimes, accessibility to airports by road or public transport can be at stake, as well as the distance with inhabited areas. In fact, airport development has its own logic that tends to be disconnected with its location. This fact has been reinforced with the growing hierarchy of airports and the related concurrence. Indeed the research of complementarities between airports is exerted by markets, which does not allow territories to be associated with decision processes. This led to the idea that airports were cities, independent from towns they are linked with. This can have very important implications for transport policies at a regional scale.
3.2.2.3 Impact on urban development Impact of high speed transportation systems relies on the development of potential for served territories contrary to the belief that infrastructure by their own can have a structuring effect on the Economy. As the so called “structuring effects” have proved to be flimsy a new creed associating infrastructure and territorial mutation replaced it in regional development theoretical framework.
This necessary policy of creating potential for territories has had some importance in urban development. From this point of view, High Speed Rail offers consequent advantages over other modes thanks to its location at the center of cities (or connected with them).
HS stations and projects give the opportunity to reorganize some urban functions In order to better connect areas and improve services around stations. Experience shows that the capacity of HS to dynamise a territory depends on a series of factors that include the characteristics and dynamics of the specific context and the strategies locally developed.
The impact of HS can differ in function of the spatial location of the station.
In case of:
• A urban location of the station, the arrival of HS can be an opportunity for urban regeneration projects. Indeed, the surroundings of stations, especially in Europe, have been for a long time, areas with a low level of quality of life, facing different problems:
o First, a necessary reconversion of industrial wasteland mainly abandoned for peripheral sites that are more convenient for companies;
o Secondly, a urban fracture caused by the railway infrastructure itself • A peripheral location of the station that enables the emergence of a new piece of urban fabric.
Particularly, the arrival of high Speed can have an important impact on the image that a city wants to give itself. Become part of the HS network enables metropolitan areas to:
• Be associated with a state of the art technology and therefore have an impact the perception of people of the metropolitan area. High Speed becomes then an advertising motto.
• Get positioned in the international metropolitan competition
The example of Lille is representative of this action based on territorial marketing. As first results of HSR failed to live up with the high expectations local councilors had placed on it, HSR then accompanied the industrial mutation of the city. Today, HSR is an important part of the city that boasts to be at crossroads of Europe. HSR participated to the willed European image of the metropolis.

56
3.2.2.4 Impact on real estate market High Speed transportation infrastructure can have a substantial impact over real estate markets. This can have both a positive and a negative influence over property prices toward two effects:
• A negative effect because of the related annoyance (noise, pollution…) • A positive effect thanks to expected development due to the infrastructure.
The arrival of a high speed rail link still raises numerous hopes and fears. One of the fears frequently quoted by local groups in cities with a high speed rail link is a hike in housing and property prices due to the possible influx of new households and/or new investors.
The arrival of a new infrastructure has impacts on image but can also modify households’s anticipation regarding the real estate market. Studies carried out a posteriori on property prices have shown that if effects can be measured they are concentrated in the direct surroundings of HS stations.
It is interesting to note that this impact on real estate market prices is very often linked to urban projects (urban renewal) led along to the arriving of new services.
On demand aspects, predictions of increase of real estate prices made by economic agents can lead them to behaviours that make real these predictions a posteriori. The anticipation of real estate prices increase can drive economic agents to anticipate their purchase.
This decision makes prices rise and therefore confirm their initial prediction a posteriori. This corresponds to self-fulfilling prophecies. Economic agents will accept to purchase a property above market prices because they anticipate the fact that prices should continue to rise up after the coming into service of the High Speed Line and this with the perspective of quick and substantial financial profits. These purchases based on speculative objectives are concentrated on specific types of real estate (in the vicinity of the railway station, real-estate of standing...) whose value is susceptible to rise quite rapidly, in order to cover transaction costs.
More frequent change of owners and an increase of number of housing sold being occupied can be noticed. Anticipating a dramatic increase in prices, investors can decide to purchase occupied real estate in order to sell it with substantial financial profits at the end of the lease.
Others will anticipate their purchase fearing that an increase in real estate prices prevent them from buying in the future.
The dynamism of demand can also be the translation of a renewed attractivity of the area due to the arrival of HS services along with investors coming from the capital region of France and foreign investors. It is important to note in this case that before purchasing a good, these investors often start with a rental period.
Promoters, on their side, should fuel myths around real estate prices as their future revenue is directly proportional to the real estate value. The rise in real estate prices can favor the development of some projects judged as non profitable since then or increase the profitability of already launched projects. Besides, promoters can choose to favour luxury projects, causing therefore an increase in price of new flats. This rapid increase of prices in the new real estate market can lead to a transmission to the existing real estate market through a shift of the demand segment on newly built residential properties to existing ones.

57
Many observers tend to consider that infrastructure can bring substantial changes to real estate markets. Drawing on the economic literature on understanding real estate markets and the analysis of housing and property transactions in Lorraine, we can notice that this conclusion is not clear cut.
Regarding the experience in Europe, High Speed Rail impacts on real estate markets are not very clear. The TGV may appear to have been a contributory factor to price rises, but not due to any huge influx of new households. However, it is responsible for some property speculation and much localized anticipations of market trends as illustrated examples in France, such as Nancy with the arrival of the East high speed line.
This conclusion is confirmed with the Taiwan case study for which some researchers have carried out some study in order to state whether HSR accessibility influences residential property prices. They came to the conclusion that it has a minor effect on houses price17.
Concerning the impact of highways on real estate market, firm conclusions are also difficult to make. A study18 established that new accessibility due to the first two portions of Orange county toll road network had led to increase in propriety prices. Depending on the fact motorways bring accessibility or that they bypass a bottleneck that supports disturbances of road transports, a highway can have several positive impacts on housing prices. Nevertheless, further investigations should be necessary in order to establish a real causality between road infrastructure and real estate markets.
In the case of air transport a important number of studies dealt with the relation between noise and the evolution of housing prices in the vicinity of airports. Even if results differs depending on the study, most of study come up with a depreciation rate of 0,3 to 0,7% per decibel.19Nevertheless there is a lack of information to establish an possible positive impact of Airports to a wider geographical scale (i.e. beyond the area of disturbances).
3.3 High Speed Rail externalities
Contribution of a transport mode to the Economy can not only be measured by its direct effects on economic activity, its costs or its revenues or any monetary compensation that is part of the related contracts. As many activities, transports generate externalities or spillover effects. An externality is an advantage or a disadvantage one or several economic agents are experiencing without any monetary compensation because of the activity of other agents. Indeed, markets are not able to include all economic effects in contracts which imply that they don’t really reflect the real costs or benefits related to the production or consumption of goods and services. In particular, transports cause many effects on society that are not included in their costs calculation but that have a real impact on the Economy. For instance, congestion due to road circulation generates delays that have an effect on economic activity and on agents’ utility. This causes major market distortions. Indeed, if activities that
17 ANDERSSON David Emanuel, SHYR Oliver F., FU Johnson, Journal of Transport Geography, “Does high-speed rail accessibility influence residential property prices? Hedonic estimates from southern Taiwan”, 2008 18 M.BOARNET, S.CHARLEMPONG, “New Highways, House prices, and urban development: A case study of Toll Roads in Orange County”, 2001 19 J.LAMBERT, « L’impact du bruit des avions sur le marché immobilier : État des connaissances et études envisageables », 2005
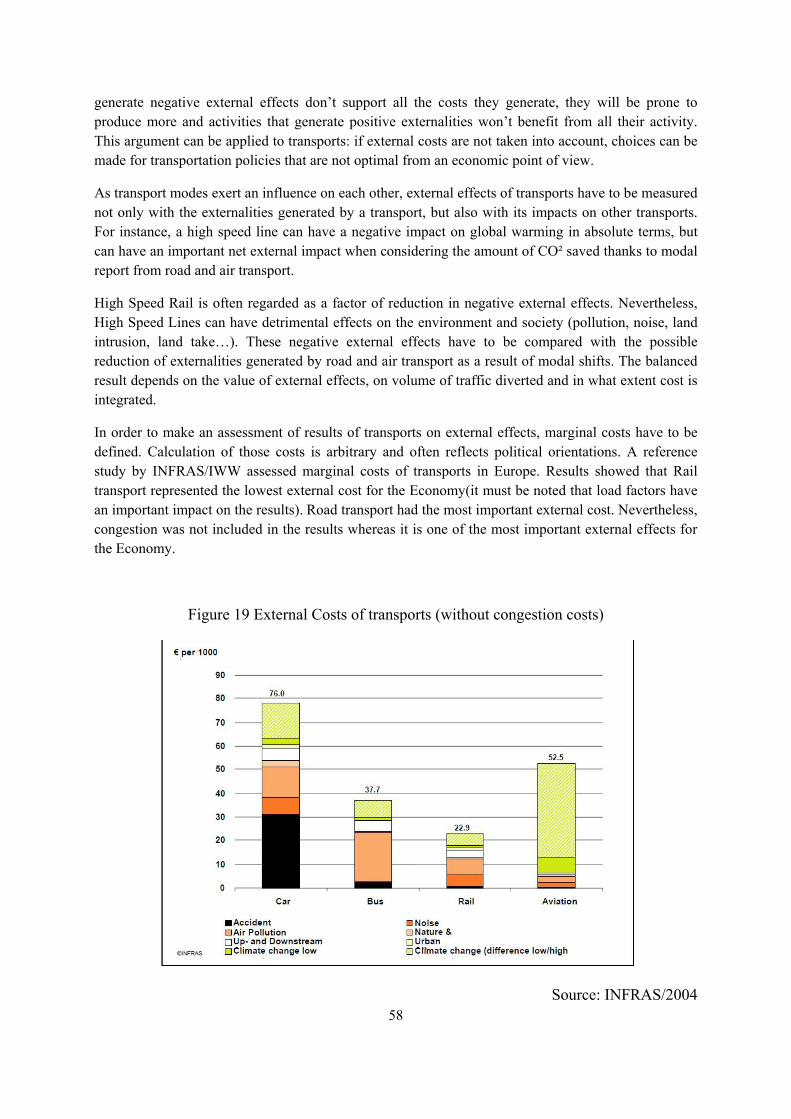
58
generate negative external effects don’t support all the costs they generate, they will be prone to produce more and activities that generate positive externalities won’t benefit from all their activity. This argument can be applied to transports: if external costs are not taken into account, choices can be made for transportation policies that are not optimal from an economic point of view.
As transport modes exert an influence on each other, external effects of transports have to be measured not only with the externalities generated by a transport, but also with its impacts on other transports. For instance, a high speed line can have a negative impact on global warming in absolute terms, but can have an important net external impact when considering the amount of CO² saved thanks to modal report from road and air transport.
High Speed Rail is often regarded as a factor of reduction in negative external effects. Nevertheless, High Speed Lines can have detrimental effects on the environment and society (pollution, noise, land intrusion, land take…). These negative external effects have to be compared with the possible reduction of externalities generated by road and air transport as a result of modal shifts. The balanced result depends on the value of external effects, on volume of traffic diverted and in what extent cost is integrated.
In order to make an assessment of results of transports on external effects, marginal costs have to be defined. Calculation of those costs is arbitrary and often reflects political orientations. A reference study by INFRAS/IWW assessed marginal costs of transports in Europe. Results showed that Rail transport represented the lowest external cost for the Economy(it must be noted that load factors have an important impact on the results). Road transport had the most important external cost. Nevertheless, congestion was not included in the results whereas it is one of the most important external effects for the Economy.
Figure 19 External Costs of transports (without congestion costs)
Source: INFRAS/2004

59
4 Conclusion
High speed rail contribution to sustainability is difficult to assess from an economical point of view. High speed transport systems represent a huge cost for society. Nevertheless their contribution to the Economy is not obvious to prove even if huge expectations are placed on them.
• Investments in high speed transports represent an important threat for sustainability :
o High speed transport infrastructures represent a huge cost for society. High speed lines seem more expensive than motorways but the range is quite comparable. Airports seem to represent a less important investment, particularly for regional airports. Operating costs of high speed rail are important as well as those of air transport. Nevertheless, air transport operating costs are due to increase sharply in the forthcoming year because of the increase in oil prices.
o Funding such impressive investments is an increasing concern for all modes. For High speed lines and highways, this problem is particularly sharp since the most profitable projects have been built. Public fund seems essential to fund it. Private Public Partnership is more and more developed to tackle budgetary constraints.
• Concerning their economic performance : o High speed rail has proved to have spectacular performance in middle distance trips.
For travel under 3 hours it is dominating the market. Thus HSR can attract demand from air and road transport and even generated important induced traffic.
o Impact on economic activity is not obvious to define for all high speed transports. Correlation has been found between economic development and the arrival of high speed lines or highways but no causality has been established. Airports can have important direct effect on employment and activity for big airports but their indirect impact on the Economy is difficult to assess. On top of that, their development is often disconnected with this of territories. An important conclusion for high speed transport infrastructure is that they mainly reinforce important economic poles and existing tendencies.
o High speed rail can be part of a policy of urban development. Even if structural effects have proved to be flimsy, the arrival of high speed rail can be an opportunity for cities to create and enhance their potential.
o Impact on real estate market is complex to define. Experiences have shown that increase in housing prices could have many other reasons than the arrival of high speed rail. Speculation is also an important explanation. On the contrary air transport can have a negative impact on real estate markets in the vicinity of airports.
• External effects are much inferior for High Speed Rail than for air and road transport.

60
Tableau 13 Modal Comparison of performances for economic sustainability
High Speed Rail Road Air Infrastructure
costs ‐ ‐ ‐ ‐ ‐ ‐ ‐ ‐ Rolling stocks and operating
costs ‐ ‐ ‐ ‐ ‐ ‐ ‐ ‐ ‐
Investments sustainability
Funding ‐ ‐ ‐ ‐ ‐ ‐ ‐ ‐ ‐ Modal
competition for inter regional trips
+ + + ++ ++
Direct effect on activity and employment
+ + ++
Indirect effect on Economy and employment
++ ++ +
Relevance with urban
development strategy
++ +
Economic Performance
Impact on real estate Markets + + ‐
Market failure External Effects ‐ ‐ ‐ ‐ ‐ ‐ ‐
Positive impact on the Economy: + moderate impact; ++ significant impact ; +++ very significant
Negative impact on the Economy: - moderate impact; - - significant impact ; - - - very significant

61
III. High Speed Rail and the Society
ocial fallout of high speed transports are an important issue within the framework of sustainable development. High expectations have been placed on new infrastructures over the past decades. Nevertheless, those new equipments often failed to live up with those attempts. More recently,
strong oppositions have been witnessed against new infrastructures (such as the Lyon Turin high speed line or the Notre Dame des Landes airport in the west of France). Nevertheless social inclusion into the process of network construction and acceptation of new investments are necessary to carry out a sustainable transportation policy.
Transports can have an impact on society through many aspects. For instance, transports are responsible for important physical damages on the population. Fatalities from transports have become a major social concern that led to important measures to enhance safety. Beyond this aspect, different mechanisms are at stake in social transformations. Social equity is one of the most important since it directly concerns citizens’ equality with transport policy. Concerns about equal treatment of users and citizens can involve many aspects like accessibility to territories or affordability. Social mutations also occur in changes of behavior and habits.
In order to assess the impact of high speed transportation system on society the following points will be tackled:
• The impact of transport on society damages and transport safety
• Social equity of transport
• Social transformations due to transportation systems.
An evaluation grid will recapitulate the results of these different issues in order to provide a general vision of the contribution of high speed transport systems within the fields of sustainability for society.
S

62
1 Safety
Transport accidents are one of the main causes of casualties and represent a huge cost for society. It has been estimated at around 2% of GDP for the European Union. As most of accidents are caused by road transport, safety has a huge importance in other commercial transports because of its implication on users’ confidence. Casualties due to transport represent a major cost for society. According to the World Health Organization, 1,2 million people die each year because of transport accident.
1.1 A modal comparison of fatality rates
Characteristics of transport modes can make a significant difference in terms of fatality rates. Evolution for all modes has been characterized by a firm decrease thanks to appropriated policies.
1.1.1 Analysis International safety performance comparisons for transport modes are quite difficult since local contexts have a great importance and because indicators definitions differ from a country to another. Some efforts were made in Europe in order to enable these comparisons.
Figure 20 Fatality rates for different transport modes
Source: EEA
These results show that rail is safer than the other transport modes. Modes with free access have higher fatality rates. Nevertheless a comparison of bicycles or pedestrians with car, plane and railway does not seem really relevant since their use concerns everybody because they do not have any restrictive legal framework. Difference in fatality rate is very important between trains and passenger cars and it has often been assumed that a modal shift from road to rail should enhance fatality rates. Nevertheless, road safety is more variable in the EU than rail safety because of several elements (design and quality of road, safety equipments in vehicles, drivers’ behaviors, regulation…).

63
It is less obvious to draw up a clear conclusion when comparing rail and air transport. According to data coming from the EU (25) fatality rate for air transport is twice higher than for railways. However, this figure has to be balanced according to different arguments:
• Planes and trains accidents occur very scarcely which explains a very low fatality rate. But they possibly cause important casualties. Thus, a single accident can have a big impact on fatality rates for both modes.
• Plane crashes occur more often during taking off and landing phases, fatality rates for short journey aircrafts are higher.
1.1.2 Evolution As social and political awareness about transport safety have been growing up for the past decades, several legal and technical measures have been taken for air, rail and road transport, resulting in an impressive decrease of fatality rates for these modes.
Figure 21 Road fatality rate decay in the EU (including the GDR before 1990) and its
prognosis to 2010
Source: European Transport Safety Council
Road safety improvement has been impressive, but also more visible since car drivers were directly concerned by safety improvement policies. The decrease trend has been quite regular and as fatality rate was over 70 deaths/billion veh.km in 1970, it is now under 6, with an average decrease of 5,3% year between 1970 and 2000 (European Transport Safety Council).
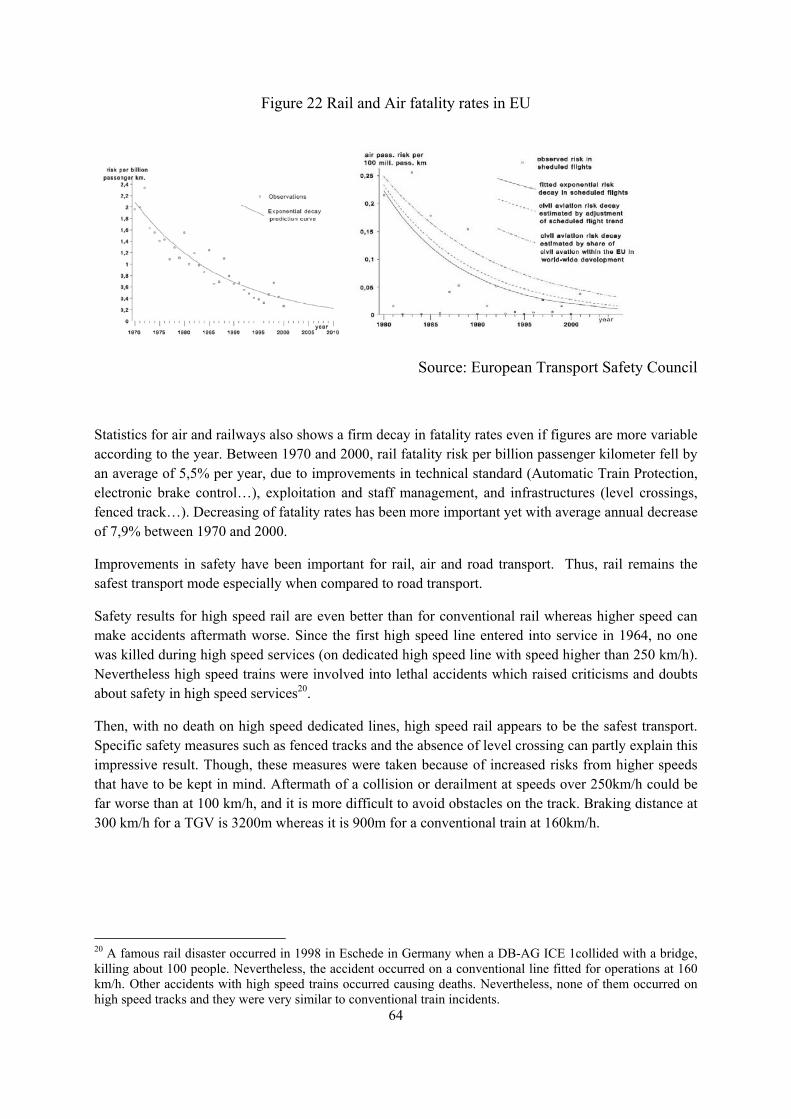
64
Figure 22 Rail and Air fatality rates in EU
Source: European Transport Safety Council
Statistics for air and railways also shows a firm decay in fatality rates even if figures are more variable according to the year. Between 1970 and 2000, rail fatality risk per billion passenger kilometer fell by an average of 5,5% per year, due to improvements in technical standard (Automatic Train Protection, electronic brake control…), exploitation and staff management, and infrastructures (level crossings, fenced track…). Decreasing of fatality rates has been more important yet with average annual decrease of 7,9% between 1970 and 2000.
Improvements in safety have been important for rail, air and road transport. Thus, rail remains the safest transport mode especially when compared to road transport.
Safety results for high speed rail are even better than for conventional rail whereas higher speed can make accidents aftermath worse. Since the first high speed line entered into service in 1964, no one was killed during high speed services (on dedicated high speed line with speed higher than 250 km/h). Nevertheless high speed trains were involved into lethal accidents which raised criticisms and doubts about safety in high speed services20.
Then, with no death on high speed dedicated lines, high speed rail appears to be the safest transport. Specific safety measures such as fenced tracks and the absence of level crossing can partly explain this impressive result. Though, these measures were taken because of increased risks from higher speeds that have to be kept in mind. Aftermath of a collision or derailment at speeds over 250km/h could be far worse than at 100 km/h, and it is more difficult to avoid obstacles on the track. Braking distance at 300 km/h for a TGV is 3200m whereas it is 900m for a conventional train at 160km/h.
20 A famous rail disaster occurred in 1998 in Eschede in Germany when a DB-AG ICE 1collided with a bridge, killing about 100 people. Nevertheless, the accident occurred on a conventional line fitted for operations at 160 km/h. Other accidents with high speed trains occurred causing deaths. Nevertheless, none of them occurred on high speed tracks and they were very similar to conventional train incidents.

65
1.2 Safety and railways
Specific risks are encountered on rail services for users and equipments depending on mechanical malfunctioning, human factors or the environment. In order to enhance safety on rail networks, solution are being developed to tackle those risks.
1.2.1 What are the risks? Safety on train services depends on several elements in train technical system, but also in interaction of this system with users and its environment. Thus, it is important to describe and understand the different risks that can affect railways and particularly high speed rail. They are described in the following diagram.
4 main risk categories can be identified (BEULIN Julie, Contribution à l’évaluation de la sécurité des systèmes complexes de transport guidé, p46-48, 2006):
• User accidents that are caused by users in the transport system without any failure of the system. They are mainly related to users’ conditions (malaises, passenger incident during rushes…), aggressions or even terrorist attacks. These risks are very difficult to reduce.
• System accidents that arms users because of a failure in the transport systems. This risk incorporates many risks such as derailment, collision or fire on board. They can be caused by flaws or failure of the technical equipments in rolling stock or infrastructure or by mistakes in operation and maintenance phases. Many efforts have been made in order to reduce these risks and improvements can still be implemented on the transport system to reduce it. Nevertheless, incidents still occur and could have serious consequences on higher speeds. For example, a French TGV engine took fire on January 10th, 2009 and several derailments occurred on HSR services.
• User accidents/system which are related to incidents provoked by users of the functioning transport system that causes damages on the same people or on other people in the transport system. These users actions can be voluntary (suicide, getting of the train before it stops…) or not (fall, door pinching…)
• Environment accident/system describes accidents and damages to users and the transport system caused by natural hazards. Users’ safety for these risks mainly relies on a post-accident safety management. Natural hazards such as earth quakes are very important in Japan and Taïwan, which led to develop specific technical solutions.

66
Figure 23 Feared Events for guided transport systems
Source : Hadj-Mabrouk, Stuparu et al. 1998
These risks can be influenced by characteristics of railways. Conventional railways interact with road transport on crossing levels which is a main risk of accident in rail transport and have more risks to encounter obstacles on tracks in general. High speed tracks do not share the infrastructure with cars and are fenced which reduce the risk of collision. Nevertheless higher speed increases braking distances and hampers danger anticipation. In urban areas and stations, density of circulation and people are the main sources of risks. According to these characteristics several solutions were implemented in high speed transport system.
1.2.2 Solutions for safety As safety in rail transport is a priority, many solutions have been developed in order to tackle the different risks for both passengers and the transport systems. If risks due to passengers are still difficult to face, new technologies helped improving traditional ways of prevention and solutions were found to counter natural hazards and other unpredictable events.
Measures to improve safety in high speed rail operations have been developed for:
• Risks caused by train operation: one of the main concerns for operators is to avoid 2 trains to be located at the same place in the same time. To do so, signaling equipments along the track and on board are crucial, both linked to train operations control. As it is impossible to see signals on the track at speeds over 200 km/h, High Speed Trains are fitted with in-cab signaling that gives information to the engineer about the speed it musts adopt and other operation information. On some lines (the LGV Mediterranean for instance) in board equipment includes a special alarm signal that enables the engineer not to stop in a tunnel or any place where passengers evacuation can be hampered.

67
• Rolling stock risk management: preventing failure of the rolling stock can be partly achieved by maintenance. But nowadays, in-cab equipments also help to detect equipments wears, flaws and malfunctioning. Computer on board can check door open systems, brakes, engines…
• Risks caused by operators: those risks come from human factors. Most of mistakes made by humans can be checked by security equipments on board or linked to signaling system. For instance there is an automatic emergency stop control on High Speed Train if the engineer makes a mistake or if it is in bad condition.
• Risks caused by unpredictable events: equipments to prevent from natural hazards were developed. Sensors are located along the lines to detect risks such as flood, earth quakes or lateral winds. They are linked to train operations control that can transmit convenient instructions for trains. For instance, researches have been carried out in Japan to develop a system to prevent earth quake related accidents. It enables to stop trains during an earthquake, to check possible damages, and then to restart quickly services.
2 Social Equity
Social inclusion and spreading of development fallout due to the enhancement of transportation networks is an important issue in order to achieve sustainable development. Social equity for transports that basically designates a fair access to transports raises issues not only for users, but also territories and the whole society.
2.1 Affordability
Standard economic theory has established that regulation by means of price is an efficient means of allocating a scarce resource.
Nevertheless too much emphasis has been placed on the role of pricing as a means of regulation and ethical considerations should be taken into account when attempting to gain acceptance to policies involving regulation by prices. In particular, affordability to transport ensures access to mobility which is a fundamental right.
2.1.1 Definition of price for transports In order to measure the transport performance in terms of costs supported by the users, it is necessary to give a clear definition of what can be compared depending on the mode. Indeed, transport costs for users are slightly different from the pricing policy. Several remarks have to be made:

68
High Speed Rail Plane Car
Costs structure Feeders
fares
Feeders
Fares
Additional charges (luggage)
Pricing stragegy
Classes
yield management (FR, D…)
distance pricing
(Japan)
classes for conventional airlines
yield management
low cost strategy
Sell price
Fuel price and consumption
Maintenance
Tollbooth, taxes
Car characteristics (age, technology, mileage, range…)
→ scales economies
Good homogeneity
classes
classes for conventional airlines
same good for low cost
services
Car range, age…
• Contrary to car which is a door to door transport, train and plane heavily relies on feeders (i.e.
cars or public transports) to be accessible. Thus, price for using those modes should be taken into account.
• Price to use a car is most of the time the same as its operating costs. This means that it should include not only fuel expenses and tool charges, but also maintenance, taxes…
• Yield management is used for both air transport and high speed rail, which makes difficult an average assessment of fares for passengers. In some countries like Japan, pricing based on distance is still used.
2.1.2 Comparison of costs and fares Comparison of prices are very dependant of the context as regulation, taxes, pricing management and other influencing factors can change according to the country and the companies. Nevertheless, examples may enable to draw some conclusions.
Even if costs of car use can change according to the country (fuel prices, taxes, congestion charges, tolls, insurance…), it seems that this is the more affordable transport mode. This factor is reinforced by the fact that even HSR and plane users are also car users, and thus already bear an important part of associated costs. High speed rail can compete (or even be cheaper) with car for travels for one person. If trips involve more persons, road transport advantage can become important. Nevertheless, it can be noted that costs to use car have augmented significantly over the past decades and are due to increase in the following years (increase in oil prices, charges…).
High speed rail seems less expensive than air transport according to several examples in France, South Korea and Japan.

69
Figure 24 Fare comparisons between High Speed Rail and Aircraft (second class and discount rate only)
High Speed Rail Air Transport
Japan (Tokyo-Osaka) 100 100
France (Paris-Lyon) 100 130
South Korea (Seoul-Busan) 100 130
Source: Y.S.Lee, “A study of the development and issues concerning High Speed Rail”, 2004
Nevertheless Low Costs companies can compete with HSR in terms of fares by proposing loss leader prices. This led some railways companies like the SNCF, to adopt this practice as illustrated with the example of “Prem’s tickets”. Those loss leader prices do not reflect the average cost that is perceived by passengers. As yield management is used both by air and railway companies, calculation of average prices has become very difficult. Ranges of prices reveal air transport fares are more variable and can be higher in the case of air transport, even for a low cost company.
Figure 25 Example of fares range with a Paris Geneva trip
Source: RGCF, 11/2004
Other elements can be highlighted to assert that high speed rail is less expensive than air transportation. Air transport has important additional fares for passengers that are not included in tickets. For instance, luggage charges can be very expensive. As airports are generally more remote and less served by transport than railway stations, feeder trips costs can represent as significant part of travel costs that can be supposed higher than for high speed rail.
PREM’s 39€
97€
165€

70
Redistribution
2.2 Ethic and prices
Evaluation of social equity is complex and its implications in inequalities perception refers to complex mechanisms of comparison. Criteria to assess can be more or less objective and thus legitimacy of such inequalities can be discussed.
2.2.1 Definition of social equity in transports In order to assess transports prices impact on social equity, it is important to define what it is. 3 main dimensions of equity can be given:
• Territorial equity: this corresponds to the principle that individuals have a right to accessibility for all markets, services and goods that society has to ensure.
• Horizontal equity: this refers to the principle that users should have the same chances, or that for the same service they should pay the same amount of money. The main implication of this is that users should pay for the service they are using.
• Vertical equity: this refers to the principle that social inequalities should be taken into account and that cross subsidies should be used in order to grant equal access to services.
The obvious contradictions of these three visions of social equity have to be integrated within the framework of economic efficiency to understand their main consequences, as seen in the following graph. Indeed transportation policy has to comply both with social equity and economic efficiency to be sustainable.
Figure 26 Dimensions of social equity
Source : C.RAUX, S.SOUCHE, « Comment concilier équité et efficacité dans la politique
tarifaire des transports », 2001
Economic Efficiency
Horizontal Equity
Vertical Equity Territorial Equity
Mobility rights
Costs Recovery

71
Economic efficiency implies that transport prices should reflect their real costs or enable them to be cost effective. This can have many implications in the case of transport that is sometimes seen as public goods. Particularly, this can imply that users can have to pay for something they had for free.
Consequences of economic efficiency for social equity can be exposed as follow:
• To ensure territorial equity, increase in transport prices have to be limited in order to grant access to majority of people, which is contradictory to economic efficiency.
• In order to meet with horizontal equity considerations, users should pay the overall costs of transport modes, both for the service they are benefitting from and for the related costs for societies (i.e. external costs).
• Enhancement of unprivileged people situation within the framework of vertical equity can be threatened by the reluctance to fund less profitable transport services with profitable services that will be disadvantaged in addition.
2.2.2 Transport performance on social equity as a consequence of pricing Impact of high speed transportation systems on social equity must be analyzed within the framework of the three aspects of equity that have been developed before.
2.2.2.1 Territorial Equity Impact of High Speed Rail on territorial equity is difficult to define. As a matter of fact, high speed rail fares do not depend on territorial considerations (at least for pricing through yield management). In a sense, as high speed rail stations are limited or frequencies are not equal, this can raise access costs for remote areas. On the other hand HSR prices has a positive impact on vertical equity since high profitable services enables to fund less profitable services in the traditional network.
In the case of road transport, problems of territorial equity due to the distance of infrastructure exist, even if it less important as high speed road network is more important. For motorways with tolls, important problems of territorial equities can exist since taxes can be very different depending on the region. Revenues from tolls contribute to a more limited extent to cross subsidies other networks.
Air transport has important contradictions with territorial equities since smaller airports are more expensive. In addition, important distances with them can cause substantial transportation costs that penalize remote areas.
2.2.2.2 Horizontal Equity As high speed transportation systems are generally profitable if only operation is considered, it seems that they comply with the logic of horizontal equity. Nevertheless it is not certain that prices enable to cover all costs generated by those transports.
High Speed Rail systems are profitable enough to cover operation costs. Nevertheless, this is not compulsory as profitability of projects is decreasing with the exhaust of most profitable projects. On top of that, most of the time overall costs during high speed line life cycle have to be funded with public funds. But it must be noted that HSR better complies with horizontal equity than most of public transports.
Motorways, as high speed railways enable to cover operation costs for motorways with tolls, but not always their overall costs. They also heavily rely on public funding. Nevertheless, there is a big

72
difference between HSR and road transports as most of people who pay taxes are also users of the infrastructure. On this sense, highways with tolls better comply with the logic of horizontal equity (But those that are not paid by users through toll do not).
This statement has to be balanced with the fact that road transport prices do not cover all costs supported by the society. Most of external costs generated by road transports are not cover by tolls. This is true for all transport systems, but as external costs of highway are more important than those of high speed lines the importance of this problem is heavier.
Airlines services also proved to be profitable in most of cases even if the current crisis is affecting companies’ profitability. Infrastructures also have to be funded by societies. Heavy external costs for air transportation are not comprised in prices paid by users.
2.2.2.3 Vertical Equity Vertical Equity for High speed rail users seems very limited because of the important prices they have to pay. This can be partly reduced by specific price structures for defined categories such as young people for instance. Nevertheless, access to high speed rail for deprived people is not ensured.
This problem is also encountered for highways but in this case it is less important because of the important motorization in the population. Thus a large part of user costs are already paid.
Concerning air transport, important prices also goes in contradiction with vertical equity.
2.3 Territorial equity
As High Speed Infrastructures is mainly conceived to link major economic centers (and thus to bypass secondary poles), concerns are rising about an increasing hierarchy of territories and gaps between development of important cities at the expense of less important economic centers. This matters in the sense that an insufficient territorial equity can hamper development of transport networks and reduce social cohesion. Impacts of transport on territorial equity can be seen toward changes in territorial accessibility and cohesion with territories organization.
2.3.1 Scope and definition of the problem Contraction and acceleration of speeds implicitly can lead to a polarization of territories and differences between territories that benefit from High Speed infrastructures and those which don’t. This difference in accessibility has been called “tunnel effect”.
“Tunnel Effect” corresponds to the situation of a territory that hosts a transportation infrastructure but have no access to it. On the contrary, territories directly connected to HS infrastructure tend to development more quickly than territories isolated from them. These territories then suffer from disturbances caused by the infrastructure and its operation without benefiting from its advantages.
Definition of benefits or losses is difficult to analyze since definition of territories is not really precise. Indeed, transport can have impact on several scales of territories: in the vicinity of infrastructures, on their trade area that can be local or regional, on an international scale... Moreover, transport networks are interconnected which means that a transport infrastructure can have impacts far beyond its vicinity.
73
Thus, territorial scale of the evaluation should be defined by networks, including connections with other means of transports.
2.3.2 Influence of High Speed Transport systems on territorial accessibility Accessibility of territories depends on their connectivity with existing transport networks and on the number of served zones. From this point of view, Highways, High Speed Rail and Airports have a rather different impact on accessibility. Nevertheless it must be noted that all lead to a reinforcement of regional disparities in favor of major economic centers.
Road transport has arguably the best territorial covering. The occurrence of motorway junctions and connection with existing national and local road networks enables to reach directly a large number of areas even if landlocked regions and disparities remains.
Regarding this simple argument, advantage of road transports over high speed rail and air transport seems overwhelming in terms of accessibility. It might be also be noted that road transport contributes significantly to accessibility of both high speed rail and airports. Nevertheless, differences in performances of road transport bring limits to comparisons for accessibility to remote areas. Indeed, high speed rail stations and airports enable territories to be in a completely different situation in terms of accessibility thanks to their performance.
Development of airports corresponded to a specific hierarchy with international, regional or even local airports. According to this hierarchy benefits in terms of accessibility were very variable depending on the possible destinations from the airport. New trends since the end of the 80’s in air transportation due to deregulation have been dominated by costs reductions through hubs development. This has had important consequences in terms of territorial equity. Indeed, it has implied an even more important hierarchy of airports and concentration of airports since the value of hubs was measured by the number of served destination. As a consequence, some local airports had to close in spite of the increase in air traffic and prices for remaining secondary airports increased. Thus, current trend in air transport goes to an increase in spatial inequalities. Another limit in air transport contribution to regional accessibility is the fact that airports are located (in spite of some exemptions) far beyond cities. Accessibility to airports relies heavily on road transport (even if public transport relations are developing). On top of that low cost companies often choose to settle in remote airports for fare reasons.
Concerning High Speed Rail, different types of service have been used worldwide:
• In Japan, Taïwan and South Korea, large densities and commuting function of high speed trains led to relatively short distances between stations as shown in the following graph.

74
Tableau 14 Distances between stations in South Korea
Source: Japan Railway and Transport Review, 2005
• In Germany and Italy, a more balanced territorial structure with more large cities led to a more important number of served areas to overcome bottlenecks. In those countries, most of stations are located downtown.
• In France and Spain, the less important densities and the domination of major economic centers led with the aim to achieve maximum performances to have long distances between stations. Those countries have also a more important number of peripheral stations even if central stations are still the most important. Nevertheless, connections with traditional network enable to reach a larger number of cities.21
So in spite of strong differences of function according to national contexts, High Speed Rail certainly enables to serve more territories than air transport.
Connection with HSR stations are also more direct because distances with dense areas are inferior (even for peripheral stations, distance are often inferior to those of airports) and because connection with public transports are often important. However, at a larger scale, accessibility toward High Speed Rail relies heavily on feeders trips (i.e. by car and public transports). Connections of the stations with other urban and regional are determinant in order to fill up with the expectations raised by such a transport mode at a regional scale. This remark is particularly important for remote stations in order to grant substantial benefit in terms of accessibility.
As High Speed Rail and Air transport have been often concurrent, the new services linking airports by High Speed Rail service have also a specific importance in terms of territorial accessibility. High
21 In France, High Speed Trains serve regularly about 190 stations. As a comparison, there are 155 airports in France

75
Speed Rail can link stations to airports, but also link two airports like in France with the services between Lyon St-Exupéry Airport and Roissy CDG airport. 2 remarks can be made concerning this point:
• High Speed Rail can compensate for the reduction of secondary airport services • This participates to the hierarchy of airports and enables connections between different kinds
of airports and make High Speed Rail services an asset for airports.
To sum up, High Speed Infrastructure tends to increase regional disparities in terms of accessibility. Nevertheless, each of them has different effects on it and brings different effects on accessibility for territories according to their performance and the importance of served territories. If comparisons can be made, High Speed Transport systems are largely interdependent and relying on conventional networks to achieve accessibility.
3 Social mutations
Social fallout of a high speed transport system is supposed to be important regarding the effects on Environment and the Economy. Distribution of the advantages or shadows effects of a transport system to the society is an important aspect of an evaluation of its contribution to sustainability. Related effects on Environment and the Economy that have been presented before have an important social dimension that lead to deep changes in lifestyles. Those changes can affect society towards enhancements of the living environment, evolutions in social structures and changes in mobility and habits.
3.1 Impacts on living conditions
High Speed Transport infrastructures have an important impact on landscapes and inhabited areas that have direct and very often negative social consequences on it. Visual intrusion, disturbances are often associated with deprived areas in the vicinity of airports for instance.
High Speed Rail projects nevertheless, are often associated with urban rehabilitation programs that can bring enhancement in living conditions in inhabited areas. These consist mainly on refurbishment of deprived areas and quarters around stations, accessibility and services enhancements, and compensations for damages caused by urban routes and infrastructures. Without being exhaustive, some examples of the contribution of these programs can be given:
• Transforming quarters and green areas: for instance, a good example is given around the station of Avignon where a deprived quarter has been restored with a big river fleet and green spaces.
• Giving prior access to pedestrians and bicycles: for instance, in Saragossa, a big pedestrian corridor has been created around the station
• Recovery action plan for deprived areas • Better access to services such as prevention, deterring, protection around the station

76
• Compensations for damages caused by urban routes and infrastructures. This can consist in tracks burial or construction of bridges, construction of noise protections… In Saragossa, tracks were buried and a ring track enabled freight transport to bypass the urban area.
3.2 Changes in social structures
High speed transport infrastructure is supposed to have important effects on social structures. Determination of causality is though difficult and experiences do not enable to draw firm conclusion about this point.
Some possible effects on social classes can be noted:
• Thanks to a better accessibility, high speed transport infrastructure enables to have a better access to markets, and particularly to labour market. A direct consequence of this is that it can improve social condition for people. Nevertheless, as High Speed Rail and air transport are expensive, this better access to labour market can mainly benefit to upper classes.
• Transformation of territories in the vicinity of infrastructure can have several effects on real estate markets. Increase in property prices can have detrimental effect on lower classes. Even if impacts of High Speed rail on real estate markets is not clearly established, risks exist that arrival of HSR causes gentrification phenomenon. On the other hand, annoyance due to infrastructure can have a negative impact on territories close to it, as illustrated in the case of many airports.
• Social mutations of society can be encouraged by the increase the acceleration of speed like raise of individualism. For instance, more and more couples live separately because of work and get together on weekends thanks to HSR.
3.3 Impacts on mobility
Increase in mobility has major impact on society and people habits. High speed transport infrastructures generate important induced traffic which is a proof of these social transformations. Several factors can explain this:
• An increase of intermodality that often occurs with the arrival of High Speed Rail can encourage mobility.
• A better access to labour markets can encourage people to increase their mobility. In case of France, High Speed rail also encouraged people to move away from Paris to settle on more remote areas to benefit from a more attractive framework and cheaper property prices (for instance it is reckon that people from Paris settled to the small city of Vendome and carried on working in Paris).
• Tourism and leisure activities can be more accessible and generate traffic. Analyse of induced traffic show that tourism is affected positively by high speed transports.
77
• Cross borders and international mobility can be encouraged by high speed transport even if at the moment, development of transeuropean railways network has proved to have a mitigated success
4 Conclusion
High Speed Rail impact on society is complex and it is difficult to define if it is positive, or even if it is more positive than those of air and road transport.
• High Speed Rail is a particularly safe mode. Since the beginning of High Speed Rail operation, no one was killed on high speed rail operation (i.e. at speed over 250km/h). Air transport is also a safe mode as a comparison of road transport that causes many casualties every year.
• Concerning Social Equity :
o High Speed Rail and air transport are expensive transport modes for users. New practices of yield management complicate an analysis of fares. Nevertheless, it seems that High Speed Rail is less expensive than Air transport, even for low cost companies. HSR can compete with road transport for travel for single persons.
o High Speed Transport modes comply with the logic of economic performance since operation revenues generally cover their operating costs. Nevertheless, investments rely mainly on public funds which cause a problem of equity from the point of view of taxpayers. This problem is less important for road transport since more people are also car users.
o Concerning territorial equity, transport modes are considerably enhancing territorial accessibility. Nevertheless, this trend mainly benefit to the most important economic centers. Road transport has a better territorial covering than high speed rail and air transport. High Speed Rail serve more territories since many stations can exist thanks to conventional rail tracks. Airports are also more remote from urban centers and populations.
• High Speed transport infrastructures have important consequences in terms of impacts on lifestyles and travel habits. They generate new displacements and new lifestyles. Importance of induced traffic for those modes is an illustration of this impact. Nevertheless, it is difficult to draw firm conclusion of a comparison and generated effects are vey variable according to the transport mode. As a comparison with road and air transport, high speed rail causes risks of gentrification but can also be a source of positive transformation in the vicinity of stations. Experiences show that it is difficult to find causality between the arrival of high speed rail and gentrification of quarters.

78
Tableau 15 Modal Comparison of performances for a sustainable society
High Speed Rail Road Air
Social Damages Safety ‐ ‐ ‐ ‐
Affordability ‐ ‐ ‐ ‐ ‐ Equity and econmic
performance + ++ ++ Social Equity
Territorial Equity ‐ ‐ ‐ ‐ ‐ ‐ Impact on lifestyles +++ ++ ++
Social mutations Impact on travel
habits +++ +++ +++
Positive impact on Society: + moderate impact; ++ significant impact; +++ very significant
Negative impact on Society: - moderate impact; - - significant impact; - - - very significant
79
Le Bilan Carbone, un outil d’évaluation des projets de transports
e second volet de l’étude pour le compte de l’UIC comportait la réalisation d’un bilan carbone. Dans ce cadre, le bilan carbone avait pour objectif de démontrer de manière « scientifique » la supériorité des lignes à grandes vitesse sur les modes routiers et aériens en termes de
réchauffement global, à travers la comptabilisation d’éléments non pris en compte dans la plupart des indicateurs utilisés pour les évaluations de projets qui n’évaluent le plus souvent que la phase d’exploitation d’une ligne à grande vitesse.
1 Une nouvelle méthode d’évaluation
Le bilan carbone constitue une nouvelle méthode d’évaluation pour les projets de transports qui doit permettre de mieux intégrer les contraintes environnementales dans les processus de décision. Si l’impact du réchauffement climatique est déjà pris en compte notamment dans les bilans socio-économiques, il consiste à donner une valeur monétaire aux tonnes de CO² évitées du fait du report modal venant de modes plus polluants pendant la phase d’exploitation du projet. Néanmoins, une ligne ferroviaire à grande vitesse, est émettrice de CO² tout au long de son cycle de vie. Ainsi, il n’est pas certain, à priori, que les tonnes de carbones évitées du fait du report modal compensent ces émissions. L’établissement de bilans carbones (qui doivent notamment être réalisés pour les projets de LGV du Grenelle de l’environnement avant fin 2010) doit donc permettre d’évaluer l’impact réel des projets de lignes à grande vitesse en termes d’émissions de CO² et d’établir des comparaisons entre projets. Afin de comprendre cette démarche, il parait opportun de définir dans un premier temps ce qu’est un bilan carbone, puis d’expliquer son intérêt, puis enfin de montrer la nécessaire adaptation qui doit être réalisée pour que la méthode soit applicable aux projets ferroviaires.
1.1 Définition du Bilan Carbone
Le bilan carbone est une comptabilisation des émissions de gaz à effet de serre produites par différentes activités. Son objectif est de permettre une évaluation de leur impact sur le réchauffement climatique à partir de données simples à collecter.
1.1.1 Une méthode de comptabilisation des activités Le bilan est établit à partir d’une véritable comptabilité des éléments directs et indirects constitutifs de ces activités. En France, la réalisation la plus connue est l’outil Bilan Carbone® qui a été développée par l’ADEME et qui fait l’objet d’une certification. Le Bilan Carbone® comme d’autres outils de comptabilisation des gaz à effet de serre à pour vocation principale d’estimer l’impact de l’activité des entreprises quelque soit leur secteur d’activité.
Le bilan carbone permet de mettre sur un pied d’égalité les émissions qui sont directement imputables à l’activité (par exemple les émissions dues à l’énergie utilisée dans une entreprise pour l’électricité et
L
80
le chauffage) et les activités indirectes (par exemple les déplacements en voiture des employés). Ainsi, cette méthode peut permettre de révéler des ordres de grandeurs qui ne sont pas nécessairement évident de prime abord. Par exemple, le bilan carbone de la RATP a permis d’établir que le plus important contributeur d’émissions lié à son activité était les déplacements domicile-travail de ses employés. Comme toute méthode de comptabilité, le bilan carbone peut poser dans le cas d’émissions indirectes des problèmes d’imputation qui peuvent nécessiter un arbitrage (par exemple, si l’on estime les émissions du aux déplacements d’un employé à partir de sa consommation de carburant, il faut pouvoir déterminer la quantité effectivement liée aux déplacements domicile-travail). La limite des émissions indirecte peut être définie comme l’ensemble des processus nécessaires à l’existence de l’activité. En ce sens, la comptabilisation du carburant utilisé pour transporter les employés pourra inclure également le transport du carburant de l’usine de raffinage à la station service.
1.1.2 Données d’activités et facteurs d’émissions Afin de pouvoir estimer de manière simple l’impact des activités sur le réchauffement climatique, les données comptabilisées liées directement ou indirectement à leur existence doivent être associées à des facteurs d’émissions. Un facteur d’émission est un coefficient appliqué à une unité donnée d’un matériau, d’une consommation d’énergie, d’un transport, etc. Il permet d’estimer la quantité de CO² (ou d’autres gaz selon les bases de données utilisées) émise dans l’atmosphère pour cette unité. Comme le CO² n’est pas le seul gaz à effet de serre présent dans l’atmosphère, le facteur d’émission comptabilise également les autres gaz qui ont un impact sur le réchauffement global. Par un système d’équivalence lié notamment à leur durée de séjour dans l’atmosphère et à leur différentiel de pouvoir de réchauffement global, ils sont ramené à une unité d’équivalent CO² (ou d’équivalent carbone dans le cas de l’ADEME).
Afin de simplifier le travail d’association avec les données collectées pour l’estimation des activités, les facteurs d’émissions intègrent des estimations des impacts liés aux activités en amont. Ainsi, si l’on reprend l’exemple pris précédemment, le facteur d’émission de l’essence inclura généralement une estimation du transport nécessaire entre la raffinerie et la station service. La définition de ce qui est intégré dans le calcul des facteurs d’émission est en général précisée dans les rapports méthodologiques des bases de données des facteurs d’émission. Les facteurs d’émissions peuvent exister pour des unités plus agrégées, comme par exemple la consommation d’énergie d’un bâtiment d’habitation standard en fonction de sa surface en m².
Comme il est impossible de mesurer à chaque fois les émissions effectivement produites dans la réalité, les facteurs d’émissions comportent un certain aléa et sont censés représenter une valeur moyenne dans un contexte précis (par pays par exemple). Ainsi, un indice de production de l’acier pourra être différent en France et en Allemagne en fonction de facteurs comme les différences de fabrication ou encore les émissions liées aux différents mix électriques. De ce fait, certaines bases de données de facteurs, dont celle de l’ADEME fournissent des marges d’erreurs de leurs facteurs d’émissions.
Une autre limite très importante des facteurs d’émissions est qu’ils sont réalisés par estimation à partir d’un état de l’art de méthodes de fabrication ou d’exécution. Cela pose de gros problèmes pour réaliser une estimation à un horizon temporel lointain car la validité des facteurs peut être totalement remise en cause. Par exemple, l’estimation des émissions due à la production d’électricité dépend du mix énergétique utilisé dans un pays donné et qui peut évoluer de manière importante à l’avenir. Par ailleurs, ce changement se répercuterait sur tous les autres facteurs d’émissions dépendant de l’électricité.

81
Figure 27 Exemple d'application des facteurs d'émissions
1.2 Intérêt de la démarche dans les processus d’évaluation et dans le cadre de l’étude
L’application du bilan carbone aux projets d’infrastructures à grande vitesse doit permettre d’établir leur impact en termes de réchauffement global alors que la question occupe une place de plus en plus importante dans les débats politiques et peut être ainsi sur les processus de décisions. Le bilan carbone, comme d’autres méthodes d’évaluation doit permettre d’établir non seulement l’importance des émissions dues à un projet donné, mais aussi les différents postes constitutifs de ses émissions avec leur relative contribution, et également d’établir des comparaison entre projets et entre situations de référence et de projet.
La comptabilisation des émissions des projets ferroviaires répond à une demande récurrente lors des débats publics sur les grands projets d’investissement. En effet les études de planification des transports doivent anticiper la demande de l’Etat et une éventuelle réglementation qui risque d’apparaître suite au Grenelle de l’environnement : courant 2009 seuls les projets « neutres » pourront voir le jour. Dans le cas d’un projet ferroviaire, on parlera de neutralité lorsque les émissions évitées grâce au report modal, c’est-à-dire le nombre de personnes qui abandonnent leur véhicule particulier pour prendre le train à la place, compensent les émissions dues aux travaux et à l’exploitation ferroviaire.
Comme pour d’autres activités, la réalisation d’un bilan carbone peut permettre de mieux comprendre la manière dont les infrastructures à grande vitesse contribuent au réchauffement planétaire. Ainsi, le premier bilan carbone « complet » réalisé pour la LGV Rhin Rhône par RFF a révélé que la déforestation (les arbres consomment du CO²) et l’utilisation de liants pour l’assèchement et
Distance domicile-travail = 5 km
Facteur d’émission ADEME pour la circulation des voitures en zone urbaine : 84g eq C/km
Emission journalière due aux déplacements domicile travail = 2*5km*84g/km = 840g d’équivalent Carbone/jour

82
l’assainissement des remblais comme la chaux constituaient des contributeurs importants des émissions liées à la construction de la ligne.
Concernant l’intérêt du bilan carbone pour l’UIC, celui-ci doit répondre à trois objectifs principaux :
• Permettre d’établir un bilan carbone aussi complet que possible des émissions liées au cycle de vie d’une LGV : des activités liées aux études amont jusqu’à la fin de vie du matériel roulant et de l’infrastructure.
• Etablir des comparaisons au niveau international de l’impact des infrastructures • Confirmer la supériorité supposée de la grande vitesse ferroviaire en termes de réchauffement
global par rapport aux modes concurrents
1.3 Une nécessaire adaptation aux projets de transport
Une des difficultés majeures que présente l’étude est que jusqu’à présent, les outils et les bases de données tels que l’ADEME n’ont pas été développé spécifiquement ni pour les transports, ni même pour les infrastructures, mais plutôt pour les entreprises. Par conséquent, les facteurs d’émissions sont davantage destinés à estimer les flux inhérents à leurs activités. Par exemple, l’infrastructure est en effet un contributeur secondaire de l’activité des entreprises alors qu’il est un contributeur tout à fait central à l’impact d’une ligne à grande vitesse. Une des conséquences est que des facteurs d’émissions pour des postes très importants comme le terrassement ou des données d’émissions de chantiers n’existent pas.
Parmi les différences qui caractérisent la démarche d’un bilan carbone d’infrastructure ferroviaire et celui plus classique d’une entreprise est que dans celui de la firme, la comptabilisation des émissions se fait généralement par flux au cours d’une année, tandis que l’impact d’une infrastructure à grande vitesse doit se mesurer tout au long de son cycle de vie. Le cycle de vie de l’infrastructure peut se décomposer en 4 principales phases comme l’indique le schéma de la page suivante.
La comptabilisation des émissions de la LGV pose des problèmes de comparaisons et de valorisations temporelles dont certaines n’ont pas été tranchées d’un point de vue méthodologique (il n’existe pas de cahier des charges officiel comme cela peut être le cas pour les bilans socio-économiques). On peut citer les principales :
• Les données peuvent être données en émissions à l’année (solution qui a été choisie pour l’étude) ou pour toute la vie de l’infrastructure. Quoiqu’il en soit, les différents éléments qui composent une ligne à grande vitesse ont des durées de vie différentes et doivent faire l’objet d’un renouvellement. Par exemple, il n’est pas correct de comparer les émissions du à la construction d’un train qui va rouler 40 ans et celles d’une voiture qui va rouler pendant 15 ans. Les émissions du aux différents postes doivent donc être pondérées soit par une durée de vie spécifique pour chacun d’eux (par exemple la durée de vie supposée du ballast est de 15 ans) soit par un nombre d’occurrences au cours de la vie de l’infrastructure (par exemple les travaux de terrassement n’auront lieu à priori qu’une fois, lors de la construction initiale).
• Dans le cas de données annuelles d’émissions, comme c’est le cas pour l’étude, le problème de l’amortissement des données se pose. La méthode la plus généralement acceptée est d’amortir annuellement les émissions en divisant les émissions totales d’un élément par sa durée de vie.

83
• A l’instar des bilans socio économiques qui attribuent une valeur du temps à travers le taux d’actualisation, les bilans carbones peuvent admettre une valeur du temps pour les émissions de gaz à effet de serre. Cette question n’a toujours pas été tranchée, d’une part car aucune valeur officielle n’a été donnée, d’autre part car le fait d’attribuer un taux d’actualisation à une valeur physique ne va pas de soi. Néanmoins, si la question est traitée sous l’angle des impacts futurs imputables au réchauffement climatique, alors l’actualisation peut avoir du sens. Le problème se pose ainsi : peut-on considérer que l’impact du CO² émis actuellement est le même que l’impact de celui qui sera émis dans le futur. La réponse est bien évidement non, mais à l’inverse du bilan socio-économique, le taux d’actualisation appliqué serait à priori négatif et ce pour plusieurs raisons. Primo, les effets climatiques devraient apparaître par seuils, ce qui implique des « effets marginaux » croissants pour le CO². Secundo, dans le contexte d’une tentative de réduction des émissions au niveau mondial, on peut penser que les efforts croissants à fournir rendent à terme « plus coûteux » l’émission de carbone, d’autant qu’elle représenterait alors une part plus forte des quantités émises.
• L’évolution des données physiques est susceptible de faire varier les quantités de CO² émises au cours du temps. Ainsi les procédés de fabrication sont susceptibles d’avoir une influence importante. Par exemple, les nouveaux matériels roulants font davantage appel à des matériaux plus légers mais aussi plus émetteurs tels que l’aluminium. Ce problème est également particulièrement pour la phase d’exploitation pour prendre en compte l’évolution des trafics.

84
1/ Phase de conception :
• Energie bureaux • Déplacements du personnel • Papier • Matériel informatique…
2/ Phase de construction :
• Déboisement préalable du chantier • Matériaux de construction
o Voie o Equipements ferroviaires o Ouvrages d’art o Gares nouvelles…
• Mise en œuvre des matériaux (consommations des chantiers)
• Transport des matériaux • Construction du matériel roulant
3/ phase d’exploitation :
• Energie du matériel roulant (traction, climatisation…) • Energie annexe (éclairage, chauffage des gares…) • Maintenance, entretien, rénnovation
4/ fin de vie :
• Casse du matériel • Recyclage des voies…
Cycle de vie de la LGV

2 Présentation de la méthodologie de l’étude
La méthodologie élaborée pour réaliser le bilan carbone doit remplir aux exigences du commanditaire et permettre notamment de faire des comparaisons modales, d’être représentatif de réalisations de LGV dans le monde, ainsi que d’être aussi exhaustif que possible dans la définition du bilan carbone.
2.1 Définition de l’étude
Avant d’expliquer la méthodologie utilisée pour réaliser le bilan carbone, il convient d’expliquer les attentes formulées par l’UIC, pour l’étude.
Ils étaient principalement de 3 ordres :
• Un bilan carbone aussi exhaustif que possible devait représenter les émissions imputables à une ligne à grande vitesse.
• L’exercice devait permettre d’établir une comparaison avec les modes autoroutiers et aéroportuaire.
• Une représentation et une comparaison de plusieurs LGV dans le monde devait être réalisée, afin de montrer les différents impacts rencontrés selon le contexte.
Afin de répondre à ces demandes, nous avons décidé de procéder comme suit :
• Un bilan carbone complet pour une ligne à grande vitesse devait être réalisé. La ligne Sud Europe Atlantique (SEA) a été choisie pour cela.
• Une comparaison modale sur l’axe Paris-Bordeaux a été choisie à partir de la ligne SEA, des aéroports d’Orly, de Roissy et de Mérignac et de l’autoroute A10. Néanmoins, le périmètre de cette comparaison exclurait la mise en œuvre et le transport lors de la phase de construction ainsi que la phase de conception. Cette simplification est principalement due au manque de moyens disponibles pour réaliser des bilans carbones complets pour les trois types d’infrastructures. Néanmoins, et en particulier pour la route, rien ne permet de présumer d’une éventuelle différence avec les travaux de LGV qui invaliderait les conclusions de la comparaison. Celle-ci porte donc sur les matériaux utilisés dans la construction, l’exploitation et l’entretien qui représentent à eux trois la grande majorité des émissions produites lors de la durée de vie des projets.
• Afin de comparer différents projets de lignes à grande vitesse à travers le monde, la solution choisie a été de déterminer les postes impactant d’une ligne à grande vitesse et d’effectuer des comparaisons sur ces différents postes. Cette solution a plusieurs avantages. D’une part, la réalisation d’un bilan carbone étant un exercice particulièrement lourd, le fait de multiplier les exemples complets peut s’avérer difficile, mais aussi peut évident à analyser. D’autre part, elle est plus pertinente car elle permet de cerner directement les différences impactantes qui peuvent exister pour un projet de LGV selon le contexte. Par exemple, un projet tel que la LGV SEA avec des contraintes de relief faibles aura des émissions dues à la construction des ouvrages d’art très inférieures à celles des LGV de Taïwan ou de Corée du Sud dont la plus
86
grande partie du parcours est composée de viaducs et de tunnels. Par ailleurs des éléments de comparaison peuvent être fournis en dehors des comparaisons de ligne. Par exemple, il est intéressant d’analyser les différences d’émissions entre une voie ferrée classique avec du ballast et une voie ferrée réalisée en dalle béton.
2.2 Méthodologie utilisée
Afin de répondre aux trois objectifs cités, une méthodologie a été réalisée et un outil de calcul réalisé. Elle repose notamment sur un choix de base de données pour les facteurs d’émissions, sur un choix des sources de données. L’outil réalisé est un tableur permettant de mettre en œuvre de manière simple la méthodologie.
2.2.1 Le choix des bases de données Une première étape importante avant de réaliser un bilan carbone consiste à choisir la base de données de facteurs d’émissions utilisée. D’habitude, la base de données de l’ADEME est préférée pour les projets français. Cependant, ce choix paraissait discutable pour l’étude pour plusieurs raisons. D’une part, la base de données ADEME ne permettant pas d’estimer tous les éléments de la voie, il aurait été nécessaire de faire intervenir des facteurs d’émissions. D’autre part, les facteurs de l’ADEME sont calculés pour la France et sont donc valable principalement dans le contexte français, ce qui pose problème dans le cadre de comparaisons internationales.
Un travail de recherche et de comparaisons des facteurs d’émissions de différentes bases de données permet de se rendre compte que les résultats peuvent être sensiblement différents, et surtout que les méthodes de calculs des facteurs diffèrent d’une base de données à l’autre. Il parait donc délicat d’utiliser plusieurs bases de données, du moins sans avoir effectué un travail important de vérification auparavant.
Le choix pour l’étude a donc été fait en cohérence avec les besoins de l’étude et avec les travaux effectués par le commanditaire. Afin de limiter les risques liés à l’utilisation de différentes bases de facteurs d’émissions construites différemment, deux ont été choisies :
• La base de données suisse Eco Invent a été choisie pour l’ensemble des phases du cycle de vie, à l’exception de la phase d’exploitation pour le matériel roulant. La base de données Eco Invent a l’avantage de disposer d’un grand nombre de facteurs d’émissions correspondant à différents usages et contextes. Elle comprend notamment des facteurs d’émissions pour la Suisse et l’Allemangne, mais aussi et surtout pour l’Europe et le monde. La méthodologie utilisée pour le calcul de ses facteurs d’émission est assez comparable à celle de l’ADEME.
• La base de données EcoPassenger de l’UIC, développée en partie avec la base Eco Invent pour le calcul des émissions liées à l’exploitation du matériel roulant.

87
2.2.2 Le choix des sources pour les données d’entrées La réalisation du bilan carbone s’est appuyé sur un grand nombre de sources aussi bien internes qu’externes à l’entreprise afin d’obtenir les données d’entrées nécessaires. Globalement, le choix des données utilisées pour l’étude a été le suivant :
• L’estimation des émissions dues à la phase de conception de la ligne à été réalisée par des ingénieurs des chemins de fer suisses, qui ont également conçus avec notre aide l’outil de calcul des émissions (voir partie suivante). Les émissions de conception ont été estimées à partir de données de fonctionnement de bureaux d’études.
• Pour les matériaux utilisés dans la construction de l’infrastructure, les données ont été données par les différents départements techniques de SYSTRA. le département Génie Civil et Ouvrages d’Art (SYSTRA GCOA) a fourni les données relatives aux matériaux utilisés pour les ouvrages d’arts et les terrassements de différents projets auxquels SYSTRA a pris part, a savoir la LGV SEA, le lot B2 de la LGV Méditerranée, la ligne Pékin Tianjin, Settat Marrakech, Seoul Busan, et Taïwan pour les ouvrages d’art, et la LGV SEA, Pékin Tianjin et Settat Marrakech pour les terrassements.
• Un travail précédemment réalisé au sein de SYSTRA Conseil a permis de faire l’inventaire des matériaux utilisés notamment pour les équipements d’énergie, de signalisation et de voie.
• Pour les données d’exploitation, deux méthodes différentes ont été utilisées. Pour l’établissement du bilan carbone de la LGV SEA, les données issues des prévisions de trafic ont été prises pour avoir le niveau de trafic du TGV et les données de report modal. Pour les comparaisons modales, des scénarios représentant une demande potentielle ont été créés. La comparaison a alors porté sur les émissions liées au transport de cette demande par les différents modes.
• Un gros travail bibliographique a été réalisé pour afin de trouver les données dont nous ne disposions pas. On peut citer entre autres :
o Les données relatives à la construction du matériel roulant22, des véhicules et avions.
o Les données relatives à la construction des bâtiments : gares, terminaux, centres de maintenance…
o Les données concernant les statistiques de maintenance des infrastructures et du matériel roulant
o Les activités de chantiers
• Un travail d’estimation important a été mené à partir du travail de recherches bibliographiques afin notamment d’estimer l’impact lié à la construction des infrastructures routières et aériennes. Ce travail a été réalisé par analogie avec d’autres infrastructures de capacités comparables les données correspondant à l’autoroute A 10 et aux aéroports de Roissy, Orly et Mérignac n’étant pas disponibles en grande partie. Par exemple, la construction d’un terminal de même capacité d’un autre aéroport a pu être utilisée pour l’estimation.
22 Les données utilisées ont été celles de l’ICE2 et du Shinkansen 300. Ces matériels étant anciens, ils ne correspondent pas tout à fait aux nouveaux matériels roulant qui contiennent plus d’aluminium et de matériaux composites plus émetteurs.

88
2.2.3 Présentation du tableur Afin de pouvoir rentrer de manière simple les différentes données d’entrées, et ainsi calculer les émissions liées, un outil a été réalisé avec des ingénieurs des CFF. Il s’agit de tableurs qui ont été construits ainsi. Un tableur a été conçu pour les différents composants du bilan carbone, à savoir la construction (qui comprend également la conception) ; l’exploitation et la maintenance de l’infrastructure et le matériel roulant.
Dans chacun des trois classeurs, les différents onglets décrivent le bilan carbone d’un élément. Un exemple est donné dans les pages suivantes pour le matériel roulant. Il se décompose ainsi :
• La partie supérieure du tableur (voir page suivante) permet de montrer les émissions des éléments considérés, à la fois au total durant le cycle de vie de l’élément considéré (en bleu dans le document), et en fonction de l’unité qui est choisie pour la présentation des données, ici les véhicules kilomètres (en vert sur le tableur). Dans les tableurs de l’infrastructure, les données sont établies par an en fonction de leur durée de vie. Les résultats sont ensuite présentés au km de ligne/an. En haut de la page sont données toutes les données d’entrées indispensables au calcul des éléments et à leur conversion en unité fonctionnelle. Dans l’exemple suivant, il s’agit principalement de la capacité du train, de son poids, de sa durée de vie et de son kilométrage annuel. Pour les éléments d’infrastructure, il s’agit principalement des longueurs de lignes considérées ou des éléments calculés (par exemple pour les aiguillages ou les tunnels). Des espaces permettent également de préciser la définition de l’élément considéré et de le décrire afin de rester transparent sur la méthode employée.
• La partie inférieure du tableau permet de préciser les calculs qui ont conduit aux résultats présentés sur la partie supérieure. Les différentes phases de calculs sont présentées dans un tableau différent (dans l’exemple prix, la production d’un train et sa maintenance). La colonne « Dataset ID » permet de faire le lien avec la base de données EcoInvent. Chaque numéro renvoie à un type de facteur d’émission avec un intitulé qui s’affiche automatiquement dans la colonne « Material ». Il faut ensuite remplir les données d’entrées qui correspondantes dans la colonne « quantity » et la durée de vie de l’élément dans la case « lifespan ». Le tableau étant automatisé, les résultats d’émissions de CO² mais aussi de polluants et d’occumpation de l’espace pondérés par la durée de vie s’inscrivent automatiquement dans les colonnes correspondantes dans le partie inférieure du tableau, mais également dans la partie supérieure.
L’outil réalisé permet ainsi de calculer de manière simple les émissions engendrées par les différents éléments du bilan carbone en entrant simplement les données d’entrées.

Tableau 16 Calcul des émissions pour le cycle de vie d'un ICE 2

90

91
Tableau 17 Calcul des émissions pour la production et la maintenance d'un ICE 2

3 Conclusions et remarques personnelles
Le bilan carbone constitue donc un nouvel outil d’évaluation des projets de transports dont la méthode est encore en développement. Néanmoins, avec son application prochaine aux projets du Grenelle de l’environnement, différentes réponses devraient être apportées afin d’uniformiser les méthodes d’évaluation. L’intérêt du bilan carbone est de pouvoir aller au-delà des traditionnelles analyses basées sur l’exploitation des différents modes de transport. La prise en compte de tous les éléments constitutifs du cycle de vie d’une ligne à grande vitesse sont un élément important qui doivent permettre d’obtenir une réelle estimation de l’impact de la grande vitesse ferroviaire sur l’environnement et de son apport par rapport à ses concurrents. D’autre part, la méthode du bilan carbone peut être instructive du point de vue des sources d’émissions de carbone et permettre une prise de conscience sur certains facteurs particulièrement émetteurs de carbone. L’expérience récente du bilan carbone de la LGV Rhin Rhône semble montrer que des enseignements importants peuvent en être tirés. Enfin, le bilan carbone devrait permettre, à condition d’harmoniser les méthodes, d’établir des comparaisons entre différents projets.
Plusieurs remarques doivent être faites :
• La définition du périmètre considérée dans le bilan carbone est extrêmement importante, en particulier pour effectuer des comparaisons. En effet, même si un bilan carbone est présenté comme complet, il est illusoire de penser qu’il le soit réellement. Certains éléments sont impossibles à prendre en compte. Par exemple, les personnes qui on déménagé de Paris pour s’installer à Vendôme grâce au TGV ont modifié leur style de vie et donc leurs émissions. Il est notamment probables qu’elles se déplacent davantage en automobile pour accéder à des services près de chez elles. Ces habitudes sont presque impossibles à prendre en compte dans le bilan carbone. D’autre part, l’établissement d’un inventaire d’éléments constitutifs du bilan carbone suppose pour une bonne partie d’entre eux de procéder à une simplification des données. Or, plus l’on prend en compte d’éléments, plus le bilan carbone s’alourdit. Il est donc important de comparer des choses construites de manière semblable. La définition du périmètre et les hypothèses prises sont donc au moins aussi importante que les résultats.
• Il faut aussi se souvenir que le bilan carbone n’a pas vocation à donner de manière exacte les émissions de CO² d’une quelconque activité. Il s’agit plutôt de donner un ordre de grandeur dans le cadre d’une méthodologie et d’hypothèses bien précises.

93
Conclusion Générale
es investissements dans les lignes à grande vitesse sont perçus et assumés par les décideurs comme étant des moyens de promouvoir un système de transport « durable ». Néanmoins, une analyse approfondie des coûts et des bénéfices de la grande vitesse montre que cette
affirmation prête à caution.
Les bénéfices en termes environnemental de la grande vitesse ferroviaire semblent importants, notamment en termes de réchauffement climatique et de pollution. Néanmoins, les bénéfices économiques et sociaux de la grande vitesse sont nettement plus mesurés. Il est également peu évident de conclure à la supériorité de la grande vitesse dans ce domaine sur les autres modes concurrents. A l’inverse, il est évident que les projets d’infrastructure de transport à grande vitesse représentent un investissement extrêmement lourd qui pose un problème croissant de financement. Le bienfondé des bénéfices de la grande vitesse ferroviaire dépend largement des corridors considérés et de facteurs locaux tels que la densité de la population la congestion routière et aéroportuaires, les capacités existantes sur le réseau classique, les coûts de construction, la production énergétique locale…
Les conclusions de ce rapport doivent donc être mesurées dans la mesure où elles ont été rendues bien avant la fin de l’étude. En tout état de cause, un réel travail de comparaison des différents modes devrait nécessiter un investissement important et long. La réalisation du travail a notamment mis en lumière les difficultés liées à l’établissement de comparaisons modales et internationales. Dans bien des cas, les différences de contextes ou les caractéristiques mêmes des différents modes de transport remettent en cause la pertinence des comparaisons.
D’autre part, il est probable que d’autres types analyses auraient certainement été souhaitables. Par exemple, il aurait sans doute été intéressant de tester les impacts d’autres solutions modales possibles comme par exemple le renforcement, l’électrification, l’augmentation de capacité et l’accroissement de la vitesse sur les lignes ferroviaires conventionnelles existantes. Enfin, une analyse plus poussée de la complémentarité des modes aurait pu être effectuée.
La réalisation du bilan carbone a permis de découvrir une nouvelle méthode d’évaluation de projets de transport, ainsi que la réflexion méthodologique qui se construit actuellement autour.
D’un point de vue personnel, la réalisation de l’étude a été une source d’enseignements considérable dans un grand nombre de domaines relatifs au développement durable. La nécessaire mise en relation avec les départements techniques de SYSTRA m’a également permis d’acquérir des connaissances techniques notables dans le domaine ferroviaire. De manière générale, mon expérience à SYSTRA Conseil s’est avérée être une expérience très enrichissante aussi bien professionnellement que sur le plan personnel.
L
94
Table des illustrations
FIGURES
Figure 1 Organigramme du Groupe SYSTRA S.A..............................................................................................9 Figure 2 Energy Consumption of transports (2001).......................................................................................18 Figure 3 Energy efficiency of transports .......................................................................................................19 Figure 4 Energy Consumption and urban density..........................................................................................19 Figure 5 Comparison of air pollutants emissions for different typical routes in Europe .................................21 Figure 6 Energy consumption and air pollution for typical routes in Europe..................................................22 Figure 7 CO² emissions for typical routes in Europe......................................................................................23 Figure 8 People exposure to noise in Europe for cities over 250 000 inhabitants...........................................25 Figure 9 Noise consequences for Health.......................................................................................................26 Figure 10 Eurostar Noise: Variation with Speed............................................................................................29 Figure 11 Transport mode annoyance differential ........................................................................................30 Figure 12 Relative importance of Shinkansen noise sources and reuslts of noise countermeasures...............33 Figure 13Average cost per kilometer of new HSR infrastructure ...................................................................38 Figure 14 Cost of HSR infrastructures maintenance by country.....................................................................39 Figure 15 Comparison of infrastructure costs in France (in € 2005) ...............................................................40 Figure 16 Comparison of operating and maintenance cost by HSR technology in 2002 values .......................42 Figure 17 Easy Jet Operating Costs in 2008...................................................................................................43 Figure 18 SNCF TGV operation costs.............................................................................................................43 Figure 19 External Costs of transports (without congestion costs) ................................................................58 Figure 20 Fatality rates for different transport modes ..................................................................................62 Figure 21 Road fatality rate decay in the EU (including the GDR before 1990) and its prognosis to 2010 .......63 Figure 22 Rail and Air fatality rates in EU .....................................................................................................64 Figure 23 Feared Events for guided transport systems..................................................................................66 Figure 24 Fare comparisons between High Speed Rail and Aircraft (second class and discount rate only)......69 Figure 25 Example of fares range with a Paris Geneva trip............................................................................69 Figure 26 Dimensions of social equity ..........................................................................................................70 Figure 27 Exemple d'application des facteurs d'émissions ............................................................................81 Figure 28 Développement du réseau à grande vitesse Japonais de 1964 à nos jours ..Erreur ! Signet non défini.
TABLEAUX Tableau 1 Land Take by infrastructures........................................................................................................17 Tableau 2 Daily Noises.................................................................................................................................27 Tableau 3 Transport noise sources and influencing factors ...........................................................................28 Tableau 4 Possible implementations to reduce transport noise....................................................................31 Tableau 5 Modal Comparison of performances for environement sustainability...........................................35

95
Tableau 6 HSR technology in Europe : types of train.....................................................................................41 Tableau 7 Costs comparison of trains and planes .........................................................................................41 Tableau 8 Infrastructure charges received by the infrastructure manager in France......................................47 Tableau 9 Ownership of airports in Europe ..................................................................................................48 Tableau 10 Market share of air and rail transport ........................................................................................49 Tableau 11 Comparison of cities with and without Shinkansen railway station 10 years before and 10 years
after the opening of the Shinkansen ....................................................................................................53 Tableau 12 Information exchange industries employment growth in regions with population increase. 1981‐
1985....................................................................................................................................................53 Tableau 13 Modal Comparison of performances for economic sustainability................................................60 Tableau 14 Distances between stations in South Korea................................................................................74 Tableau 15 Modal Comparison of performances for a sustainable society ....................................................78 Tableau 16 Calcul des émissions pour le cycle de vie d'un ICE 2 ....................................................................89 Tableau 17 Calcul des émissions pour la production et la maintenance d'un ICE 2 ........................................90 Tableau 18 People exposure to noise in European Union ...........................................................................103

96
Annexes
LISTE DES LIGNES A GRANDE VITESSE DANS LE MONDE
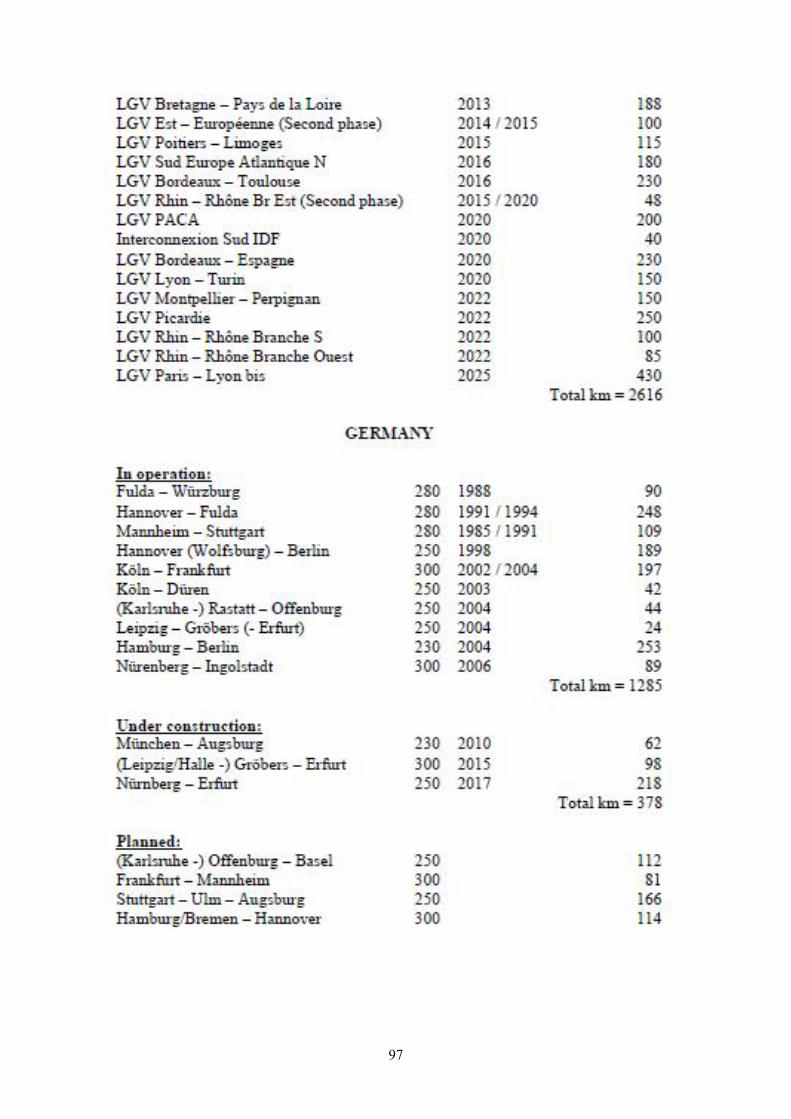
97

98

99

100

101
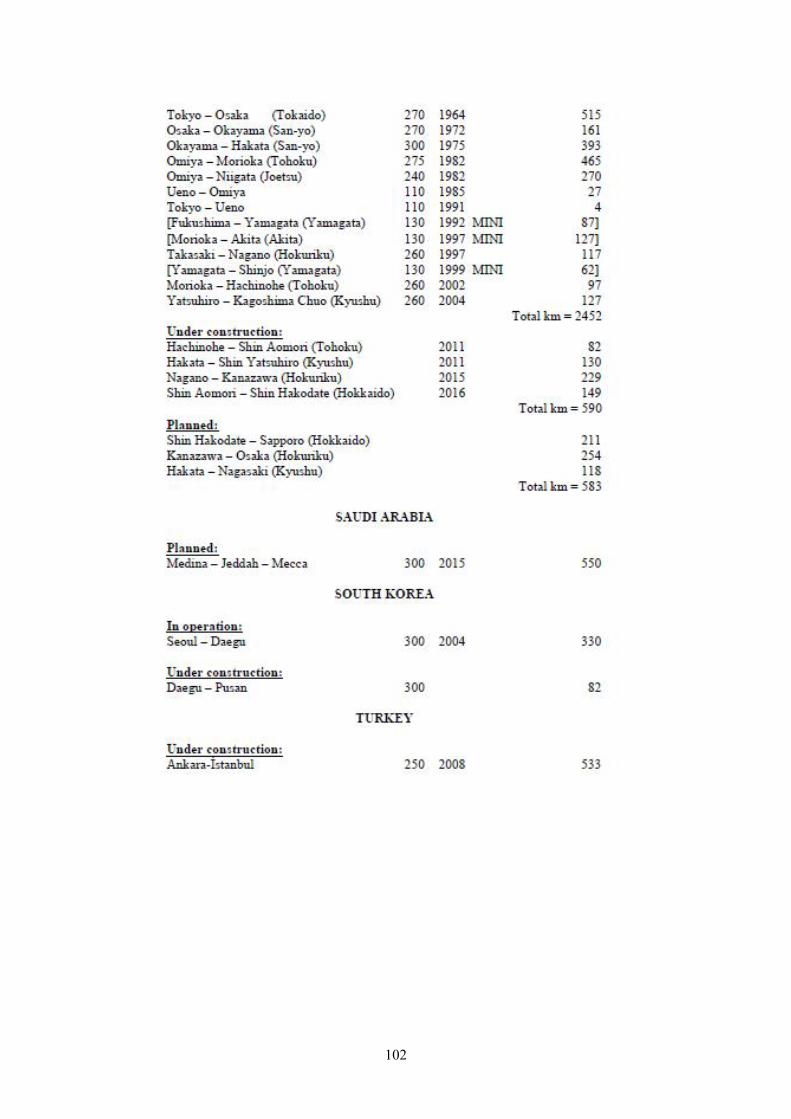
102
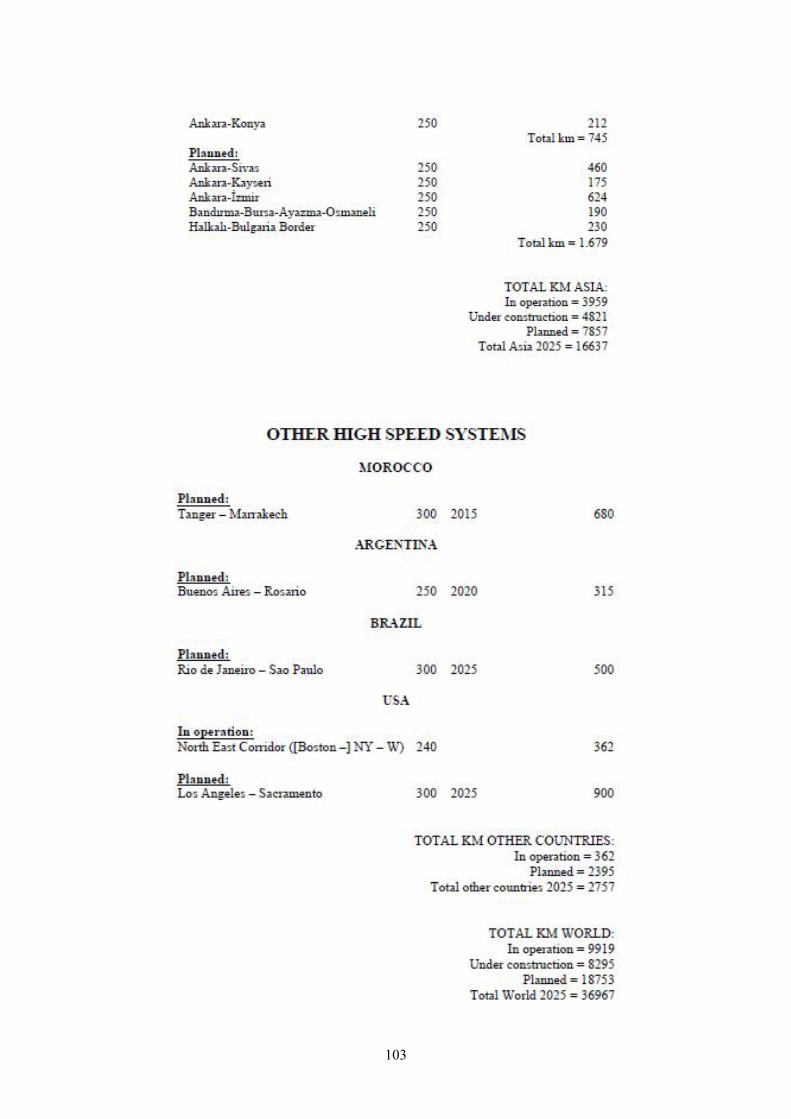
103

104
PART DE MARCHE DU TGV ET DE L’AVION POUR PLUSIEURS CORRIDORS A TRAVERS LE MONDE
G.De Rus, The economic effects of High Speed Rail Invesments, OECD, International Forum,
2008
EXPOSITION DES EUROPEENS AU BRUIT
Tableau 18 People exposure to noise in European Union
Noise exposure Level in the daytime % of exposed people < 55dB(A) 28,9 55-60dB(A) 26,9 60-65dB(A) 21,9 65-70dB(A) 14,7 70-75dB(A) 6,2 >75dB(A) 1,4 Total 100,0
Source : Jacques Lambert – INRETS

105
REPRESENTATION DE L’HABITAT NATUREL
Core areas: These are areas where the primary function is biodiversity conservation. They are usually legally protected under national or European legislation (e.g. Natura 2000 sites).
Corridors: These are areas of suitable habitat that provide functional linkages link between core areas. Corridors can be continuous strips of land or ‘stepping stones’ that are patches of suitable habitat.
Buffer zones: Protected areas should not be considered as islands that are safe from negative external effects (air/water pollution). Buffer zones allow a smoother transition between core areas and surrounding land use.
Sustainable use areas: These are remaining areas that can come under more intensive land use. But they should still take full account of the successful provision of ecosystem goods and services.

106
MIX ELECTRIQUE DES DIFFERENTS PAYS EUROPEENS EN 2005
Source: UIC