high-speed in vitro intensity diffraction tomography
TRANSCRIPT

High-speed in vitro intensity diffractiontomographyJiaji Li,a,† Alex Matlock,b,† Yunzhe Li,b Qian Chen,a Chao Zuo,a,* and Lei Tianb,*aNanjing University of Science and Technology, School of Electronic and Optical Engineering, Nanjing, Jiangsu, ChinabBoston University, Department of Electrical and Computer Engineering, Boston, Massachusetts, United States
Abstract. We demonstrate a label-free, scan-free intensity diffraction tomography technique utilizing annularillumination (aIDT) to rapidly characterize large-volume three-dimensional (3-D) refractive index distributionsin vitro. By optimally matching the illumination geometry to the microscope pupil, our technique reduces thedata requirement by 60 times to achieve high-speed 10-Hz volume rates. Using eight intensity images, werecover volumes of ∼350 μm × 100 μm × 20 μm, with near diffraction-limited lateral resolution of ∼487 nm andaxial resolution of ∼3.4 μm. The attained large volume rate and high-resolution enable 3-D quantitative phaseimaging of complex living biological samples across multiple length scales. We demonstrate aIDT’scapabilities on unicellular diatom microalgae, epithelial buccal cell clusters with native bacteria, and liveCaenorhabditis elegans specimens. Within these samples, we recover macroscale cellular structures,subcellular organelles, and dynamic micro-organism tissues with minimal motion artifacts. Quantifyingsuch features has significant utility in oncology, immunology, and cellular pathophysiology, where thesemorphological features are evaluated for changes in the presence of disease, parasites, and new drugtreatments. Finally, we simulate the aIDT system to highlight the accuracy and sensitivity of the proposedtechnique. aIDT shows promise as a powerful high-speed, label-free computational microscopy approachfor applications where natural imaging is required to evaluate environmental effects on a sample in real time.
Keywords: computational microscopy; three-dimensional imaging; diffraction tomography; phase retrieval.
Received May 9, 2019; accepted for publication Nov. 9, 2019; published online Dec. 28, 2019.
© The Authors. Published by SPIE and CLP under a Creative Commons Attribution 4.0 Unported License. Distribution orreproduction of this work in whole or in part requires full attribution of the original publication, including its DOI.
[DOI: 10.1117/1.AP.1.6.066004]
1 IntroductionThree-dimensional (3-D) refractive index (RI) distributions ofcells and tissues are useful for the morphological detectionand diagnosis of disease in biomedical imaging.1 For example,characterizing RI distributions has shown particular utility inunderstanding disease and morphogenesis.2 Quantitatively char-acterizing thick biological samples across multiple subcellularand multicellular scales, however, remains a challenging task.Here, we present a scan-free, high-speed intensity diffractiontomography (IDT) technique based on a standard microscopemodified with an annular LED illumination hardware unit. Ourlabel-free imaging method enables in vitro biological sample
observation, providing intrinsic 3-D structural RI sensitivityof large volumes at real-time acquisition speeds.
Due to the low absorption and contrast of biological samplesin the visible spectrum, exogenous labels (e.g., fluorophores) arecommonly used as biomarkers to visualize regions of interest.For example, confocal fluorescence and two-photon microscopyare commonly used when imaging thick 3-D samples. Althoughthese methods provide excellent optical sectioning, the excita-tion light and contrast agents for fluorescence imaging can causephotobleaching, phototoxicity, and other damaging effects thatartificially alter the sample’s behavior and structure.3 These fac-tors have pushed the need for label-free microscopy, where bio-logical samples are studied in their natural states. Quantitativephase imaging (QPI)1,4 is one such technique that measures anincident field’s phase shifts induced by the sample to recoverthe sample’s physical properties without staining or labeling.Both interferometry5–8 and intensity-only9–13 QPI techniqueshave been developed to recover a sample’s phase map in two
*Address all correspondence to Chao Zuo, E-mail: [email protected];Lei Tian, E-mail: [email protected]†These authors contributed equally to this work.
Research Article
Advanced Photonics 066004-1 Nov∕Dec 2019 • Vol. 1(6)Downloaded From: https://www.spiedigitallibrary.org/journals/Advanced-Photonics on 10 Nov 2021Terms of Use: https://www.spiedigitallibrary.org/terms-of-use
dimensions. A single two-dimensional (2-D) integrated phaseimage, however, is insufficient for characterizing 3-D hetero-geneous samples. Recently developed 3-D phase tomographytechniques instead recover the sample’s 3-D RI distributionto visualize intracellular structures.14–16
The most widely used interferometry-based RI tomographytechnique is optical diffraction tomography (ODT). In ODT,the scattered field is directly measured from digitally recordedinterferograms taken under different illumination angles(i.e., phase projection measurement). Several ODT approacheshave been applied in biomedical studies for evaluating cellphysiology,17,18 pathophysiology and immunology,19–22 oncol-ogy,23–25 and micro-organism and intracellular particletracking.26,27 Notably, annular illumination is particularly effec-tive in achieving high-quality 3-D RI recovery using a relativelysmall number of phase projection measurements. The phasenanoscopy technique15 allows both static and time-lapse 3-DRI recovery of cells by mechanically scanning a laser illumina-tion unit along a ring-shaped trajectory. An alternative ODTmicroscope builds on a programmable illumination unit usinga digital micromirror device (DMD) to generate plane-waveillumination with annularly distributed angles.28,29 However,both techniques require additional optical paths for off-axisor common-path interferometric recording that are difficult toimplement in the existing microscope platforms.
The alternative approach we demonstrate here uses intensity-only measurements for QPI based on the principle of IDT.30
Other intensity-based approaches have been explored but oftenrequire sample or objective scanning along the axial direction tocapture a through-focus intensity stack.31–33 The 3-D RI map isthen recovered from this image stack using deconvolutionalgorithms.34,35 For example, the gradient light interferencemicroscopy16 achieves 3-D imaging of thick biological samplesusing a differential interference contrast through-focus intensitystack. The 3-D differential phase contrast microscopy approachtakes an axially scanned intensity stack under asymmetricpartially coherent illumination.35 In these cases, however, themechanical motion reduces the measurement’s temporal resolu-tion. Recently, scan-free IDT techniques have been demon-strated by our group for 3-D RI information recovery usingoblique illumination intensity measurements. While laserscoupled with DMDs, galvanometers, and other programmablesources have been used for scan-free oblique illumination,15,28,36
we equip a standard bright-field microscope with a ring LEDarray. The LED array provides a low-cost illumination sourceeasily adoptable for biological research that avoids the speckleartifacts present with coherent lasers. Unfortunately, our originalillumination-based IDT technique30 still exhibited poor tempo-ral resolution due to its large illumination quantity requiring>600 intensity images over several minutes per measurementacquisition.
To improve IDT’s temporal resolution, we develop a fast andaccurate annular illumination IDT (aIDT) technique overcom-ing these limitations. Importantly, our technique reduces thedata requirement by more than 60 times, achieving more than10-Hz for imaging a volume of ∼350 μm × 100 μm × 20 μm,with near diffraction-limited lateral resolution of 487 nm andaxial resolution of 3.4 μm in the 3-D RI reconstruction. Theseimprovements enable in vitro dynamic 3-D RI characterizationsof living biological samples. We show that our technique pro-vides useful subcellular information on multiple species, includ-ing unicellular diatom microalgae, clustered epithelial buccal
cells, and live Caenorhabditis elegans (C. elegans) multicellularspecimens.
Several hardware and algorithmic innovations enable ourannular IDT technique. First, our hardware employs a program-mable LED ring consisting of only 24 surface-mountedLEDs. Compared to existing LED matrix-based systems,35,37–41
the reduced number of LEDs significantly speeds up the acquis-ition. More importantly, the ring illumination geometry canoptimally fit with the circular microscope pupil, which weshow is crucial for both data reduction and high-quality RIreconstruction. We develop an illumination-based IDT theorythat highlights the optimal imaging condition achieved bymatching the illumination angle with the objective numericalaperture (NA). This illumination scheme optimally encodesboth low- and high-spatial frequency RI information acrossthe entire 3-D volume using a small number of intensity mea-surements. This allows us to use only eight intensity measure-ments for imaging fast dynamics and provides an optimaltrade-off between RI reconstruction quality and motion artifacts.We implement a recently developed reconstruction approachenabling computationally efficient, noniterative slice-wisedeconvolution for volumetric object recovery. We furtherdevelop a robust self-calibration algorithm to correct the LEDpositions, which we show is critical for high-quantity 3-D RIreconstruction, in particular, at large defocus positions. Finally,we simulate our aIDT system to show accurate reconstructionswithin 1 × 10⁻³ of the object’s true RI and sensitivity to RIchanges of 2 × 10⁻⁴ under our system’s signal-to-noise ratio(SNR) for weakly scattering objects.
2 Methods
2.1 aIDT Principle
Our aIDT imaging system combines an LED ring illuminationunit and a standard bright-field microscope [Fig. 1(a)]. The LEDring is placed some distance h away under the sample, as illus-trated in Fig. 1(b). Importantly, the distance is carefully tunedsuch that the ring is matched with the perimeter of the objectivelens’s pupil aperture. This can be done because this illuminationdesign approximately follows the Köhler geometry, in whicheach LED provides a plane wave of unique angle. Denotingthe radius of the ring as r, the illumination NA (NAillum) of eachLED is set by NAillum ¼ r∕
ffiffiffiffiffiffiffiffiffiffiffiffiffiffiffir2 þ h2
p. Hence, one can achieve
NAillum matching the objective NA (i.e., NAobj ¼ NAillum) bysimply adjusting the LED height h. During the experiment,we acquire up to 24 images capturing bright-field intensity mea-surements from each individual LED in our ring unit [Fig. 1(c)].By downsampling the total LED number, we can improve ouracquisition speed to accommodate dynamic live samples.
The intensity of each image results from the interferenceof the scattered field from a weakly scattering object and theunperturbed illuminating field [Fig. 1(c)]. By quantifying theFourier space information under the first Born approximation,we derive phase and absorption transfer functions (TFs)30
linearly relating the object’s complex permittivity distributionto the measured intensity. The exact form of the TFs is detailedin Eqs. (1a) and (1b) in Sec. 2.2. The TFs are angle- and depth-dependent and result in the four-dimensional (4-D) Fourierspace representation shown in Fig. 1(d). This relation allowsus to implement a fast and efficient slicewise 3-D deconvolution
Li et al.: High-speed in vitro intensity diffraction tomography
Advanced Photonics 066004-2 Nov∕Dec 2019 • Vol. 1(6)Downloaded From: https://www.spiedigitallibrary.org/journals/Advanced-Photonics on 10 Nov 2021Terms of Use: https://www.spiedigitallibrary.org/terms-of-use

algorithm with a closed-form solution [Eqs. (2a) and (2b) inSec. 2.3] to recover the complex 3-D RI distribution.
Several important observations govern our illumination de-sign. First, each TF’s Fourier coverage features a pair of circularregions describing the scattered field’s information and itscomplex conjugate. The system’s objective NAobj defines thecircles’ radius while the illumination angle NAillum definesthe center positions. By matching NAillum to NAobj, one ensuresmaximizing the Fourier coverage allowed by the system (i.e.,2NAobj), as demonstrated in Fig. S1 in the SupplementaryMaterial. Second, the phase information is captured by the anti-symmetric Fourier information whereas the absorption informa-tion is by symmetric information [Fig. 1(d)]. The antisymmetryin the phase TF further indicates that any overlap between thetwo circular regions (by using NAillum < NAobj) will cancelthe captured low-spatial frequency information [Fig. S1(a) inthe Supplementary Material].11,30 Setting NAillum ¼ NAobj re-moves this overlap and ensures optimal low-frequency phaseinformation coverage. Together, our annular illuminationscheme captures both high- and low-spatial frequency phaseand absorption information in 3-D using a small number ofintensity-only measurements.
2.2 Transfer Function Analysis
In the aIDT forward model, a 3-D sample is discretized intoa stack of 2-D sample slices. Following the IDT derivation,30
the 3-D phase and absorption TFs can be derived slice-by-sliceas a function of the illumination angle. The analytical expres-sion of the phase TF (HP) and absorption TF (HA) can beexpressed as
HPðuÞ ¼iΔzk202
�Pðu − ρsÞ
expf−i½ηðu − ρsÞ − ηs�zgηðu − ρsÞ
− Pðuþ ρsÞexpfi½ηðuþ ρsÞ − ηs�zg
ηðuþ ρsÞ�; (1a)
HAðuÞ ¼ −Δzk202
�Pðu − ρsÞ
expf−i½ηðu − ρsÞ − ηs�zgηðu − ρsÞ
þ Pðuþ ρsÞexpfi½ηðuþ ρsÞ − ηs�zg
ηðuþ ρsÞ�; (1b)
where u denotes the lateral wave vector,Δz is the axial samplingspacing (i.e., slice spacing), k0 ¼ 2π∕λ is the wave number, λ isthe illumination wavelength, P is the objective pupil function,ρs is the lateral illumination wave vector, ηðuÞ ¼
ffiffiffiffiffiffiffiffiffiffiffiffiffiffiffiffiffiffik20 − juj2
pis
the axial wave vector, ηsðρsÞ ¼ffiffiffiffiffiffiffiffiffiffiffiffiffiffiffiffiffiffiffik20 − jρsj2
pis the illumination
axial wave vector, and z is the sample’s axial location. Withslice-wise discretization, we denote the axial location asz ¼ mΔz, where m is the slice index for M slices.
2.3 Three-Dimensional RI Reconstruction Algorithm
To achieve 3-D RI reconstruction, aIDT solves an inverseproblem through deconvolution. First, each intensity image isprocessed to remove the background. Next, the Tikhonov regu-larized deconvolution is performed to reconstruct the object’sreal and imaginary RI. The main idea of our slicewise decon-volution process is to replace the continuous integration alongthe axial direction by a discrete sum over the slice index.Importantly, since the TFs are independent between slices,the scattering information from different sample slices is alsodecoupled. This decoupling allows us to use a computationallyefficient, slice-based deconvolution procedure to reconstruct thecross-sectional RI distribution one slice at a time. The slice spac-ing is chosen arbitrarily during the computation. The achievedaxial resolution is characterized by analyzing the reconstructedstack and is found to approximately match with the diffraction
limit, set by λ∕ðnm −ffiffiffiffiffiffiffiffiffiffiffiffiffiffiffiffiffiffiffiffiffiffiffin2m − NA2
obj
qÞ, where nm is the RI of
surrounding medium. The closed-form solutions for real part ofthe permittivity contrast (i.e., phase) ΔεRe and imaginary part ofthe permittivity contrast (i.e., absorption) ΔεIm at each axialslice are
(c)(b)(a) (d)
Fig. 1 Illustration of our aIDT imaging system. (a) A photo of our aIDT system consisting of astandard microscope equipped with an LED ring. A visualization demonstrating the operationof the system is shown in Video 1. (b) An LED ring illumination unit is placed underneath thesample. The distance h is tuned such that the illumination angle α is matched with the objectiveNA. (c) Each IDT image measures the interference between the scattered and the unperturbedfields. (d) The absorption and phase TFs at various illumination angles and sample depths(Video 1, MPEG, 2.7 MB [URL: https://doi.org/10.1117/1.AP.1.6.066004.1]).
Li et al.: High-speed in vitro intensity diffraction tomography
Advanced Photonics 066004-3 Nov∕Dec 2019 • Vol. 1(6)Downloaded From: https://www.spiedigitallibrary.org/journals/Advanced-Photonics on 10 Nov 2021Terms of Use: https://www.spiedigitallibrary.org/terms-of-use

ΔεRe½m�¼F−1�1
A
��Xl
jHAðl;mÞj2þβ
�⊙�X
l
H�Pðl;mÞ⊙g̃½l�
�
−�X
l
H�Pðl;mÞ⊙HAðl;mÞ
�⊙�X
l
H�Aðl;mÞ⊙eg½l����
;
(2a)
ΔεIm½m�¼F−1�1
A
��Xl
jHPðl;mÞj2þα
�⊙�X
l
H�Aðl;mÞ⊙eg½l��
−�X
l
HPðl;mÞ⊙H�Aðl;mÞ
�⊙�X
l
H�Pðl;mÞ⊙eg½l����
;
(2b)
where F−1 denotes the 2-D inverse Fourier transform, A isa normalization term ½PljHPðl; mÞj2 þ α�⊙½PljHAðl; mÞj2þβ� − ½PlHPðl; mÞ⊙H�
Aðl; mÞ�⊙½PlH�Pðl; mÞ⊙HAðl; mÞ�, ½m�
indexes the m’th sample slice, ½l� is the l’th intensity image,HAðl; mÞ and HPðl; mÞ are the discretized 4-D TFs for them’th slice from the l’th illumination, ⊙ denotes elementwisemultiplication between two matrices, α and β are the regulari-zation parameters for the phase and absorption, and g̃½l� isthe Fourier spectrum of the background-subtracted intensityimage.
2.4 System Setup
Our aIDT setup is built on an upright bright field microscope(E200, Nikon) and replaces the existing illumination unit witha ring LED (1586, Adafruit). The radius of the ring LED unit is∼30 mm. The LED ring is placed ∼35 mm away from the sam-ple, whose center is aligned with the optical axis of the micro-scope. Each LED approximately provides spatially coherentquasimonochromatic illumination with central wavelength λ ¼515 nm and ∼20 nm bandwidth. All experiments in the maintext were conducted using a 40× microscope objective (MO)(0.65 NA, CFI Plan Achro). Images were taken with ansCMOS camera (PCO. Panda 4.2, 6.5 μm pixel size), whichis synchronized with the LED source to provide camera-limitedacquisition speed. The LED ring unit is driven by a microcon-troller (Arduino Uno). In addition, we provide additional resultsusing a 10× (0.25 NA, CFI Plan Achro) MO to image spiralalgae (S68786, Fisher Scientific) in Video S1, MPEG, 7.1 MB[URL: https://doi.org/10.1117/1.AP.1.6.066004.7].
During the experiments imaging living C. elegans, a rectan-gular field of view consisting of 2048 × 600 pixels is optimizedto match the sample size and achieve an 85-Hz cameraacquisition speed and 10.6-Hz volume rate. All the processingis done using MATLAB 2018b on a personal computer. Theprocessing time to perform LED position calibration (using a400 × 400 × 24 intensity stack) is about 2 s. Three-dimensionalreconstruction for a 1024 × 1024 × 51 RI stack takes about 50 s.
2.5 Self-Calibration Method
During the reconstruction, we first perform a numerical self-calibration procedure. The assumed illumination angles for thering LED do not necessarily match the experimental implemen-tation, and the use of incorrect angles can lead to significantreconstruction artifacts.36 Each high-angle illumination in aIDT
is very sensitive to high- and low-frequency object information,so calibrating the angle is critical to recover volumetric infor-mation without error. The algorithm imposed here follows twogeometric constraints. First, the distribution of our LED ring isexpected to obey a circular geometry,
u2i þ v2i ¼ ðNAobj∕λÞ2; (3)
where ðui; viÞ denotes the estimated spatial frequency for thei’th LED. Second, the LEDs are expected to be equally spaced.Correspondingly, each pair of neighboring LEDs occupies aπ∕12 radian angular space. The initial estimate of the angularcoordinates θi of each LED is
θi ¼ atan2ðvi∕uiÞ; and θi ∈�−π∶ π
12∶π
�; (4)
where atan2 computes the angle of the inverse tangent functionin the unit of radian.
Our self-calibration algorithm starts with an initial guessuiniti ; viniti from the algorithm in Ref. 36, whose estimated LEDpositions are often contaminated by noise. Accordingly, thefinal calibrated LED positions ucali ; vcali are parameterized as
ucali ¼ Δuþ NAobj cosðθi þ ΔθÞ∕λ;vcali ¼ Δvþ NAobj sinðθi þ ΔθÞ∕λ; (5)
and are found by solving the optimization problem,
minucali ;vcali
X24i¼1
½ðucali − uiniti Þ2 þ ðvcali − viniti Þ2�: (6)
3 Results
3.1 Angle Self-Calibration and PerformanceCharacterization
Achieving high-quality RI tomographic reconstruction requiresaccurate LED positioning, especially when imaging large-volume objects under high NA illuminations. In practice,removing all residual errors in the LED positions using onlymanual alignment and physical calibration procedures is non-trivial. We instead develop an algorithmic self-calibration methodfor finely tuning the LED positions and demonstrate our tech-nique’s improvement of 3-D reconstructions.
Our self-calibration method combines two main principlesfor high-accuracy measurements. First, our TF analysis showsthat each intensity image’s Fourier spectrum should containdistinct circular regions with center positions defining theillumination angle. A demonstration of this principle on theexperimental data is shown in Video 1. A previously developedalgorithm36 already utilizes these features, so we adopted thistechnique to provide initial LED position estimates. In practice,this algorithm’s susceptibility to noise can introduce positionerror exceeding the illumination unit’s engineering and align-ment tolerance. To correct this error, we subsequently incorpo-rate two geometric constraints refining the LED positions toform a ring shape with equal angular spacing using a nonlinearfitting algorithm. This is warranted because the surface-mount
Li et al.: High-speed in vitro intensity diffraction tomography
Advanced Photonics 066004-4 Nov∕Dec 2019 • Vol. 1(6)Downloaded From: https://www.spiedigitallibrary.org/journals/Advanced-Photonics on 10 Nov 2021Terms of Use: https://www.spiedigitallibrary.org/terms-of-use

technology has high position accuracy of device placement inthe printed circuit board manufacture process, and our illumi-nation unit’s printed LED circuits have expected engineeringtolerances below 5 μm generally.
We demonstrate the effectiveness of this method on diatommicroalgae (S68786, Fisher Scientific) fixed in glycerin gelatinimaged with a 0.65 NA MO. An example intensity image isshown in Fig. 2(a). The low-absorbing features (i.e., “phase”features) are already visible due to asymmetric illumination,akin to differential phase contrast.42 Figure 2(b) comparesthe LED positions from manual alignment (blue stars) andour self-calibration method (green triangles) (more details areillustrated in Fig. S2 in the Supplementary Material). The RI
reconstruction improvements from our technique are shownin three outsets, highlighting the features located at differentaxial positions.
As shown in Fig. 2(d), the LED miscalibrations have mini-mal effect for structure reconstructions at the objective’s focalplane (z ¼ 0 μm). Significant RI degradation from incorrectillumination angles is observed at defocus reconstruction planes[Figs. 2(c) and 2(e)]. This degradation is intuitively explainedunder the “light field” effect:39,40 for a fixed angular error, alarger defocus induces a larger feature displacement error. Ourself-calibration method largely mitigates these errors to providehigh-quality RI reconstructions [Figs. 2(c)–2(e)]. Both thelateral resolution and contrast are preserved across the entire
(c) (d)
(a)
(e)
(b)
Fig. 2 Results from our LED position self-calibration method. (a) A sample intensity image of adiatom under a certain single-LED illumination. (b) LED positions from manual alignment (termeduncalibrated, marked in blue star) and our self-calibration method (termed calibrated, marked ingreen triangle) as plotted in the spatial frequency coordinates. (c)–(e) Comparison of the recon-structed RI slides before and after calibration. (c) z ¼ −9 μm, (d) z ¼ 0 μm, and (e) z ¼ 13.5 μm.More detailed comparisons across the whole volume are provided in Video 2 (Video 2, MPEG,2.6 MB [URL: https://doi.org/10.1117/1.AP.1.6.066004.2]).
Li et al.: High-speed in vitro intensity diffraction tomography
Advanced Photonics 066004-5 Nov∕Dec 2019 • Vol. 1(6)Downloaded From: https://www.spiedigitallibrary.org/journals/Advanced-Photonics on 10 Nov 2021Terms of Use: https://www.spiedigitallibrary.org/terms-of-use
volume and recover diatom frustules previously lost at large de-focus due to miscalibration [Fig. 2(e)]. This calibration pro-cedure allows us to provide high-quality RI distributions withaIDT and is used in our subsequent results.
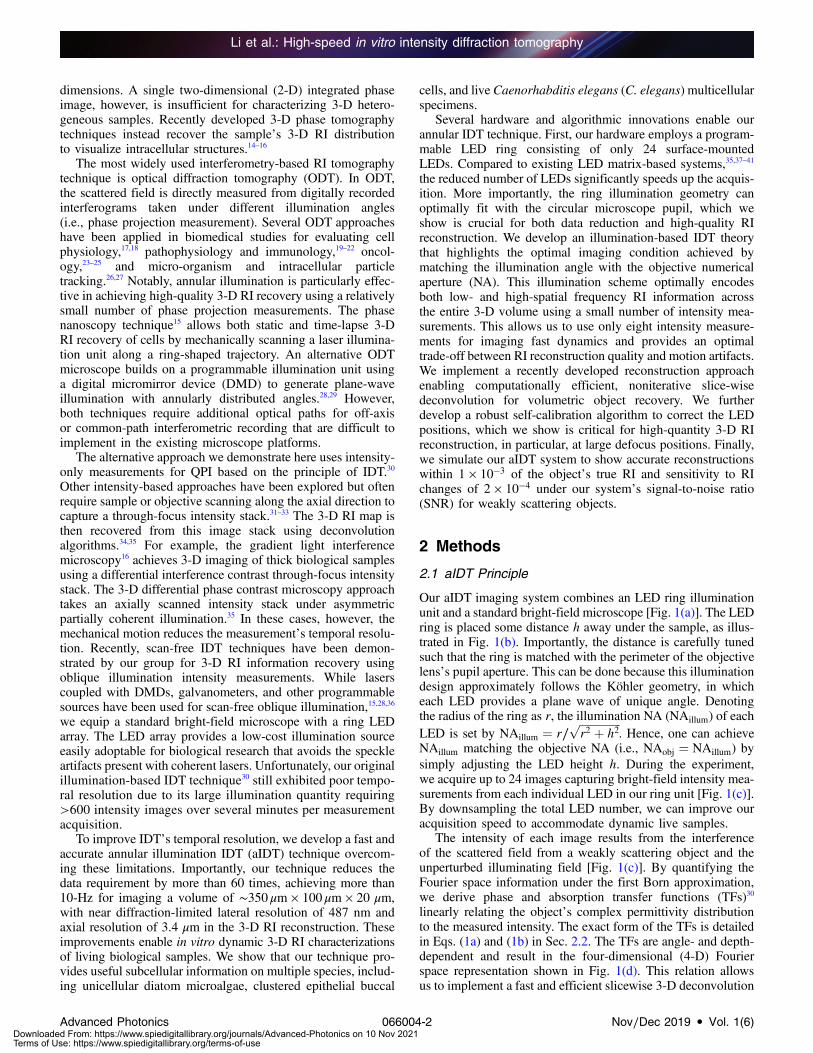
3.2 Tomographic Characterization of Surirella spiralis
We demonstrate aIDT’s ability to characterize complex single-cell organisms with intracellular resolution on a Surirellaspiralis (S. spiralis) diatom sample. We acquired 24 intensityimages under oblique illuminations and reconstructed thesample’s RI across a 50-μm volume as shown in Fig. 3. Thebenefit of this technique is clearly shown in its recovery ofmultiscale features of the sample. aIDT recovers the character-istic S. spiralis saddle shape spanning the full 50-μm recon-structed volume [Figs. 3(a)–3(c)]. Within this large saddle, finestructures including silica frustules are also visible and well-
resolved across multiple reconstructed slices [Figs. 3(d)–3(g)]and the YZ cross-sectional views [Figs. 3(h) and 3(i)]. Tofurther illustrate this structure, Fig. 3(j) displays the RI ren-dered as a 3-D volume43 of S. spiralis. Line profiles acrossthese 10-μm tall frustules in Figs. 3(k)–3(n) demonstrate neardiffraction-limited lateral resolution of 487 nm and axialresolution of 3.4 μm.
aIDT quantitatively recovers both full cell-sized featuresand intracellular structures easily using a small set of intensityimages from a single focal plane. These results make aIDTadvantageous for biological research applications containingcomplex environments requiring simultaneous, multiscalesample evaluation. In addition, the lack of sample scanningwith this technique increases its utility for dynamic sample im-aging, where living objects easily move out-of-focus. We showaIDT’s application to both of these cases in the subsequentsections.
(a)
(b)
(c)
(d)
(i)
(e)
(j)
(k) (l)
(g)
(h)
(f)
(m) (n)
Fig. 3 RI tomography of S. spiralis. (a)–(c) The maximum RI projection views of the recovered3-D RI distribution in the x − y , x − z, and y − z planes. (d) Zoom-in on closely packed frustulestructures. (e)–(g) Reconstructed 2-D cross sectional RI slices at −5, 0, and 5 μm planes.(h), (i) YZ -cross-sectional views of the reconstructed RI. (j) A 3-D rendering view of the recon-structed RI distribution. Additional cross-sectional reconstruction and 3-D rendering view fromdifferent perspectives are shown in Video 3. (k)–(n) Line profiles across frustule structures toquantify the reconstructed lateral and axial resolution (Video 3, MPEG, 3.3 MB [URL: https://doi.org/10.1117/1.AP.1.6.066004.3]).
Li et al.: High-speed in vitro intensity diffraction tomography
Advanced Photonics 066004-6 Nov∕Dec 2019 • Vol. 1(6)Downloaded From: https://www.spiedigitallibrary.org/journals/Advanced-Photonics on 10 Nov 2021Terms of Use: https://www.spiedigitallibrary.org/terms-of-use

3.3 RI Tomography on Cell Clusters
We next apply aIDT to evaluating complex biological cell clus-ters and environments. Existing 2-D phase imaging techniquesare often used when imaging monolayers of cells. These inte-grated phase map techniques contain less useful information,however, when imaging cell clusters more commonly foundin biological systems. Our aIDT technique overcomes this prob-lem by recovering multiple, independent RI cross-sectionsacross extended volumes. This approach enables better depth-sectioning of the sample such that larger biological structureswith greater complexity can be evaluated without significantinformation loss.
We demonstrate this ability to recover complex biologicalenvironments on clusters of unstained human epithelial buccalcells distributed on a glass sample slide. A sample normalizedintensity image is shown in Fig. 4(a), showing the cell cluster’scomplexity and its defocused regions highlighting the sample’slarge volume. We take 24 intensity images and reconstructthe RI across a 16-μm volume. We expand two regions of thereconstructed RI in Figs. 4(b) and 4(c), highlighting our depth-sectioned reconstructions.
The benefit of aIDT when imaging complex environments isseen in its high-resolution reconstructions across the entire cellvolume. At each reconstructed slice, we observe cellular mem-brane folds, cell boundaries, nuclei, and intracellular featureswith high resolution [Figs. 4(b) and 4(c), arrows]. In addition,we recover native bacteria, likely a Staphylococcus strain, dis-tributed on the cells throughout the sample [Figs. 4(b) and 4(c),circles].
Quantifying the 3-D RI distribution of entire cells, their sub-cellular structures, and external environment features, such asbacteria, has significant potential in biological research applica-tions. The recovered volumetric RI distributions of cellularfeatures enable the calculation of dry and buoyant mass,sphericity, and other morphometric descriptors used for cellprofiling.44,45 Because subcellular and bacterial structures arealso resolved, these parameters can be applied to subcellular fea-tures with aIDT. With aIDT’s fast acquisition rates and largevolume recovery, shown experimentally in the next section,longitudinal maps of structure mass and volume changes canbe mapped in real time throughout multicellular complex envi-ronments. Quantifying these factors could be highly beneficialto immunology and pathophysiology applications, where longi-tudinal studies of parasite and bacterial interactions and inducedmorphological changes in cells carry critical information forunderstanding and mitigating infection.19,46 Furthermore, quan-tifying volumetric morphological changes of cellular and sub-cellular information also has significant utility in oncology, bothfor differentiating cancer types and evaluating their response todrug and therapy treatments.23–25
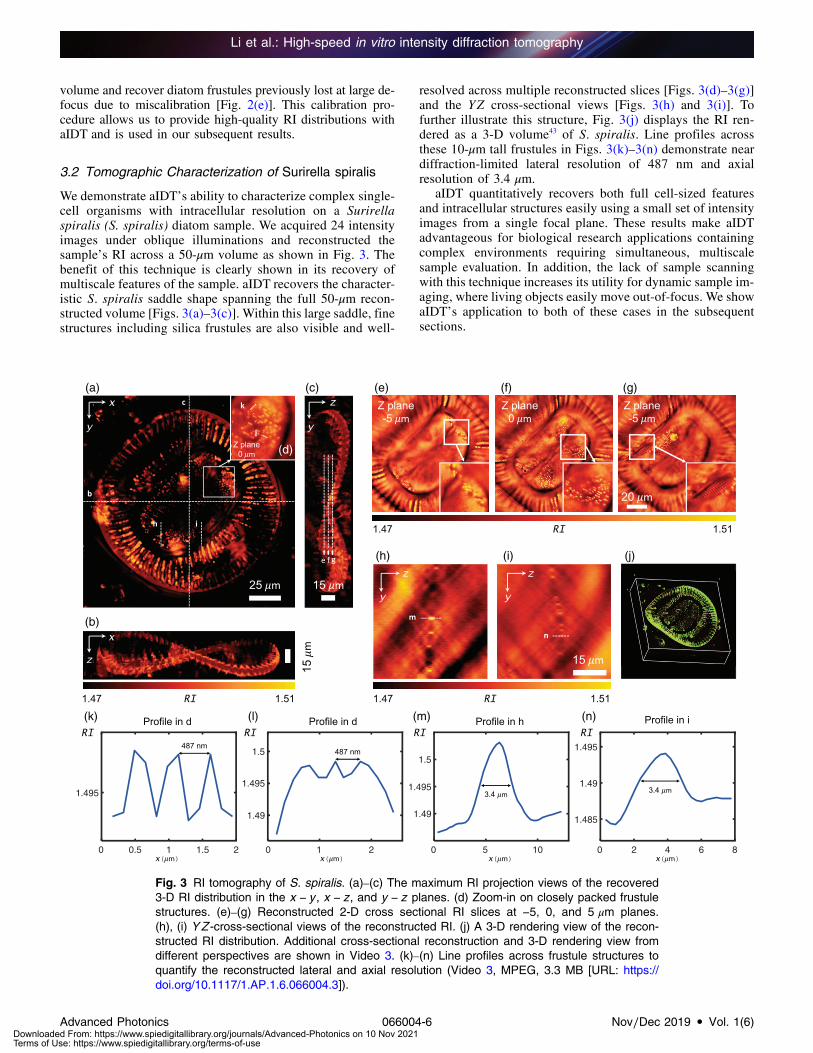
3.4 Dynamic RI Tomography of C. elegans In Vitro
A major advancement enabled by aIDT is the ability to performhigh-speed in vitro tomographic imaging of biological samplesusing a small number of intensity-only measurements. Thisallows us to visualize 3-D dynamic biological phenomena withminimal motion artifacts, which is particularly challengingusing existing RI tomography techniques. We demonstrate thisability on unstained, live C. elegans worms47,48 at a 10.6-Hz vol-ume rate. We image a volume of 333 μm × 98 μm × 21 μm. In atime-lapse series, each image stack includes eight frames (for
reconstructing each RI volume) that were recorded with a4.4-ms exposure time over a 3-min period to evaluate fastmotions in a living C. elegans.
The reconstructed RI of the C. elegans worm is shown inFig. 5. Reconstructed RI x − y and x − z cross-sections atthe z ¼ 0 μm plane at t ¼ 0 s are shown in Figs. 5(a) and 5(b),respectively. Figure 5(c) shows the RI distribution of the wormat different z planes in the marked region at t ¼ 0 s. Figure 5(d)
(a)
(b) (c)
Fig. 4 Single cell RI tomography of unstained human cheek cellclusters. (a) A sample raw intensity image under annular illumi-nation. (b), (c) Reconstructed RI cross-sections demonstrate thesectioning capability enabled by the aIDT. Additional examplesare shown in Video 4 (Video 4, MPEG, 2.8 MB [URL: https://doi.org/10.1117/1.AP.1.6.066004.4]).
Li et al.: High-speed in vitro intensity diffraction tomography
Advanced Photonics 066004-7 Nov∕Dec 2019 • Vol. 1(6)Downloaded From: https://www.spiedigitallibrary.org/journals/Advanced-Photonics on 10 Nov 2021Terms of Use: https://www.spiedigitallibrary.org/terms-of-use
(a)
(e)
(b)
(c)
(d)
Fig. 5 Time-lapse in vitro tomographic imaging of C. elegans. (a) Recovered RI slice located atcentral plane at t ¼ 0 s. The full C. elegans worm reconstruction visualization is shown in Video 5.(b) RI stack section in x − z plane close to the mouth of C. elegans. Buccal cavity of C. elegans isdistinguishable (indicated by the white arrows). (c) RI distribution of worm at different z planes inthe marked red square region at t ¼ 0 s. Time-lapse details are demonstrated in Video 6.(d) Visualizations and RI quantification of the C. elegans internal tissue structures at different timepoints and axial planes. (e) Depth color coding of 3-D RI measurements of sample in the selectedsubregion with fixed position in the field of view. Four different time points to illustrate the timelapse results of C. elegans (Video 5, MPEG, 9.7 MB [URL: https://doi.org/10.1117/1.AP.1.6.066004.5]; Video 6, MPEG, 9.5 MB [URL: https://doi.org/10.1117/1.AP.1.6.066004.6]).
Li et al.: High-speed in vitro intensity diffraction tomography
Advanced Photonics 066004-8 Nov∕Dec 2019 • Vol. 1(6)Downloaded From: https://www.spiedigitallibrary.org/journals/Advanced-Photonics on 10 Nov 2021Terms of Use: https://www.spiedigitallibrary.org/terms-of-use

shows the RI distribution of the C. elegans internal tissue struc-tures at different time points and axial planes. Depth-coded pro-jections of our reconstructions are also provided in Fig. 5(e),where the volumetric RI distribution is shown for several differ-ent time points. The full C. elegans worm reconstruction visu-alization is shown in Video 5. The results show that aIDT isrobust to motion artifacts and resolves internal features duringhigh-speed worm motion, as clearly demonstrated in Video 6.
Our technique easily visualizes and provides RI quantifica-tion of the C. elegans internal tissues. The anterior and terminalpharyngeal bulbs are clearly resolved in our reconstruction[Figs. 5(a) and 5(c)] as well as the grinder and intestines[Fig. 5(c), circles; Fig. 5(d), long bracket]. Lipid droplets andlysosomes are also distinguished in the worm head at differentaxial layers [Fig. 5(c), arrows]. Within the worm body, we re-cover the vulva [Fig. 5(d), circles] across multiple axial slices,body wall muscles [Fig. 5(d), short brackets], and features re-sembling the worm’s nerve cord [Fig. 5(d)]. We also observeE. coli bacteria living and moving independently of theC. elegans [Fig. 5(d), small circles]. Additional results on fixedC. elegans can be found in Video S2, MPEG, 7.8 MB [URL:https://doi.org/10.1117/1.AP.1.6.066004.8].
aIDT enables a simple, label-free approach for volumetricimaging in the biological research community. The tissuesshown in Fig. 5 and Video 5 often undergo phenotypic changesfrom genetic mutations during biological studies.49 Quantifyingthese tissue changes and studying their effect on live wormbehavior in a natural, label-free setting would be highly benefi-cial in understanding the effects of targeted genetic mutations onliving organisms. Because our technique captures bacteria mo-tion concurrently with the C. elegans, aIDT could also evaluatemultiorganism interactions and provide 3-D bacteria trackingduring longitudinal studies. The versatility of this techniquein visualizing multiple tissue types means it has utility spanningfrom neurology to pathogenesis and wound healing.49
3.5 aIDT Reconstruction Accuracy and SensitivityAnalysis
Having shown aIDT’s utility for label-free dynamic biologicalsample imaging, we further evaluate the modality’s accuracyand sensitivity. While the experimentally recovered volumesexhibit RI ranges matching expected biological values, the in-herent variability of these specimens prevents quantitativeanalysis of the system’s accuracy and sensitivity for recoveringthe true RI distribution and detecting small RI variations, re-spectively. These parameters were briefly explored for conven-tional IDT,30 but the lack of manufactured, well-characterizedobjects limited the accuracy and sensitivity analysis to thin glassstructures with high-contrast RI distributions. These structuresare not representative of most biological samples’ RI range orsize, and their high-contrast nature generates multiple-scatteringbehavior that invalidates the IDT model. Recent works50,51 showsuch experimental sensitivity analyses are possible in quantita-tive phase systems with rigorous testing using expensive hard-ware that was not readily available for the aIDT system. Thus,determining aIDT’s accuracy and sensitivity is a challengingtask. Here, we instead evaluate aIDT in simulation to determineits theoretical accuracy and sensitivity over the RI range presentin our experimental data.
Our simulations were performed in MATLAB with three pri-mary components: (1) a ground-truth (GT) object, (2) a rigorous
forward model simulating the field through the object, and (3) ouraIDT inversion algorithm. For the object, we generated 3 × 3 cu-boid arrays inside a volume of 21 μm × 21μm × 30 μm, withvariable RI [Fig. 6(a)]. Each cuboid occupied a 0.97μm×0.97μm × 1.2 μm volume and was spatially separated by 3.25and 2.4 μm in lateral and axial dimensions, respectively. Thisseparation recovers a single cuboid for each reconstructed aIDTslice over the same volume considered in our experiment. Forthe cuboid RI, we assumed a homogeneous imaging medium(nm ¼ 1) and generated arrays with RI range RI ¼½1.0033; 1.0567� following the equation RI ¼ nbase þ δn, wherenbase ¼ ½1.01;1.02;1.03;1.04;1.05� and δn¼ ½−0:0067;0.0067�.This large RI range allowed us to evaluate aIDT’s accuracy overthe contrast range observed in our experiments (ΔRI ≤ 0.05)and test aIDT’s sensitivity to small RI variations at eachnbase level. Here, the selected range of δn values correspondedto object phase variations between 1 and 100 mrad followingϕ ¼ 2πλ−1ΔnΔh. These parameters allowed the evaluation ofboth aIDT’s accuracy and its sensitivity to small RI changesacross a large contrast range.
With these objects, we simulated aIDT intensity imagesusing the convergent Born series model.52 This forward modelefficiently simulates multiple-scattering through large objectvolumes using a convergent Born series expansion, making itideal for evaluating aIDT’s recovery capabilities. Using theillumination angles from our 8-LED illumination aIDT case,we simulated the scattered field through the cuboid array andpropagated the final field through a 0.65 NA, 40× objective lensto obtain our intensity image stack. We repeated this simulationprocess for each cuboid array with differing RI and reconstructedthe object volume using our aIDT algorithm. Furthermore, weadded white Gaussian noise to the intensity images generatingan SNR ranging from 0 to 15 and generated 100 realizations foreach SNR level. The SNR is quantified by the ratio between thesignal contrast and noise level as SNR ¼ σSignal∕σNoise, whereσ denotes the standard deviation. To determine the reconstruc-tion accuracy, we compared the median recovered RI over eachcuboid area [Fig. 6(b), white square] with the GT object filteredto match the reconstruction bandwidth. For the reconstructionsensitivity, we evaluated the separation between the small RIvariations δn from the central RI value nbase. We usedAshman’s D test53 for separating bimodal distributions to deter-mine the minimum RI variation detectable for each SNR condi-tion and considered two RI values to be separable when D > 2.
The simulation results for accuracy and sensitivity are sum-marized in Figs. 6(c) and 6(d), respectively. Under SNR match-ing our experimental condition, Fig. 6(c) shows the average RImismatch between our reconstruction and the GT across RI(left) and axial position (right) over the 100 realizations simu-lated for this SNR condition. The error bars show the standarddeviation in this mismatch over these realizations. We obtainnearly equivalent RI recovery under low contrast (Δn ¼ 0.01to 0.03) and large underestimations for high-contrast objectsat Δn ¼ 0.05. Underestimations for large RI contrast objectswere expected due to the presence of multiple-scattering invali-dating the assumption of weak scattering in the aIDT model. Anoffset still exists between aIDT and the GT object for weaklyscattering objects, which indicates the approximations we makein the aIDT model do reduce our system’s accuracy. Across dif-ferent axial positions, we observe mostly constant ε with greateroffsets occurring for high-contrast features. Across all RI cases,we observe a periodic loss in accuracy over the tested axial
Li et al.: High-speed in vitro intensity diffraction tomography
Advanced Photonics 066004-9 Nov∕Dec 2019 • Vol. 1(6)Downloaded From: https://www.spiedigitallibrary.org/journals/Advanced-Photonics on 10 Nov 2021Terms of Use: https://www.spiedigitallibrary.org/terms-of-use

Fig. 6 Simulation for quantifying aIDT accuracy and sensitivity. (a) Top: The object consistsof a cuboid array occupying a 21 μm × 21 μm × 30 μm volume. Bottom: An example aIDTreconstruction. (b) Top: Simulated intensity images with decreasing SNR. Bottom: aIDT recon-structions at z ¼ 7.3 μm. The white box indicates the region over which the cuboid’s RI is obtainedfor accuracy and sensitivity analysis. (c) Left: aIDT accuracy (ε) evaluations across the object RI.The plot shows the average difference between the aIDT reconstruction and true RI across 100realizations. Error bars show the standard deviation of this difference. Right: aIDT accuracy acrossthe simulated axial range. aIDT provides accurate RI recovery under low contrast (Δn ¼ 0.01 to0.03) objects and loses accuracy from highly scattering features (Δn ¼ 0.05). The accuracy isstable across the entire reconstruction volume but exhibits fluctuations due to boundary effectsin the computation. (d) aIDT-sensitivity (δn) analysis as a function of (left) SNR and (right) axialposition under the experimental SNR. aIDT’s sensitivity to small RI changes varies with the object’sRI contrast but maintains to be better than δn ¼ 0.002 even at high RI contrast for SNR ¼ 3. Thesensitivity is constant along z for low-contrast objects but fluctuates with increasing RI contrast.
Li et al.: High-speed in vitro intensity diffraction tomography
Advanced Photonics 066004-10 Nov∕Dec 2019 • Vol. 1(6)Downloaded From: https://www.spiedigitallibrary.org/journals/Advanced-Photonics on 10 Nov 2021Terms of Use: https://www.spiedigitallibrary.org/terms-of-use

range. This periodic loss corresponds to the cuboid appearingclose to the volume boundary, suggesting that boundary condi-tion issues exist in our simulation. Under weakly scatteringconditions, we observe that this axial-dependent behavior iswithin our model’s ε offset and is considered to be minimal.We will solve these boundary condition issues in future work.
Figure 6(d) shows aIDT’s theoretical sensitivity range overthe imaging volume and across multiple SNR conditions. AtSNR ¼ 3, we have a minimum sensitivity to δn ¼ 2 × 10⁻⁴for low-contrast objects and δn ¼ 2 × 10⁻³ for high-contrastfeatures. Across different axial positions, aIDT’s sensitivityshows mostly static sensitivity with greater fluctuations forobjects with stronger contrast. These results indicate that aIDTexhibits high sensitivity to RI variations across the full recon-structed volume under low-contrast imaging conditions.
Our simulations show aIDT can provide high-accuracy andhigh-sensitivity RI recovery of volumetric biological samplesunder the proper conditions. Given weakly scattering sampleswithin our model’s validity range, aIDT can recover correct ac-curate RI values and detect small fluctuations to variations in theobject’s RI. This analysis is promising for biological sampleevaluation where these small RI variations could correspondto the presence of pathogens in cells.19 While this accuracyand sensitivity will suffer from experimental factors, includingobjective aberrations and illumination misalignments, our sim-ulations shown here indicate aIDT provides accurate, highlysensitive volumetric recoveries of biological samples.
4 DiscussionWe introduced aIDT, a high-speed, label-free, scanless intensity-only quantitative imaging tool for the 3-D evaluation of unla-beled weakly scattering specimens. By combining an LED ringillumination unit with a standard bright-field microscope, wecapture obliquely illuminated intensity images and perform3-D deconvolution to recover the slicewise 3-D RI distribution.The geometry fitting between illumination angle and the objec-tive NA optimally encodes both low- and high-spatial frequen-cies into each acquired image. This illumination scheme reducesthe system’s data requirement and allows us to image large3-D volumes of weakly scattering samples at high speeds. Wedemonstrated the success of aIDTon various biological samples,from fixed microalgae, cheek cells, to living C. elegans. Finally,we showed aIDT’s high theoretical accuracy and sensitivitylimits in simulation under a range of noisy imaging conditions.We believe this method will set an excellent foundation forother research projects and applications, and the aIDT has thepotential as a tool of great biological interest by showing its usein monitoring cell morphology and dynamics in noninvasivehigh-speed measurements.
Due to the full usage of objective NA, the achievable phaseimaging resolution can be extended to the incoherent diffractionlimit. And the proposed technique is mainly focused on high-speed in vitro biological sample imaging, so the boundary of RImapping resolution of this work is the tradeoff between theworking distance and NA of the objective. The quantificationof phase sensitivity is important for aIDT imaging system,and angle calibration quality, object RI, and the assumed slicethickness will affect the aIDT’s sensitivity. Experimentallyevaluating our system requires more complex imaging setupsand control samples with greater sensitivity analysis that we willpursue in future work.
Our IDT model is currently limited by the single scatteringapproximation that ignores information encoded in the multiplescattering. Recently, several groups have demonstrated multiplescattering models suitable for solving large-scale imaging prob-lems,39,54–56 which will be considered in our future work. Ourmodel-based reconstruction approach is also constrained byunknown experimental variabilities that are difficult to be fullyparameterized via an analytical model, which may be overcomeusing emerging learning-based inversion techniques.57–64 Weprovide example datasets and an open-source implementa-tion of aIDT at GitHub repository available at https://github.com/bu-cisl/IDT-using-Annular-Illumination. See also theSupplementary Material for supporting content.
Acknowledgments
We thank Dr. Christopher Gabel, Dr. Daniel Taub, and Dr.Gregory Wirak for providing biological samples. L.T. was sup-ported by the U.S. National Science Foundation (NSF)(1846784); J.L. was supported by China Scholarship Council(CSC, No. 201806840047); A.M. was supported by the U.S.National Science Foundation Graduate Research Fellowship(DGE-1840990). The authors declare no conflict of interest.
References
1. Y. Park, C. Depeursinge, and G. Popescu, “Quantitative phaseimaging in biomedicine,” Nat. Photonics 12(10), 578–589(2018).
2. F. Merola et al., “Tomographic flow cytometry by digital holog-raphy,” Light Sci. Appl. 6(4), e16241 (2017).
3. D. J. Stephens and V. J. Allan, “Light microscopy techniques forlive cell imaging,” Science 300(5616), 82–86 (2003).
4. G. Popescu, Quantitative Phase Imaging of Cells and Tissues,McGraw-Hill Professional, New York (2011).
5. B. Kemper and G. Von Bally, “Digital holographic microscopy forlive cell applications and technical inspection,” Appl. Opt. 47(4),A52–A61 (2008).
6. P. Ferraro et al., “Quantitative phase-contrast microscopy by a lat-eral shear approach to digital holographic image reconstruction,”Opt. Lett. 31(10), 1405–1407 (2006).
7. Z. Wang et al., “Spatial light interference microscopy (SLIM),”Opt. Express 19, 1016–1026 (2011).
8. Y. Baek et al., “Kramers–Kronig holographic imaging for high-space-bandwidth product,” Optica 6(1), 45–51 (2019).
9. L. Waller, L. Tian, and G. Barbastathis, “Transport of intensityphase-amplitude imaging with higher order intensity derivatives,”Opt. Express 18(12), 12552–12561 (2010).
10. J. A. Rodrigo and T. Alieva, “Rapid quantitative phase imaging forpartially coherent light microscopy,” Opt. Express 22, 13472–13483 (2014).
11. L. Tian and L. Waller, “Quantitative differential phase contrastimaging in an LED array microscope,” Opt. Express 23, 11394–11403 (2015).
12. C. Zuo et al., “High-resolution transport-of-intensity quantitativephase microscopy with annular illumination,” Sci. Rep. 7(1), 7654(2017).
13. J. Li et al., “Efficient quantitative phase microscopy using pro-grammable annular LED illumination,” Biomed. Opt. Express8(10), 4687–4705 (2017).
14. W. Choi et al., “Tomographic phase microscopy,” Nat. Methods4, 717–719 (2007).
15. Y. Cotte et al., “Marker-free phase nanoscopy,” Nat. Photonics7, 113–117 (2013).
16. T. H. Nguyen et al., “Gradient light interference microscopy for3D imaging of unlabeled specimens,” Nat. Commun. 8(1), 210(2017).
Li et al.: High-speed in vitro intensity diffraction tomography
Advanced Photonics 066004-11 Nov∕Dec 2019 • Vol. 1(6)Downloaded From: https://www.spiedigitallibrary.org/journals/Advanced-Photonics on 10 Nov 2021Terms of Use: https://www.spiedigitallibrary.org/terms-of-use

17. Y. Sung et al., “Optical diffraction tomography for high resolutionlive cell imaging,” Opt. Express 17(1), 266–277 (2009).
18. A. Kuś et al., “Tomographic phase microscopy of living three-dimensional cell cultures,” J. Biomed. Opt. 19(4), 046009 (2014).
19. R. Chandramohanadas et al., “Biophysics of malarial parasite exitfrom infected erythrocytes,” PLoS One 6(6), e20869 (2011).
20. J. Yoon et al., “Label-free characterization of white blood cells bymeasuring 3D refractive index maps,” Biomed. Opt. Express6(10), 3865–3875 (2015).
21. K. Lee et al., “Quantitative phase imaging techniques for the studyof cell pathophysiology: from principles to applications,” Sensors13(4), 4170–4191 (2013).
22. A. Yakimovich et al., “Label-free digital holo-tomographicmicroscopy reveals virus-induced cytopathic effects in live cells,”mSphere 3(6), e00599 (2018).
23. Y. Sung et al., “Stain-free quantification of chromosomes in livecells using regularized tomographic phase microscopy,” PLoS One7(11), e49502 (2012).
24. Y. Li et al., “Quantitative phase imaging reveals matrix stiffness-dependent growth and migration of cancer cells,” Sci. Rep. 9(1),248 (2019).
25. A. Zhikhoreva et al., “Morphological changes in the ovarian car-cinoma cells of wistar rats induced by chemotherapy with cisplatinand dioxadet,” Biomed. Opt. Express 9(11), 5817–5827 (2018).
26. S. O. Isikman et al., “Lens-free optical tomographic microscopewith a large imaging volume on a chip,” Proc. Natl. Acad. Sci. U.S. A. 108(18), 7296–7301 (2011).
27. D. Kim et al., “Label-free high-resolution 3-D imaging of goldnanoparticles inside live cells using optical diffraction tomogra-phy,” Methods 136, 160–167 (2018).
28. S. Shin et al., “Active illumination using a digital micromirror de-vice for quantitative phase imaging,”Opt. Lett. 40(22), 5407–5410(2015).
29. S. Shin et al., “Super-resolution three-dimensional fluorescenceand optical diffraction tomography of live cells using structuredillumination generated by a digital micromirror device,” Sci. Rep.8(1), 9183 (2018).
30. R. Ling et al., “High-throughput intensity diffraction tomographywith a computational microscope,” Biomed. Opt. Express 9(5),2130–2141 (2018).
31. J. M. Soto, J. A. Rodrigo, and T. Alieva, “Label-free quantitative3D tomographic imaging for partially coherent light microscopy,”Opt. Express 25(14), 15699–15712 (2017).
32. J. A. Rodrigo, J. M. Soto, and T. Alieva, “Fast label-free micros-copy technique for 3D dynamic quantitative imaging of livingcells,” Biomed. Opt. Express 8(12), 5507–5517 (2017).
33. J. Li et al., “Three-dimensional tomographic microscopy tech-nique with multi-frequency combination with partially coherentilluminations,” Biomed. Opt. Express 9(6), 2526–2542 (2018).
34. M. H. Jenkins and T. K. Gaylord, “Three-dimensional quantitativephase imaging via tomographic deconvolution phase microscopy,”Appl. Opt. 54(31), 9213–9227 (2015).
35. M. Chen, L. Tian, and L. Waller, “3D differential phase contrastmicroscopy,” Biomed. Opt. Express 7, 3940–3950 (2016).
36. R. Eckert, Z. F. Phillips, and L. Waller, “Efficient illuminationangle self-calibration in Fourier ptychography,” Appl. Opt. 57(19),5434–5442 (2018).
37. G. Zheng, R. Horstmeyer, and C. Yang, “Wide-field, high-resolution Fourier ptychographic microscopy,” Nat. Photonics7(9), 739–745 (2013).
38. L. Tian et al., “Computational illumination for high-speed in vitroFourier ptychographic microscopy,” Optica 2(10), 904–911 (2015).
39. L. Tian and L. Waller, “3D intensity and phase imaging fromlight-field measurements in an LED array microscope,” Optica2(2), 104–111 (2015).
40. L. Tian, J. Wang, and L. Waller, “3D differential phase-contrastmicroscopy with computational illumination using an LED array,”Opt. Lett. 39, 1326–1329 (2014).
41. L. Tian et al., “Multiplexed coded illumination for Fourier pty-chography with an LED array microscope,” Biomed. Opt. Express5(7), 2376–2389 (2014).
42. S. Mehta and C. Sheppard, “Quantitative phase-gradient imagingat high resolution with asymmetric illumination-based differentialphase contrast,” Opt. Lett. 34(13), 1924–1926 (2009).
43. J. Schindelin et al., “Fiji: an open-source platform for biological-image analysis,” Nat. Methods 9, 676–682 (2012).
44. J. Lobo et al., “An insight into morphometric descriptors ofcell shape that pertain to regenerative medicine,” J. Tissue Eng.Regener. Med. 10(7), 539–553 (2016).
45. T. A. Zangle and M. A. Teitell, “Live-cell mass profiling: anemerging approach in quantitative biophysics,” Nat. Methods11(12), 1221–1228 (2014).
46. Z. Sadrearhami et al., “Antibiofilm nitric oxide-releasing polydop-amine coatings,” ACS Appl. Mater. Interfaces 11(7), 7320–7329(2019).
47. T. Stiernagle, “Maintenance of C. elegans,” WormBook, Ed., TheC. elegans Research Community (2006).
48. E. Kim et al., “Long-term imaging of Caenorhabditis elegans us-ing nanoparticle-mediated immobilization,” PLoS One 8(1),e53419 (2013).
49. A. K. Corsi, B. Wightman, and M. Chalfie, “A transparent windowinto biology: a primer on Caenorhabditis elegans,” Genetics200(2), 387–407 (2015).
50. P. Hosseini et al., “Pushing phase and amplitude sensitivity limitsin interferometric microscopy,” Opt. Lett. 41(7), 1656–1659(2016).
51. T. Juffmann, A. de los Ríos Sommer, and S. Gigan, “Local opti-mization of wave-fronts for optimal sensitivity phase imaging(LowPhi),” Opt. Commun. 454, 124484 (2020).
52. G. Osnabrugge, S. Leedumrongwatthanakun, and I. M. Vellekoop,“A convergent born series for solving the inhomogeneousHelmholtz equation in arbitrarily large media,” J. Comput. Phys.322, 113–124 (2016).
53. K. M. Ashman, C. M. Bird, and S. E. Zepf, “Detecting bimodalityin astronomical datasets,” Astr. Jrnl. 108, 2348–2361 (1994).
54. U. S. Kamilov et al., “Learning approach to optical tomography,”Optica 2(6), 517–522 (2015).
55. S. Chowdhury et al., “High-resolution 3D refractive index micros-copy of multiple-scattering samples from intensity images,”Optica 6(9), 1211–1219 (2019).
56. J. Lim et al., “High-fidelity optical diffraction tomography ofmultiple scattering samples,” Light Sci. Appl. 8, 82 (2019).
57. T. Nguyen et al., “Deep learning approach for Fourier ptychogra-phy microscopy,” Opt. Express 26(20), 26470–26484 (2018).
58. Y. Xue et al., “Reliable deep-learning-based phase imaging withuncertainty quantification,” Optica 6(5), 618–629 (2019).
59. Y. Rivenson et al., “Phase recovery and holographic imagereconstruction using deep learning in neural networks,” LightSci. Appl. 7(2), 17141 (2018).
60. A. Sinha et al., “Lensless computational imaging through deeplearning,” Optica 4(9), 1117–1125 (2017).
61. Y. Li, Y. Xue, and L. Tian, “Deep speckle correlation: a deep learn-ing approach toward scalable imaging through scattering media,”Optica 5(10), 1181–1190 (2018).
62. S. Feng et al., “Fringe pattern analysis using deep learning,” Adv.Photonics 1(2), 025001 (2019).
63. M. Lyu et al., “Learning-based lensless imaging through opticallythick scattering media,” Adv. Photonics 1(3), 036002 (2019).
64. G. Barbastathis, A. Ozcan, and G. Situ, “On the use of deep learn-ing for computational imaging,” Optica 6(8), 921–943 (2019).
Jiaji Li is a fourth-year PhD student at the School of Electronic andOptical Engineering, Nanjing University of Science and Technology.He was a visiting PhD student at the Department of Electrical andComputer Engineering, Boston University, from 2018 to 2019. He is cur-rently a member of Professor Chao Zuo’s Smart Computational Imaging
Li et al.: High-speed in vitro intensity diffraction tomography
Advanced Photonics 066004-12 Nov∕Dec 2019 • Vol. 1(6)Downloaded From: https://www.spiedigitallibrary.org/journals/Advanced-Photonics on 10 Nov 2021Terms of Use: https://www.spiedigitallibrary.org/terms-of-use
Laboratory (SCILab). His research interests include phase imaging anddiffraction tomographic imaging. He is a member of SPIE and OSA.
Alex Matlock received his BS degree in biomedical engineering at theUniversity of California, Irvine (2014), and is pursuing his PhD in electricalengineering at Boston University. He is a member of Professor Lei Tian’sComputational Imaging Systems Lab, where he works on model- andlearning-based strategies for intensity diffraction tomography. He is amember of SPIE and OSA and an NSF graduate research fellow.
Yunzhe Li received her BS degree in opto-electronic information engi-neering at the Huazhong University of Science and Technology (2015),MS degree in electrical engineering at Columbia University, New YorkCity (2017), and is pursuing her PhD in electrical engineering at BostonUniversity. She is a member of Professor Lei Tian’s ComputationalImaging Systems Lab, where she works on learning methods for imagingthrough scattering media. She is a member of SPIE and OSA.
Qian Chen received his BS, MS, and PhD degrees from the School ofElectronic and Optical Engineering, Nanjing University of Science andTechnology. He is currently a professor and a vice principal of NanjingUniversity of Science and Technology. He has been selected asChangjiang Scholar Distinguished Professor. He has broad research in-terests around photoelectric imaging and information processing, and hasauthored more than 200 journal papers. His research team developsnovel technologies and systems for mid-/far-wavelength infrared thermalimaging, ultrahigh sensitivity low-light-level imaging, noninterferometricquantitative phase imaging, and high-speed 3-D sensing and imaging,
with particular applications in national defense, industry, and bio-medicine. He is a member of SPIE and OSA.
Chao Zuo received his BS and PhD degrees from Nanjing University ofScience and Technology (NJUST) in 2009 and 2014, respectively. Hewas a research assistant at Center for Optical and Laser Engineering,Nanyang Technological University from 2012 to 2013. He is now a pro-fessor at the Department of Electronic and Optical Engineering and theprincipal investigator of the Smart Computational Imaging Laboratory(www.scilaboratory.com), NJUST. He has broad research interestsaround computational imaging and high-speed 3-D sensing, and hasauthored over 100 peer-reviewed journal publications. He has been se-lected into the Natural Science Foundation of China (NSFC) for ExcellentYoung Scholars and the Outstanding Youth Foundation of JiangsuProvince, China. He is a member of SPIE, OSA, and IEEE.
Lei Tian is an assistant professor in the Electrical and ComputerEngineering Department at Boston University. He received his PhD(2013) and MS degrees (2010) from MIT. He was a postdoctoral asso-ciate in the EECS department at University of California, Berkeley, from2013 to 2016. His research focuses on computational microscopy, neuro-photonics, imaging in complex media, and machine learning for biomedi-cal microscopy. His awards include the NSF CAREER award, the 2018Boston University Dean’s Catalyst Award, the 2018 SPIE Fumio OkanoBest 3D Paper Prize, the 2014 OSA Imaging Systems and ApplicationsBest Paper Award, and the 2011 OSA Emil Wolf Outstanding StudentPaper Prize.
Li et al.: High-speed in vitro intensity diffraction tomography
Advanced Photonics 066004-13 Nov∕Dec 2019 • Vol. 1(6)Downloaded From: https://www.spiedigitallibrary.org/journals/Advanced-Photonics on 10 Nov 2021Terms of Use: https://www.spiedigitallibrary.org/terms-of-use