high speed images of edge plasmas in nstx iea workshop edge transport in fusion plasmas september...
TRANSCRIPT
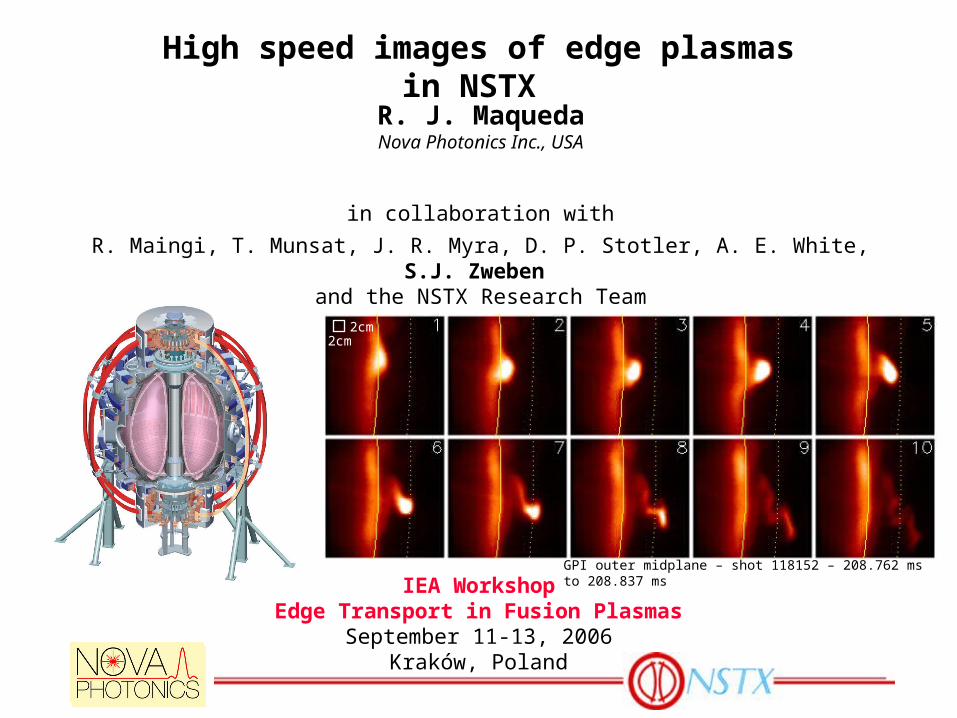
High speed images of edge plasmas in NSTX
IEA WorkshopEdge Transport in Fusion Plasmas
September 11-13, 2006Kraków, Poland
GPI outer midplane – shot 118152 – 208.762 ms to 208.837 ms
2cm2cm
R. J. MaquedaNova Photonics Inc., USA
in collaboration with
R. Maingi, T. Munsat, J. R. Myra, D. P. Stotler, A. E. White, S.J. Zweben and the NSTX Research Team
2
Outline
• Introduction: National Spherical Torus Experiment (NSTX) and diagnostics
• Edge turbulence: Gas Puff Imaging (GPI) images
• Edge Localized Modes (ELMs)
• Summary
3
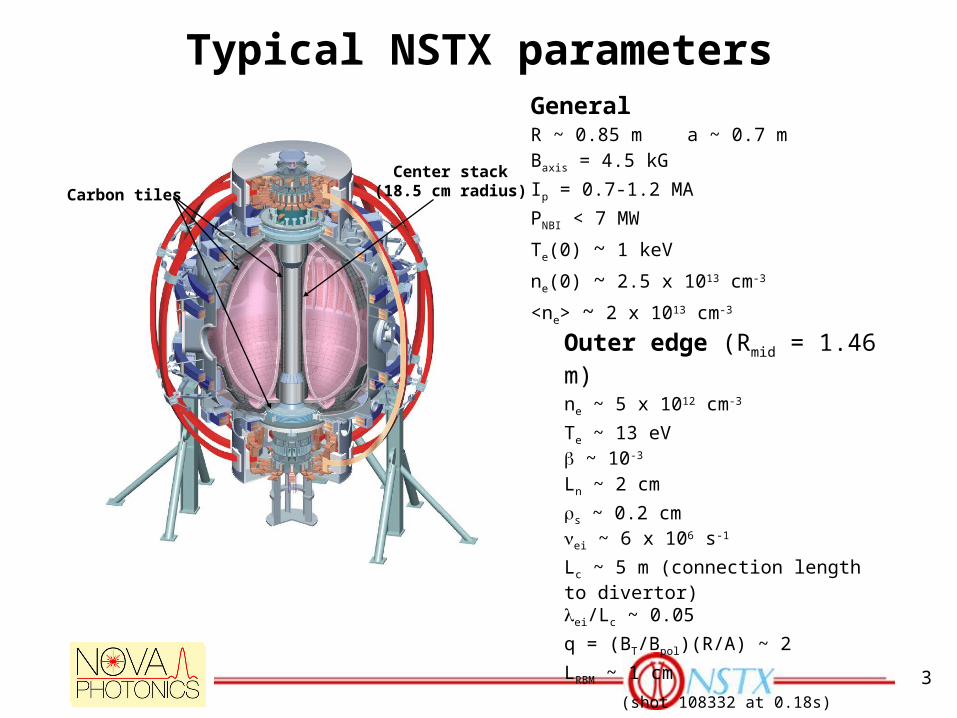
Typical NSTX parametersGeneralR ~ 0.85 m a ~ 0.7 mBaxis = 4.5 kG
Ip = 0.7-1.2 MA
PNBI < 7 MW
Te(0) ~ 1 keV
ne(0) ~ 2.5 x 1013 cm-3
<ne> ~ 2 x 1013 cm-3
Outer edge (Rmid = 1.46 m)ne ~ 5 x 1012 cm-3
Te ~ 13 eV ~ 10-3
Ln ~ 2 cm
s ~ 0.2 cmei ~ 6 x 10⁶ s-1
Lc ~ 5 m (connection length to divertor)ei/Lc ~ 0.05
q = (BT/Bpol)(R/A) ~ 2
LRBM ~ 1 cm
(shot 108332 at 0.18s)
Center stack(18.5 cm radius)Carbon tiles
4
Time (ms)
Co
ntr
as
t e
nh
an
ce
d-5
0 t
o 2
00
sc
ale
Div
ert
or
D (
a.u
.)
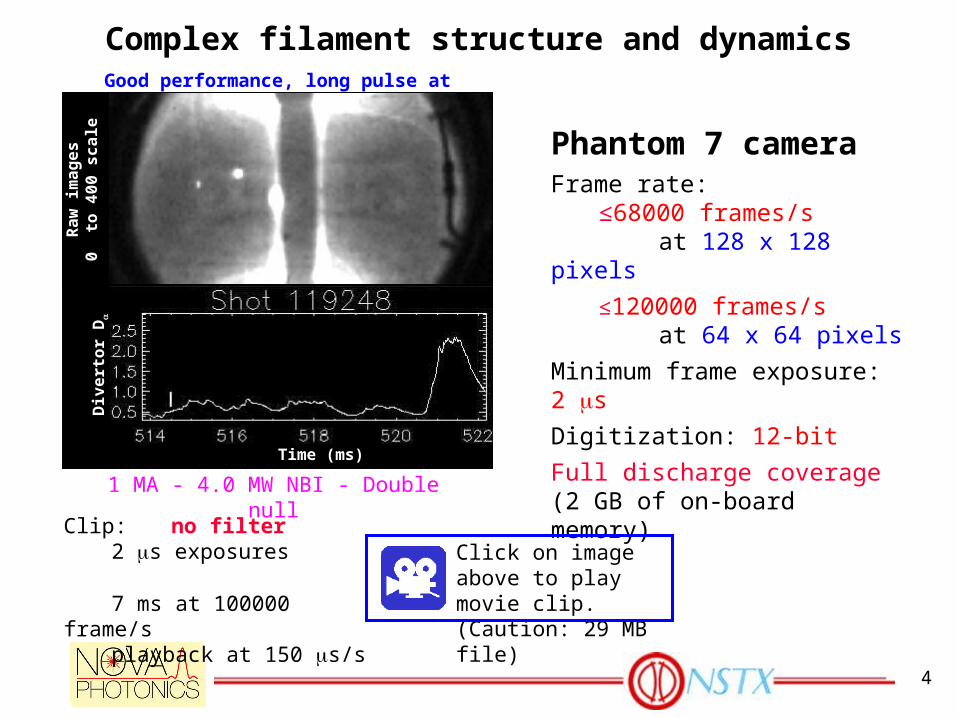
Phantom 7 cameraFrame rate:
≤68000 frames/sat 128 x 128 pixels
≤120000 frames/sat 64 x 64 pixels
Minimum frame exposure: 2 s
Digitization: 12-bit
Full discharge coverage (2 GB of on-board memory)
Complex filament structure and dynamicsGood performance, long pulse at 1 MA
Clip: no filter2 s exposures
7 ms at 100000 frame/splayback at 150 s/s
Ra
w i
ma
ge
s0
to
40
0 s
ca
le
1 MA - 4.0 MW NBI - Double null
Click on image above to play movie clip. (Caution: 29 MB file)
5
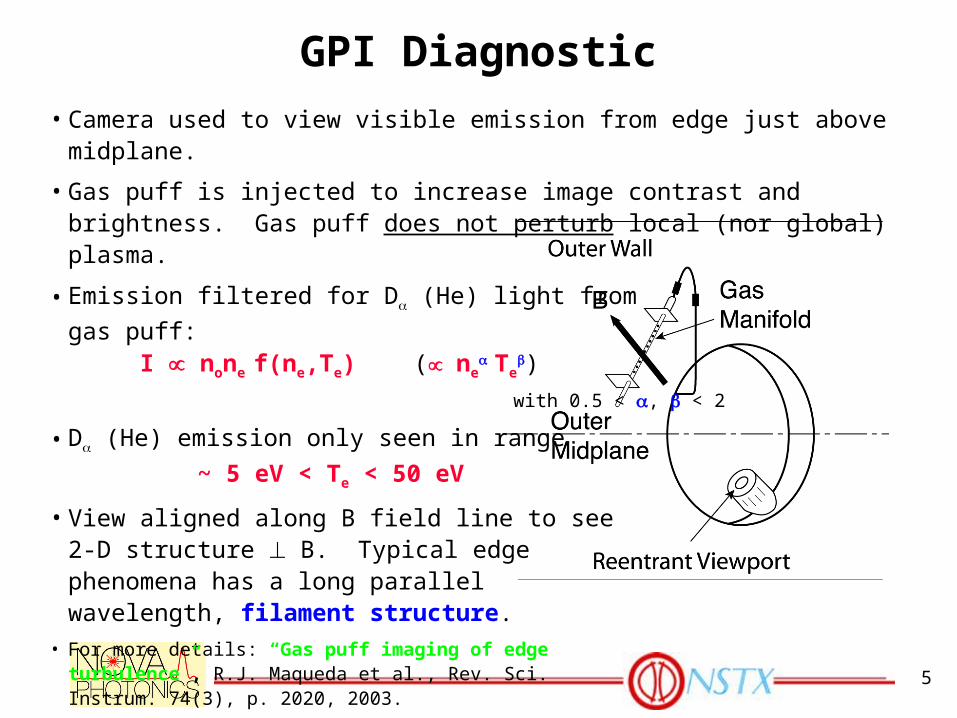
GPI Diagnostic
• Camera used to view visible emission from edge just above midplane.
• Gas puff is injected to increase image contrast and brightness. Gas puff does not perturb local (nor global) plasma.
• Emission filtered for D (He) light from
gas puff: I none f(ne,Te) ( ne
Te)
with 0.5 < , < 2
• D (He) emission only seen in range
~ 5 eV < Te < 50 eV
• View aligned along B field line to see 2-D structure B. Typical edge phenomena has a long parallel wavelength, filament structure.
• For more details: “Gas puff imaging of edge turbulence”, R.J. Maqueda et al., Rev. Sci. Instrum. 74(3), p. 2020, 2003.

6
GPI: L-H Transition
Transition takes place at ~192.1 ms
L-mode
Separatrix
Antenna limiter
shadow
23 cm radial
23 cm poloidal
Spontaneous transition into quiescent H-
mode
“Blobs”
Ohmic H-mode
~8 s between frames
0.65 ms mosaicD2 puffD filter
7
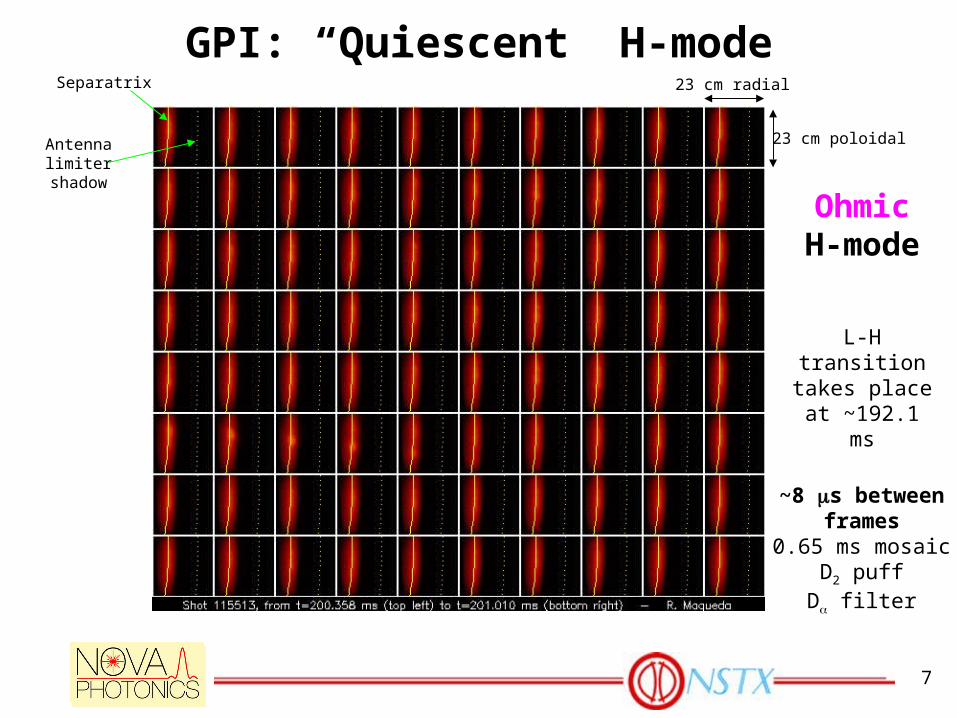
GPI: “Quiescent” H-modeSeparatrix
Antenna limiter
shadow
23 cm radial
23 cm poloidal
Ohmic H-mode
L-H transition takes place at
~192.1 ms
~8 s between frames
0.65 ms mosaicD2 puffD filter
8
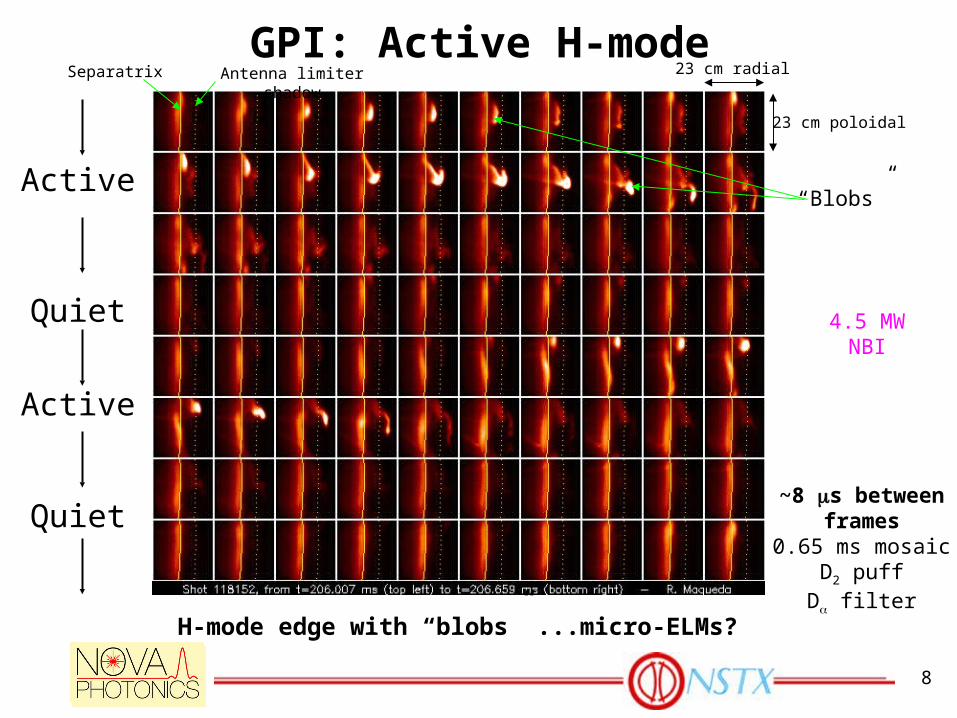
GPI: Active H-mode
H-mode edge with “blobs” ...micro-ELMs?
Separatrix Antenna limiter shadow 23 cm radial
23 cm poloidal
“Blobs”Active
Active
Quiet
Quiet
4.5 MW NBI
~8 s between frames
0.65 ms mosaicD2 puffD filter

9
Quiescent vs. active H-modes
Gas puff imaging
D2 puffsFOV: 23cm x 23 cm
Quiescent900 kAOhmic
Lower single null
Active1 MA
4.7 MW NBILower single null
po
loid
al
R
D2 puff
Clip: D filter3 s exposures
5 ms at 120000 frame/splayback at 125 s/s
Click on image above to play movie clip.(Caution: 23 MB file)
10
0
0.1
0.2
0.3
0.4
0.5
0.6
0.7
0.8
0.0 1.0 2.0 3.0 4.0 5.0
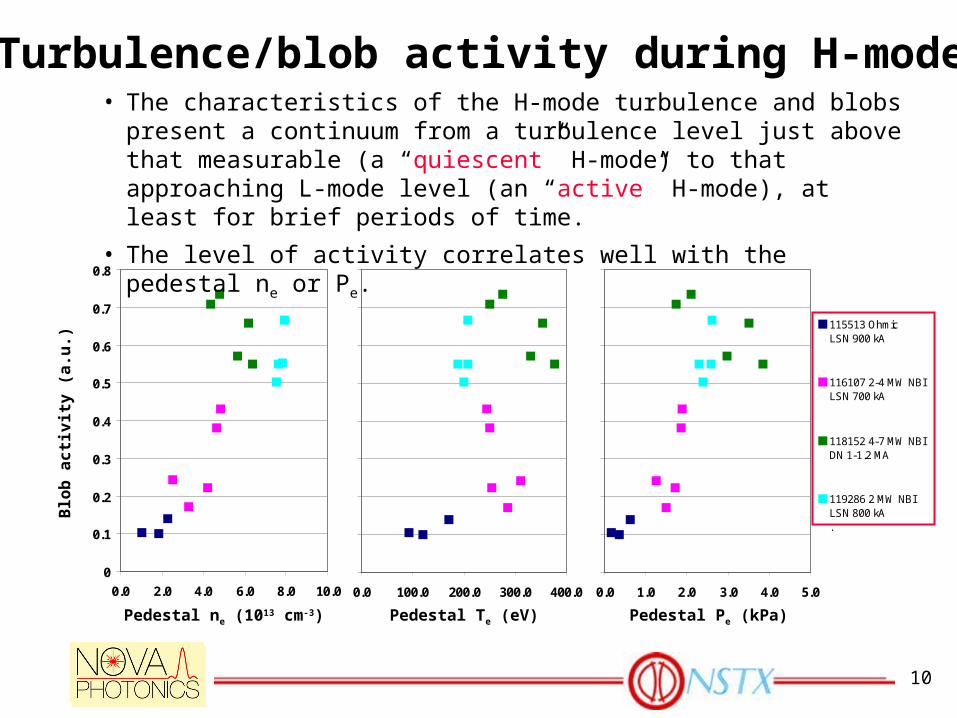
115513 Ohmic LSN 900 kA
116107 2-4 MW NBILSN 700 kA
118152 4-7 MW NBIDN 1-1.2 MA
119286 2 MW NBILSN 800 kA .
0
0.1
0.2
0.3
0.4
0.5
0.6
0.7
0.8
0.0 100.0 200.0 300.0 400.0
0
0.1
0.2
0.3
0.4
0.5
0.6
0.7
0.8
0.0 2.0 4.0 6.0 8.0 10.0
Turbulence/blob activity during H-mode• The characteristics of the H-mode turbulence and blobs present a
continuum from a turbulence level just above that measurable (a “quiescent” H-mode) to that approaching L-mode level (an “active” H-mode), at least for brief periods of time.
• The level of activity correlates well with the pedestal ne or Pe.
Blo
b a
cti
vit
y (
a.u
.)
Pedestal ne (1013 cm-3) Pedestal Te (eV) Pedestal Pe (kPa)
11
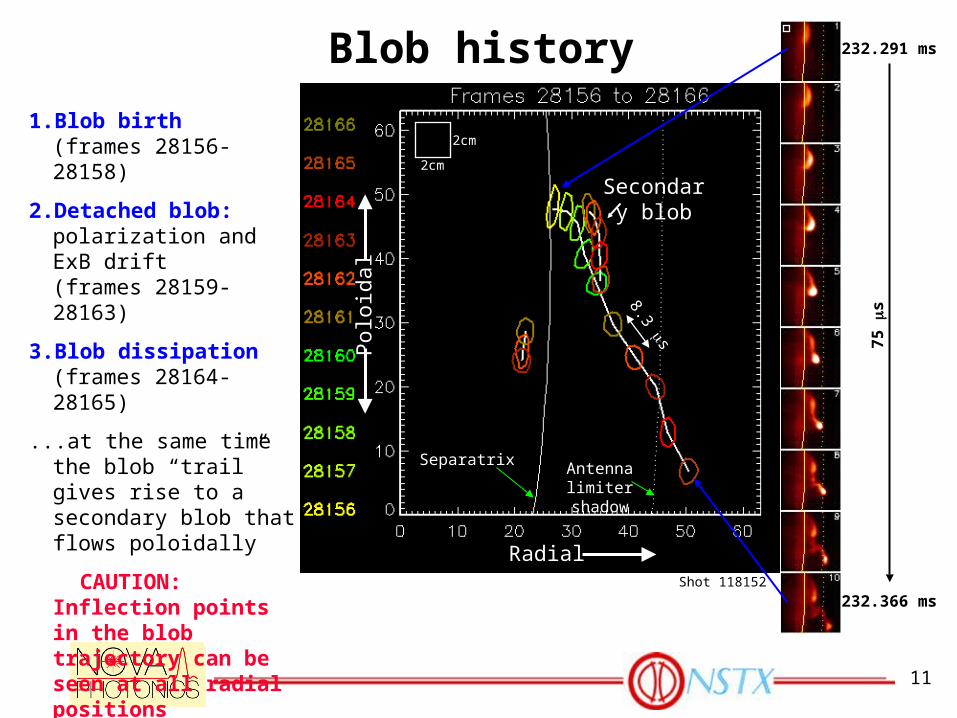
232.291 ms
232.366 msShot 118152
Radial
Pol
oida
l
75
s
Blob history
1. Blob birth (frames 28156-28158)
2. Detached blob: polarization and ExB drift (frames 28159-28163)
3. Blob dissipation (frames 28164-28165)
...at the same time the blob “trail” gives rise to a secondary blob that flows poloidally
CAUTION: Inflection points in the blob trajectory can be seen at all radial positions
Secondary blob
2cm
2cm
SeparatrixAntenna limiter
shadow
8.3 s

12
SOL flows
2cm2cm
208.853 ms
Separatrix
Antenna limiter shadow
SOL flows (“wind”) visible
Shot 118152
208.738 ms
Blob “shread” upward
2cm2cm
309.898 ms
310.014 msShot 116107
~8 s between frames
D2 puff/D filter
13
Ra
w i
ma
ge
s0
to
30
0 s
ca
leC
on
tra
st
en
ha
nc
ed
-50
to
20
0 s
ca
leD
ive
rto
r D
(
a.u
.)
Time (ms)
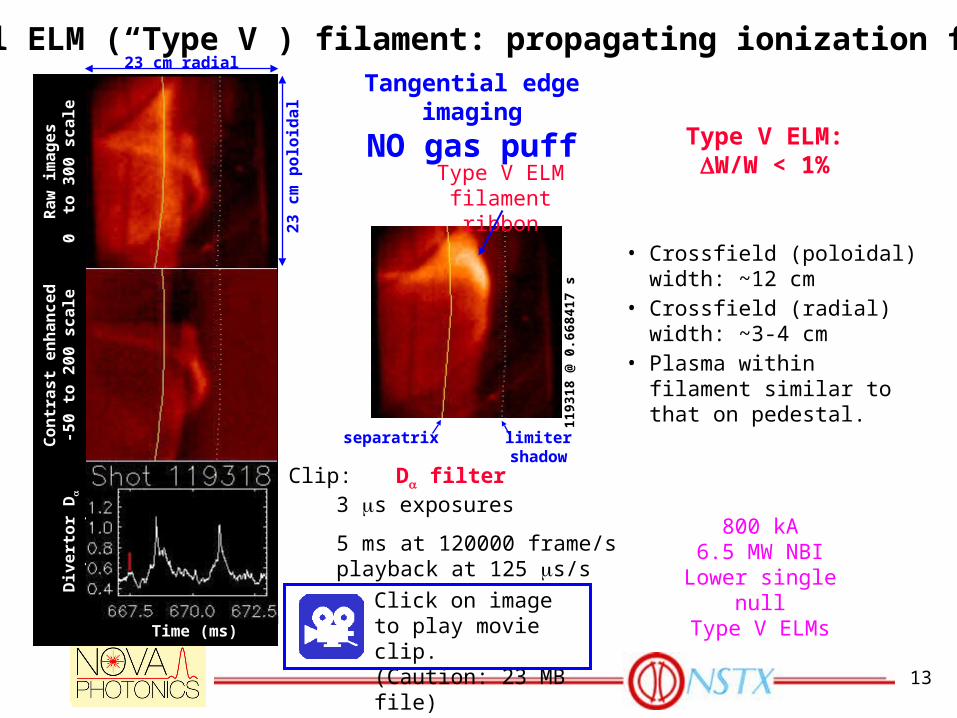
Small ELM (“Type V”) filament: propagating ionization front
800 kA6.5 MW NBI
Lower single nullType V ELMs
23
cm
po
loid
al
23 cm radial
Clip: D filter3 s exposures
5 ms at 120000 frame/splayback at 125 s/s
1193
18 @
0.6
6841
7 s
separatrix limitershadow
Type V ELM filament ribbon
Tangential edge imaging
NO gas puff
• Crossfield (poloidal) width: ~12 cm
• Crossfield (radial) width: ~3-4 cm
• Plasma within filament similar to that on pedestal.
Type V ELM: W/W < 1%
Click on image to play movie clip.(Caution: 23 MB file)

14
Filament coincident in time with divertor signature
Time (ms)312.0 312.5 313.0 313.5
1136
65
InterferometerK.C. Lee (UC-Davis)
Mirnov arrayJ. Menard (PPPL)
E. Fredrickson (PPPL)
123
7
USXR arrays
Filament also carries current
~400 A
Ip Lin
e av
erag
e d
ensi
ty (
1019
m-3)
USXR
Divertor light
I US
XR (
a.u
.)I v
is (
a.u
.)T
oro
idal
an
gle
(d
eg.)
300
200
100
0
Chord #1
Chord #2
Chord #3
Chord #7
Midplane chord
BII
0
100
200
300
NSTX plan view (midplane)
K. Tritz (JHU)
R. Maingi (ORNL)
15
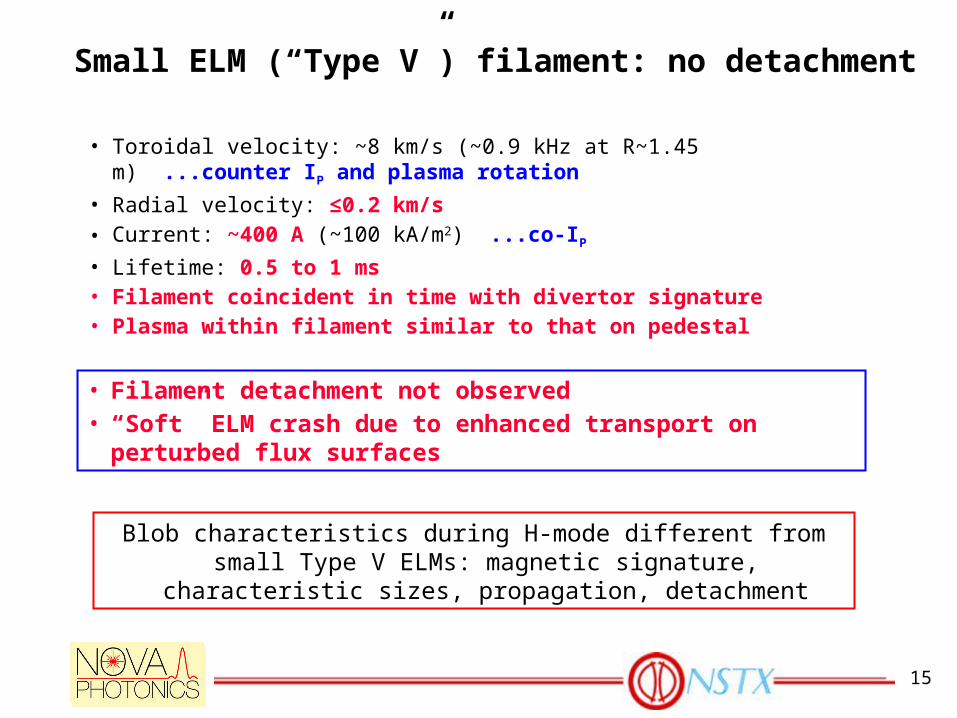
Small ELM (“Type V”) filament: no detachment
• Toroidal velocity: ~8 km/s (~0.9 kHz at R~1.45 m) ...counter IP and plasma rotation
• Radial velocity: ≤0.2 km/s
• Current: ~400 A (~100 kA/m2) ...co-IP
• Lifetime: 0.5 to 1 ms• Filament coincident in time with divertor signature• Plasma within filament similar to that on pedestal
• Filament detachment not observed• “Soft” ELM crash due to enhanced transport on perturbed flux
surfaces
Blob characteristics during H-mode different from small Type V ELMs: magnetic signature, characteristic sizes, propagation, detachment

16
After large ELMs edge similar to L-mode edge
Gas puff imaging
Field of view23 cm x 23 cm
L-mode800 kA
2 MW NBILower single null
H-mode1 MA
4.7 MW NBILower single null
Clip: D filter3 s exposures
5 ms at 120000 frame/splayback at 125 s/s
po
loid
alR
D2 puff
ELM at ~221.1 ms
Click on image above to play movie clip.(Caution: 23 MB file)
17
Summary• Edge of toroidally confined plasma (like NSTX) show a
complex filament structure and dynamics: blobs and ELMs.
• Fast-frame imaging is a very useful tool to study these phenomena. Gas Puff Imaging (GPI) enhances the usefulness of fast imaging for edge turbulence studies.
• While “blob” (and turbulent) activity is much reduced in H-mode compared to L-mode, H-modes present a continuum from “quiescent” to “active” edges.
• H-mode blob activity increases with edge pedestal density (and pressure).
• Long-lived “Type V” ELM filaments have very different characteristics and dynamics than blob filaments. Type V ELM crash associated with enhanced transport during filament lifetime.
• Large ELMs revert edge turbulence characteristics to L-mode like.

18
Blob, GPI and ELM structure related NSTX papers...and references within
• “High-speed imaging of edge turbulence in NSTX”, S. J. Zweben et al., Nucl. Fusion 44 (2004) 134.
• “Three-dimensional neutral transport simulations of gas puff imaging experiments”, D. P. Stotler et al., Contrib. Plasma Phys. 44, 294 (2004).
• “Structure and motion of edge turbulence in the National Spherical Torus Experiment and Alcator C-Mod”, S. J. Zweben et al., Phys. Plasmas 13, 056114 (2006).
• “Bispectral analysis of low- to high-confinement mode transitions in the National Spherical Torus Experiment”, A. E. White et al., Phys. Plasmas 13, 072301 (2006).
• “Characterization of small, Type V ELMs in the National Spherical Torus Experiment”, R. Maingi et al., accepted Phys. Plasmas (2006).
• “Blob birth and transport in the tokamak edge plasma: analysis of imaging data”, J. R. Myra et al., accepted Phys. Plasmas (2006).
• “Structure of MARFEs and ELMs in NSTX”, R. J. Maqueda et al., submitted J. Nucl. Mater. (2006).
• “Derivation of time depedent 2-D velocity field maps for plasma turbulence studies”, T. Munsat and S. J. Zweben, submitted Rev. Sci. Instrum. (2006).