high risk behavior - target zero · 38 high risk behavior: impairment involved over half — 756,...
TRANSCRIPT

High
Risk
Beh
avio
r
Driver behavior is a factor in a majority of fatal and serious injury collisions. It is clear that affecting driver decisions is a key part of improving traffic safety, whether it is by changing behaviors through education and enforcement, or minimizing their effects through engineering.
Some behaviors have been known for decades as being dangerous, such as speeding or driving under the influence of alcohol or while positive for drugs. Others are relatively newly recognized, such as distracted driving and drowsy driving. This chapter will evaluate which behaviors are likely to result in serious and fatal collisions, and how to address those behaviors and their effects to get to Target Zero.
38 High Risk Behavior: Impairment Involved
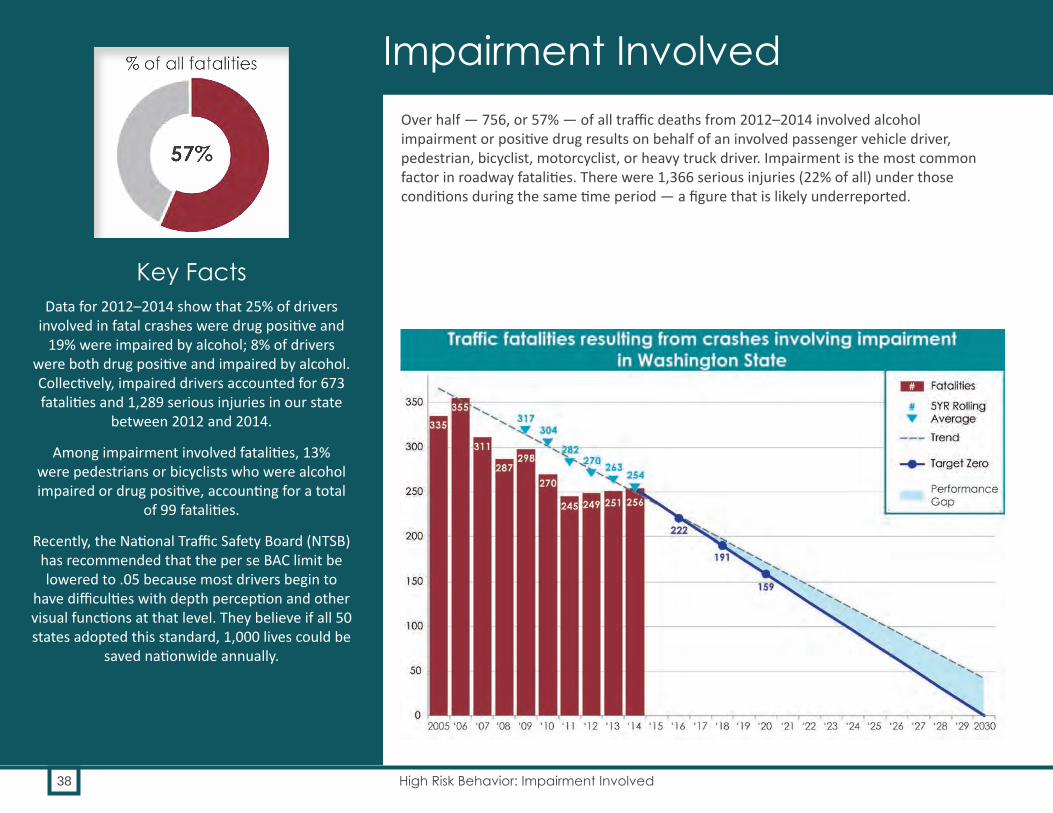
Over half — 756, or 57% — of all traffic deaths from 2012–2014 involved alcohol impairment or positive drug results on behalf of an involved passenger vehicle driver, pedestrian, bicyclist, motorcyclist, or heavy truck driver. Impairment is the most common factor in roadway fatalities. There were 1,366 serious injuries (22% of all) under those conditions during the same time period — a figure that is likely underreported.
Key FactsData for 2012–2014 show that 25% of drivers
involved in fatal crashes were drug positive and 19% were impaired by alcohol; 8% of drivers
were both drug positive and impaired by alcohol. Collectively, impaired drivers accounted for 673 fatalities and 1,289 serious injuries in our state
between 2012 and 2014.
Among impairment involved fatalities, 13% were pedestrians or bicyclists who were alcohol impaired or drug positive, accounting for a total
of 99 fatalities.
Recently, the National Traffic Safety Board (NTSB)has recommended that the per se BAC limit be lowered to .05 because most drivers begin to
have difficulties with depth perception and other visual functions at that level. They believe if all 50 states adopted this standard, 1,000 lives could be
saved nationwide annually.
Impairment Involved

39Washington State Strategic Highway Safety Plan 2016: Target Zero
OverviewWashington has been combating impairment in motor vehicles crashes for decades and has made significant progress. Despite this, impairment continues to be the main factor in fatal crashes in Washington. From 2012–2014, there were 756 fatalities involving impairment (57%), and 1,366 serious injuries involving impairment (22%). Fatalities involving impairment decreased seven percent, compared with 2009–2011. During this same time period, serious injuries involving impairment decreased by 15%. What’s New
Target Zero has expanded the definition of impairment from just impaired drivers: it now contains
impairment on behalf of all people involved in a crash, including pedestrians and bicyclists. Partners widened this definition to draw attention to impairment among non-drivers, and to help create policies and strategies
to help prevent those crashes.
Washington State voters approved Initiative 502, which legalized the growing, sale, and use of recreational
marijuana. There are currently over 200 retail stores for recreational marijuana in the state.
Partners created The Impaired Driving Work Group to consider recommendations for smarter and tougher
impaired driving laws for the Washington State Legislature. The Work Group was convened to discuss technical corrections to the DUI statute, in preparation
for the 2016 and 2017 legislative sessions.
The state created a 24/7 sobriety monitoring program to provide an alternative to incarceration for impaired
drivers. The program ensures that participants are monitored and tested for drug and alcohol use so they remain sober and are following court-directed activity.
continued on next page
Priority 1
Priority 2
Priority 3
Note: Alcohol impairment and drug-positivity is significantly underreport-ed as a factor in serious injury crashes in Washington State.

Target Zero impairment data now includes pedestrians and bicyclists
In this edition of Target Zero, we have expanded the definition of impairment to include impaired bicyclists and pedestrians. Among impairment-involved fatalities from 2012–2014, 13% (99) were impaired pedestrian or bicyclist fatalities.
Impairment among pedestrians and bicyclists is not a criminal offense. Further, the consequences of walking or bicycling while impaired should not be death or serious injury. The pedestrian and bicyclist chapters explore ways to address safety concerns for all pedestrians and bicyclists, including those who are impaired.
High Risk Behavior
40 High Risk Behavior: Impairment Involved
Data for 2012–2014 show that:
| 25% of drivers in fatal crashes were drug positive. | 19% were impaired by alcohol. | 8% of drivers were both impaired by alcohol and positive for drugs.
Drug positive driver-involved fatalities first became more frequent than alcohol impaired driver-involved fatalities in 2010. Among the impairment-involved fatalities in 2012–2014, 657 deaths were due to an impaired driver, while the remaining 99 deaths involved impaired pedestrians or bicyclists.
System-wide approach leads to decline in impaired drivingWashington’s system-wide approach to addressing impaired driving has led to:
| Comprehensive ignition interlock laws. | Better law enforcement and prosecutor training. | More DUI courts. | Innovative, targeted, full-time DUI enforcement.
Much of the decline over the past decades can be attributed to aggressive campaigns to change the public perception of the acceptability and consequences of drinking and driving. These have been coupled with tougher laws, from the 1968 voter-passed implied consent law to the 1999 law lowering the blood alcohol concentration (BAC) per se limit to .08. The state has imposed ignition interlock requirements on all DUI offenders, and applied tougher sanctions for repeat and high BAC offenders. This includes the 2007 felony DUI law that applies to those offenders with four prior DUI convictions within ten years. Strict penalties are also imposed for drivers under age 21 who drink and drive as part of the Zero Tolerance statute.
Despite these intensive efforts, impaired driving remains a challenging issue for both Washington State and for the nation.
Washington law has a .08 BAC level. This is the level at which drivers in Washington are guilty per se (no further proof needed) of the crime of DUI. However, this threshold might not be low enough.
What’s New, continuedLaw enforcement officers are now required
to arrest any person who is driving under the influence and has at least one prior impaired
driving offense in the previous ten years. Judges are then required to establish pre-trial release conditions that include one of the following:
• The installation of an ignition interlock device.
• Participation in the 24/7 sobriety monitoring program.
• The filing of a sworn statement with the court that they will not operate a motor vehicle without an ignition interlock device.

WTSC marijuana study shows the number of THC-positive drivers involved in fatal crashes increasedIn response to legalized marijuana in Washington State, the WTSC partnered with the WSP Toxicology Lab to review detailed toxicology results on drivers involved in fatal crashes. Although the FARS database collects information on drug results from toxicology testing, the existing code set does not distinguish between delta-9 THC (the psychoactive substance shown to cause driver impairment) and the inactive metabolite of marijuana that may be detected in the body for up to 30 days.
This detailed marijuana information was combined with the existing detailed FARS information to create a one-of-a-kind data set that is currently being used to analyze and monitor the impact of legalized marijuana in Washington State. Among the findings:
| The number of THC-positive drivers involved in fatal crashes increased. The frequency of drivers in fatal crashes that tested positive for THC, alone or in combination with alcohol or other drugs, was highest in 2014 (75 drivers) compared to the previous four-year average (36 drivers annually).
| The number of drivers in fatal crashes who were impaired by alcohol only (not drug-positive as well) decreased. The frequency of drivers with alcohol ≥ BAC .08 and no other drugs was lowest in 2014 (51 drivers) compared to the previous four-year average (98 drivers).
| The largest proportion of THC- or carboxy-THC-positive drivers in fatal crashes were young drivers. Among drivers in fatal crashes who tested positive for only THC or only carboxy-THC, the largest proportion are ages 16–25. This age group also had the highest proportion of drivers with alcohol ≥ BAC .08. Of drivers that tested positive for the combination of THC and alcohol ≥ BAC .08, 39.8% were ages 16–25.
| The most frequently reported driver error among drivers in fatal crashes with only THC was lane deviation (13%), followed by overcorrecting (8.9% ).
More than half of drivers with only alcohol ≥ BAC .08 involved in fatal crashes were speeding. Over 60% of drivers with alcohol ≥ BAC .08 as well as THC impairment were speeding.
High
Risk
Be
havi
or
41Washington State Strategic Highway Safety Plan 2016: Target Zero
A rigorous analysis by Peck et al (2009) found that drivers ages 21 and above with a BAC of .07 are 39% more likely to be involved in a traffic crash than drivers with a BAC of 0. Furthermore, drivers under the age of 21 (who are not legally allowed to drink at all) with a BAC of .07 are 400% more likely to crash than young drivers with a BAC of 0.
Recently, NTSB recommended the per se BAC limit be lowered to .05 because most drivers begin to have difficulties with depth perception and other visual functions at that level. All 50 states currently have a .08 per se limit; NTSB believes if all states adopted the .05 standard, it would save 1,000 lives nationwide annually.
The impacts of Initiative 1183 (privatized sales of hard liquor in Washington as of June, 2012) and Initiative 502 (legalized the sale and distribution of marijuana in Washington as of 2013) continue to bring new challenges. The number of stores with hard liquor licenses increased from 328 in 2010 to more than 1,400 in 2015. Marijuana is easily accessible with over 200 retail stores statewide and more licenses are being sold monthly. The state established a per se limit of 5 nanograms of active THC per milliliter of blood as the standard for impairment by marijuana. Currently, a blood draw is required to prove impairment by marijuana. Researchers are working on a breath or saliva test. Partners need to formulate new strategies and policies to address these changes.

High Risk Behavior
42 High Risk Behavior: Impairment Involved
Impairment is under-reported in serious injury crashesMore than 90% of people who die in fatal crashes, whether driver, occupant, or non-motorist, receive a toxicology screen for drugs and alcohol. Drivers suspected of vehicular homicide could have their blood drawn even if they weren’t suspected of being impaired. Also, deceased drivers may have their blood drawn by the medical examiner and submitted for testing. However, for serious injury crashes, law enforcements officers don’t always interpret events as rising to the level of vehicular assault, which allows for a blood draw. Therefore, blood testing to confirm impairment in serious injury cases is much lower. As a result, both alcohol impairment and testing positive for drugs are significantly underreported as a factor in serious injury crashes.
In 2013, the Legislature removed the implied consent warnings for blood in response to the Missouri v. McNeely US Supreme Court decision. The former implied consent law had stated that when you get a driver’s license in Washington, you were giving your consent to submit to a breath or blood test when requested to do so. If you refused to take the test (withdrew your consent), then your license was suspended for one year. Now, law enforcement’s primary method to determine drug concentrations is to collect a blood sample through the use of a search warrant, and drivers do not have the option to refuse as they did under the implied consent law. This change has contributed to an increased number of blood samples being submitted to the state toxicology laboratory for testing, from 5,468 in 2013 to 7,043 in 2015.
Percent of all fatal and serious injury crashes that involved impairment, by county (2012–2014)
Note: Alcohol impairment and drug positivity are significantly underreport-ed as a factor in serious injury crashes in Washington State.

High
Risk
Be
havi
or
43Washington State Strategic Highway Safety Plan 2016: Target Zero
Impaired drivingWashington State has focused on impaired driving for many years, and as a result there is a great deal of data on impairment. Target Zero partners have explored the data through many different lenses in order to better analyze the impairment problem. Here is a short list of impairment terms and their definitions as used in Target Zero:
Impaired driver involved (drugs, alcohol, or both)Fatalities: Any driver with a Blood Alcohol Concentration (BAC) of .08 or higher and/or a positive drug result, as confirmed by the state Toxicology Laboratory.
Serious injuries: Any driver or non-motorist in which the investigating officer or drug recognition expert (DRE) indicated that the person was impaired by drugs or alcohol and reported in contributing circumstances as “Under the Influence of Alcohol,” “Under the Influence of Drugs,” or “Had Taken Medication” or sobriety reported as “HBD – Ability Impaired” or “HBD – Ability Impaired (tox test).”
Impaired pedestrian/bicyclist involved (drugs, alcohol, or both)Fatalities: Any pedestrian or bicyclist with a BAC of .08 or higher and/or a positive drug result, as confirmed by the state Toxicology Laboratory.
Serious injuries: No data.
Drug impaired driver involved Fatalities: Any driver with a positive drug result, as confirmed by the state Toxicology Laboratory.
Serious injuries: NOT APPLICABLE. Due to no confirmation by toxicology, drug impairment involved serious injuries are not reported.
Alcohol impaired driver involvedFatalities: Any driver with a BAC of .08 or higher, as confirmed by the state Toxicology Laboratory.
Serious injuries: Any driver or non-motorist in which the investigating officer or DRE indicated that the person was impaired by alcohol and reported in contributing circumstances.
Drinking driver involvedFatalities: Any driver with a BAC of any value except 0, as confirmed by the state Toxicology Laboratory. This also includes alcohol impaired drivers (those with BAC at or above .08).
Serious injuries: Any driver who the investigating officer or DRE indicated had been drinking any alcohol, or with a BAC of any value except 0, as confirmed by the state Toxicology Laboratory. These are not mutually exclusive, and also include alcohol impaired drivers those with BAC at or above .08).
Driving under the influence (DUI) (legal definition) In Washington State, a person is guilty of driving while under the influence of intoxicating liquor, marijuana, or any drug if the person drives a vehicle within this state and:
| Has, within two hours after driving, an alcohol concentration of .08 or higher as shown by analysis of the person’s breath or blood made under RCW 46.61.506; or
| Has, within two hours after driving, a THC concentration of 5.00 or higher as shown by analysis of the person’s blood made under RCW 46.61.506; or
| Is under the influence of or affected by intoxicating liquor, marijuana, or any drug; or
| Is under the combined influence of or affected by intoxicating liquor, marijuana, and any drug.
Per se alcohol limitNo further proof is needed. When a person is found to have, within two hours after driving, an alcohol concentration of .08 or higher or a THC concentration of 5.00 nanograms per milliliter of blood or higher, that person is guilty “per se” of driving under the influence.
Impairment definitions

High Risk Behavior
44 High Risk Behavior: Impairment Involved
Related fatalities & serious injuries: overlap with other Target Zero factorsIMPAIRMENT INVOLVED
What percentage of IMPAIRMENT INVOLVED
crashes involved another factor?
FATALITIES SERIOUS INJURIES
Note: Alcohol impairment and drug positivity are significantly underreported as a factor in serious injury crashes in Washington State.
For example, 32% of IMPAIRMENT INVOLVED
fatal crashes also involved a young
driver.

Washington State laws relating to impaired driving
RCW 46.61.502 Driving under the influence
RCW 46.61.503 Driver under 21 years of age consuming alcohol or marijuana
RCW 46.61.504 Physical control of vehicle under the influence
RCW 46.25.110 Operating a commercial motor vehicle while having alcohol or THC in system
RCW 46.61.5055 Alcohol violators — Additional fee — Distribution
High
Risk
Be
havi
or
45Washington State Strategic Highway Safety Plan 2016: Target Zero
Contributing circumstances and factors
2012–2014: Impaired drivers | More than half (60%) of alcohol-impaired and/or drug-
positive drivers in fatal crashes, and 64% of those in serious injury crashes, were ages 16–39.
| Eighty-two percent of alcohol-impaired and/or drug-positive drivers in fatal crashes, and 78% in serious crashes, were male.
| More than half (52%) of impairment-involved fatalities occurred in rural areas. The other 48% occurred in urban areas.
| Six counties in Washington accounted for over 60% of impairment involved fatalities: King (20%), Pierce (11%), Snohomish (10%), Yakima (seven percent), Spokane (seven percent), and Clark (seven percent).
| Nearly half (52%) of fatalities occurred at nighttime (7 p.m. – 4:59 a.m.)
| Nearly half (48%) of fatalities occurred on Friday–Sunday. | The most impairment-involved fatalities occurred in May
(13%) and the fewest in January (7%). | Sixty-three percent (63%) of those killed died in single-
vehicle crashes. | Half of pedestrians and bicyclists impaired by alcohol or
positive for drugs were between the ages of 21 and 49. | Nearly three out of four impaired pedestrians and bicyclists
involved in a fatal crash were male.
Programs and successes
Integrated systems approach brings in many partners to address impaired driving Impaired driving is a societal issue that pushes us beyond traditional traffic safety partnerships. Washington Traffic Safety Commission (WTSC) chairs the Washington Impaired Driving Advisory Council (WIDAC). WIDAC consists of representatives from highway safety office, law enforcement, health, injury prevention, treatment/rehabilitation, ignition interlock programs, prosecution, judiciary, toxicology, data and traffic records, training, private business, advocacy, community task forces, probation, corrections, Tribal Nations, and the Washington State Liquor and Cannabis Board (LCB). WIDAC seeks to reduce impaired driving statewide through coordinated planning, training, programs, and evaluation.

High Risk Behavior
46 High Risk Behavior: Impairment Involved
These subject matter experts provide input about:
| Adjudication | Administrative sanctions | Driver licensing programs | Alcohol and other drug misuse | The criminal justice system (law and policies, DUI
enforcement, DUI training, and prosecutor training) | Impaired driving program management | Prevention | Program evaluation and data | Other topics as they emerge
With the passage of Initiative 1183, which privatized sales of hard liquor in Washington, and Initiative 502, which legalized the growing, distribution, and sale of marijuana in Washington, WIDAC has expanded its work to include studies of the impacts of these law changes, and to ensure that there are minimal effects on public safety.
The Target Zero Team (TZT) expandedBeginning in late 2009, the Target Zero Teams placed full-time Washington State Patrol (WSP) DUI squads in King, Pierce, and Snohomish Counties. Based on the success in these counties, the project expanded to Yakima and Spokane Counties in 2013. Local law enforcement officers joined the WSP teams on weekends and other common DUI times. These multi-jurisdictional squads focused their efforts on locations with the highest concentrations of DUI crashes. During the first 24 months of this project (July 1, 2010 – June 30, 2012) in King, Pierce, and Snohomish Counties:
| TZT members contacted more than 34,000 motorists and arrested 6,693 DUI offenders.
| TZT arrests for DUI and tickets for speeding and seatbelt violations have resulted in over $14 million in fines and fees.
Based on the Federal Highway Administration’s fatality cost estimate, which includes societal costs, this project showed a 115:1 return on investment for the project funds.
High visibility enforcement (HVE) programs for DUIWTSC funds quarterly statewide DUI patrols called “Drive Sober or Get Pulled Over.” Over 150 law enforcement state, local, and Tribal agencies participate in these campaigns. Partners fund media campaigns to inform the public of the increased enforcement. Information campaigns in advance, paired with high visibility enforcement (HVE) patrols, and follow-up reporting of the results, have proven an effective combination, as documented in Countermeasures that Work.
Impairment involved crash, fatality, and serious injury data for 2012–2014
From 2012–2014 in Washington State, there were:
| 756 people killed in impairment-related crashes | 1,366 people seriously injured in impairment-
related crashes | 1,045 impairment involved crashes with
ONLY serious injuries* | 562 impairment involved crashes with
ONLY fatalities* | 132 impairment involved crashes with
BOTH fatalities and serious injuries*
* These crashes may or may not also include minor injuries

High
Risk
Be
havi
or
47Washington State Strategic Highway Safety Plan 2016: Target Zero
Law Enforcement training in alcohol and drug detectionThe Drug Evaluation and Classification Program (DEC), established in February 1996, trains law enforcement officers to become Drug Recognition Experts (DREs). Officers complete a rigorous training course and certification process. This enables them to recognize the signs and symptoms of impairment related to seven different categories of drugs, using a 12-step standardized and systematic process. The WSP provides DRE training to both WSP troopers and local law enforcement officers. Since the program’s inception, the number of trained DREs in Washington has risen from 16 to over 196 in 2015, representing 66 law enforcement agencies.
Reducing excessive drinking About 50% of people arrested for DUI were drinking at a licensed establishment; further, data show that 70–89% of bars will serve alcohol to intoxicated persons, in violation of the law. The Liquor and Cannabis Board’s Enforcement and Education Division identifies establishments with the greatest number of reported DUIs and focuses resources on these establishments through a program called Locations of Strategic Interest.
Reducing underage drinkingParental influence is an important factor in helping keep children from drinking and drug use. WTSC partners with the Liquor and Cannabis Board and MADD to educate parents with the “Power of Parents” curriculum. This curriculum, developed by MADD and Pennsylvania State University, provides parents with guidance for talking with teens about the dangers of drinking before age 21, and is based on research proven to reduce underage drinking by up to 30%.

High Risk Behavior
48 High Risk Behavior: Impairment Involved
Strategies for reducing impaired driving (IMP) fatalities and serious injuriesObjective Strategies Implementation areas
IMP.1. Prevent excessive drinking, underage drinking, and impaired driving
IMP.1.1 Increase the state excise tax on beer. (R, NCHRP) Leadership/PolicyIMP.1.2 Continue mandatory alcohol server training and explore expanding responsible beverage
service policies for alcohol retailers. (U)Education, Leadership/Policy
IMP.1.3 Continue and expand use of brief intervention and screening. (P, CTW) Education, EMSIMP.1.4 Conduct well-publicized compliance checks of alcohol retailers to reduce sales to
underage persons. (R, CTW)Enforcement
IMP.1.5 Conduct well-publicized enforcement aimed at underage drinking parties. (R, CTW) Enforcement, EducationIMP.1.6 Support alternative transportation services such as transit (especially at night), designated
driver programs, and other alternative ride programs to help eliminate need for impaired individuals to drive. (U)
Leadership/Policy
IMP.2. Enforce and publicize DUI laws
IMP.2.1 Continue statewide high visibility enforcement (HVE) and media campaigns to reduce impaired driving. (P, CTW)
Enforcement, Education
IMP.2.2 Enforce and publicize zero tolerance laws for drivers under age 21. (R, CTW) Education, EnforcementIMP.2.3 Enhance law enforcement DUI training with Standard Field Sobriety Test (SFST) training
and refresher training. (P, NHTSA)Education
IMP.2.4 Enhance law enforcement DUI training with Advance Roadside Impaired Driving Enforcement (ARIDE) training. (P, NHTSA)
Education
IMP.2.5 Expand the Drug Recognition and Classification Program. (R, CTW) EducationIMP.2.6 Support efforts to simplify and streamline the DUI arrest process including developing
an electronic DUI arrest package, utilizing the mobile impaired driving unit for high visibility campaigns. (R, NHTSA)
Enforcement, Traffic Records
IMP.2.7 Expand full-time DUI squads that target areas with high numbers of DUI-related crashes. (R, DDACTS)
Enforcement
IMP.2.8 Encourage parents to talk with their children about the risks of alcohol and other drugs. (R, DBHR)
Education
IMP.2.9 Discourage expansion of access to alcohol, marijuana, and other drugs. (U) Leadership/PolicyP: Proven R: Recommended U: Unknown

High
Risk
Be
havi
or
49Washington State Strategic Highway Safety Plan 2016: Target Zero
Strategies for reducing impaired driving (IMP) fatalities and serious injuriesObjective Strategies Implementation areas
IMP.3. Prosecute, sanction, and treat DUI offenders
IMP.3.1 Expand use of ignition interlocks. (P, CTW) Leadership/PolicyIMP.3.2 Suspend driver license administratively upon arrest. (P, CTW) Leadership/PolicyIMP.3.3 Support the Traffic Safety Resource Prosecutor Program. (R, NHTSA) EducationIMP.3.4 Conduct alcohol/drug assessments on all DUI offenders and enhance treatment and
probation when warranted. (P, CTW)Leadership/Policy
IMP.3.5 Match treatment and rehabilitation to the diagnosis. (P, NIH) Leadership/PolicyIMP.3.6 Require stronger penalties for BAC test refusal than test failure. (R, CTW) Leadership/PolicyIMP.3.7 Encourage attendance at DUI Victim's Panels. (U) Leadership/PolicyIMP.3.8 Place limits on plea agreements. (R, CTW) Leadership/PolicyIMP.3.9 Establish 24/7 sobriety program. (R, CTW) Leadership/PolicyIMP.3.10 Provide prosecution of DUIs as part of the Target Zero Teams. (U) Education
IMP.4. Control high-BAC and repeat DUI offenders
IMP.4.1 Monitor DUI offenders closely. (P, CTW) Leadership/PolicyIMP.4.2 Require ignition interlock as a condition for license reinstatement. (P, NCHRP) Leadership/PolicyIMP.4.3 Incarcerate offenders who fail to comply with court-ordered alternative sanctions (P,
NCHRP)Leadership/Policy
IMP.4.4 Support and establish DUI Courts. (P, CTW) Leadership/PolicyIMP.5. Foster
leadership to facilitate impaired driving system improvements
IMP.5.1 Continue to build partnerships designed to reduce impaired driving. (P, NCHRP) Leadership/PolicyIMP.5.2 Encourage laws that will allow the state to utilize sobriety checkpoints. (P, CTW) Leadership/PolicyIMP.5.3 Implement the corridor safety model in high-crash locations where data suggests a high
rate of impaired driving. (P, NCHRP)Leadership/Policy
IMP.5.4 Encourage laws that use any money collected from DUI fines in excess of $101 to support impaired driving reduction efforts. (R, GHSA)
Leadership/Policy
IMP.5.5 Lower the per se BAC limit from .08 to .05 (P, META) Leadership/PolicyIMP.5.6 Establish and support the Judicial Outreach Liaison program. (R, NHTSA) Leadership/PolicyIMP.5.7 Monitor ignition interlock manufacturers and installers to ensure a continued viability and
validity of program. (P, CTW)Leadership/Policy
IMP.5.8 Monitor reports from ignition interlock manufacturers on alcohol failures on ignition interlocks and conduct compliance checks. (P, CTW)
Leadership/Policy
IMP.5.9 Investigate ignition interlock circumvention attempts. (P, CTW) Leadership/PolicyP: Proven R: Recommended U: Unknown

50 High Risk Behavior: Speeding Involved
From the tires and the steering wheel to the seatbelt and the airbag, cars are designed to move quickly while keeping occupants safe. However, drivers often travel above safe speeds, whether that is the posted speed limit, or the speed that is safe for current conditions. From 2012–2014, 508 people died and 1,622 people were seriously injured in speeding crashes in Washington State.
Ongoing education of the public about the dangers of speeding, high visibility patrols to enforce speed limits, and enhanced road and vehicle engineering have proven to be effective countermeasures.Key Facts
Since most traffic crash data is recorded by law enforcement officers, Target Zero partners
emphasize the importance of accurate and consistent crash investigations as well as active
and impactful enforcement.
High visibility enforcement (HVE) campaigns have been effective in changing driver
behavior. Patrols are most effective when conducted in areas identified as having a high number of speed-related crashes while being
supported with relevant, impactful media. WTSC, along with state and local agencies,
participates in collaborative HVEs throughout the year.
Speeding Involved

51Washington State Strategic Highway Safety Plan 2016: Target Zero
Overview Speeding involves drivers traveling either above the posted speed limit or too fast for conditions. Both types of speeding are represented in this data. In Washington, speeding is the third-most common factor contributing to fatal and serious injury crashes, after impairment and lane departure. Our laws require drivers to comply with a posted speed limit and to adjust their rate of speed based on the conditions.
Compared with 2009–2011, speeding-involved fatalities have declined 5% and serious injuries have decreased 24% in 2012–2014. Between 2012 and 2014, 508 (38%) fatal crashes involved excessive speed; for serious injury crashes, 1,622 (27%) involved speeding.
What’s NewCompared with 2009–2011, speeding-involved fatalities have declined 5% and serious injuries
have decreased 24%.
The WTSC has recently funded four community-level pilot projects aimed at
identifying high risk areas and implementing interventions that hold promise for reducing
speed-involved fatal and serious injury crashes. The selected sites for these projects include
Thurston County, Kitsap County, Auburn, and Wenatchee.
Priority 1
Priority 2
Priority 3

52 High Risk Behavior: Speeding Involved
The decline in fatal and serious injury crashes may be attributed to several factors including:
| Improved roadway design | Vehicle technology | Driver education | Targeted enforcement | High fuel prices
However, these factors can and do change, creating an environment requiring constant observation, analysis, and adaptation if we are to continue this downward trend.
Probably the most recognized strategy when it comes to speed reduction is enforcement. After that, roadway engineering, licensing, driver training, vehicle technology, culture, and many other factors play a role in reducing our speed-related crashes. In addition, it is important to gather the right type of data and interpret that data carefully. Since most crash data starts with officers, we must emphasize the importance of accurate and consistent crash investigation as well as active and impactful enforcement. Lastly, we must engage our communities in the problem-solving processes.
An IIHS study found that every five mph increase in the maximum posted speed limit resulted in a 4% increase in fatalities.
High Risk Behavior

53Washington State Strategic Highway Safety Plan 2016: Target Zero
Percent of all fatal and serious injury crashes involving speeding, by county (2012–2014)
Contributing circumstances and factorsWhile speeding may be the only contributing factor in some fatal and serious injury crashes, often it is combined with other Target Zero factors, such as impairment, lane departure, and younger drivers. Of all drivers aged 16–25 involved in fatal crashes, 43% (171 of 401 drivers) were speeding. One in five speeding drivers was aged 21–25, the age group with the highest rates of speeding.
Almost half of all speeding involved fatalities occurred Friday–Sunday (230 of 465). More than one-third (36%) occurred between the hours of 10 p.m. and 5 a.m. One-third of speeding related crashes occurred during just three months of the year: May (12%), August (12%), and September (10%).
Men are more likely to be speeding than women in fatal crashes. Among all male drivers involved in fatal crashes, nearly 30% were speeding (385 of 1,321) versus only 17% (81 of 468) of female drivers.
Risk increases as speeds riseThe risk of death and injury increases substantially as speed increases, because the amount of energy generated increases exponentially as a result. For example, crashing into a wall at 80 mph generates four times as much kinetic energy (the harmful force in a crash) as hitting the same wall at 40 mph. Vulnerable road users are especially at risk: research has shown that bicyclists and pedestrians who are hit by a vehicle traveling at 40 mph have an 85% chance of being killed; at 20 mph, the fatality rate is only 5%.
High
Risk
Be
havi
or

54 High Risk Behavior: Speeding Involved
High Risk Behavior
Related fatalities & serious injuries: overlap with other Target Zero factorsSPEEDING
What percentage of crashes involving SPEEDING involved
another factor?
FATALITIES SERIOUS INJURIES
For example, 42% of fatal crashes
involving SPEEDING also involved a young driver.

55Washington State Strategic Highway Safety Plan 2016: Target Zero
Tools to prevent deaths and injuries from speedingGlobal perspective, community engagement, roadway engineering, vehicle technology, accurate data, high visibility patrols, and targeted media continue to impact our speed-related fatal and serious injury crashes. As we look to the future, Target Zero partners will dig deeper into data analysis, increase collaborative efforts, and expand innovation by engaging our partners and the public we serve.
Programs and successes
High visibility enforcement (HVE) campaigns have been effective in changing driver behaviorWTSC, along with state and local agencies, participates in collaborative HVEs throughout the year. These HVE patrols target priorities such as impaired driving, occupant safety, distracted driving, and speeding. In order to support and direct HVEs, agencies scrutinize and collect data, primarily from the Police Traffic Collision Report (PTCR).
Traditionally, HVE campaigns such as “Slow Down or Pay Up” have been effective in changing driver behavior. Emphasis patrols are most effective when conducted in areas identified as having a high number of speed related crashes while being supported with relevant, impactful media. Continued compliance requires a balanced, consistent, and sustained enforcement effort.
HVEs targeting these behaviors are scheduled to take place throughout the duration of this Target Zero update.
High
Risk
Be
havi
or

56 High Risk Behavior: Speeding Involved
Speed feedback signs track driver behavior WTSC has recently funded four community-level pilot projects aimed at identifying high risk areas and implementing interventions that hold promise for reducing speed-related fatal and serious injury crashes. The selected sites for these projects are: Thurston County, Kitsap County, Auburn, and Wenatchee. All projects include local steering committees that oversee the main components of these speed intervention projects. Each project has the following components:
| Public outreach in the form of both paid and earned media.
| Enforcement of speeding limits in high risk areas. | Use of technology to identify high risk areas and to
reduce vehicle speeds when enforcement is not present.The technology used for these projects includes mobile speed feedback signs and variable message signs. When active, these signs have been shown to reduce speeds as drivers approach the signs. In addition to displaying the speeds of oncoming vehicles, these signs capture vehicle speed data and generate summary reports for users. This allows local agencies to easily measure the need for speed intervention on a particular roadway and implement a very targeted intervention if needed.
These projects show a promising strategy for targeting speeding, but are unlikely to be expanded statewide due to the high cost of the signs and paid media outreach. Despite the cost, however, this approach is a possible intervention in targeted areas throughout the state that experience high levels of speeding-related crashes.
Washington State laws relating to speedingRCW 46.61.400 Basic rule and maximum limits.
RCW 46.61.410 Increases by Secretary of Transportation. Maximum speed limit for trucks.
RCW 46.61.440 Maximum speed limit when passing school or playground crosswalks.
RCW 46.61.465 Exceeding speed limit — reckless driving.
RCW 46.61.470 Speed traps defined, certain types permitted. Measured courses, speed measuring devices, timing from aircraft.
RCW 46.61.275 Reporting of certain speed zone violations — Subsequent law enforcement investigation.
Clear data collection from law enforcement officers is criticalLaw enforcement officers are not only enforcers of the traffic laws, they are also the originators of most of the Target Zero data on fatality and serious injury crashes. Officers at the state, local, and Tribal levels collect, interpret, and document reportable crash data on Police Traffic Collision Reports (PTCRs). Target Zero partners use this data to focus efforts on speeding hot spots, intended to reduce speeding, save lives, and prevent injuries.
Due to the critical nature of this data, Target Zero partners must emphasize the importance of accurate and consistent crash investigations. Investigating agencies have a responsibility to ensure officers are accurately and definitively determining and documenting the cause of each crash. Causes such as “wheels off roadway,” “speed too fast for conditions,” and “following too closely” must be carefully investigated and accurately assigned. Inaccuracy in assigning the cause of a crash reduces the effectiveness of our response — and could keep us from preventing more deaths and serious injuries.
High Risk Behavior

57Washington State Strategic Highway Safety Plan 2016: Target Zero
Strategies for reducing speeding (SPE) fatalities and serious injuriesObjective Strategies Implementation areas
SPE.1. Reduce speeding through enforcement activities
SPE.1.1 Increase use of speed enforcement. (P, CTW) EnforcementSPE.1.2 Conduct high visibility enforcement efforts at locations where speeding-
related crashes are more prevalent. (P, NCHRP)Enforcement
SPE.1.3 Increase penalties for repeat and excessive speeding offenders. (R, CTW) Leadership/PolicySPE.1.4 Equip law enforcement officers with appropriate equipment for speeding
enforcement. (R, WSP )Enforcement, Leadership/Policy
SPE.1.5 Establish and enforce lower speed limits for commercial vehicles on higher-speed roads. (R, NCHRP)
Engineering, Enforcement
SPE.1.6 Increase use of aerial speed enforcement. (U) EnforcementSPE.2. Use engineering measures
to effectively manage speedSPE.2.1 Set speed limits which account for roadway design, traffic, and environment,
including traffic volume, modal mixed-use, and local and regional function. (R, NCHRP)
Engineering
SPE.2.2 Use traffic-calming and other design factors to influence driver speed. (R, NCHRP)
Engineering
SPE.2.3 Design and maintain speed limit and ensure warning signs are visible and installed at appropriate intervals. (R, NCHRP)
Engineering
SPE.2.4 Use electronic variable speed limit signs that change according to conditions such as weather and congestion. (R, NCHRP)
Engineering
SPE.2.5 Support the limited use of speed feedback signs to warn motorists that they are exceeding the speed limit; continue to research the most effective locations for these signs. (R, NCHRP)
Engineering, Education
SPE.2.6 Separate motorized traffic from non-motorized traffic using shared-use paths, sidewalks, bridges, etc. (R, NCHRP)
Engineering
SPE.2.7 Implement timed and coordinated traffic signals to improve traffic flow, reduce red-light running, and manage speeds. (R, NCHRP)
Engineering
SPE.2.8 Set consistent speed limits based on existing operation considering for road design, traffic flows, traffic mix and other environmental factors. (R, NCHRP)
Engineering
P: Proven R: Recommended U: Unknown
Continued on next page
High
Risk
Be
havi
or

58 High Risk Behavior: Speeding Involved
Strategies for reducing speeding (SPE) fatalities and serious injuriesObjective Strategies Implementation areas
SPE.3. Build partnerships to increase support for speed- reducing measures
SPE.3.1 Use the corridor safety model in high-crash locations where data suggests a high rate of speeding-related fatal or serious injury crashes. (P, CTW)
Leadership/Policy, Education, Engineering, Enforcement
SPE.3.2 Educate the public about the dangers of excessive speed and speed too fast for conditions, and its role in traffic fatalities. (R, CTW)
Education
SPE.3.3 Increase data sharing between local officers, Tribal police, and engineering agencies to identify and develop solutions for areas where speeding is a problem. (R, DDACTS)
Leadership/Policy
SPE.3.4 Educate prosecutors and judges to ensure speeding violations are treated seriously and fairly. (R, NCHRP)
Education, Enforcement
SPE.3.5 Work with Washington Trucking Association and WSP’s Commercial Vehicle Enforcement Division to encourage company policies which, when backed with speed monitors or speed regulators, can reduce speeding in commercial vehicles. (R, WSP)
Leadership/Policy
SPE.3.6 Develop appropriate messages and methods to reach segments of the population inclined to speeding or driving too fast for conditions. (U)
Education
SPE.3.7 Develop education messages in multiple languages. (U) EducationSPE.3.8 Educate about the effects of weather on appropriate speed. (U) EducationSPE.3.9 Collaborate with BIA, Indian Health Services, and NATEO to support Tribal
Nations who seek to reduce speeding-related crashes on Tribal lands. (U)Leadership/Policy
SPE.3.10 Implement neighborhood speed watch/traffic management programs. (U) Education, EnforcementP: Proven R: Recommended U: Unknown
High Risk Behavior

60 High Risk Behavior: Distraction Involved
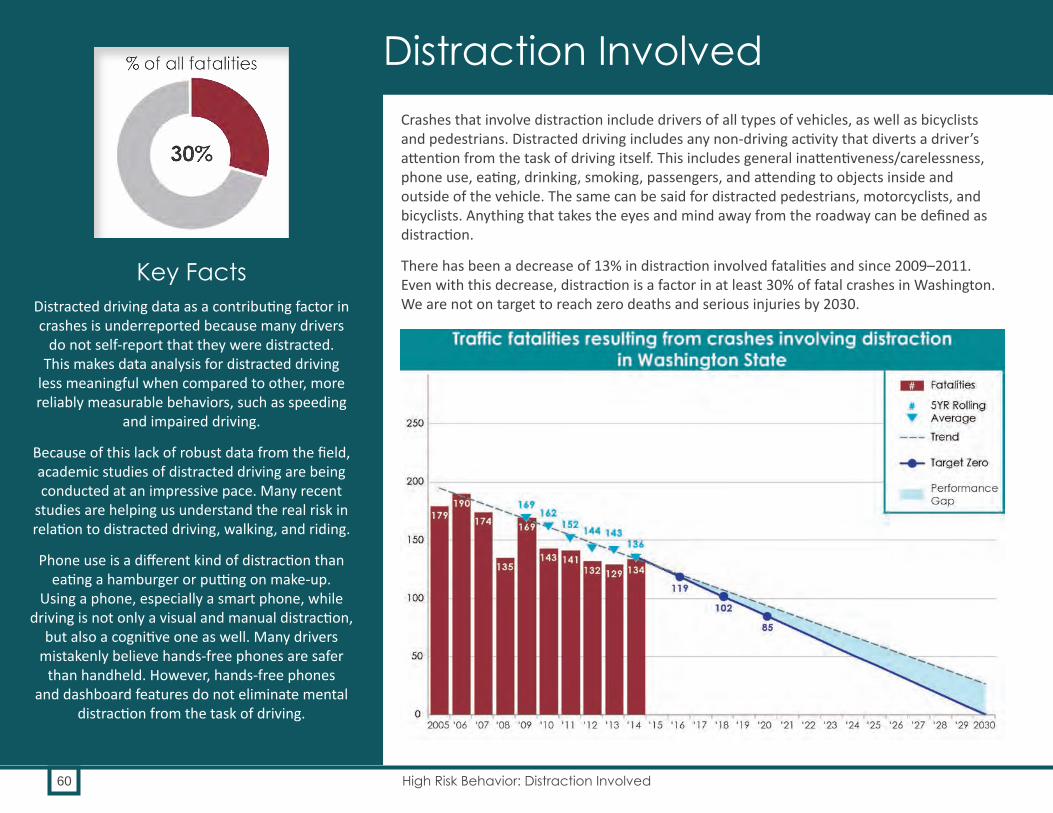
Crashes that involve distraction include drivers of all types of vehicles, as well as bicyclists and pedestrians. Distracted driving includes any non-driving activity that diverts a driver’s attention from the task of driving itself. This includes general inattentiveness/carelessness, phone use, eating, drinking, smoking, passengers, and attending to objects inside and outside of the vehicle. The same can be said for distracted pedestrians, motorcyclists, and bicyclists. Anything that takes the eyes and mind away from the roadway can be defined as distraction.
There has been a decrease of 13% in distraction involved fatalities and since 2009–2011. Even with this decrease, distraction is a factor in at least 30% of fatal crashes in Washington. We are not on target to reach zero deaths and serious injuries by 2030.
Key FactsDistracted driving data as a contributing factor in crashes is underreported because many drivers
do not self-report that they were distracted. This makes data analysis for distracted driving
less meaningful when compared to other, more reliably measurable behaviors, such as speeding
and impaired driving.
Because of this lack of robust data from the field, academic studies of distracted driving are being conducted at an impressive pace. Many recent
studies are helping us understand the real risk in relation to distracted driving, walking, and riding.
Phone use is a different kind of distraction than eating a hamburger or putting on make-up.
Using a phone, especially a smart phone, while driving is not only a visual and manual distraction,
but also a cognitive one as well. Many drivers mistakenly believe hands-free phones are safer
than handheld. However, hands-free phones and dashboard features do not eliminate mental
distraction from the task of driving.
Distraction Involved

61Washington State Strategic Highway Safety Plan 2016: Target Zero
OverviewFrom 2012–2014, 395 people died in crashes involving distraction on the part of the driver, non-motorist or both. Target Zero partners believe that these numbers are underreported, especially for smart phone use. While phone-involved distraction currently gets a lot of attention, it is rarely reported as a contributing factor in crashes when distractions are noted. For instance, in the 2012–2014 period, driver phone use was noted as a contributing factor in only 3% of all fatality and serious injury crashes.
What’s NewThe WTSC is working with a stakeholder group to strengthen the Washington State laws that
address phone and smart phone use while driving.
Washington now has a distracted driving video for law enforcement. It is hosted on WTSC’s
YouTube channel.
In 2014, Washington launched an annual high visibility enforcement campaign to reduce phone distraction. Over 100 law enforcement agencies participate every year in an effort to crack down
on drivers who use their phone on the road. Despite this effort, laws for distracted driving
remain difficult to enforce.
In 2013, researchers at Harborview Injury Prevention and Research Center observed that nearly one in 10 drivers was using a phone or
texting behind the wheel. Among those driving distracted, nearly half (47%) were texting. The WTSC will conduct a statewide survey of driver
phone use in summer 2016.
Priority 1
Priority 2
Priority 3

High Risk Behavior
62 High Risk Behavior: Distraction Involved
Our citizens have a disconnect between their beliefs and actions on driving and phone use. A 2015 AAA Washington study found that two in three drivers report talking on their phone while driving recently. One in three say they do so frequently. However, nearly 70% disapprove of hand-held phone use. Most drivers view texting or emailing while driving a serious threat to their safety, but one in three admit to having done so recently.
Distraction-involved crashes are challenging to documentAs a contributing factor in crashes, distraction is difficult to quantify. While distracted drivers are a common sight on our roads, identifying distraction as a contributing factor of a crash is not easy. By the time investigators arrive at the scene, the distraction has passed or been put away. Drivers rarely volunteer that they were talking on their phone or distracted in some other way. Additionally, independent witnesses or specific evidence is rare.
Before an officer can select any of the 13 specific distraction codes listed on the crash report, one of the following must happen:
| An officer or an involved party needs to witness the distraction.
| A driver must self-report the action. | Phone records must be subpoenaed, as sometimes happens
in a serious injury or fatality crash investigation. Even then, this might not tell the full story; if a driver was manipulating his phone but did not send or receive any data over the system during this time period, then the records would not show usage.
Unlike impaired driving, there are no roadside, breath, or blood tests available to confirm the suspicion of distracted driving. Due in part to these challenges, distraction is believed to be underreported in fatal and serious injury crashes.

High
Risk
Be
havi
or
63Washington State Strategic Highway Safety Plan 2016: Target Zero
Research on phone use makes clear links to dangerously distracted driving Because the distracted driving data for serious injury and fatal crashes is unreliable, much of what we can infer about distracted driving comes from observational studies, as well as studies of human distraction. These studies make a clear link between phone use and dangerous driving.
The first thing that we can tell from the studies is that distraction is in fact a common factor in crashes. The NHTSA National Motor Vehicle Crash Causation Survey collects on-scene information about the events leading up to crashes. In their most recent survey, the critical reason for the crash – the last event in the crash causal chain – was assigned to the driver in 94% of the crashes. Analysis of crashes investigated by these on-scene researchers concluded that recognition errors, which include driver inattention, internal and external distraction, and inadequate surveillance, accounted for 41% of crashes (Singh, 2015.)
The next thing the studies tell us is phones are nearly universal, and frequently used by drivers. The Pew Research Center reports that 61% of Americans own a smart phone, and 91% of the adult population total owns some sort of mobile phone.
Meanwhile, in 2013, researchers at Harborview Injury Prevention and Research Center (University of Washington Medicine) performed an observational study that found that nearly one in ten Washington State drivers is using a phone or texting behind the wheel. Among those driving while distracted by a phone, nearly half (47%) were texting. Another recent national study by the AAA Foundation for Traffic Safety analyzed video recordings of 1,691 crashes involving young drivers (aged 16–19). These recordings revealed that, in 58% of those crashes, the drivers were engaging in some type of potentially distracting behavior.
Although drivers have faced distractions since cars became a common form of transportation in the 1920s, the phone has been shown to be a distraction that significantly increases crash risk.
In their analysis of 206 empirical studies on distracted driving, Ferdinand and Menachemi (2014) found that phone use, which in this study collapsed all phone interactions into a single variable, was more highly predictive of poor driving performance than any other potential distraction. Similarly, a 2011 meta-analysis of phone use and crashes showed that dialing, talking, and listening on a phone increased a driver’s risk of crash by almost three times (Elvik, 2011).
The reason that phones, including smart phones, create a higher crash risk for drivers than other distractions is because of the ways in which they distract. Phones are not just a physical or visual distraction, like eating food or changing a radio station; they take our minds away from the task of driving by connecting us to complex social and informational interchanges.

High Risk Behavior
64 High Risk Behavior: Distraction Involved
Additionally, researchers are now pointing to the addictive nature of smart phones, and note that the urge to attend to every notification, call, and text is driven by a strong desire to stay socially connected. This finding exposes the complexity of attempts to curb drivers use of smart phones.
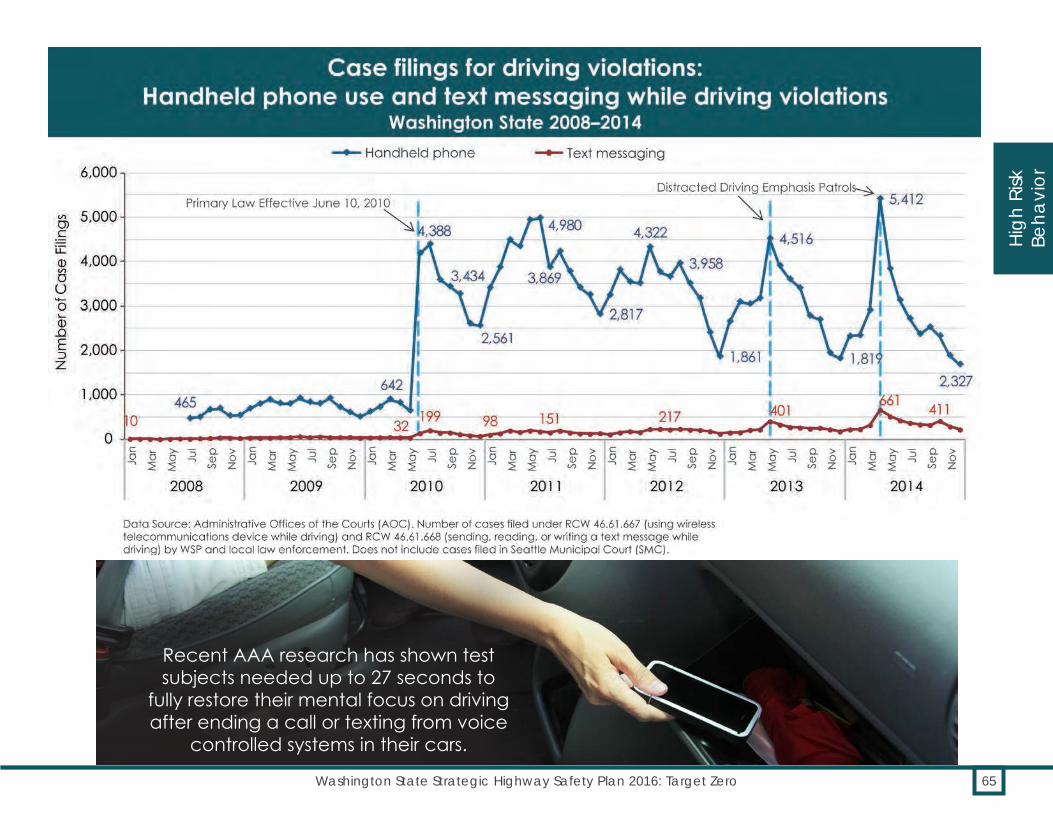
Recent AAA research has shown test subjects needed up to 27 seconds to fully restore their mental focus on driving after ending a call or texting from voice controlled systems in their cars. At 25 mph, a vehicle could travel up to 988 feet — the approximate length of three football fields — before the residual cognitive costs completely dissipated. These finding have implications for people who think it’s safe to dial or send a text message while stopped at a traffic signal: the mental distractions from these interactions are likely to persist after the light turns green.
Another AAA research study confirms that the distraction of phones goes beyond the physical: in-vehicle information systems (IVIS) use — none of which require drivers to take their hands off the wheel or eyes off the road — was associated with moderate to high levels of cognitive distraction.
The last series of studies links the use of phones, and their distracting consequences, to real-world outcomes on Washington State roads. In 2014, University of Washington researchers conducted a case-control study of licensed Washington drivers. They linked distracted driving citations to statewide police crash records to examine the association between distraction-related citations and crash risk. The study concluded drivers who were cited for texting, talking on a phone, or inattentive driving were much more likely to be involved in a police-reported crash than drivers who did not receive citations.
Percent of all fatal and serious injury crashes involving distraction, by county (2012–2014)
High
Risk
Be
havi
or
65Washington State Strategic Highway Safety Plan 2016: Target Zero
Recent AAA research has shown test subjects needed up to 27 seconds to
fully restore their mental focus on driving after ending a call or texting from voice
controlled systems in their cars.

High Risk Behavior
66 High Risk Behavior: Distraction Involved
Related fatalities & serious injuries: overlap with other Target Zero factorsDISTRACTION INVOLVED
What percentage of DISTRACTION INVOLVED
crashes involved another factor?
FATALITIES SERIOUS INJURIES
For example, 33% of DISTRACTION INVOLVED fatal
crashes also involved a young driver.

Distraction increases pedestrian vulnerability It is not just drivers who suffer the cognitive effects of cell phone distraction. A Harborview study from 2012 evaluated the impact of technological and social distraction on cautionary behaviors and crossing times in pedestrians. Nearly one third of all pedestrians performed a distracting activity while crossing. Distractions included listening to music (11%), text messaging (7.3%), and using a handheld phone (6.2%). The study concluded that distracting activity is common among pedestrians, even when crossing intersections. Technological and social distractions increase pedestrian crossing times. Pedestrians who were text messaging displayed the highest risk of all distracted walkers, with slower crossing times and failure to display cautionary crossing behaviors.
High
Risk
Be
havi
or
67Washington State Strategic Highway Safety Plan 2016: Target Zero
Additionally, the study showed that:
| One out of every three teens cited for distraction was later involved in a police-reported crash.
| The earliest driving period for young drivers is the most dangerous, distraction-wise. Drivers ages 16–17, for whom even hands-free phone use is banned, had the strongest link between distraction citations and crash risk.
| The association between texting citation and crash rate is higher for women.
Picking up where the 2013 UW study left off, in Summer 2016 the WTSC will conduct its first biannual statewide survey of driver phone use. This will establish a baseline number for the percentage of drivers using devices while driving.
With this research showing that phones create a major, dangerous distraction for drivers, Target Zero partners will continue to focus efforts to prevent phone use during driving, and will also encourage bicyclists and pedestrians to put down their phones.
Contributing circumstances and factorsOther high-risk behaviors are also often coupled with distraction involved crashes, as seen in the infographic. In addition, age and gender are also factors in distracted driving.
Younger and older driversDistraction also shows up notably for younger and older drivers. Sixteen to 17 year old, 18–20, and 70+ drivers are involved in the highest number of distraction-related fatal and serious injury crashes, as seen in the bar graph on the following page. Inexperience and immaturity combine to make young drivers especially at-risk in relation to distraction. Their risk is especially heightened under specific conditions, such as at night, after consuming alcohol or drugs, and with passengers in the car.
In general, male drivers across all age groups engage in high risk behaviors such as impairment and speeding more often than female drivers of comparable ages. However, female drivers in fatal crashes are slightly more likely to be distracted than their male counterparts.
From 2012–2014, male drivers outnumbered female drivers by roughly 3-to-1 in all fatal crashes statewide. However, a greater proportion of female drivers (21%) were identified by investigators as distracted than their male counterparts (19%).
Programs and successes
High visibility enforcement campaigns enforce Washington’s law prohibiting phone use while drivingIn 2014, Washington launched an annual high visibility enforcement (HVE) campaign to reduce phone distraction. Over 100 law enforcement agencies participate in this national effort to crack down on drivers who use their smart phones on the road.

High Risk Behavior
68 High Risk Behavior: Distraction Involved
The graph on page 65 shows the spike in case filings for phone use increasing during the patrols. Media campaigns and community outreach warn drivers of the patrols in advance. Law enforcement agencies can also use these funds to conduct distracted driving HVE patrols throughout the year in their communities.
Educating high school students about distracted drivingWTSC and State Farm® Insurance have partnered to promote awareness about the dangers of distracted driving among high school students. Many teens reach a developmental stage where the influence of other teens is much more powerful than that of parents and other adults. Therefore, peer-to-peer education programs provide a valuable format for promoting healthy behaviors.
As part of this program, teens receive a list of educational action steps which guide them in the process of learning about the dangers of distracted driving. They learn ways to promote anti-distracted driving safety messages with other teens, and with the community at large. Students then document their efforts to qualify for $500 grants. The program is funded by State Farm and administered by WTSC.
Harborview, Seattle, and King County partner to strengthen distracted driving laws Harborview, Public Health Seattle & King County, and King County’s prosecutorial leadership partnered to reduce phone use among Washington drivers. They identified effective strategies to improve implementation, enforcement, and prosecution of distracted driving legislation. This project included law enforcement focus groups, interviews with legal and judicial experts, observations of phone use among Washington drivers, and development of a public health law database.
Washington State laws relating to distracted driving
RCW 46.61.667 Holding a wireless communications device to ear while driving.
RCW 46.61.668 Sending, reading, or writing a text message while driving.
RCW 46.20.055 Using a wireless device of any kind during permit phase of licensure.
RCW 46.20.075 Using a wireless device of any kind while in intermediate driver license status.
RCW 46.52.060 Tabulation and analysis of reports – Availability for use.

High
Risk
Be
havi
or
69Washington State Strategic Highway Safety Plan 2016: Target Zero
Strategies for reducing distracted driving (DIS) fatalities and serious injuriesObjective Strategies Implementation areas
DIS.1. Increase driver awareness of the risks of distracted driving
DIS.1.1 Conduct statewide distracted driving high visibility enforcement (HVE) campaigns. (R, CTW)
Enforcement, Education
DIS.1.2 Conduct statewide education campaign focused on the dangers of electronic device use while driving/walking. (U)
Education
DIS.2. Increase/strengthen fines and assist in improved adjudication of distracted driving citations
DIS.2.1 Visibly enforce existing statutes to deter distracted driving. (U) Enforcement, Leadership/Policy
DIS.3. Strengthen distracted driving laws/ordinances
DIS.3.1 Pass a state law that would prohibit drivers from using hand-held personal electronic devices at all times while the car is on the road. Apply the prohibition even while a driver is temporarily stopped because of traffic or at a stoplight. Ensure violations are reportable to insurance and employers.
Leadership/Policy
DIS.3.2 Enact local ordinances that allow officers to cite drivers for distracted driving for using hand-held personal electronic devices, including smart phones. Apply the prohibition even while a driver is temporarily stopped because of traffic or at a stoplight.
Leadership/Policy
P: Proven R: Recommended U: Unknown

70 High Risk Behavior: Unrestrained Vehicle Occupants
Seatbelts, car seats, and booster seats protect vehicle occupants. Since the 2013 version of Target Zero, unrestrained motor vehicle occupant fatalities decreased 15%. Although the downward trend of serious injuries has leveled out, Washington is still on track to reach zero deaths and zero serious injuries for unrestrained vehicle occupants, according to 2012–2014 data.
Key FactsFor the past 10 years, Washington consistently has had one of the highest seatbelt use rates in the country. In 2015, 94.6% of Washingtonians
buckled up.
In order to gauge statewide child restraint use, in 2014 WTSC conducted observational surveys
at elementary schools across the state. The surveys found:
• An estimated one in five children are illegally riding in the front seat
• Overall, the majority of children are restrained with a seatbelt (approximately 80%)
• Less than 1/3 are actually properly restrained — with a car or booster seat — in the back seat
For American Indians and Alaskan Natives (AIANs) in Washington State, the lack of
seatbelt use results in a fatality rate that is 7.3 times higher than for everyone else. Of the
AIANs who died in 2012–2014 traffic crashes, 43% were not buckled at the time of the crash.
Unrestrained Vehicle Occupants

71Washington State Strategic Highway Safety Plan 2016: Target Zero
OverviewWashington has consistently been a national leader on seatbelt use. Since the adoption of the Click It or Ticket program and the primary enforcement seatbelt law in 2002, Washington has had one of the highest rates of seatbelt use in the country. Strong support from the law enforcement community, aggressive efforts to publicize seatbelt patrols, and assistance from Target Zero managers (TZMs) in 17 regions provide the backbone of this success. The use of child restraint systems such as car seats and booster seats is supported by a statewide network of car seat technicians. Nevertheless, as the infographic shows, unrestrained occupants are very likely to engage in other high risk behaviors.
What’s NewWTSC published their Online Car Seat
Awareness Training for Law Enforcement. This one-hour curriculum is intended to improve
enforcement of the laws around seatbelts, car seats, and booster seats.
Washington State changed the methodology for its annual seatbelt use survey in 2013 due to new federal rules. This change prevents us from comparing the seatbelt use rate to other
states from 2012–2014, as methodologies were changing in every state.
Priority 1
Priority 2
Priority 3

72 High Risk Behavior: Unrestrained Vehicle Occupants
Washington adopted its first seatbelt law in 1986. At that time, the first survey in the state showed a 36% seatbelt use rate. Since the passage of the primary seatbelt enforcement law, Washington consistently has had one of the highest seatbelt use rates in the country. In 2015, 94.6 % of Washingtonians buckled up.
Those not using their seatbelts are disproportionately more likely to be driving while impaired, speeding, unlicensed, or distracted. Unrestrained occupants are also more likely to die in rural road crashes.
High Risk Behavior

73Washington State Strategic Highway Safety Plan 2016: Target Zero
43% of American Indians and Alaskan Natives who died in crashes were not buckled upTraffic fatality rates of American Indians and Alaskan Natives (AIANs) are higher than for the AIAN population in several counties, and the most disproportionate rate is for seatbelt use. The fatality rate for unrestrained vehicle occupants is 7.3 times higher for AIAN than for non-AIAN populations. Of the AIAN people who died in 2012–2014 traffic crashes, 43% were not buckled at the time they crashed.
Child safety seats reduce the risk of death Correctly used child safety seats reduce the risk of death in passenger vehicles by 71% for infants and by 54% for toddlers (Safe Kids WorldWide). Washington State crash data show that children who incur either minor injuries or none at all in crashes were appropriately restrained at least 86% of the time. Despite the effectiveness of properly used child restraints, and widespread adherence to Washington’s strong child restraint law, many children are still either not restrained or are incorrectly restrained. These children are at higher risk for injury or death.
Changes to the observational seatbelt surveyWashington’s observational seatbelt survey, which determines what our state’s seatbelt use rate is, has been repeated every year since 1986. All states were required to change to a more precise methodology, and Washington switched to the new methodology in 2013. The new methodology uses continually updated information on population, Vehicles Miles Traveled (VMT), and roadway function class.
With this change, seatbelt use rates that were determined under the new methodology cannot be compared to use rates determined under the old methodology. In Washington State, traffic safety data experts are confident the new methodology is solid because of the consistency in seatbelt use rates for the three years:
• 2013: 94.5%• 2014: 94.5%• 2015: 94.6%
High
Risk
Be
havi
or

74 High Risk Behavior: Unrestrained Vehicle Occupants
High Risk Behavior
Related fatalities & serious injuries: overlap with other Target Zero factorsUNRESTRAINED OCCUPANTS
What percentage of UNRESTRAINED crashes
involved another factor?
FATALITIES SERIOUS INJURIES
For example, 35% of fatal crashes
with UNRESTRAINED OCCUPANTS also involved a young
driver.

75Washington State Strategic Highway Safety Plan 2016: Target Zero
In Washington, between 2012 and 2014, 21 children age 12 and under died in traffic crashes while inside cars. Two of these children were not sitting in the back seat, the safest place for a child under age 12. Only nine of these 21 children were confirmed to have been seated in a child restraint, and seven were not restrained at all — not even a seatbelt. Over 80% (17 out of 21) of the fatalities were children two years and older.
From 2012–2014, an additional 116 children age 12 and under suffered serious injuries inside passenger vehicles. Nineteen of these children were illegally riding in the front seat. Only 34 of these children were seated in a child car seat or booster, and 19 were not restrained at all.
Washington conducted a observational survey at elementary schools across the state. This study found:
| An estimated one in five children were illegally riding in the front seat.
| 80% were restrained by seatbelt; however, less than one-third of those children were properly restrained.
| Continued educational outreach and enforcement is needed.
Percent of all fatal and serious injury crashes involving unrestrained occupants, by county (2012–2014)
Occupant protection definitionOccupant protection refers to safety features designed to protect occupants of motor vehicles in the event of a crash. While the manufactured component parts of motor vehicles are the responsibility of the federal government, states are tasked with encouraging the use of seatbelts by adults and the use of child restraint systems such as car seats and booster seats.
High
Risk
Be
havi
or

76 High Risk Behavior: Unrestrained Vehicle Occupants
Contributing circumstances and factorsThe correlation between being impaired by alcohol or positive for drugs and lack of seatbelt use is extremely high. Almost three-fourths of unrestrained deaths involved impairment, and over half of unrestrained serious injuries involved impairment. Impaired driving often leads to lane departure, and 79% of unrestrained deaths and 81% of unrestrained serious injuries involved lane departure.
In addition, younger drivers are particularly likely to be involved. Among all drivers who were unrestrained at the time of a fatality crash, more than one-third were ages 16–29. As with crashes involving other risky behaviors, the highest percent of unrestrained occupant crashes occur on weekends and on rural roads.
Programs and successes
Click It or Ticket program enforces seatbelt useThe Click it or Ticket (CIOT) program is a high visibility enforcement model. The effort begins with intensive publicity to inform people that law enforcement will be ticketing seatbelt law violators. Publicity includes both a media buy, as well as a push to get information about the patrols into the news. WSDOT also places messages about the patrols on their Variable Message Sign system across the state.
After this wave of publicity, statewide enforcement patrols will begin. These patrols are held at locations where the data indicate that the most people are riding without proper restraints. Time of day is also a factor: in Washington, about the same number of traffic deaths occur during the daytime hours as at night, even though traffic volumes at night are only 12–15% of what they are during the day. Because of this, the CIOT program encourages patrols to start after 4 pm.
When this program started in 2002, only 82% of Washingtonians buckled up. After the first round of CIOT patrols the rate jumped to 92%. In the years following, it rose to 95%, one of the highest in the nation, where it has remained. Consistent CIOT patrols through the years have been the cornerstone of Washington’s occupant protection program.
Safest Ride Campaign encourages parents to have their children ride in the back seat of the carThe 2014 statewide child restraint observational survey results showed approximately one in five child passengers under age 13 were illegally riding in the front seat. This places those children at greater risk of injury.
Washington’s Child Passenger Safety program (CPS) partnered with Safe Kids Washington to develop a media campaign about the importance of children riding buckled up in the back seat. The Safest Ride was developed during CPS week in September. Several SafeKids Coalitions and Target Zero Task Forces participated. The group designed three community awareness activities in addition to conducting pre- and post- observational surveys at targeted elementary schools. Safe Kids Washington provided mini-grants,
Keep Kids Under age 13:
• In the back seat
• Properly restrained
• Every time
IT’S THE LAW!
The Safest Ride
High Risk Behavior

77Washington State Strategic Highway Safety Plan 2016: Target Zero
while Washington’s CPS Program provided educational tools and resources. Observation results found an average 12.3% increase (pre-intervention to post-intervention) in the number of children correctly riding in the back seat.
This media campaign continues to be used throughout Washington State and has had materials translated to Spanish.
Child Passenger Safety Program funds efforts to improve child safety in vehiclesWashington’s Child Passenger Safety Program provides direct support to an active network of local leaders providing child passenger safety education and resources. This network is made up of 17 Target Zero managers, 15 SafeKids coordinators, and six community child passenger safety leaders. The program provides grant funding to:
| Increase visibility of child passenger safety issues in Washington.
| Maintain and support the statewide network of child passenger safety technicians and inspection stations.
| Strengthen efforts to increase compliance, enforcement, and adjudication of the seatbelt and child restraint law.
In order to obtain current data on child restraint use to guide outreach and educational efforts, Washington established a statewide observational survey of child occupants. Results of the 2014 surveys of child occupants provided guidance for media and awareness campaigns for increased booster seat use and child occupants under age 13 in the back seat.
Improving law enforcement understanding of car seatsLaw enforcement officers determine if a child restraint system is appropriate for the child’s individual height, weight, and age.
Because of the duration of time required for a formal certification training in child seat use, in 2011 the WTSC supported the creation of a Car Seat Awareness training for law enforcement agencies. Based on popular request, the agency introduced an online version in 2015. Since May 2015, the online class has had 3,122 sessions, considerably more people than could be served in-person.
Washington State laws relating to unrestrained vehicle occupants
RCW 46.61.687 covers all passengers under 16 years of age:
| A child must be restrained in a child restraint system. | A child who is 8 years or older, or 4’9” tall or taller,
shall be properly restrained with a seatbelt or an appropriately fitted child restraint system.
| Children under 13 must ride in the back seat in a vehicle where it is practical to do so.
| Does not apply to: 1) for-hire vehicles, 2) vehicles designed to transport 16 or less passengers operated by transportation companies, 3) vehicles providing shuttle service, and 4) school buses.
RCW 46.61.688 covers passengers over 16 years of age:
| People driving or riding in a motor vehicle shall wear a seatbelt. Drivers are responsible for ensuring all child passengers under the age of sixteen years either wear a seatbelt or use an approved child restraint device.
High
Risk
Be
havi
or

78 High Risk Behavior: Unrestrained Vehicle Occupants
Strategies for reducing unrestrained vehicle occupant (UVO) fatalities and serious injuriesObjective Strategies Implementation areas
UVO.1. Strengthen efforts to increase compliance, enforcement, and adjudication of the seatbelt and child restraint laws
UVO.1.1 Identify population groups with lower than average restraint use rates and implement communications, outreach, and enforcement campaigns directed at groups/areas where restraint use is lowest, particularly rural areas. (P, CTW and P, NCHRP)
Education, Enforcement
UVO.1.2 Engage and collaborate with all levels of law enforcement to effectively carry out high-visibility communications, outreach, and enforcement of seatbelt use, such as the Click It or Ticket campaign. (P, CTW)
Education, Enforcement
UVO.1.3 Conduct nighttime patrols during the May Click it or Ticket statewide seatbelt mobilization. Combine short-term, high-visibility seatbelt use enforcement with nighttime enforcement programs. (R, CTW)
Enforcement
UVO.1.4 Implement Click It or Ticket-style child car seat short-term, high-visibility education and enforcement campaigns.(P, CTW)
Education, Enforcement
UVO.1.5 Encourage law enforcement and other emergency responders to adopt seatbelt use policies for their employees. (R, NHTSA)
Education, Leadership/Policy, EMS
UVO.1.6 Host car seat awareness and instruction classes, especially in diverse community locations with populations that have lower than average proper car seat use. Target child transport agencies, hospitals, child care centers, schools, etc. Partner with Target Zero Manager, SafeKids Coalition, or local Child Passenger Safety Team. (R, NCHRP)
Education
UVO.1.7 Engage in discussions with and educate prosecutors and judges about the importance of restraint programs, enforcement, and adjudication of these violations. (R, NHTSA)
Education, Enforcement
UVO.1.8 Collaborate with WA’s Criminal Justice Training Commission and the WA State Patrol Academy to conduct trainings for new law enforcement officers and seasoned officers on Washington’s child restraint law, increasing comfort level for spotting and citing violations. (R, NCHRP)
Education, Enforcement
UVO.1.9 Promote child car seat distribution programs. (U) EducationUVO.2. Promote legislative and
policy efforts to promote restraint use
UVO.2.1 Undertake policy change to require car seat awareness education for proper child restraint use by people who transport foster children and Medicaid participants. (R, ABACCL)
Leadership/Policy
UVO.2.2 Enact law to make it illegal to transport unrestrained humans in the back of pickup trucks. (R, IIHS)
Leadership/Policy
UVO.2.3 Encourage policy change to allow using photo enforcement to increase seatbelt compliance. (U)
Enforcement
P: Proven R: Recommended U: Unknown
High Risk Behavior

79Washington State Strategic Highway Safety Plan 2016: Target Zero
Strategies for reducing unrestrained vehicle occupant (UVO) fatalities and serious injuriesObjective Strategies Implementation areas
(continued from previous page)
UVO.2. Promote legislative and policy efforts to promote restraint use
UVO.2.4 Strengthen child passenger safety laws with a legislative change to add $25 administrative fee for violators to fund child passenger safety efforts, or allow local governments to initiate the change. (U)
Leadership/Policy
UVO.2.5 Strengthen child passenger safety laws with a legislative change to require toddlers to remain rear-facing until the age of two or until they reach the maximum height and weight for their seat. Also require children to remain in a booster seat until a height of 4’9” and remove the 8 year old reference. (R, NHTSA)
Leadership/Policy
UVO.3. Maintain and support the statewide network of child passenger safety technicians
UVO.3.1 Explore options for gaining a measure of statewide child restraint use, such as expanding the annual seatbelt observation survey to include observations of child restraint use. (R, DDACTS)
Leadership/Policy
UVO.3.2 Continuously monitor fatality and serious injury crash data involving unrestrained or improperly restrained child passengers to help direct geographic/demographic areas of focus. (R, DDACTS)
Education
UVO.3.3 Convene a group of CPS stakeholders from different disciplines and areas of the state, including existing network of Washington’s Target Zero managers, SafeKids Coalitions, and other local child passenger safety teams, to participate in product review, media efforts, trainings, and local project implementation. (U)
Leadership/Policy
UVO.3.4 Support opportunities for child car seat inspection events, CPS Technician certification courses, and recertification of technicians. Work collectively with Washington’s Target Zero managers, SafeKids Coalitions, and local child passenger safety teams. (R, NHTSA)
Education
UVO.3.5 Establish a database to collect all of Washington’s car seat inspection data. Analyze information received to determine major misuse issues; share with statewide CPS network; incorporate findings into media campaigns. (U)
Education
UVO.4. Increase visibility of child passenger safety issues in Washington
UVO.4.1 Provide access to appropriate information, materials, and guidelines for implementing media and programs to increase proper child restraint use. (U)
Education
UVO.4.2 Develop and implement media campaigns targeting major misuse issues in Washington State, which are currently booster age children and riding in the front seat. (U)
Education
UVO.4.3 Look for ways to offer positive reinforcement to parents correctly transporting children. (U)
Education
P: Proven R: Recommended U: Unknown
High
Risk
Be
havi
or

80 High Risk Behavior: Unlicensed Driver Involved
Drivers involved in fatalities who do not have a valid license at the time of the crash are called unlicensed drivers. Generally, this means they either drive before passing a test to earn their driving privilege, or they continue to drive after committing traffic crimes and losing that privilege. More significantly, however, it’s their risky driving behavior that causes crashes, not their license status.
Unlicensed drivers were involved in 248 (19%) of Washington’s traffic fatalities from 2012 through 2014. Almost every one of the fatalities that involved unlicensed drivers also involved one or more high risk driving behaviors, usually at a higher rate than all fatalities:
| Impairment: 79%, compared with 57% of all fatalities | Speeding: 48%, compared with 38% of all fatalities | Unrestrained vehicle occupants: 38%, compared with 22% of all fatalities | Distraction: 28%, compared with 30% of all fatalities
With such high rates of involvement, it is reasonable to conclude that high risk behaviors were the root cause of those unlicensed driver fatalities. Therefore, reducing risky driving behavior — rather than catching unlicensed drivers — will reduce unlicensed driver involved fatalities.
Overview In 2014 alone, 95 fatalities involved unlicensed drivers. This makes 2014 the worst year since 2008, with 108 deaths, higher than the five year rolling average of 82. The fatality trend line from 2010–2014 suggests unlicensed-driver-involved fatalities could still reach zero before 2030. That possibility fades, however, when we look at preliminary data for 2015, which looks similar to 2014.
Key FactsUnlicensed driving is difficult to prevent. Three
out of four unlicensed drivers involved in fatalities had a suspended license at the time of their crash (as opposed to the driver never
getting licensed in the first place). A suspended license cannot deter every suspended driver
from driving.
Unlicensed drivers are difficult to detect. They are typically not found until an unsafe driving
behavior causes law enforcement to pull them over, or until a crash has already occurred.
Most fatalities (79%) involving an unlicensed driver also involved alcohol impairment or testing positive for drugs. Pursuing proven
strategies to detect and reduce impairment will reduce unlicensed driver involved
fatalities.
Nearly half of the fatalities involving an unlicensed driver also involved speeding. Reducing speeding will reduce unlicensed
driver fatalities.
Unlicensed Driver Involved
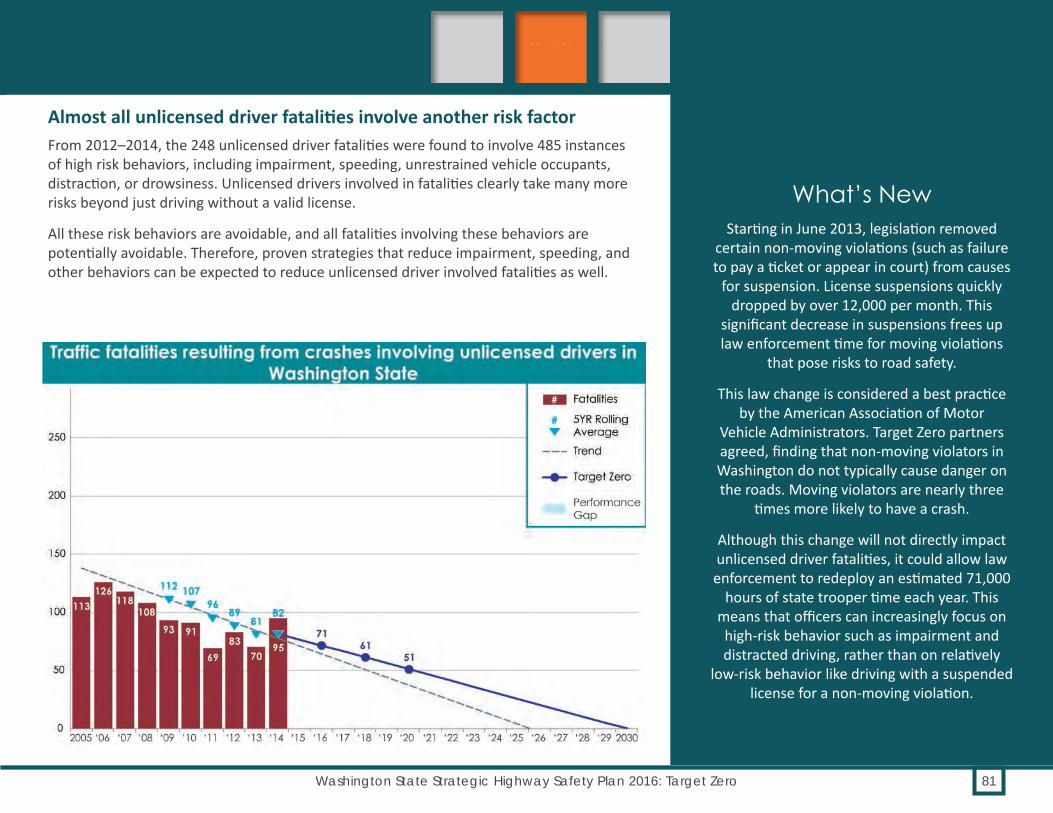
81Washington State Strategic Highway Safety Plan 2016: Target Zero
Almost all unlicensed driver fatalities involve another risk factorFrom 2012–2014, the 248 unlicensed driver fatalities were found to involve 485 instances of high risk behaviors, including impairment, speeding, unrestrained vehicle occupants, distraction, or drowsiness. Unlicensed drivers involved in fatalities clearly take many more risks beyond just driving without a valid license.
All these risk behaviors are avoidable, and all fatalities involving these behaviors are potentially avoidable. Therefore, proven strategies that reduce impairment, speeding, and other behaviors can be expected to reduce unlicensed driver involved fatalities as well.
What’s NewStarting in June 2013, legislation removed
certain non-moving violations (such as failure to pay a ticket or appear in court) from causes
for suspension. License suspensions quickly dropped by over 12,000 per month. This
significant decrease in suspensions frees up law enforcement time for moving violations
that pose risks to road safety.
This law change is considered a best practice by the American Association of Motor
Vehicle Administrators. Target Zero partners agreed, finding that non-moving violators in Washington do not typically cause danger on the roads. Moving violators are nearly three
times more likely to have a crash.
Although this change will not directly impact unlicensed driver fatalities, it could allow law enforcement to redeploy an estimated 71,000
hours of state trooper time each year. This means that officers can increasingly focus on high-risk behavior such as impairment and distracted driving, rather than on relatively
low-risk behavior like driving with a suspended license for a non-moving violation.
Priority 1
Priority 2
Priority 3

High Risk Behavior
82 High Risk Behavior: Unlicensed Driver Involved
Related fatalities & serious injuries: overlap with other Target Zero factorsUNLICENSED DRIVER INVOLVED
What percentage of UNLICENSED
DRIVER INVOLVED crashes involved another factor?
FATALITIES SERIOUS INJURIES**Serious Injury data are unavailable for Unlicensed Drivers
For example, 36% of fatal crashes involving
an UNLICENSED DRIVER also involved
a young driver.

High
Risk
Be
havi
or
83Washington State Strategic Highway Safety Plan 2016: Target Zero
Other features of unlicensed driversNearly one third of unlicensed driving fatalities occurred between 11 p.m. and 3 a.m., double what would be expected if all hours were equal. Also, more than three times as many males as females were unlicensed drivers involved in fatalities. However, these are merely correlating factors. The high risk behaviors noted previously caused the crashes.
Most unlicensed drivers at the time of their fatal crash had a suspended license. From 2012–2014:
| 75% (170) had a suspended license (Since 2006, this number has hovered between 62% and 78% of unlicensed drivers).
| 19% (43) had no license or license status history | 6% (the remaining 13) included four revoked, eight expired,
and one denied license
National research and strategies show around 19% of fatalities involve unlicensed driversUnlicensed drivers have been studied around the nation. The AAA Foundation for Traffic Safety found 19% of US traffic fatalities involved unlicensed drivers from 2007–2009. This is consistent with Washington’s percentage, which has varied from 18% to 20% since 2006.
The California Department of Motor Vehicles studied 23 years of data (1987–2009), and found that unlicensed drivers were nearly three times more likely to cause a fatal accident than licensed drivers.
There are some strategies to prevent unlicensed driving, such as impounding an unlicensed driver’s vehicle license plates, or providing access to alternative forms of transportation. But no strategies have been proven to be truly effective in reducing unlicensed driving. If proven strategies were found, even then they might not be as effective as the proven strategies to reduce the root causes of unlicensed driver involved fatalities — namely impairment, speeding, and unrestrained occupants, among others.
Unlicensed driver definitionAn unlicensed driver is a person who does not have driving privileges in Washington State. These include drivers who:
| Never obtained a license. | Had their license suspended or revoked by
DOL. | Have an expired license. | Voluntarily surrendered their license. | Had their license invalidated by a court of
law or another state’s licensing agency. | Have a valid out-of-state license but had a
driving incident in Washington, resulting in Washington-based restrictions.
Focus on enforcement against risky behaviorsUnlicensed driving is hard to see. An officer has no idea if a person driving by has a valid license or not. By comparison, speeding, signs of impairment, and not wearing a seatbelt are relatively easy to see. Therefore, by focusing on enforcing against dangerous behaviors — the true cause of crashes — Target Zero partners will get the biggest return on investment for traffic safety.

Washington State laws relating to unlicensed drivers
RCW 46.20.001 License Required
RCW 46.20.207 License Cancellation
RCW 46.20.285 License Revocation
RCW 46.20.291 License Suspension
RCW 46.20.342 License Invalidated
High Risk Behavior
84 High Risk Behavior: Unlicensed Driver Involved
Getting a drivers license saves lives and moneyOne in five unlicensed drivers involved in fatalities had no license history, therefore it’s likely they had no driver training. They might have taken fewer risks if they had received training on the likelihood of costly accidents and tragic outcomes associated with risky driving behaviors.
Unlicensed driving can also impact future social and economic security. Unpaid tickets can damage credit history, which can make it harder to secure housing or jobs.

High
Risk
Be
havi
or
85Washington State Strategic Highway Safety Plan 2016: Target Zero
Strategies for reducing unlicensed driver (UNL) fatalities and serious injuriesObjective Strategies Implementation areas
UNL.1. Restrict mobility of unlicensed drivers through administrative actions and vehicle modifications
UNL.1.1 Mandatory incarceration period for repeat unlicensed driving offenders. (P, NCHRP)
Enforcement
UNL.1.2 Impose electronic monitoring of repeat unlicensed driving offenders. (P, NCHRP)
Enforcement
UNL.1.3 Expand the use of ignition interlock for drivers suspended due to a DUI. (P, CTW)
Enforcement
UNL.1.4 Impound or destroy license plates of vehicles registered to repeat unlicensed driving offenders. (P, NCHRP)
Enforcement
UNL.1.5 Immobilize or impound vehicles registered to repeat unlicensed driving offenders. (P, NCHRP)
Enforcement
UNL.1.6 Allow registrations of vehicles operated by unlicensed drivers to be canceled and license plates denoted with stickers. (P, NCHRP)
Enforcement
UNL.2. Educate public through public awareness initiatives
UNL.2.1 Provide alternative transportation and encourage reduced fares for persons without driving privileges. (P, NCHRP)
Leadership/Policy
UNL.2.2 Emphasize administrative and criminal sanctions for unlicensed driving offenders and re-offenders. (R, NCHRP)
Education
UNL.2.3 Increase public awareness of public transportation options. (U) EducationUNL.3. Enhance enforcement UNL.3.1 Standardize vehicle actions against unlicensed drivers with mandatory
immobilization/impound. (P, NCHRP)Enforcement
UNL.3.2 Create and distribute hot sheets, frequently updated lists of current unlicensed drivers who live in the vicinity and distribute to area enforcement agencies. (R, NCHRP)
Enforcement, Education
UNL.3.3 Enact laws to allow for stopping a vehicle registered to an unlicensed driver (without other cause for stop) to ensure unlicensed driver is not at the wheel. (U)
Enforcement
UNL.3.4 Evaluate the impact of the removal of suspension for failure to appear on non-moving citations. (U)
Leadership/Policy
UNL.4. Enhancement of data gathering and reporting ability
UNL.4.1 Make system changes necessary at WSDOT and DOL to enable analysts to identify unlicensed drivers involved in serious injury crashes. (R, DDACTS)
Leadership/Policy
UNL.4.2 Ensure routine linkage of citations to driver records so appropriate citations may be added to the crash being investigated. (R, NCHRP)
Leadership/Policy
P: Proven R: Recommended U: Unknown
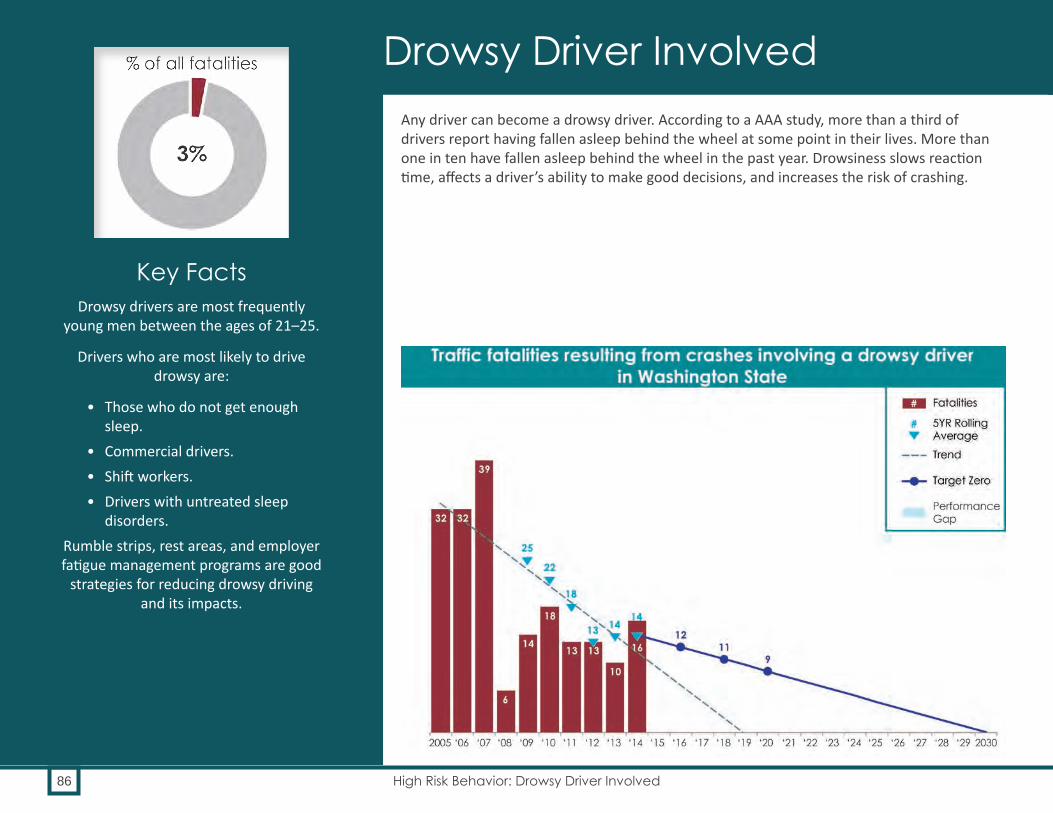
86 High Risk Behavior: Drowsy Driver Involved
Any driver can become a drowsy driver. According to a AAA study, more than a third of drivers report having fallen asleep behind the wheel at some point in their lives. More than one in ten have fallen asleep behind the wheel in the past year. Drowsiness slows reaction time, affects a driver’s ability to make good decisions, and increases the risk of crashing.
Key FactsDrowsy drivers are most frequently
young men between the ages of 21–25.
Drivers who are most likely to drive drowsy are:
• Those who do not get enough sleep.
• Commercial drivers.• Shift workers.• Drivers with untreated sleep
disorders.Rumble strips, rest areas, and employer fatigue management programs are good
strategies for reducing drowsy driving and its impacts.
Drowsy Driver Involved

87Washington State Strategic Highway Safety Plan 2016: Target Zero
OverviewDrowsy driving was a factor in 39 traffic deaths and 194 serious injuries from 2012 to 2014. During that same time, drowsy driving accounted for roughly 3% of the state’s total traffic deaths, and 3% of serious injuries. Data on drowsy driving are most likely underreported since drivers may be reluctant to admit they dozed off prior to a crash. A 2014 AAA study estimates that drowsiness was involved in one in five fatal crashes nationwide.
A driver who has been awake for 18 hours experiences cognitive impairment similar to that of a driver with a blood alcohol content (BAC) of .05. After 24 hours of being awake, a driver’s impairment is similar to a BAC of .10 or higher.
What’s NewData on drowsy driving is most likely under-
reported since drivers may be reluctant to admit they dozed off prior to a crash. A 2014 AAA study estimates that drowsiness
was involved in one in five fatal crashes nationwide.
Priority 1
Priority 2
Priority 3

88 High Risk Behavior: Drowsy Driver Involved
Alcohol, drugs, and over-the-counter and prescription medications can contribute to drowsiness. In Washington, if a driver’s ability to drive has been affected by alcohol or drugs, including inducing drowsiness, then the driver could be charged with driving under the influence.
Drowsy driving fatalities are likely underreported, since confirmation relies on self-reporting by the involved drivers. When drivers perish in the crashes, it is usually not possible to confirm that they were drowsy. Similarly, drivers involved in serious injury crash might be hesitant to self-report that they fell asleep at the wheel. AAA estimates that drowsy driving is a factor in one of five fatal crashes nationally. Washington State data shows less than 3% of fatal crashes, and slightly more than 3% of serious injury crashes, are drowsy driving related. Because of the small number of events in the fatality data set (only 39), partners use serious injury data (194 events) to better understand the circumstances surrounding these types of crashes.
Between 2012–2014, 70% of drowsy driver involved serious injury crashes involved a single vehicle. Sixty-two percent occur during standard daytime working hours (5 a.m–6 p.m.), contrary to the popular belief that most drowsy driving happens at night. Four out of five of these serious injury crashes occurred on weekends (Friday 6 p.m. to Monday 5 a.m.).
Meanwhile, between 2012–2014, 60% of drowsy driver involved fatal crashes involved a single vehicle. Fifty-seven percent occurred during standard daytime working hours (5 a.m.–6 p.m.). Sunday crashes were slightly more frequent at 20%, but crashes occurred on every day of the week, with each day experiencing between 11–14% of the crashes.
Contributing circumstances and factorsMany circumstances can contribute to drowsy driving, including lack of sleep, too much time on the road without stopping, shift work, and untreated sleep disorders such as sleep apnea. It’s difficult to prove a crash-causing driver was drowsy, so the numbers are likely underreported. The majority of drowsy-driver-involved fatalities and serious injuries occur on highways or interstates, where people often travel long, monotonous distances.
According to the Center for Sleep Disorders, up to 20% of crashes that occur on monotonous roads can be attributed to sleepiness. Two sleep disorders in particular can cause drivers to fall asleep at the wheel:
| Insomnia is a sleep disorder characterized by difficulty falling asleep or staying asleep. It affects an estimated 11% of the US population. People who experience insomnia are two to three times more likely to be involved in a motor vehicle crash than people without insomnia.
| Sleep apnea is a breathing disorder causing brief interruptions of breathing during sleep. The National Sleep Foundation estimates that about 4% of men and 2% of women have sleep apnea. Drivers who have untreated sleep apnea are six times more likely to be involved in a crash.
New guidelines have been drafted to provide health care practitioners with a framework for the evaluation and management of sleepy driving. Center for Disease Control (CDC) representatives report that addressing the issue of drowsy driving requires the combined effort of physicians, patients, and policy makers.
High Risk Behavior

89Washington State Strategic Highway Safety Plan 2016: Target Zero
Washington State laws relating to drowsy driving
Washington has no laws specific to drowsy driving, but depending on the circumstances a drowsy driver may be charged with:
| RCW 46.61.5249 Negligent driving | RCW 46.61.500 Reckless driving
Programs and successes
Engineering can prevent drowsy driving, or mitigate its effectsWSDOT is addressing drowsy driving crashes through several engineering interventions, including shoulder and centerline rumble strips, cable guard rails, and cable median barriers. In addition, WSDOT owns and operates 48 rest areas within the state to encourage drivers to stop and rest along their journeys. Most facilities are open 24 hours a day, seven days a week, and offer a free coffee program.
Drowsy Driving Prevention Week promotes educationThe National Sleep Foundation’s Drowsy Driving Prevention Week® is observed in November each year, just prior to annual heavy Thanksgiving travel. This campaign provides public education about the underreported risks of driving while drowsy, and advocates for countermeasures to improve safety on the road.
High
Risk
Be
havi
or

90 High Risk Behavior: Drowsy Driver Involved
Strategies for reducing drowsy driving (DRO) fatalities and serious injuriesObjective Strategies Implementation areas
DRO.1. Use roadway engineering to reduce the consequence of drowsy driving
DRO.1.1 Implement shoulder and centerline rumble strips. (P, NCHRP) EngineeringDRO.1.2. Implement roadway improvements to reduce the likelihood and severity of
drowsy driving crashes involving run-off-the-road and head-on. (P, NCHRP)Engineering
DRO.1.3 Improve rest area access, security, and services. (R, NCHRP) EngineeringDRO.2. Increase driver
awareness of the risks of drowsy driving
DRO.2.1 Conduct drowsy driving education campaigns targeting the general driving population. (R, NCHRP)
Education
DRO.2.2 Provide education regarding medical conditions and medications that increase a driver’s risk of drowsy driving. (U)
Education
P: Proven R: Recommended U: Unknown
High Risk Behavior