high resolution two-dimensional electrophoresis as a tool to differentiate wild from farmed cod...
TRANSCRIPT

www.elsevier.com/locate/foodchem
Food Chemistry 102 (2007) 504–510
FoodChemistry
High resolution two-dimensional electrophoresis as a toolto differentiate wild from farmed cod (Gadus morhua) and to assess
the protein composition of klipfish
Iciar Martinez *, Rasa Slizyt _e, Egidijus Dauksas
Department of Processing Technolology, SINTEF Fisheries and Aquaculture Ltd., NO-7465 Trondheim, Norway
Received 1 November 2005; received in revised form 10 March 2006; accepted 22 March 2006
Abstract
Tris and CHAPS–urea extracts from wild and farmed cod muscle and from rehydrated cod klipfish fillets were analyzed by one (1DE)and two-dimensional electrophoresis (2DE). 2DE maps of tris extracts from farmed cod differed from the wild in a series of spots of Mw35 and 45 kDa. The CHAPS–urea extracts from farmed cod had a several spots of Mw between 100 and 45 kDa, which were hardlydetectable in wild cod and very prominent in klipfish. Klipfish was clearly different from the other samples: the myosin heavy chainwas hardly detectable in these samples, and the tris extracts contained fewer, and the CHAPS–urea more spots than the correspondingextracts from the raw muscles. Further identification of these potentially diagnostic spots will make it easier the differentiation of farmedfrom wild cod and the evaluation of klipfish processing on the protein content of the product.� 2006 Elsevier Ltd. All rights reserved.
Keywords: Wild cod; Farmed cod; Klipfish; Fish muscle; Myofibrillar proteins; Two-dimensional electrophoresis
1. Introduction
European citizens are entitled by law (CR-EC Nos.2065/2001 and 104/2000) to information on the scientificname, method of production (farmed or wild), and the areain which wild fish was caught or farmed fish underwent thefinal developmental stage. Additional legal requirementsfor the implementation of traceability systems in the foodand feed supply chains in Europe, are laid down in theGeneral Food Law, Regulation 178/2002/EC, whose arti-cle number 18 referring to traceability has become effectivesince 1st January 2005. The EU Food Law defines trace-ability as ‘‘the ability to trace and follow a food, feed,food-producing animal or substance intended to be, orexpected to be incorporated into a food or feed, throughall stages of production, processing and distribution’’.
0308-8146/$ - see front matter � 2006 Elsevier Ltd. All rights reserved.
doi:10.1016/j.foodchem.2006.03.037
* Corresponding author. Tel.: +47 957 09 772; fax: +47 932 70 701.E-mail address: [email protected] (I. Martinez).
Unfortunately, globalization and the consequent avail-ability of unknown, novel species in certain markets,together with the consumer’s willingness to pay higherprices for certain production methods (i.e. organically pro-duced or environmentally friendly) and the lack of analyt-ical methods to verify some product claims, allows theintervention of opportunistic elements and the fraudulentfalsification of product information. The consequencescan be very serious, including allergies and death, in thecase of spoiled or contaminated products.
There are several methods suitable for species identifica-tion in seafood, but not for the unequivocal determinationof wild and farmed cod, or for the life-history of the prod-uct, which are data necessary to verify the traceability doc-umentation of a product and to detect fraud (Martinezet al., 2003).
We are interested in developing analytical techniques toverify product composition and claims that may be of rel-evance for the customers. Our previous works have dealtwith the analyses of proteins and DNA for species and
I. Martinez et al. / Food Chemistry 102 (2007) 504–510 505
breeding stock identification (Martinez et al., 2003; Marti-nez & Friis, 2004) and application of nuclear magnetic res-onance techniques for the authentication of fish products(Aursand, Rainuzzo, & Grasdalen, 1994; Martinez et al.,2003) and of small water soluble bioactive molecules (Mar-tinez et al., 2005). Complementing these works, we decidedto examine the suitability of muscle protein analysis to dif-ferentiate farmed from wild cod due to the fact that pro-teins are the most abundant component in cod muscleand also because it has been shown that the feed composi-tion, and in particular the content of vegetable proteincomponents in the feed, induce alterations in the proteinexpression in rainbow trout liver (Martin et al., 2003).However, we are not aware of works examining the proteinexpression in muscle, which is the most common ediblepart and therefore available for analysis all along the pro-duction chain, from the farm to the dish.
The protein profile of klipfish was also examined inorder to map changes due to the processing and preservingconditions because that information may be of relevanceregarding the protein composition of these products. Inour recent work we have documented that klipfish is poorerin bioactive components than fresh fish (Martinez et al.,2005). Proteins from marine organisms have been shownto exert positive effects on human health, for example onthe blood lipid profiles (Wergedahl et al., 2004) and skeletalmuscle insulin responsiveness (Tremblay, Lavigne, Jac-ques, & Marette, 2003). However, these works used iso-lated and heat-treated salmon protein hydrolysates andpurified cod protein respectively, while human diets aremade up, usually, of processed fish containing whole pro-teins and therefore the protein profile resulting from cer-tain processing conditions deserves closer examination.The suitability of a proteomics approach to map the com-position of seafoods and changes in fish muscle due to lossof freshness has already been examined by several authors(Kjærsgard & Jessen, 2003; Martinez & Friis, 2004; Pine-iro, Barros-Velazquez, Vazquez, Figueras, & Gallardo,2003). However, we are aware of only one work analyzingthe effect of the processing conditions on the protein profileof surimi (Martinez, Solberg, Lauritzsen, & Ofstad, 1992),and of none aiming at identifying the protein profile ofklipfish, a popular product consumed by millions of per-sons in many European and American countries.
This work had two aims: the first was to examine thesuitability of two-dimensional electrophoresis of muscleextracts to differentiate farmed from wild cod and the sec-ond to assess the effect of klipfish processing on the proteincomposition of cod muscle.
2. Materials and methods
2.1. Fish samples
The cod (Gadus morhua) used were wild specimens cap-tured in the Trondheimsfjord in April (n = 10), farmed codfrom the Trondelag region slaughtered in February (n = 5)
and rehydrated klipfish (n = 5). The wild and farmed fisharrived iced at our laboratory within a few hours (under5 h) of having been captured or slaugthered. The cod wereeviscerated and washed, and chops of about 3 cm in widthwere cut and immediately frozen and stored at �80 �C. Forprotein extraction, the chops were placed in a freezer at�20 �C and about 100 mg of white muscle were scrapedwhile the muscle was still frozen. The klipfish had been pur-chased in different local shops and upon arrival to our lab-oratory they were soaked in a ratio fish:cold water of 1:8for 2 days with one change of water after 24 h. Cubes ofapproximately 4 · 4 · 2 cm were frozen stored at �80 �Cand treated as the rest of the cod samples for proteinextraction.
2.2. Protein extraction
The procedure described by Molloy et al. (1998) was fol-lowed using the ReadyPrep Sequential Extraction Kit ofBio-Rad. The muscle (75 mg) were scraped and placed intoa 2 ml Eppendorf tube in ice, where 1 ml of Solution 1(40 mM Tris, measured pH 10.5) was added. The sampleswere homogenized with the tubes in ice and centrifugedat 15,000 rpm in an Eppendorf bench centrifuge for5 min. The supernatants (Tris-extracts) were immediatelycollected and frozen stored at �80 �C, except for an aliquotleft to measure protein content. To the remaining pellet,500 ll of Solution 2 (8 M urea, 4% 3-((3-cholamidopropyl)dimethylamino)-1-propanesulfonate (CHAPS), 2 mM trib-utylphosphine (TBP), 40 mM Tris and 0.2% Pharmalyte 3–10 ampholines) was added. The samples were homogenizedfor 30 s, centrifuged at 15,000 rpm for 5 min, and thesupernatants (CHAPS–urea extracts) were immediatelyfrozen stored at �80 �C, except for an aliquot left to mea-sure protein content. Protein concentration was measuredwith the Bio-Rad RC DC Protein Assay.
2.3. SDS–polyacrylamide gel electrophoresis (SDS–PAGE)of the extracts
The sequential extracts were analyzed by SDS–PAGEaccording to Laemmli (1970) in 14 cm · 16 cm, 0.75 mmthick slab gels. The stacking gel contained 5% acrylamideand 0.13% piperazine diacrylamide and the separating gels15% acrylamide and 0.087% piperazine diacrylamide(Anderson, Baum, & Gesteland, 1973; Hochstrasser, Har-rington, Hochstrasser, Miller, & Merril, 1988; Hochst-rasser, Patchornik, & Merril, 1988). The extracts werediluted to 0.4 mg/ml in Laemmli buffer (4.8% SDS, 1 mMethylenediaminetetraacetic acid (EDTA), 125 mM Tris–HCl, pH 6.8, 5% b-mercaptoethanol, 20% glycerol andsome bromophenol blue). The samples were boiled for5 min, cooled down and frozen stored at �20 �C. Theywere centrifuged prior to loading on the gels to removeundissolved matter. One microgram of protein per samplewas loaded and electrophoresis was carried out at 20 mA/gel until the front reach about 0.5 cm from the bottom of
506 I. Martinez et al. / Food Chemistry 102 (2007) 504–510
the gel. The gels were silver stained (Ansorge, 1983) anddried between two sheets of cellophane. The Low Molecu-lar Weight Calibration Kit for SDS electrophoresis (Amer-sham Biosciences) was used as marker. It contains amixture of markers of molecular mass: 97, 66, 45, 30,20.1 and 14.4 kDa.
2.4. Two-dimensional electrophoresis
2.4.1. First dimension: Isoelectric focusing (IEF)
IEF was performed on 13 cm Immobiline DryStrips pH3–10 (Amersham Biosciences). The strips were individuallyrehydrated overnight at 4 �C in 250 ll of 8 M urea, 2 Mthiourea, 50 mM dithiothreitol (DTT), 1.5% CHAPS, 2%Pharmalyte 3–10, 10 mM Tris–HCl, pH 8.3 and someOrange G containing 100 lg of protein. IEF was per-formed in the Protean IEF System according to the instruc-tions of the manufacturer (Bio-Rad, 2001) at 15 �C asfollows: 30 min at 250 V, followed by 1 h at 4000 V; thenthe voltage was increased to 9000 until 70,000 Vh werereached and afterwards the voltage was decreased to500 V until the run was manually stopped. The strips werestored frozen at �80 �C until ready to run the seconddimension (SDS–PAGE). Prior to SDS–PAGE, the stripswere equilibrated in 6 M urea, 2% SDS, 50 mM Tris, pH8.8, 30% glycerol and 1% DTT for 10 min followed byanother 10 min using the same buffer but with 4.5% iodoa-cetamide instead of DTT. All samples were analyzed indi-vidually and then as pools of 5 fish.
IEF was also performed in rods following O’Farrell’s(1975) procedure as described by Martinez and Christian-sen (1994) in 6 cm · 1 mm rod gels containing 3% acrylam-ide 0.08% piperazine diacrylamide (Hochstrasser et al.,1988), 9 M urea, 2% Nonidet P-40, and 2% 3–10 IsoDaltServalyt ampholines (spread in the 5–7 range). Fortymicrogram of protein diluted in 9.5 M urea, 2% NonidetP-40, 2% 3–10 IsoDalt Servalyt ampholines and 5%b-mercaptoethanol were loaded onto the rods. IEF wasperformed for about 2700 Vh in a Mini Protean III unit(Bio-Rad) according to the instructions of the manufactur-ers. After IEF, the rods were extruded, shortly equilibratedin 62.5 mM Tris–HCl (pH 6.8), 2.3% SDS, 5% b-mercap-toethanol and 20% glycerol, containing bromophenol blueand either immediately loaded onto the second dimensionslab gels or stored frozen at �20 �C for later analysis. Allfish were analyzed individually.
2.4.2. Second dimension: SDS–PAGE
SDS–PAGE was performed according to Laemmli(1970) in 14 cm · 16 cm, 1 mm thick slab gels. The stackinggel contained 5% acrylamide and 0.13% piperazinediacrylamide and the separating gels 12.5% acrylamideand 0.1% piperazine diacrylamide (Hochstrasser, & Pat-chornik, et al.). Electrophoresis was carried out at20 mA/slab until the front reached about 0.5 cm from thebottom of the gel. The stacking gel was omitted in the anal-yses of the Immobiline DryStrips. The gels were silver
stained according to Ansorge (1983) and dried between 2sheets of cellophane.
2.5. Identification of myosin subunits, actin and tropomyosin
No spots have been sequenced as part of this work.However, the bands and spots corresponding to the myosinheavy chains, fast (white) and slow (red) myosin lightchains types 1f, 2f, 3f, 1s and 2s, actin and tropomyosin,from several muscle types (skeletal (white and red) and car-diac) and fish species, including cod skeletal white muscle,had been previously identified by one and two-dimensionalelectrophoresis of electrophoretically isolated native myo-sin and actomyosin (Martinez, Christiansen, Ofstad, &Olsen, 1991; Martinez, Ofstad, & Olsen, 1990; Martinezet al., 1992; Martinez, Bang, Hatlent, & Blix, 1993).
3. Results and discussion
3.1. Analyses of wild and farmed cod
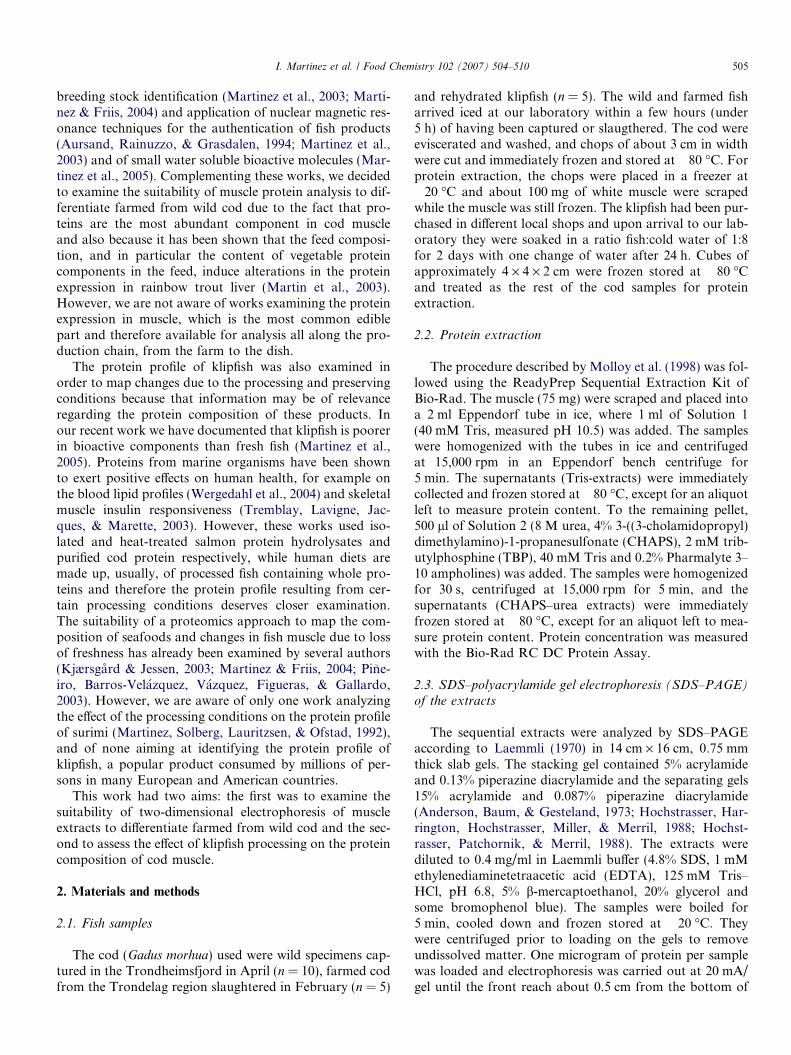
Fig. 1 shows the 1D SDS–PAGE analyses of the Tris(Fig. 1a) and CHAPS–urea (Fig. 1b) extracts from farmedand wild cod. The bands corresponding to the myosinheavy chain, actin, tropomyosin and fast myosin lightchain types 1, 2 and 3, which have been identified by elec-trophoretic analyses of purified native myosin and actomy-osin in previous works (Martinez et al., 1990, 1991, 1992,1993) are indicated in the figure.
Some of the differences between samples of unprocessedwild and farmed cod may be attributed to individual poly-morphisms or to differences in the relative amount of pro-tein loaded. Consistent differences between groups, on theother hand, may be attributed to differences in the produc-tion or processing method. We could not detect any bandin the Tris extracts with potential diagnostic value for theproduction method. In the CHAPS–urea extracts, therewas one band with such potential (labelled with an asteriskin Fig. 1), but the fact that it was present in detectableamounts in only 4 of the 5 farmed samples, limits is value.
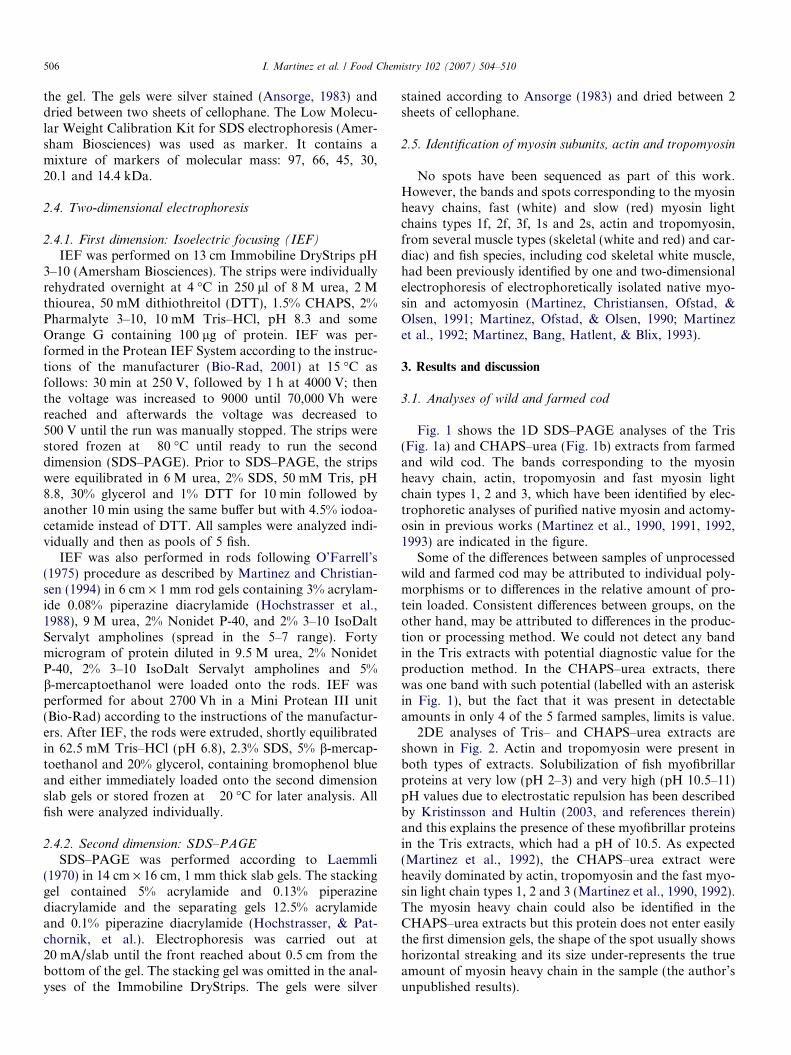
2DE analyses of Tris– and CHAPS–urea extracts areshown in Fig. 2. Actin and tropomyosin were present inboth types of extracts. Solubilization of fish myofibrillarproteins at very low (pH 2–3) and very high (pH 10.5–11)pH values due to electrostatic repulsion has been describedby Kristinsson and Hultin (2003, and references therein)and this explains the presence of these myofibrillar proteinsin the Tris extracts, which had a pH of 10.5. As expected(Martinez et al., 1992), the CHAPS–urea extract wereheavily dominated by actin, tropomyosin and the fast myo-sin light chain types 1, 2 and 3 (Martinez et al., 1990, 1992).The myosin heavy chain could also be identified in theCHAPS–urea extracts but this protein does not enter easilythe first dimension gels, the shape of the spot usually showshorizontal streaking and its size under-represents the trueamount of myosin heavy chain in the sample (the author’sunpublished results).
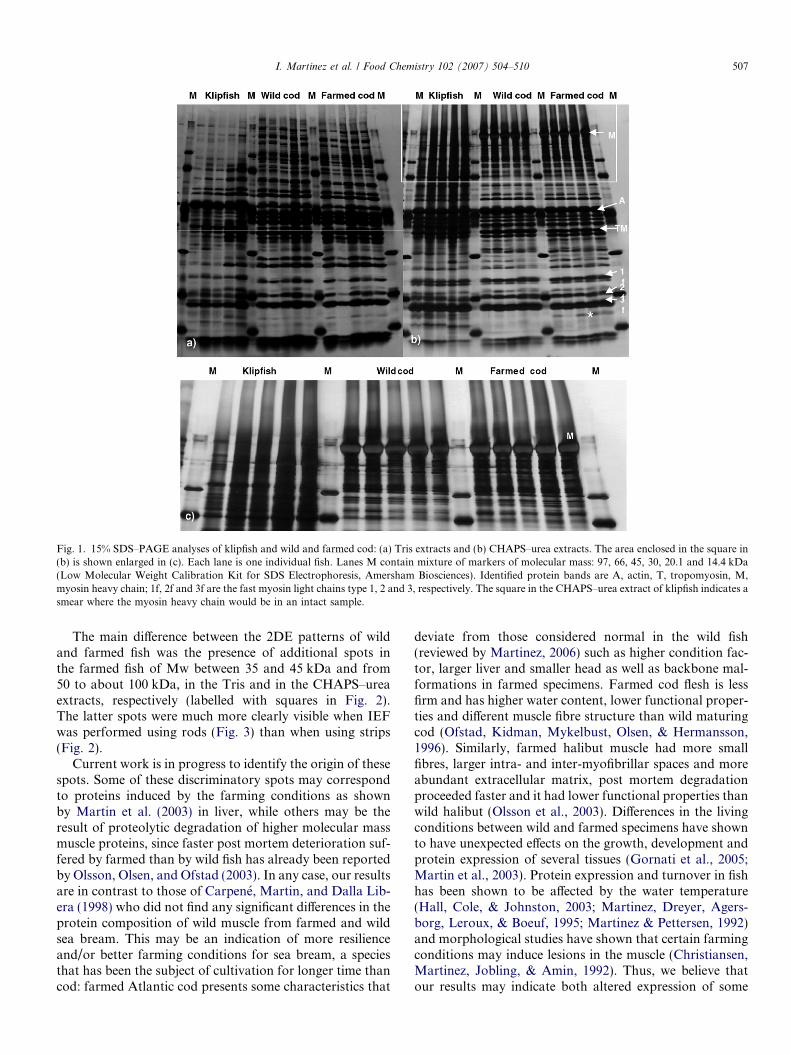
Fig. 1. 15% SDS–PAGE analyses of klipfish and wild and farmed cod: (a) Tris extracts and (b) CHAPS–urea extracts. The area enclosed in the square in(b) is shown enlarged in (c). Each lane is one individual fish. Lanes M contain mixture of markers of molecular mass: 97, 66, 45, 30, 20.1 and 14.4 kDa(Low Molecular Weight Calibration Kit for SDS Electrophoresis, Amersham Biosciences). Identified protein bands are A, actin, T, tropomyosin, M,myosin heavy chain; 1f, 2f and 3f are the fast myosin light chains type 1, 2 and 3, respectively. The square in the CHAPS–urea extract of klipfish indicates asmear where the myosin heavy chain would be in an intact sample.
I. Martinez et al. / Food Chemistry 102 (2007) 504–510 507
The main difference between the 2DE patterns of wildand farmed fish was the presence of additional spots inthe farmed fish of Mw between 35 and 45 kDa and from50 to about 100 kDa, in the Tris and in the CHAPS–ureaextracts, respectively (labelled with squares in Fig. 2).The latter spots were much more clearly visible when IEFwas performed using rods (Fig. 3) than when using strips(Fig. 2).
Current work is in progress to identify the origin of thesespots. Some of these discriminatory spots may correspondto proteins induced by the farming conditions as shownby Martin et al. (2003) in liver, while others may be theresult of proteolytic degradation of higher molecular massmuscle proteins, since faster post mortem deterioration suf-fered by farmed than by wild fish has already been reportedby Olsson, Olsen, and Ofstad (2003). In any case, our resultsare in contrast to those of Carpene, Martin, and Dalla Lib-era (1998) who did not find any significant differences in theprotein composition of wild muscle from farmed and wildsea bream. This may be an indication of more resilienceand/or better farming conditions for sea bream, a speciesthat has been the subject of cultivation for longer time thancod: farmed Atlantic cod presents some characteristics that
deviate from those considered normal in the wild fish(reviewed by Martinez, 2006) such as higher condition fac-tor, larger liver and smaller head as well as backbone mal-formations in farmed specimens. Farmed cod flesh is lessfirm and has higher water content, lower functional proper-ties and different muscle fibre structure than wild maturingcod (Ofstad, Kidman, Mykelbust, Olsen, & Hermansson,1996). Similarly, farmed halibut muscle had more smallfibres, larger intra- and inter-myofibrillar spaces and moreabundant extracellular matrix, post mortem degradationproceeded faster and it had lower functional properties thanwild halibut (Olsson et al., 2003). Differences in the livingconditions between wild and farmed specimens have shownto have unexpected effects on the growth, development andprotein expression of several tissues (Gornati et al., 2005;Martin et al., 2003). Protein expression and turnover in fishhas been shown to be affected by the water temperature(Hall, Cole, & Johnston, 2003; Martinez, Dreyer, Agers-borg, Leroux, & Boeuf, 1995; Martinez & Pettersen, 1992)and morphological studies have shown that certain farmingconditions may induce lesions in the muscle (Christiansen,Martinez, Jobling, & Amin, 1992). Thus, we believe thatour results may indicate both altered expression of some

Fig. 2. 2DE analyses (Immobiline DryStrips, pH 3–10; 12.5% SDS–PAGE) of wild and farmed cod and klipfish samples, as indicated in thefigure. To the left, Tris- and to the right CHAPS–urea extracts. Thesamples shown are pools of 5 individuals. A, actin, T, tropomyosin, M,myosin heavy chain; 1, 2 and 3 are the fast myosin light chains type 1, 2and 3, respectively. The circle in the CHAPS–urea extract of klipfishindicates the area where the myosin heavy chain would be in an intactsample. Spots mentioned in the text, are enclosed in the squares. The blacklines to the right of the upper gel indicate the position of the markers ofmolecular mass: 97, 66, 45, 30 and 20.1 kDa.
Fig. 3. 2DE analyses (Mini IEF-rods pH 3–10; 12.5% SDS–PAGE) ofCHAPS–urea extracts of wild and farmed cod and klipfish samples, asindicated in the figure. Each gel corresponds to one fish. A, actin, T,tropomyosin, M, myosin heavy chain. The circle shows the area where themyosin heavy chain should have been. Spots mentioned in the text areenclosed in the squares. Only the relevant part of the gels is shown. Theblack lines to the right of the upper gel indicate the position of the markersof molecular mass: 97, 66, and 45 kDa.
508 I. Martinez et al. / Food Chemistry 102 (2007) 504–510
proteins and higher muscle protein degradation and turn-over in farmed than in wild cod.
3.2. Analyses of klipfish
Fig. 1 shows the 1D SDS–PAGE analyses of the Tris(Fig. 1a) and CHAPS–urea (Fig. 1b) extracts from klipfish.The Tris extract from klipfish showed a loss of most of theproteins present in the Tris extracts from the unprocessedmuscles, with the exception of the band corresponding toactin that was more prominent. The CHAPS–urea extractof these products were characterized by large smears andprominent bands in particular in the region above50 kDa (absent in the CHAPS–urea extracts of unpro-cessed cod) and absence of the band corresponding to myo-sin heavy chain, which was notorious in the unprocessed
samples. Also in the 2DE gels of klipfish most of the spotscharacteristic of the Tris extracts from unprocessed musclewere absent. Both the Tris and the CHAPS–urea extractsof klipfish were dominated by actin, tropomyosin and themyosin light chains (Fig. 2). Interestingly, the CHAPS–urea extracts had many more spots than their unprocessedcounterparts, including those corresponding to proteinsextractable only with tris in the muscle samples.
High resolution 1H NMR analysis of these samplesrevealed the presence of dimethylamine (DMA) in all ofthem (Martinez et al., 2005). Formaldehyde is formed con-comitantly with DMA, and formaldehyde is known toinduce a toughening of the fillet in gadoids because it reactswith the myofibrillar proteins and accelerates their dena-turation and aggregation rates (Ang & Hultin, 1989; DelMazo, Huidobro, Torrejon, Tejada, & Careche, 1994; Tej-ada, Torrejon, Del Mazo, & Careche, 1997). In addition,drying and salting increase protein oxidation and furtherdecrease protein extractability (Lauritzsen, 2004). Thus,proteins that in their native state were low- or high-ionicstrength soluble, and that had suffered denaturation, aggre-gation and proteolysis due to drying, salting and storage,may have been brought back into solution by the harsherCHAPS–urea buffer, in addition to many other spots thatmay originate from the proteolytic degradation of highermolecular mass proteins, including myosin heavy chain,whose band at 200 kDa was absent in these samples. Someof the spots resembled those found in farmed cod (labelledwith squares in Fig. 3, klipfish), but they were more abun-dant and presented higher intensity in klipfish than infarmed fish. Although loss of solubility and protein aggre-gation may have contributed to decreasing the amount ofmyosin extractable by CHAPS–urea, we believe that prote-olysis may have a no less significant role in the origin of thementioned the spots of molecular mass between 100 and50 kDa (Martinez, Friis, & Careche, 2001). Current workis under way to identify the origin of these spots.

I. Martinez et al. / Food Chemistry 102 (2007) 504–510 509
4. Conclusions
The protein patterns of wild and farmed cod seemed toindicate that farmed cod muscle had a different proteinexpression and/or different post mortem degradation pat-tern than wild cod. This may be due to stress during culti-vation, to differences in post mortem muscle conditions (forexample pH, that is altered by feed intake at around thetime of death), and/or to qualitative and quantitative dif-ferences in the expression or regulation of proteases witha role in post mortem muscle tenderdization. In any case,it is important to identify the origin of these discriminatoryspots to improve the farming conditions and obtain anoptimal muscle protein composition.
As could be expected due to the heavy processing condi-tions, the protein pattern of klipfish was very different fromthat of the unprocessed muscles with the most notoriousfeatures being the loss of the myosin heavy chain bandfrom the CHAPS–urea extracts and the loss of many pro-tein bands from the Tris extracts that appeared in theCHAPS–urea extracts. These are the first results we havein the characterization of the effect of salting and dryingon the protein composition of the product. Practical appli-cation of this work requires the inclusion of more samplesmanufactured under known standard and commercial con-ditions in order to find a relationship between the proteinmap, the manufacturing procedure and the quality of thefinal product.
Acknowledgement
The financial support of the Norwegian Research Coun-cil (Project 154 137/130) is gratefully acknowledged.
References
Anderson, C. W., Baum, P. R., & Gesteland, R. F. (1973). Processing ofadenovirus 2-induced proteins. Journal of Virology, 12, 412–423.
Ang, J. F., & Hultin, H. O. (1989). Denaturation of cod myosin duringfreezing after modification with formaldehyde. Journal of Food
Science, 54, 814–818.Ansorge, W. (1983). Fast visualization of protein bands by impregnation
in potassium permanganate and silver nitrate. In D. Stathakos (Ed.),Electrophoresis’82 (pp. 235–242). Berlin, New York: Walter de Gruyter& Co.
Aursand, M., Rainuzzo, J. R., & Grasdalen, H. (1994). Quantitative highresolution 13C and 1H nuclear magnetic resonance of omega�3 fattyacids from white muscle of Atlantic salmon (Salmo salar). Journal of
the Americal Oil Chemists Society, 70, 971–981.Bio-Rad., (2001). In D. Garfin & L. Heerdet (Eds.), 2-D Electrophoresis
for proteomics: A methods and product manual. Available from http://www.biorad.com/LifeScience/pdf/Bulletin_2651.pdf.
Carpene, E., Martin, B., & Dalla Libera, L. (1998). Biochemicaldifferences in lateral muscle of wild and farmed gilthead sea bream(series Sparus aurata L.). Fish Physiology and Biochemistry, 19,229–238.
Christiansen, J. S., Martinez, I., Jobling, M., & Amin, A. B. (1992). Rapidsomatic growth and muscle damage in a salmonid fish. Basic and
Applied Myology, 2, 235–239.Del Mazo, M. L., Huidobro, A., Torrejon, P., Tejada, M., & Careche, M.
(1994). Role of formaldehyde in formation of natural actomyosin
aggregates in hake during frozen storage. Zeitschrift fur Lebensmitte-
luntersuchung und – Forschung, 198, 459–464.Gornati, R., Gualdoni, S., Cavaliere, R., Terova, G., Saroglia, M., &
Bernardini, G. (2005). Molecular biology and fish welfare: a winningcombination. Aquaculture International, 13, 51–55.
Hall, T. E., Cole, N. J., & Johnston, I. A. (2003). Temperature and theexpression of seven muscle-specific protein genes during embryogenesisin the Atlantic cod Gadus morhua L. Journal of Experimental Biology,
206, 3187–3200.Hochstrasser, D. F., Harrington, M. G., Hochstrasser, A. C., Miller, A.
C., & Merril, C. (1988). Methods for increasing resolution of two-dimensional protein electrophoresis. Analytical Biochemistry, 173,424–435.
Hochstrasser, D. F., Patchornik, A., & Merril, C. (1988). Development ofpolyacrylamide gels that improve the separation of proteins and theirdetection by silver staining. Analytical Biochemistry, 173, 412–423.
Kjærsgard, I. V. H., & Jessen, F. (2003). Proteome analysis elucidatingpost mortem changes in cod (Gadus morhua) muscle proteins. Journal
of the Agricultural and Food Chemistry, 51, 3985–3991.Kristinsson, H. G., & Hultin, H. O. (2003). Changes in conformation and
subunit assembly of cod myosin at low and high pH and aftersubsequent refolding. Journal of the Agricultural and Food Chemistry,
51, 7118–7196.Laemmli, U. K. (1970). Cleavage of structural proteins during the
assembly of the head of bacteriophage T4. Nature, 227, 680–685.Lauritzsen, K. (2004). Quality of salted cod (Gadus morhua L.) as
influenced by raw material and salt composition. Dr. Scient Thesis.Norwegian College of Fishery Science. University of Tromsø: Norway.
Martin, S. A. M., Vilhelmsson, O., Medale, F., Watt, P., Kaushik,S., & Houlihan, D. F. (2003). Proteomic sensitivity to dietarymanipulations in rainbow trout. Biochimica Biophysica Acta, 651,17–29.
Martinez, I. (in press). Revision of analytical methodologies to verify theproduction method of fish. In J. B. Luten, C. Jacobsen, K., S. Bekaert,A. æbø, J. Oehlenschlager (Eds.), Seafood from fish to dish, Quality,
safety and processing of wild and farmed fish. Wageningen AcademicPublishers: The Netherlands.
Martinez, I., Aursand, M., Erikson, U., Singstad, T. E., Veliyulin, E., &van der Zwaag, C. (2003). Destructive and non-destructive analyticaltechniques for authentication and composition analyses of foodstuffs.Trends in Food Science and Technology, 14, 489–498.
Martinez, I., Bang, B., Hatlent, B., & Blix, P. (1993). Myofibrillar proteinsin skeletal muscles of parr, smolt and adult Atlantic salmon (Salmo
salar, L.). Comparison with another salmonid, the Artic charr(Salvelinus alpinus L.). Comparative Biochemistry and Physiology,
106B, 1021–1028.Martinez, I., Bathen, T., Standal, I. B., Halvorsen, J., Aursand, M.,
Gribbestad, I. S., & Axelson, D. E. (2005). Bioactive compounds incod (Gadus morhua) products and suitability of 1H NMR metaboliteprofiling for classification of the products using multivariate dataanalyses. Journal of the Agricultural and Food Chemistry, 53,6889–6895.
Martinez, I., & Christiansen, J. S. (1994). Myofibrillar proteins indeveloping white muscle of the Arctic charr (Salvelinus alpinus L.).Comparative Biochemistry and Physiology, 107B, 11–20.
Martinez, I., Christiansen, J. S., Ofstad, R., & Olsen, R. L. (1991).Comparison of myosin isoenzymes present in skeletal and cardiacmuscles of the Arctic charr (Salvelinus alpinus L.). Sequentialexpression of different myosin heavy chains during development ofthe fast white skeletal muscle. European Journal of Biochemistry, 195,743–753.
Martinez, I., Dreyer, B., Agersborg, A., Leroux, A., & Boeuf, G. (1995).Effects of T3 and rearing temperature on growth and skeletal myosinheavy chain isoform transition during early development in thesalmonid (Salvelinus alpinus L.). Comparative Biochemistry and Phys-
iology, 112B, 717–725.Martinez, I., & Friis, T. J. (2004). Application of proteome analysis to
seafood authentication. Proteomics, 4, 347–354.

510 I. Martinez et al. / Food Chemistry 102 (2007) 504–510
Martinez, I., Friis, T. J., & Careche, M. (2001). Post mortem muscleprotein degradation during ice-storage of arctic (Pandalus borealis) andtropical (Penaeus japonicus and P. monodon) shrimps: a comparativeelectrophoretical and immunological study. Journal of the Science of
Food and Agriculture, 81, 1199–1208.Martinez, I., Ofstad, R., & Olsen, R. L. (1990). Electrophoretic study of
myosin isoforms in white muscles of some teleost fishes. Comparative
Biochemistry and Physiology, 96B, 221–227.Martinez, I., & Pettersen, G. W. (1992). Temperature-induced precocious
transitions of myosin heavy chain isoforms in the white muscle of theArctic charr (Salvelinus alpinus). Basic and Applied Myology, 2,89–95.
Martinez, I., Solberg, C., Lauritzsen, C., & Ofstad, R. (1992). Two-dimensional electrophoretic analyses of cod (Gadus morhua L.) wholemuscle proteins, water soluble fraction and surimi. Effect of theaddition of CaCl2 and MgCl2 during the washing procedure. Applied
and Theoretical Electrophoresis, 2, 201–206.Molloy, M. P., Herbert, B. R., Walsh, B. J., Tyler, M. I., Traini, M.,
Sanchez, J. C., Hochstrasser, D. F., Williams, K. L., & Gooley, A. A.(1998). Extraction of membrane proteins by differential solubilizationfor separation using two-dimensional gel electrophoresis. Electropho-
resis, 19, 837–844.O’Farrell, P. H. (1975). High resolution two-dimensional electrophoresis
of proteins. Journal of Biological Chemistry, 250, 4007–4021.Ofstad, R., Kidman, S., Mykelbust, R., Olsen, R. L., & Hermansson, A.
M. (1996). Liquid-holding capacity and structural change sin commi-
nuted salmon (Salmo salar) muscle as influenced by pH, salt andtemperature. LWT- Food Science and Technology, 29, 173–183.
Olsson, G. B., Olsen, R. L., & Ofstad, R. (2003). Post mortem structuralcharacteristics and water-holding capacity in Atlantic halibut muscle.LWT- Food Science and Technology, 36, 125–133.
Pineiro, C., Barros-Velazquez, J., Vazquez, J., Figueras, A., &Gallardo, J. M. (2003). Proteomics as a tool for the investigationof seafood and other marine products. Journal of Proteome
Research, 2, 127–135.Tejada, M., Torrejon, P., Del Mazo, M. L., & Careche, M. (1997). Effect
of freezing and formaldehyde on solubility of natural actomyosinisolated from cod (Gadus morhua), hake (Merluccius merluccius) andblue whiting (Micromesistius poutassou). In J. B. Luten, T. Borrensen,& J. Oehlenschlager (Eds.). Developments in food science. Seafood
from producer to consumer, integrated approach to quality (38,pp. 265–280). Amsterdam, The Netherlands: Elsevier SciencePublishers.
Tremblay, F., Lavigne, C., Jacques, H., & Marette, A. (2003). Dietary codprotein restores insulin-induced activation of phosphatidylinositol 3-kinase/Akt and GLUT4 translocation to the T-tubules in skeletalmuscle of high-fat-fed obese rats. Diabetes, 52, 29–37.
Wergedahl, H., Liaset, B., Gudbrandsen, O. A., Lied, E., Espe, M., Muna,Z., Mork, S., & Berge, R. K. (2004). Fish protein hydrolysate reducesplasma total cholesterol, increases the proportion of HDL cholesterol,and lowers acyl-CoA: cholesterol acyltransferase activity in liver ofZucker rats. Journal of Nutrition, 134, 1320–1327.