high energy density sciencephotonscience.slac.stanford.edu/.../talks/rlee_hed_physics.pdf · high...
TRANSCRIPT
High Energy Density Science
and
Free-electron LasersP. Audebert, H. Baldis, J. Benage, M. Bergh, C. Caleman, R. Cauble, P. Celliers, M.H. Chen, H.K.Chung, G. Collins, M. Fajardo, R. Falcone, R. Fedosejevs, E. Foerster, J. Gauthier, S. Glenzer, E.Glover, G. Gregori, J. Hajdu, P. Heimann, S. L. Johnson, L. Juha, F. Y. Khattak, J. Krzywinski, R. W. Lee,A. Lindenbergh, J. Meyer-ter-Vehn, S. Moon, T. Möller, W .L. Morgan, M. Murillo, A. Nelson, A. Ng, Y.Ralchenko, R. Redmer, D. Riley, F. Rogers, S. J. Rose, F. Rosmej, W . Rozmus, R. Schuch, H. A. Scott,T. Schenkel, D. Schneider, J. R. Seely, R. Sobierajski, K. Sokolowski-Tinten, T. Stoelker, S. Toleikis, T.Tschentscher, H. W abnitz, J. S. W ark., K. W idmann, P. Zeitoun…
LULI, UC Davis, LANL, Uppsala, LLNL, IST-GoLP, UC Berkeley, Jena, CELIA, LBNL, RAL,Stanford, PSI/SLS, Czech Academy, QU Belfast, Polish Academy, SLAC, MPI, TU Berlin , Kinema,NIST, Stockholm, Rostock, AW E, Marseille, Alberta, W arsaw, Essen, GSI, DESY, Oxford, LIXAM…
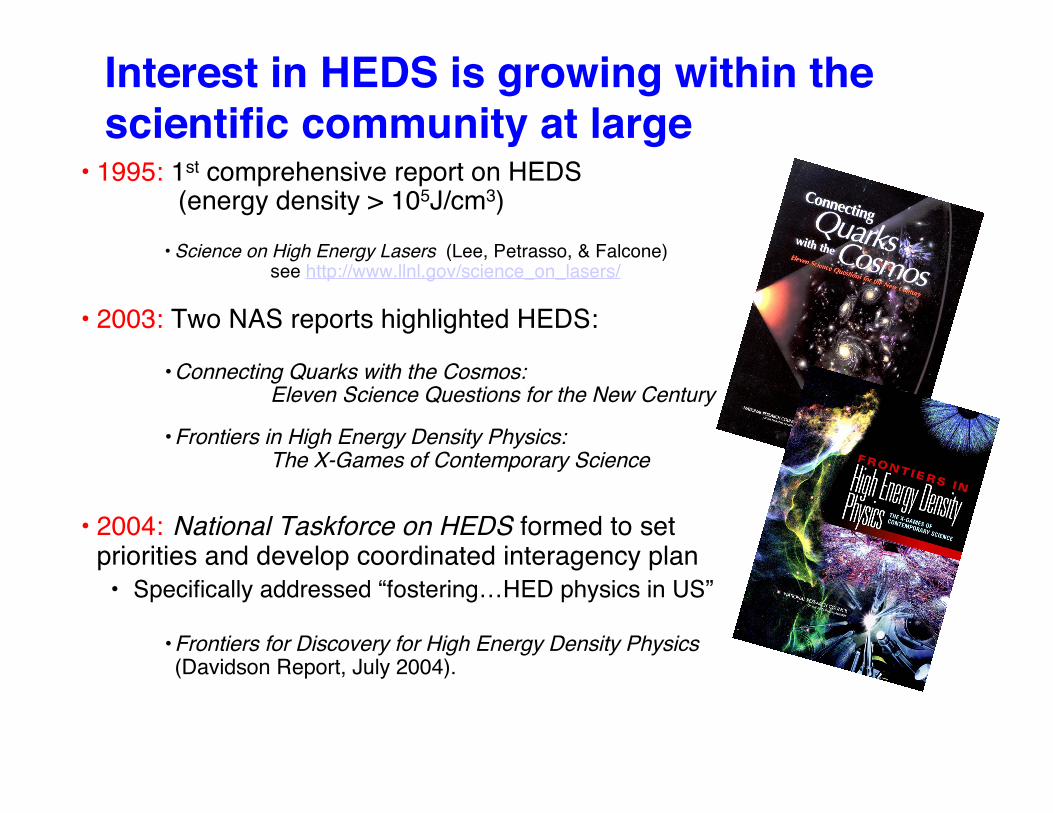
• 1995: 1st comprehensive report on HEDS (energy density > 105J/cm3)
• Science on High Energy Lasers (Lee, Petrasso, & Falcone)see http://www.llnl.gov/science_on_lasers/
• 2003: Two NAS reports highlighted HEDS:
• Connecting Quarks with the Cosmos:Eleven Science Questions for the New Century
• Frontiers in High Energy Density Physics:The X-Games of Contemporary Science
• 2004: National Taskforce on HEDS formed to setpriorities and develop coordinated interagency plan• Specifically addressed “fostering…HED physics in US”
• Frontiers for Discovery for High Energy Density Physics(Davidson Report, July 2004).
Interest in HEDS is growing within thescientific community at large
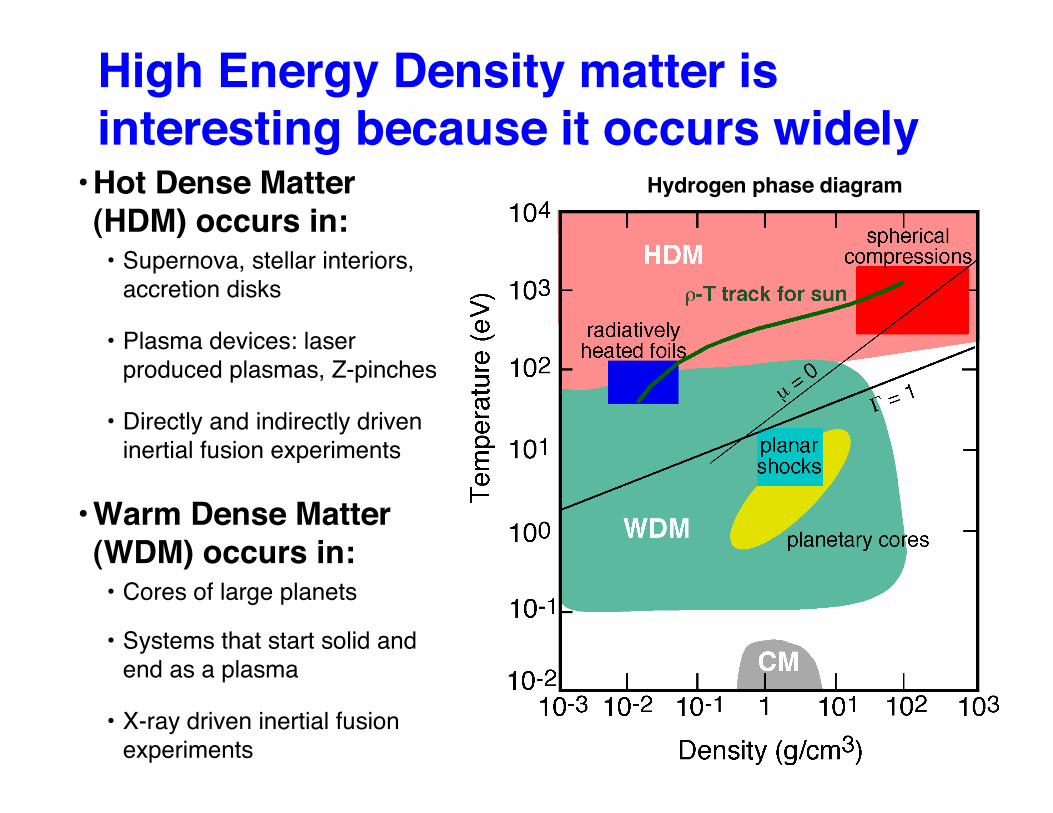
High Energy Density matter isinteresting because it occurs widely
• Hot Dense Matter(HDM) occurs in:• Supernova, stellar interiors,
accretion disks
• Plasma devices: laserproduced plasmas, Z-pinches
• Directly and indirectly driveninertial fusion experiments
• Warm Dense Matter(WDM) occurs in:• Cores of large planets
• Systems that start solid andend as a plasma
• X-ray driven inertial fusionexperiments
HED
WDM
Hydrogen phase diagram
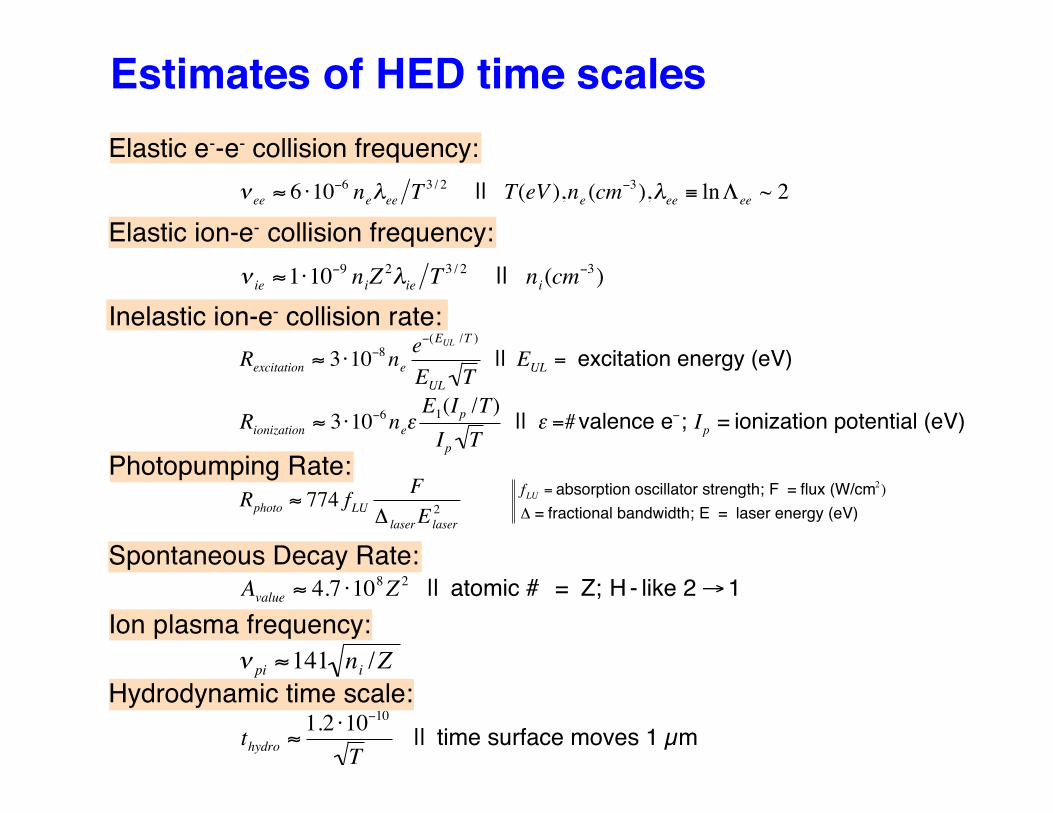
Estimates of HED time scalesElastic e--e- collision frequency:
Elastic ion-e- collision frequency:
Inelastic ion-e- collision rate:
Photopumping Rate:
Spontaneous Decay Rate:
Ion plasma frequency:
Hydrodynamic time scale:
!
"ee# 6 $10
%6ne&eeT3 / 2
|| T(eV ),ne(cm
%3),&
ee' ln(
ee~ 2
!
"ie#1$10
%9niZ2&
ieT3 / 2
|| ni(cm
%3)
!
Rexcitation
" 3 #10$8ne
e$(E
UL/T )
EUL
T || E
UL= excitation energy (eV)
!
Rionization " 3 #10$6ne%
E1(Ip /T)
Ip T || % =#valence e$; Ip = ionization potential (eV)
!
Rphoto " 774 fLUF
# laserElaser
2
!
fLU = absorption oscillator strength; F = flux (W/cm2
)
" = fractional bandwidth; E = laser energy (eV)
!
Avalue
" 4.7 #108Z2 || atomic # = Z; H - like 2 $1
!
" pi #141 ni /Z
!
thydro "1.2 #10
$10
T || time surface moves 1 µm
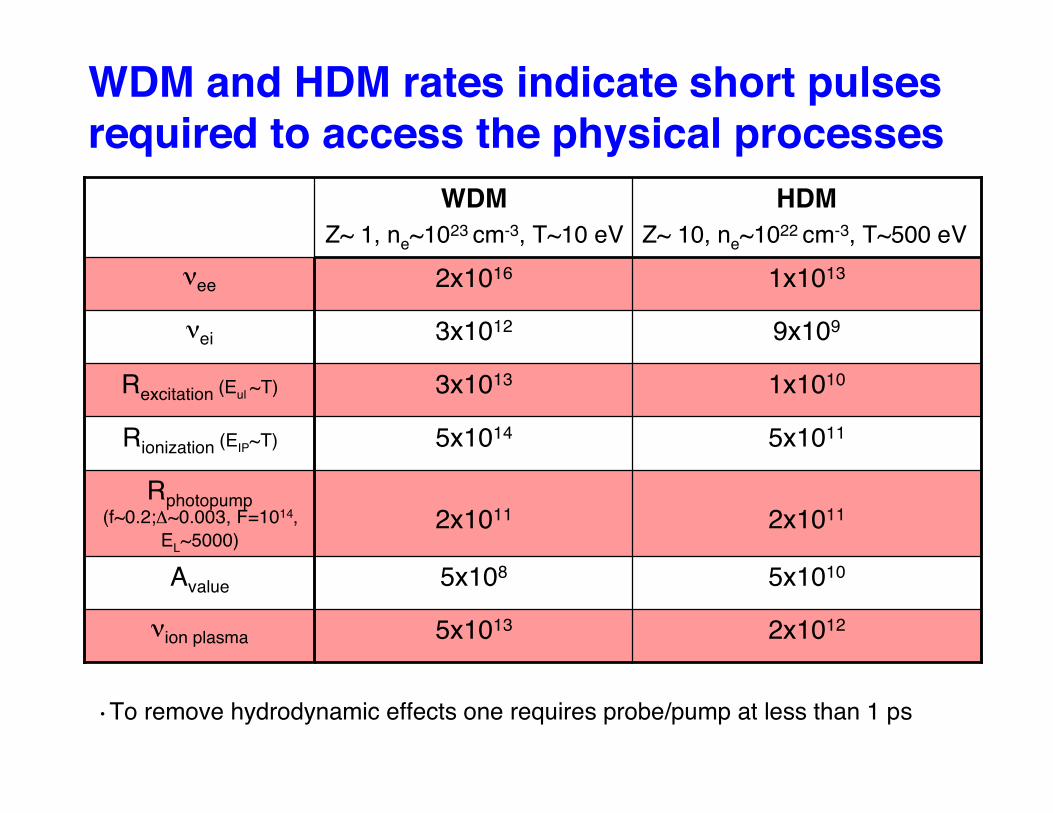
WDM and HDM rates indicate short pulsesrequired to access the physical processes
2x10125x1013νion plasma
5x10105x108Avalue
2x10112x1011Rphotopump
(f~0.2;Δ~0.003, F=1014,EL~5000)
5x10115x1014Rionization (EIP~T)
1x10103x1013Rexcitation (Eul ~T)
9x1093x1012νei
1x10132x1016νee
HDMZ~ 10, ne~1022 cm-3, T~500 eV
WDMZ~ 1, ne~1023 cm-3, T~10 eV
• To remove hydrodynamic effects one requires probe/pump at less than 1 ps
Hot DenseMatter
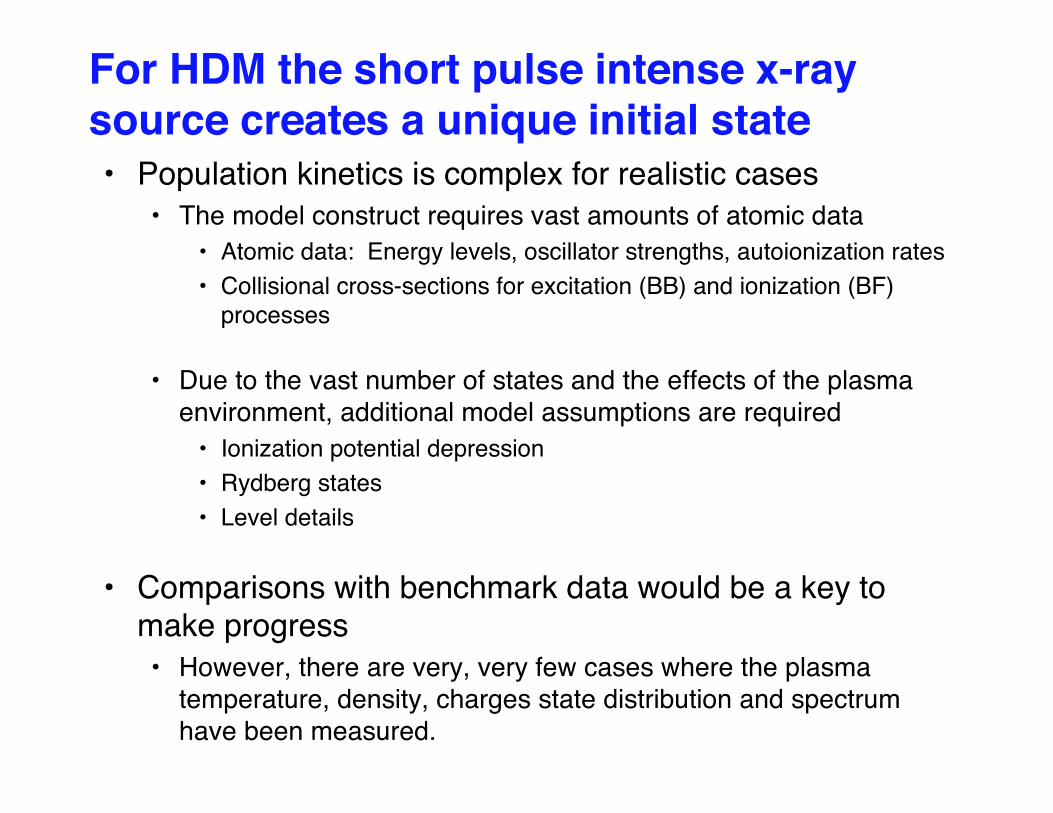
For HDM the short pulse intense x-raysource creates a unique initial state• Population kinetics is complex for realistic cases
• The model construct requires vast amounts of atomic data• Atomic data: Energy levels, oscillator strengths, autoionization rates• Collisional cross-sections for excitation (BB) and ionization (BF)
processes
• Due to the vast number of states and the effects of the plasmaenvironment, additional model assumptions are required
• Ionization potential depression• Rydberg states• Level details
• Comparisons with benchmark data would be a key tomake progress• However, there are very, very few cases where the plasma
temperature, density, charges state distribution and spectrumhave been measured.
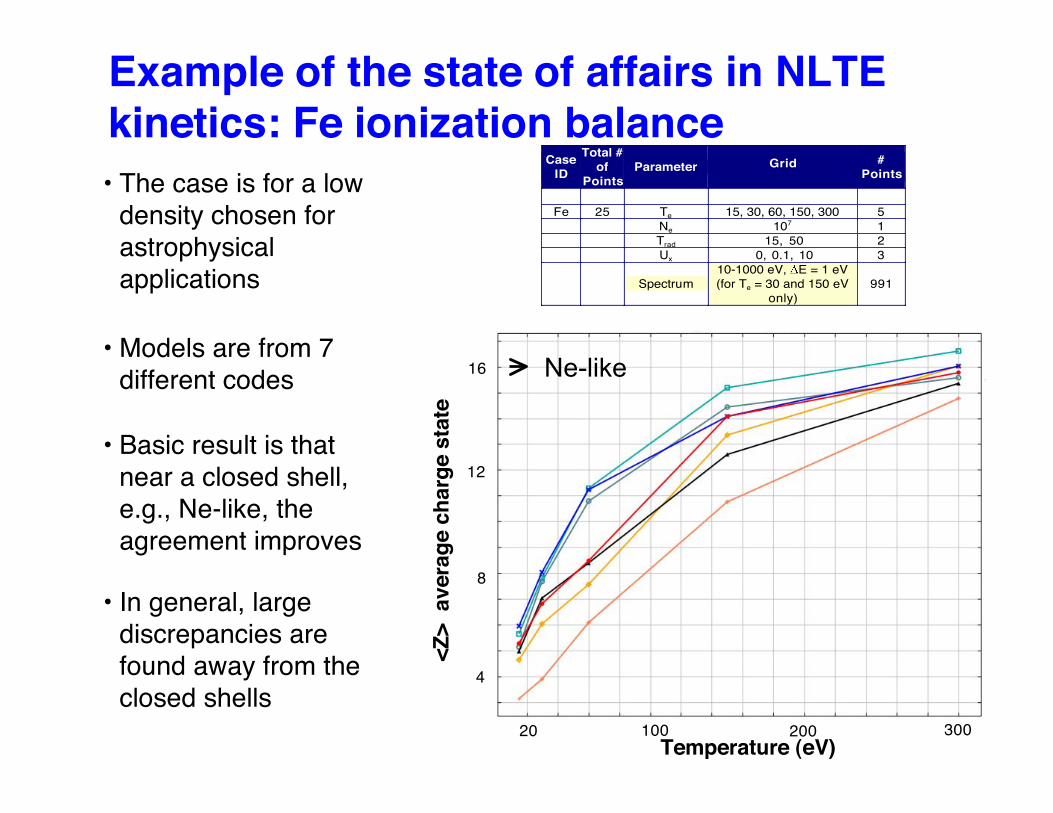
Example of the state of affairs in NLTEkinetics: Fe ionization balance• The case is for a low
density chosen forastrophysicalapplications
• Models are from 7different codes
• Basic result is thatnear a closed shell,e.g., Ne-like, theagreement improves
• In general, largediscrepancies arefound away from theclosed shells
Ne-like
<Z>
ave
rage
cha
rge
stat
e
Temperature (eV)
Case
ID
Total #
of
Points
Parameter Grid #
Points
Fe 25 Te 15, 30, 60, 150, 300 5
Ne 107 1
Trad 15, 50 2
Ux 0, 0.1, 10 3
Spectrum
10-1000 eV, E = 1 eV
(for Te = 30 and 150 eV
only)
991
8
4
12
16
20 100 200 300
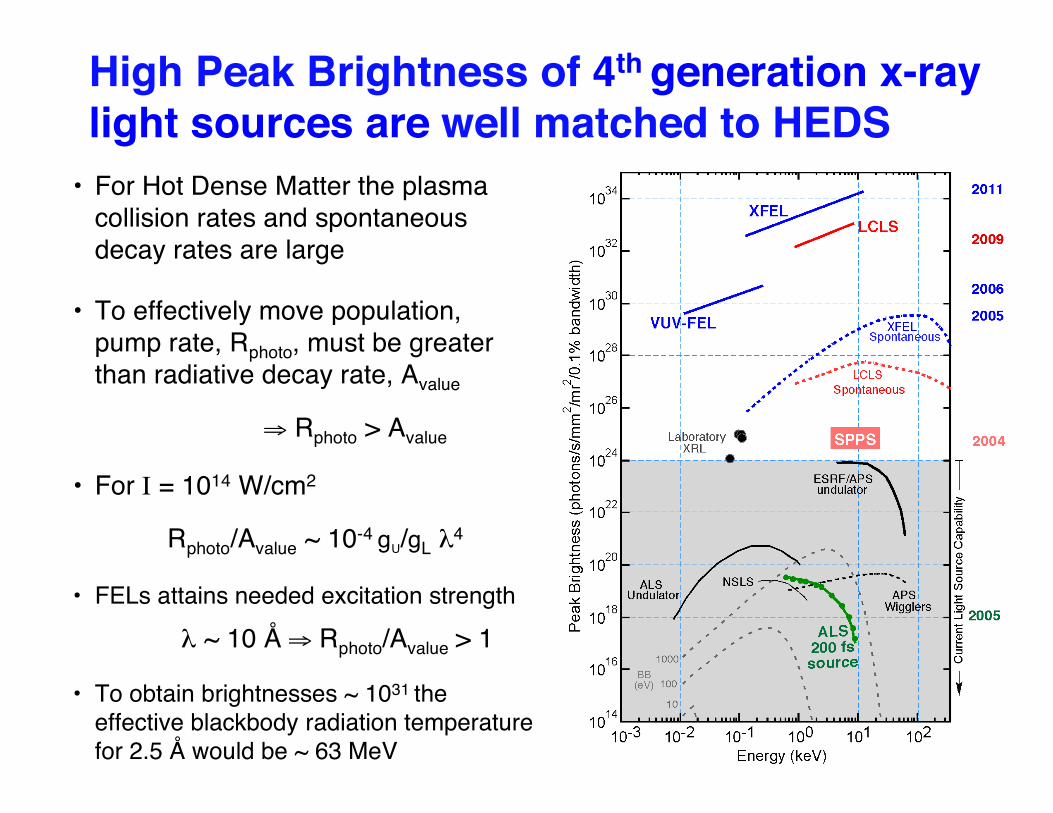
High Peak Brightness of 4th generation x-raylight sources are well matched to HEDS
• For Hot Dense Matter the plasmacollision rates and spontaneousdecay rates are large
• To effectively move population,pump rate, Rphoto, must be greaterthan radiative decay rate, Avalue
⇒ Rphoto > Avalue
• For I = 1014 W/cm2
Rphoto/Avalue ~ 10-4 gU/gL λ4
• FELs attains needed excitation strength
λ ~ 10 Å ⇒ Rphoto/Avalue > 1
• To obtain brightnesses ~ 1031 theeffective blackbody radiation temperaturefor 2.5 Å would be ~ 63 MeV
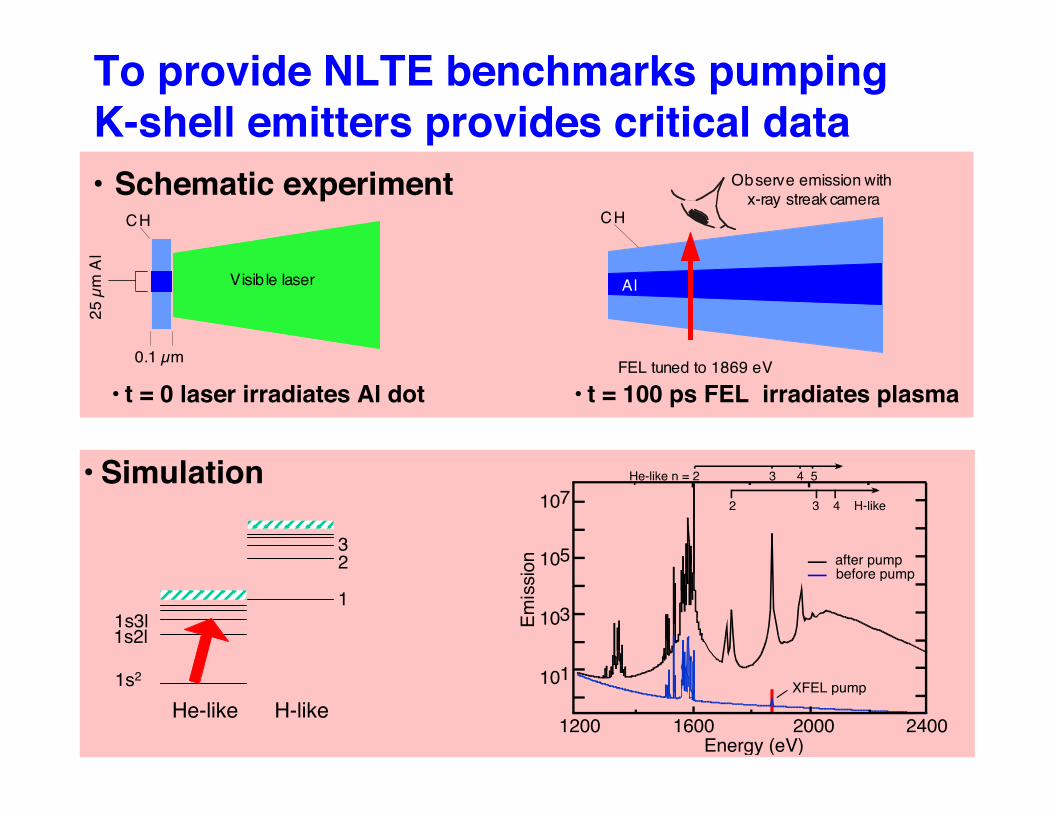
To provide NLTE benchmarks pumpingK-shell emitters provides critical data• Schematic experiment
CH
Visib le laser
0.1 µm
25 µ
m A
l
• t = 0 laser irradiates Al dot • t = 100 ps FEL irradiates plasma
CH
Al
FEL tuned to 1869 eV
Observe emission with x-ray streak camera
• Simulation
He-like H-like1s2
1s2l1s3l
1
23
107
2400200016001200Energy (eV)
after pump before pump
XFEL pump
Em
issio
n
He-like n = 2 3 4 5
2 3 4 H-like
105
103
101
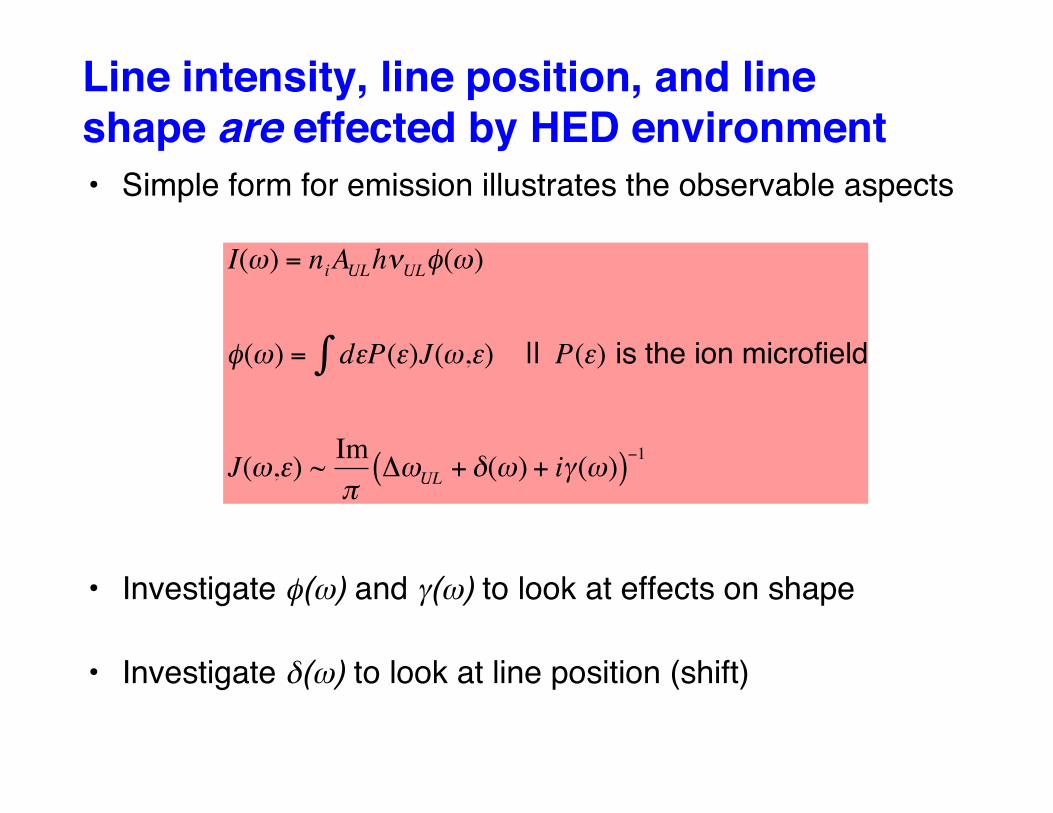
• Simple form for emission illustrates the observable aspects
• Investigate φ(ω) and γ(ω) to look at effects on shape
• Investigate δ(ω) to look at line position (shift)
Line intensity, line position, and lineshape are effected by HED environment
!
I(") = niAULh#
UL$(")
$(") = d%P(%)J(",%) || P(%) is the ion microfield&
J(",%) ~Im
'("
UL+ )(") + i*(")( )
+1
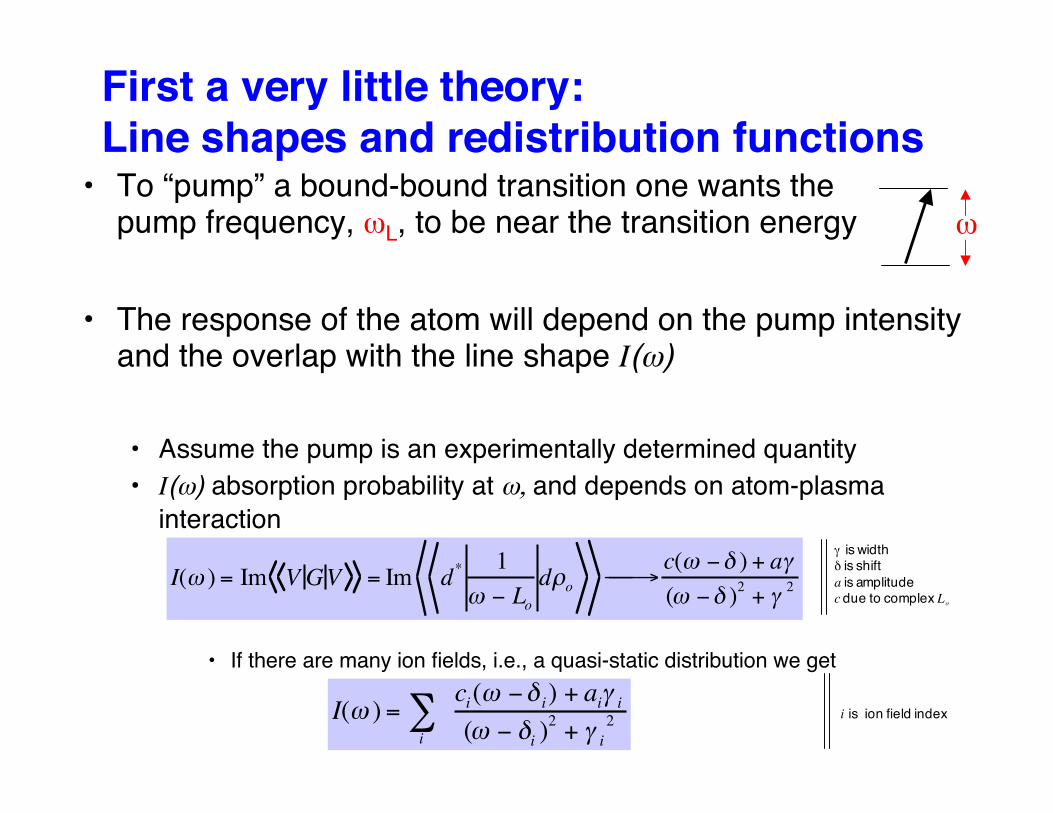
• To “pump” a bound-bound transition one wants thepump frequency, ωL, to be near the transition energy
• The response of the atom will depend on the pump intensityand the overlap with the line shape I(ω)
• Assume the pump is an experimentally determined quantity• I(ω) absorption probability at ω, and depends on atom-plasma
interaction• Assume we have fast electrons impacts and a static ion field
• If there are many ion fields, i.e., a quasi-static distribution we get
First a very little theory:Line shapes and redistribution functions
I(! ) =i
"ci(! #$
i) + a
i%i
(! # $i)2+ %
i
2i is ion field index
γ is widthδ is shifta is amplitudec due to complex Lo
I(! ) = Im V GV = Im d* 1
! " Lo
d#o
$ % $ c(! "& ) + a'
(! "& )2
+ '2
ω
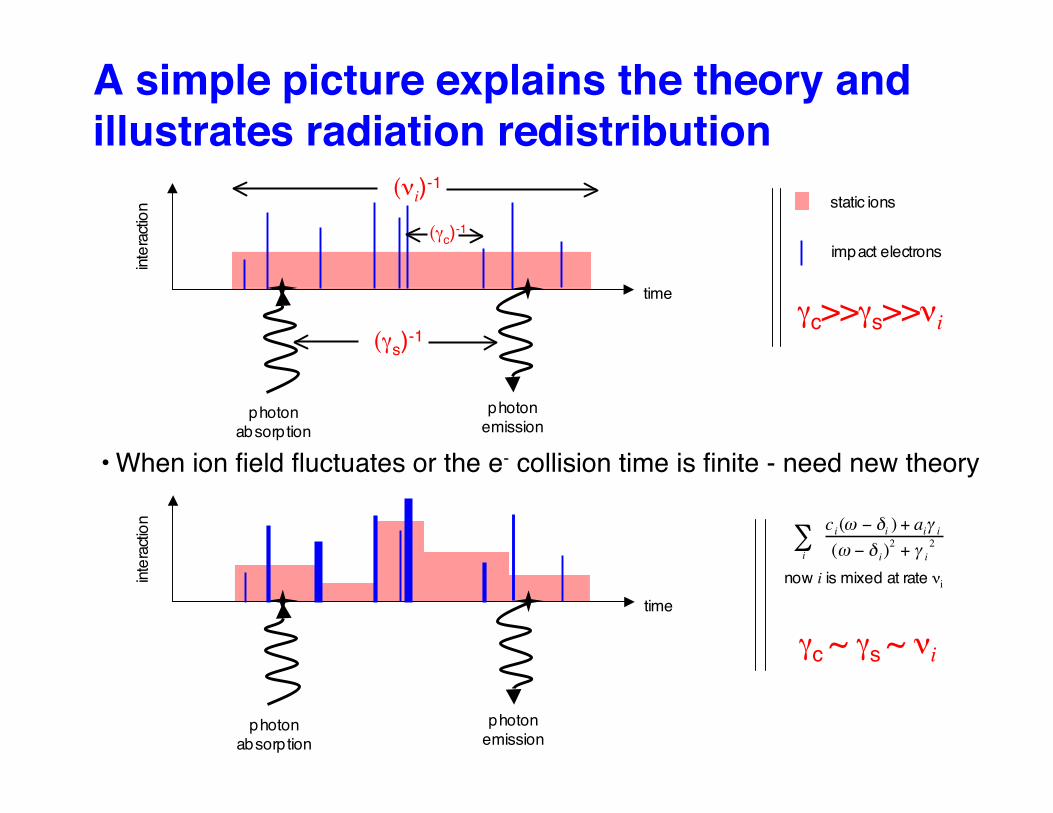
A simple picture explains the theory andillustrates radiation redistribution
impact electrons
static ions
• When ion field fluctuates or the e- collision time is finite - need new theory
time
inter
actio
n
photonabsorption
photonemission
i
!ci(" # $
i) + a
i%i
(" # $i)2+ %
i
2
now i is mixed at rate νi
time
inter
actio
n
photonabsorption
photonemission
(γs)-1
(γc)-1
(νi)-1
γc>>γs>>νi
γc ~ γs ~ νi
Using an XFEL to pump within a linetransition is fundamentally important
• Measuring redistribution within a Stark-broadened bound-bound profile
• Assumption of complete redistribution within a profilecan be invalid; but, depend on
• ion field fluctuations rates
• inelastic collision rates
• Measuring the detailed redistribution of population bypumping within a transition can indicate relative plasmarate process
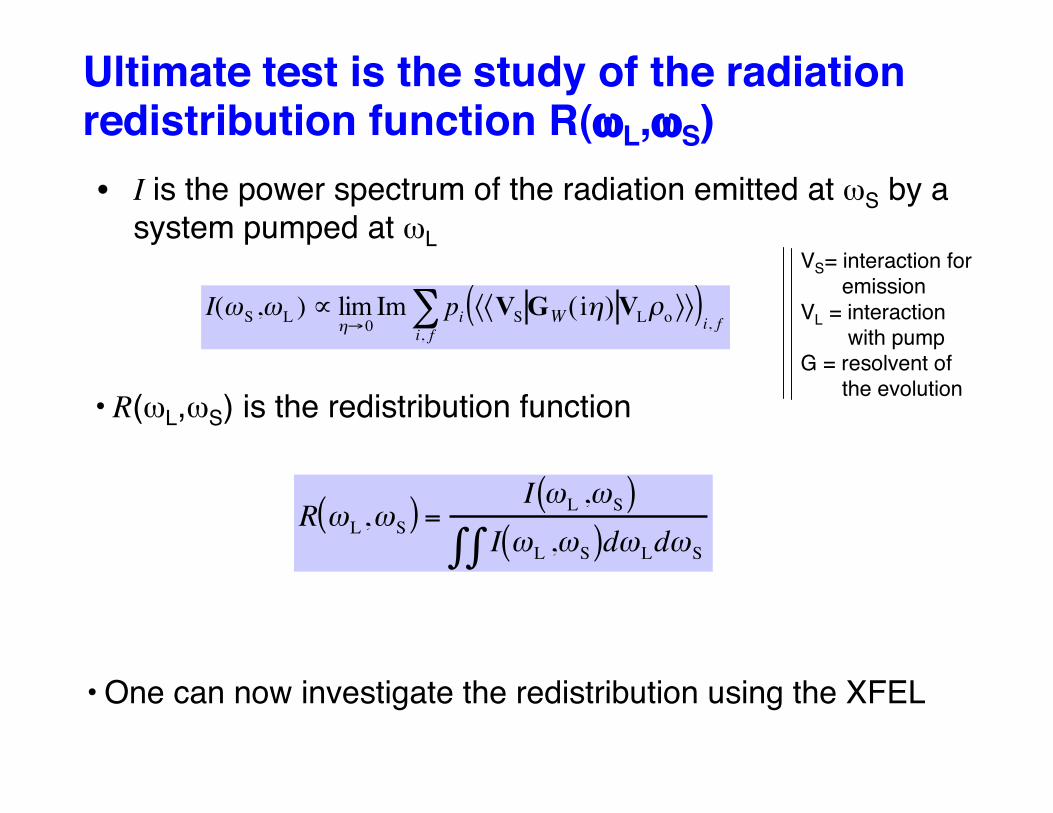
Ultimate test is the study of the radiationredistribution function R(ωL,ωS)• I is the power spectrum of the radiation emitted at ωS by a
system pumped at ωL
I(!S ,!L ) " lim#$0Im pi %%VS GW ( i#) VL&o ''( )
i, fi, f
(
R !L,!
S( ) =
I !L,!
S( )I !
L,!
S( )d!Ld!
S""
• R(ωL,ωS) is the redistribution function
VS= interaction for emissionVL = interaction with pumpG = resolvent of the evolution
• One can now investigate the redistribution using the XFEL
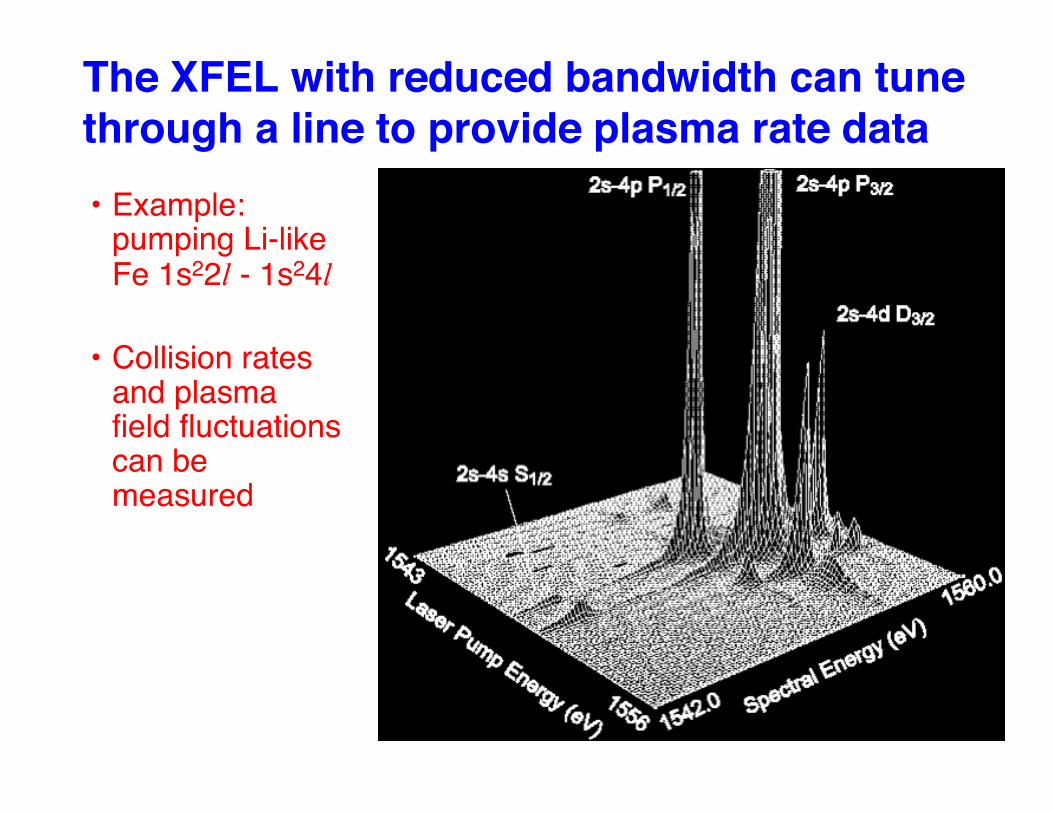
The XFEL with reduced bandwidth can tunethrough a line to provide plasma rate data• Example:
pumping Li-likeFe 1s22l - 1s24l
• Collision ratesand plasmafield fluctuationscan bemeasured
Warm DenseMatter
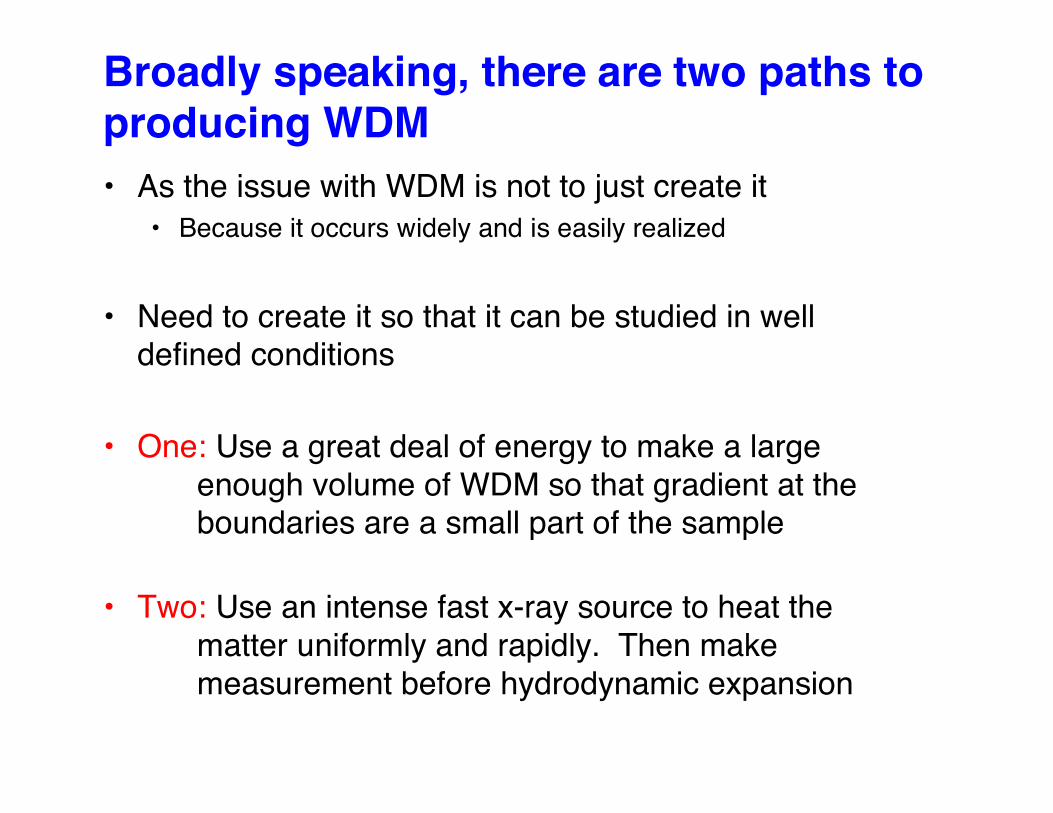
Broadly speaking, there are two paths toproducing WDM• As the issue with WDM is not to just create it
• Because it occurs widely and is easily realized
• Need to create it so that it can be studied in welldefined conditions
• One: Use a great deal of energy to make a large enough volume of WDM so that gradient at the boundaries are a small part of the sample
• Two: Use an intense fast x-ray source to heat the matter uniformly and rapidly. Then make measurement before hydrodynamic expansion
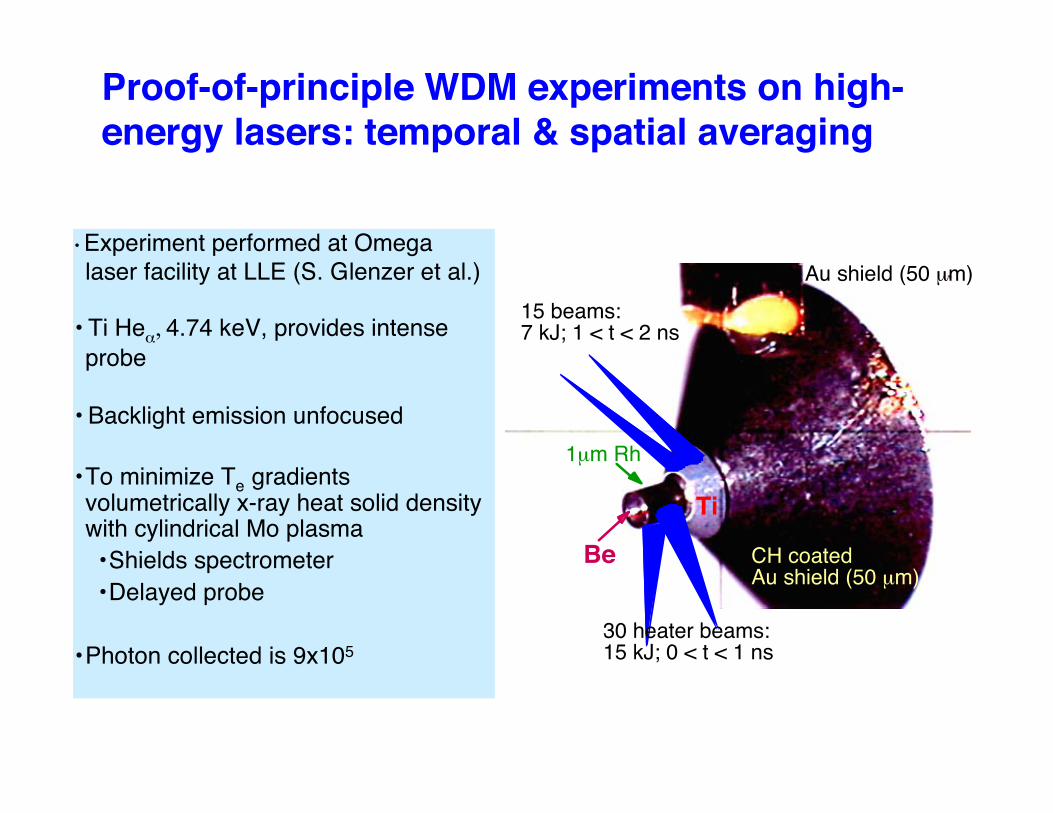
Proof-of-principle WDM experiments on high-energy lasers: temporal & spatial averaging
Be CH coated Au shield (50 µm)
Ti
Au shield (50 µm)
1µm Rh
15 beams:7 kJ; 1 < t < 2 ns
30 heater beams:15 kJ; 0 < t < 1 ns
• Experiment performed at Omegalaser facility at LLE (S. Glenzer et al.)
• Ti Heα, 4.74 keV, provides intenseprobe
• Backlight emission unfocused
• To minimize Te gradientsvolumetrically x-ray heat solid densitywith cylindrical Mo plasma• Shields spectrometer• Delayed probe
• Photon collected is 9x10⁵
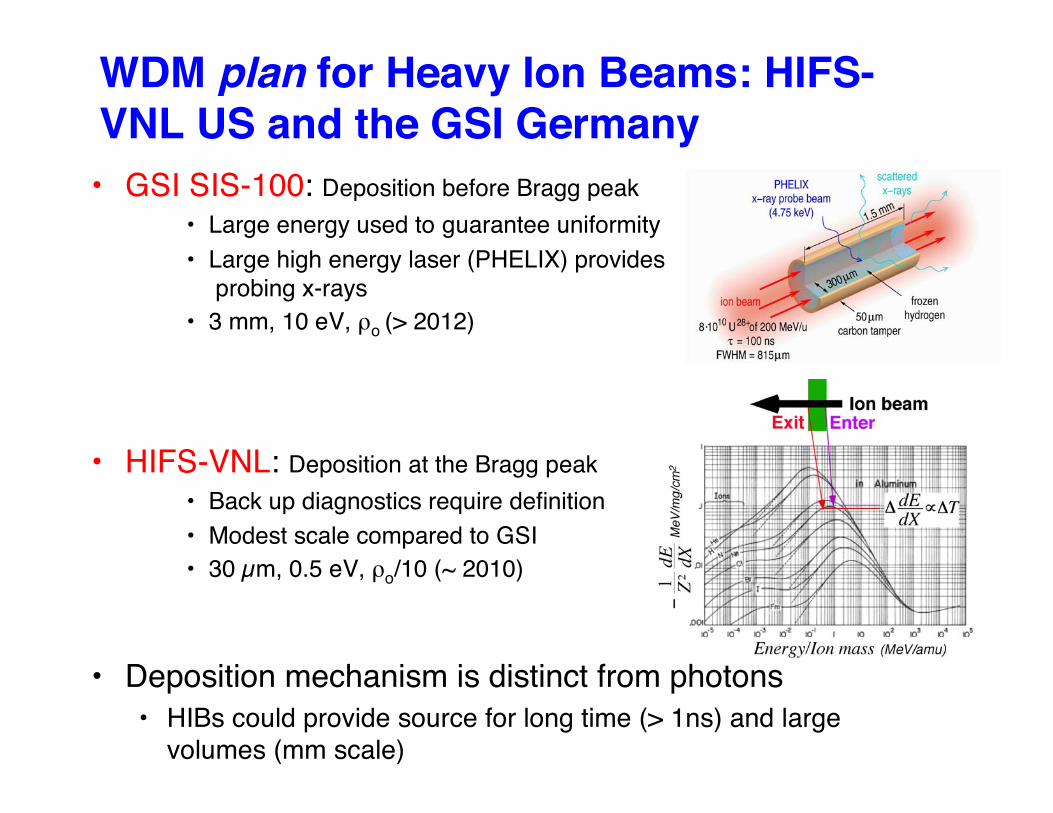
WDM plan for Heavy Ion Beams: HIFS-VNL US and the GSI Germany
• GSI SIS-100: Deposition before Bragg peak• Large energy used to guarantee uniformity• Large high energy laser (PHELIX) provides
probing x-rays• 3 mm, 10 eV, ρo (> 2012)
• HIFS-VNL: Deposition at the Bragg peak• Back up diagnostics require definition• Modest scale compared to GSI• 30 µm, 0.5 eV, ρo/10 (~ 2010)
• Deposition mechanism is distinct from photons• HIBs could provide source for long time (> 1ns) and large
volumes (mm scale)
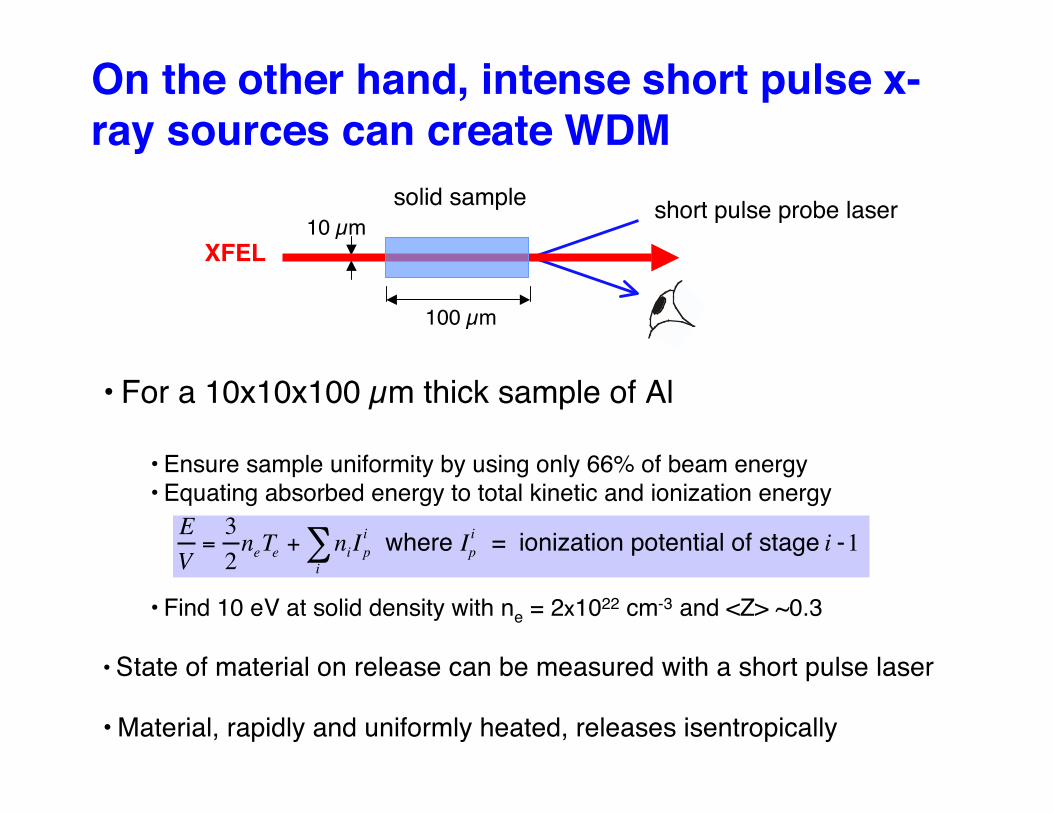
On the other hand, intense short pulse x-ray sources can create WDM
• For a 10x10x100 µm thick sample of Al
• Ensure sample uniformity by using only 66% of beam energy• Equating absorbed energy to total kinetic and ionization energy
• Find 10 eV at solid density with ne = 2x1022 cm-3 and <Z> ~0.3
• State of material on release can be measured with a short pulse laser
• Material, rapidly and uniformly heated, releases isentropically
E
V=3
2neTe + ni
i
! Ipi where Ip
i = ionization potential of stage i -1
XFEL10 µm
100 µm
solid sample short pulse probe laser
classical plasma
denseplasma
! = 1
! = 10
Density ( g/cm3)
103
104
101
102
102 104100
10-4 10-2 1
! = 100
highdensitymatter
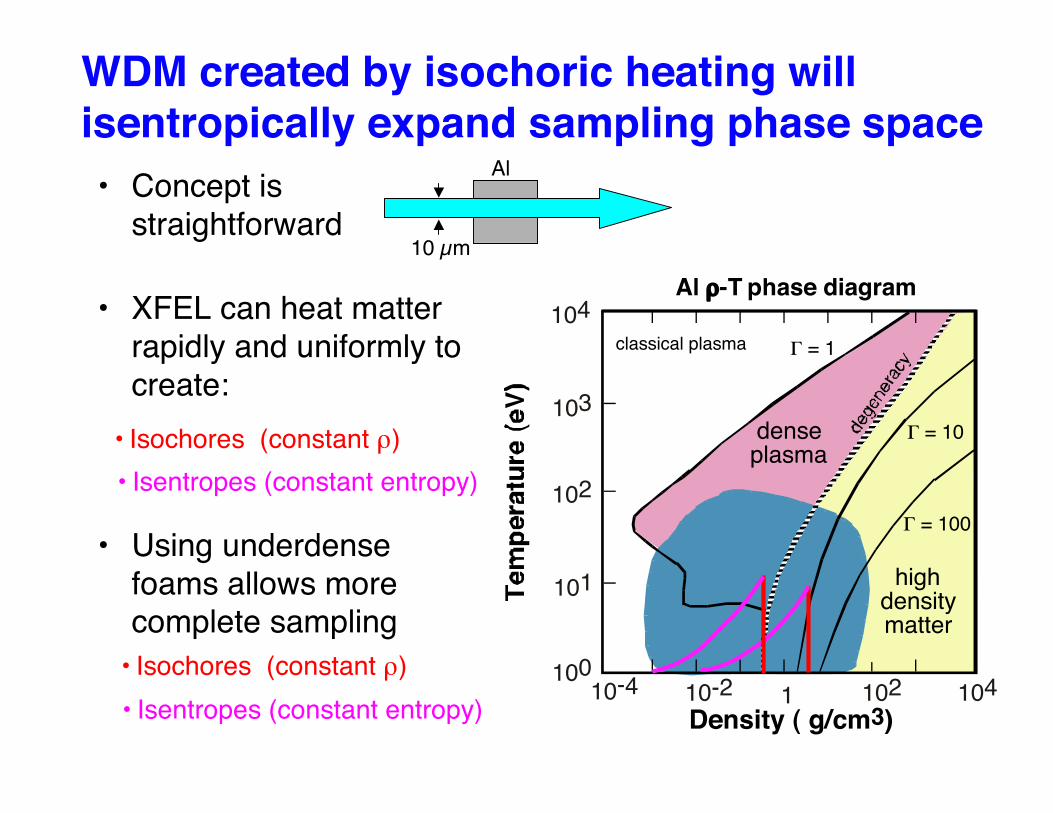
WDM created by isochoric heating willisentropically expand sampling phase space• Concept is
straightforward
• XFEL can heat matterrapidly and uniformly tocreate:
• Using underdensefoams allows morecomplete sampling
Al
10 µm
Al ρ-T phase diagram
• Isochores (constant ρ)• Isentropes (constant entropy)
• Isochores (constant ρ)• Isentropes (constant entropy)
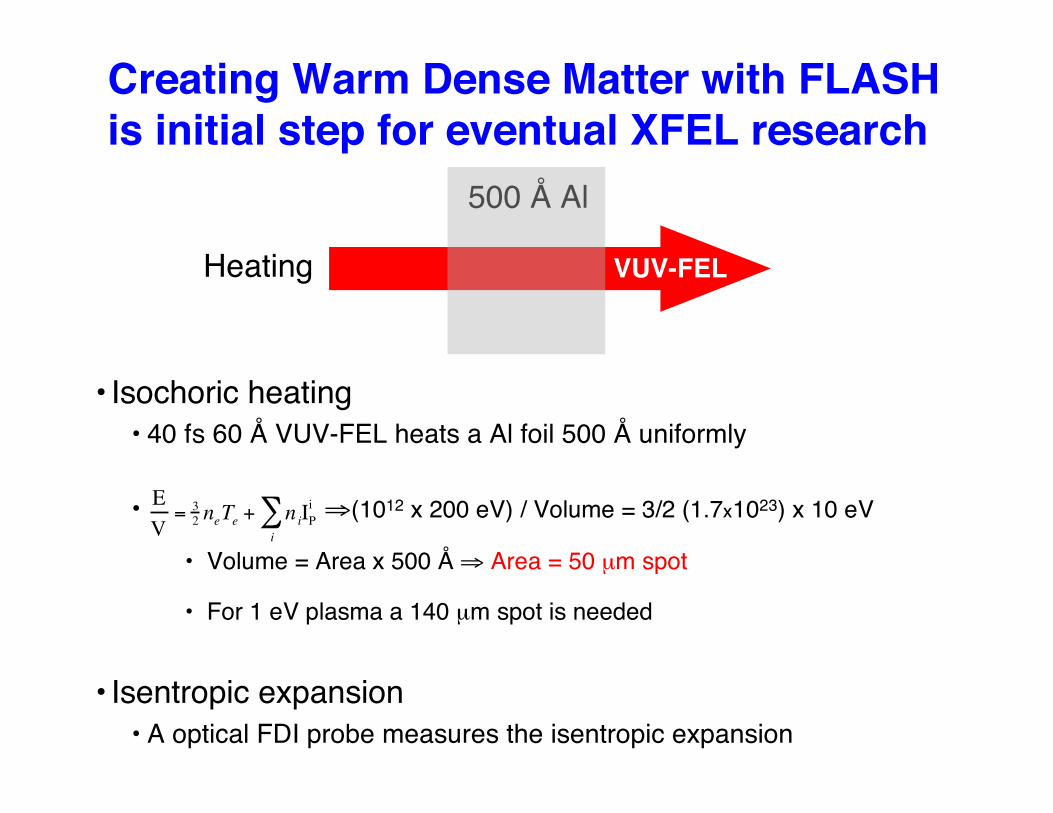
Creating Warm Dense Matter with FLASHis initial step for eventual XFEL research
• Isochoric heating• 40 fs 60 Å VUV-FEL heats a Al foil 500 Å uniformly
• ⇒(1012 x 200 eV) / Volume = 3/2 (1.7x1023) x 10 eV
• Volume = Area x 500 Å ⇒ Area = 50 µm spot
• For 1 eV plasma a 140 µm spot is needed
• Isentropic expansion• A optical FDI probe measures the isentropic expansion
!
E
V= 3
2neTe
+ niIP
i
i
"
Heating
500 Å Al
VUV-FEL
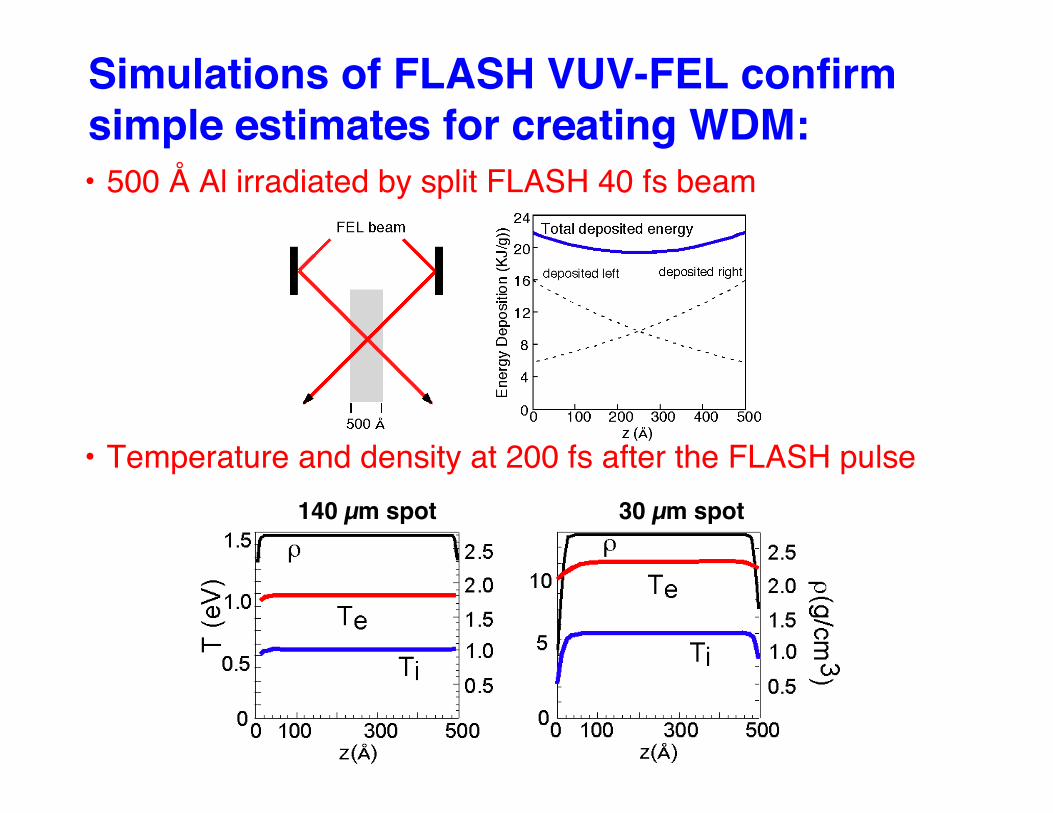
Simulations of FLASH VUV-FEL confirmsimple estimates for creating WDM:• 500 Å Al irradiated by split FLASH 40 fs beam
• Temperature and density at 200 fs after the FLASH pulse140 µm spot 30 µm spot
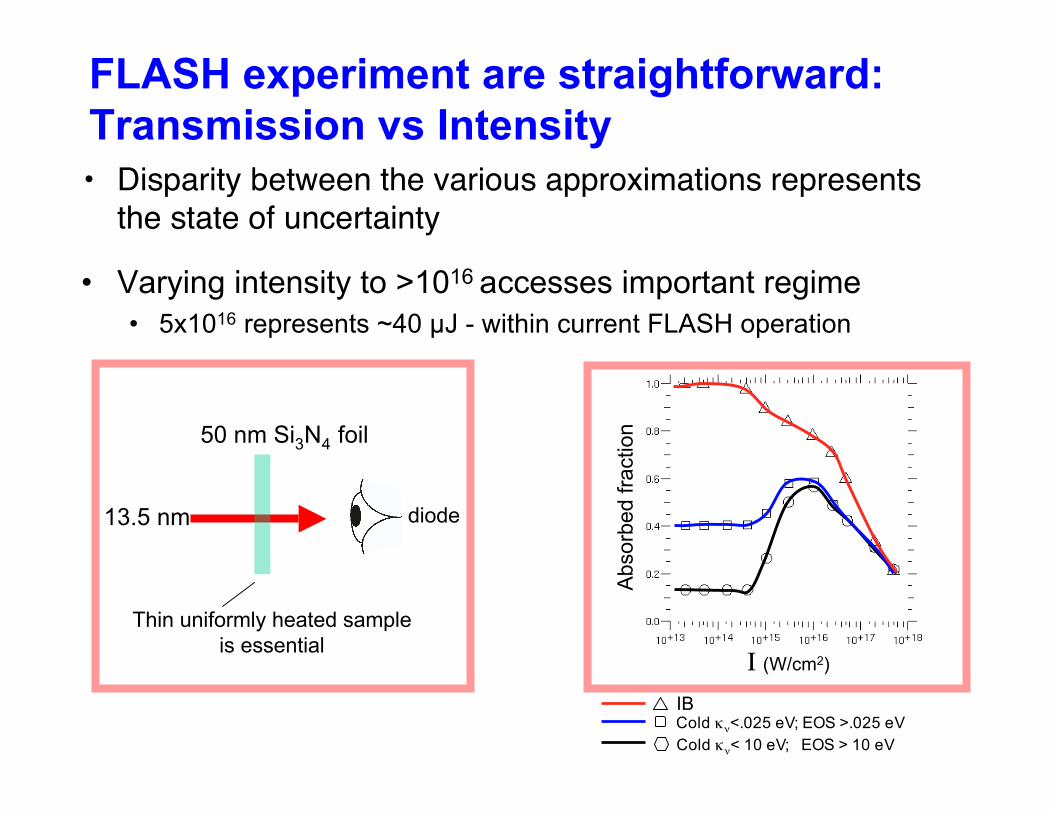
FLASH experiment are straightforward:Transmission vs Intensity• Disparity between the various approximations represents
the state of uncertainty
• Varying intensity to >1016 accesses important regime• 5x10¹⁶ represents ~40 µJ - within current FLASH operation
I (W/cm2)
Abso
rbed
frac
tion
IBCold κν<.025 eV; EOS >.025 eVCold κν< 10 eV; EOS > 10 eV
13.5 nm
50 nm Si3N4 foil
diode
Thin uniformly heated sampleis essential
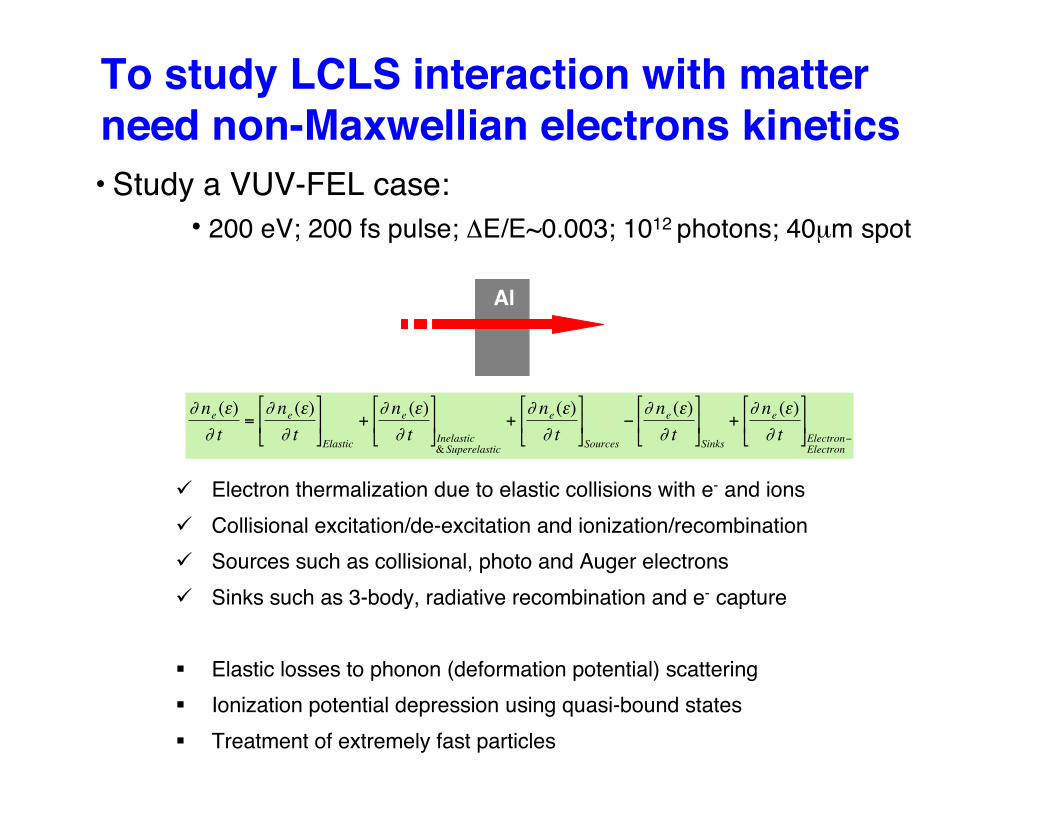
To study LCLS interaction with matterneed non-Maxwellian electrons kinetics
Electron thermalization due to elastic collisions with e- and ions Collisional excitation/de-excitation and ionization/recombination Sources such as collisional, photo and Auger electrons Sinks such as 3-body, radiative recombination and e- capture
Elastic losses to phonon (deformation potential) scattering Ionization potential depression using quasi-bound states Treatment of extremely fast particles
• Study a VUV-FEL case:• 200 eV; 200 fs pulse; ΔE/E~0.003; 1012 photons; 40µm spot
!
" ne (#)
" t=" ne (#)
" t
$
% &
'
( ) Elastic
+" ne (#)
" t
$
% &
'
( ) Inelastic& Superelastic
+" ne (#)
" t
$
% &
'
( ) Sources
*" ne (#)
" t
$
% &
'
( ) Sinks
+" ne (#)
" t
$
% &
'
( ) Electron*Electron
Al
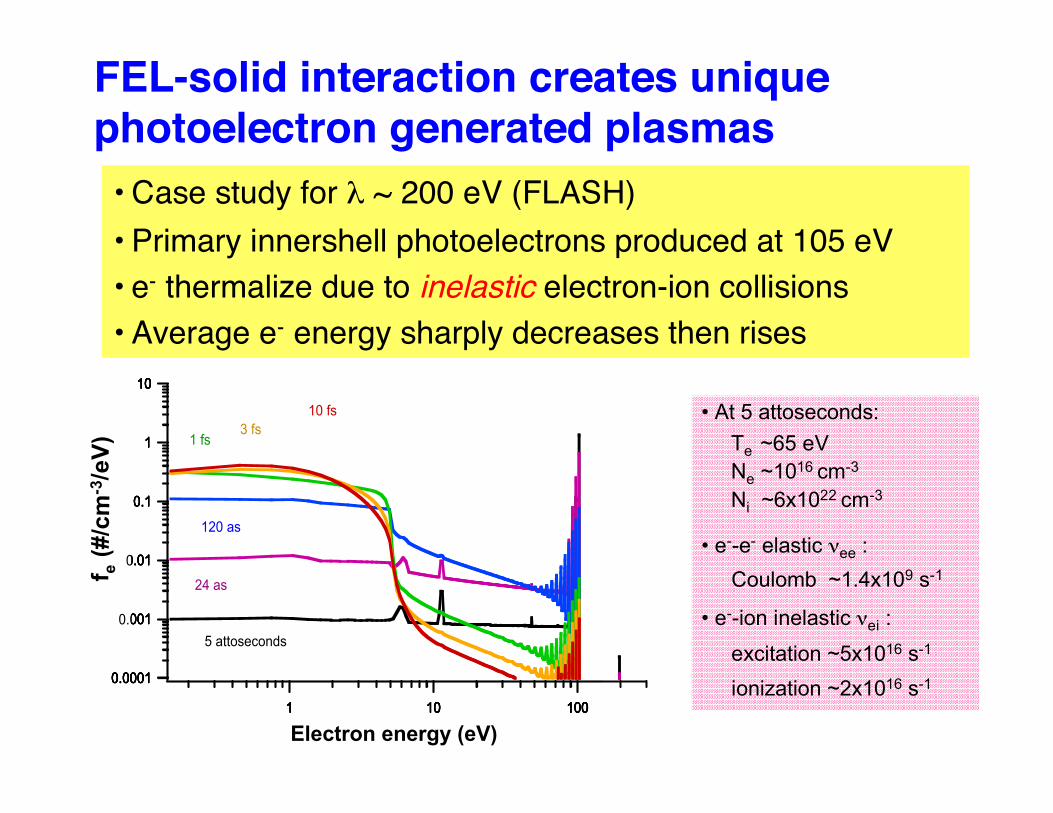
FEL-solid interaction creates uniquephotoelectron generated plasmas• Case study for λ ~ 200 eV (FLASH)• Primary innershell photoelectrons produced at 105 eV• e- thermalize due to inelastic electron-ion collisions• Average e- energy sharply decreases then rises
0.0001
0.001
0.01
0.1
1
10
1 10 100
5 attoseconds
0.0001
0.001
0.01
0.1
1
10
1 10 100
24 as
0.0001
0.001
0.01
0.1
1
10
1 10 100
120 as
0.0001
0.001
0.01
0.1
1
10
1 10 100
1 fs
0.0001
0.001
0.01
0.1
1
10
1 10 100
3 fs
Electron energy (eV)
f e (#
/cm
-3/e
V)
0.0001
0.001
0.01
0.1
1
10
1 10 100
10 fs • At 5 attoseconds: Te ~65 eV Ne ~1016 cm-3
Ni ~6x1022 cm-3
• e--e- elastic νee : Coulomb ~1.4x10⁹ s-1
• e--ion inelastic νei :
excitation ~5x10¹⁶ s-1
ionization ~2x10¹⁶ s-1

High PressureStates
Two areas of interest for studies ofdynamics of materials under high pressure• For studies of material strength one requires both high
pressure and high strain rates.
• HEDS capability will generate high pressures for > 100 ns• In situ studies of dislocation dynamics can be performed at LCLS• Phenomenology and MD simulation predict dislocation densities
orders of magnitude larger than measured post-shock• Creation and destruction of dislocation is dynamic => need short
duration high intensity x-ray pulse as an in situ probe
• For phase transformations the LCLS HEDS capability willprovide information on sub-ps timescales
• Phase transformations can occur on times scales <100 ps• MD simulations indicate, e.g., Fe goes through a ~1ps phase
transformation
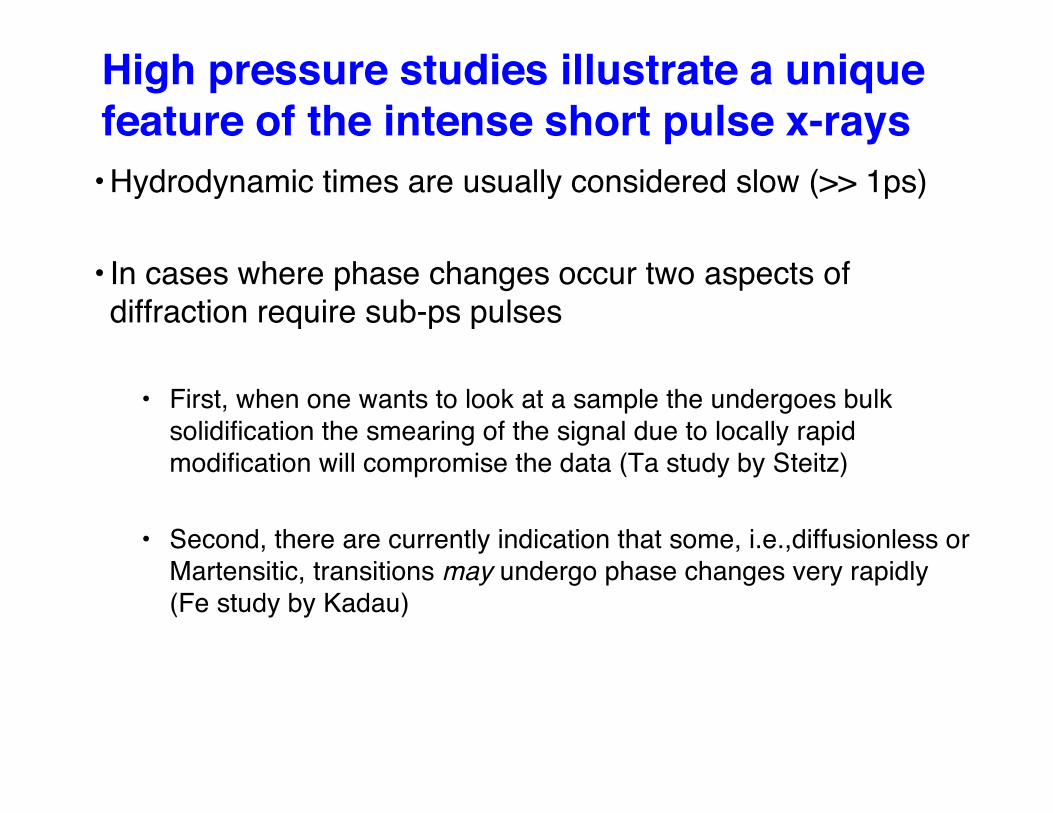
High pressure studies illustrate a uniquefeature of the intense short pulse x-rays
• Hydrodynamic times are usually considered slow (>> 1ps)
• In cases where phase changes occur two aspects ofdiffraction require sub-ps pulses
• First, when one wants to look at a sample the undergoes bulksolidification the smearing of the signal due to locally rapidmodification will compromise the data (Ta study by Steitz)
• Second, there are currently indication that some, i.e.,diffusionless orMartensitic, transitions may undergo phase changes very rapidly(Fe study by Kadau)
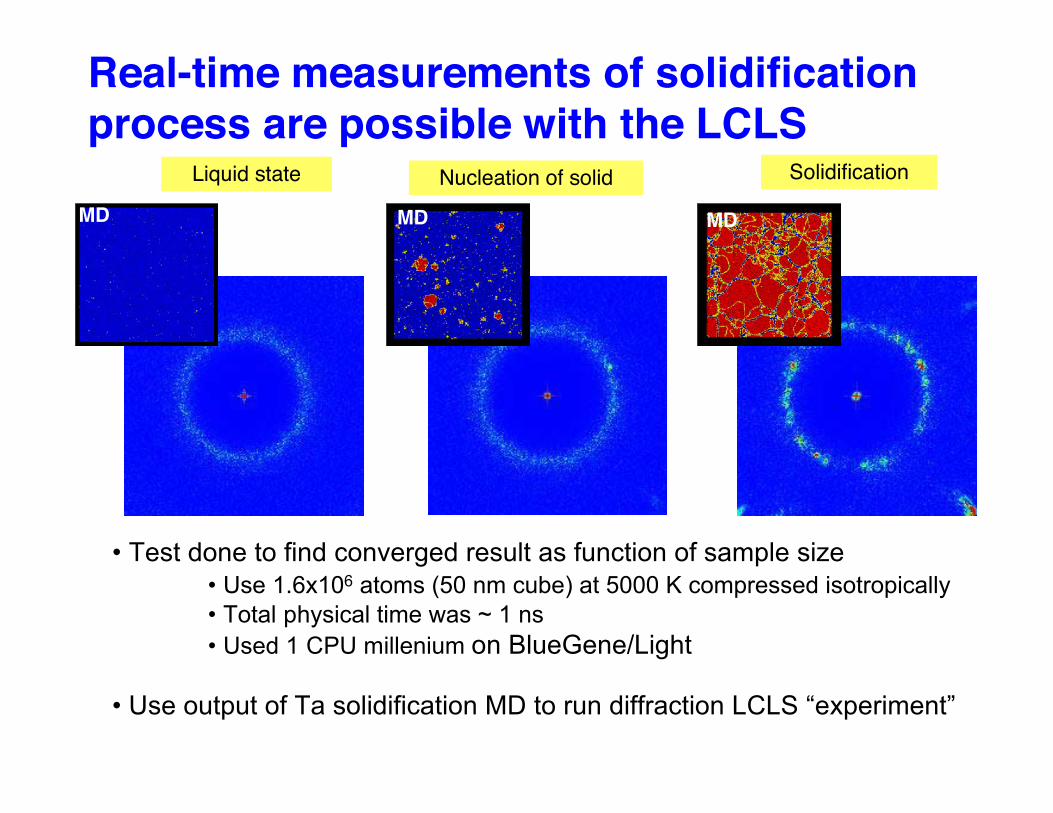
Real-time measurements of solidificationprocess are possible with the LCLS
Nucleation of solid SolidificationLiquid state
• Test done to find converged result as function of sample size• Use 1.6x10⁶ atoms (50 nm cube) at 5000 K compressed isotropically• Total physical time was ~ 1 ns• Used 1 CPU millenium on BlueGene/Light
• Use output of Ta solidification MD to run diffraction LCLS “experiment”
MD MD MD
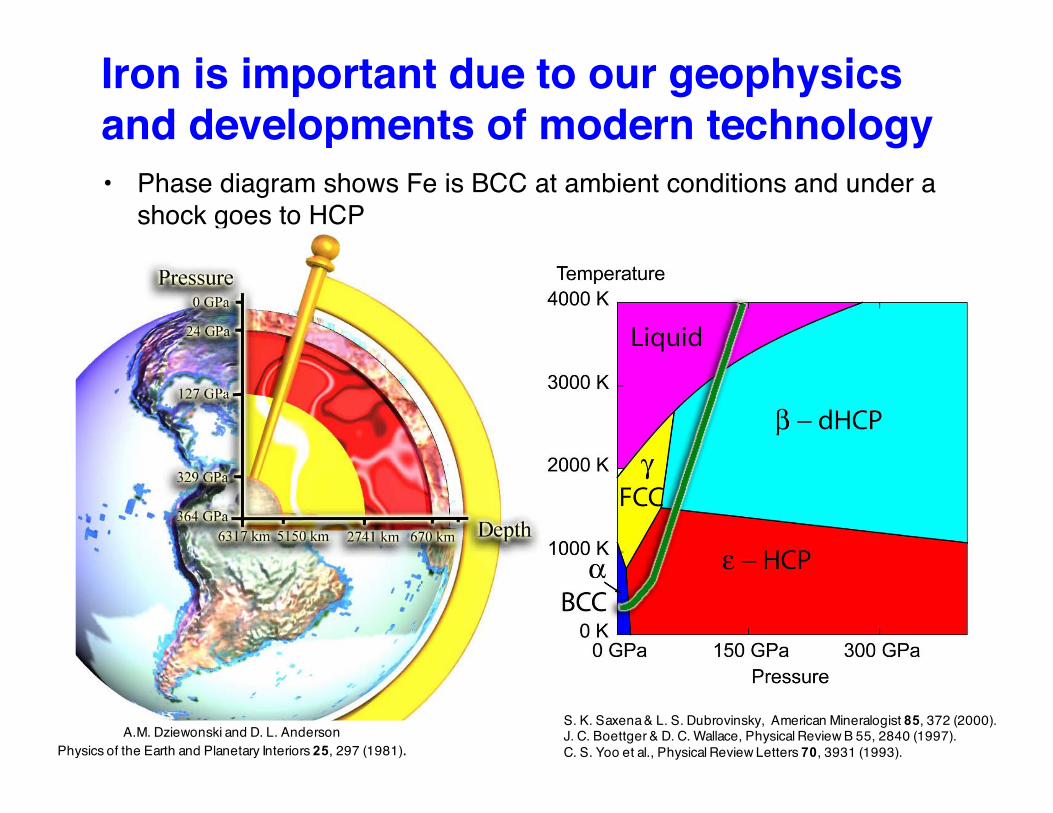
Iron is important due to our geophysicsand developments of modern technology• Phase diagram shows Fe is BCC at ambient conditions and under a
shock goes to HCP
S. K. Saxena & L. S. Dubrovinsky, American Mineralogist 85, 372 (2000).J. C. Boettger & D. C. Wallace, Physical Review B 55, 2840 (1997).C. S. Yoo et al., Physical Review Letters 70, 3931 (1993).
A.M. Dziewonski and D. L. AndersonPhysics of the Earth and Planetary Interiors 25, 297 (1981).
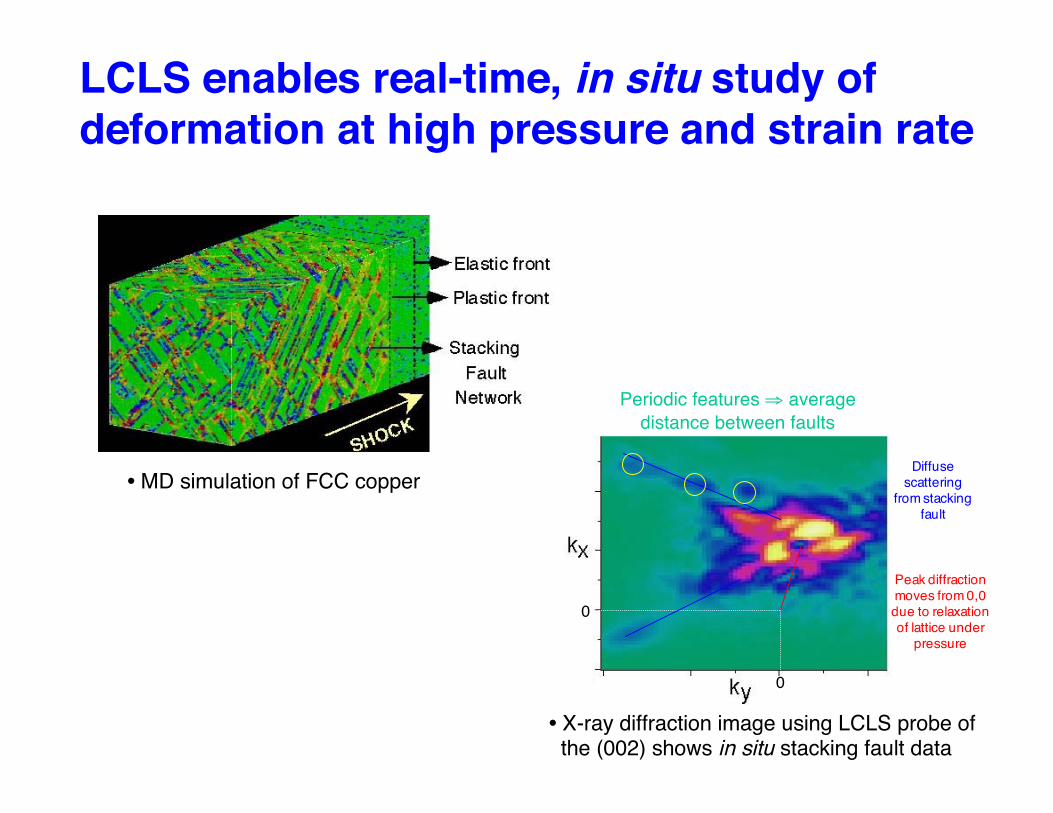
LCLS enables real-time, in situ study ofdeformation at high pressure and strain rate
• MD simulation of FCC copper
• X-ray diffraction image using LCLS probe ofthe (002) shows in situ stacking fault data
0
0
Diffusescattering
from stackingfault
Peak diffractionmoves from 0,0due to relaxationof lattice under
pressure
Periodic features ⇒ averagedistance between faults
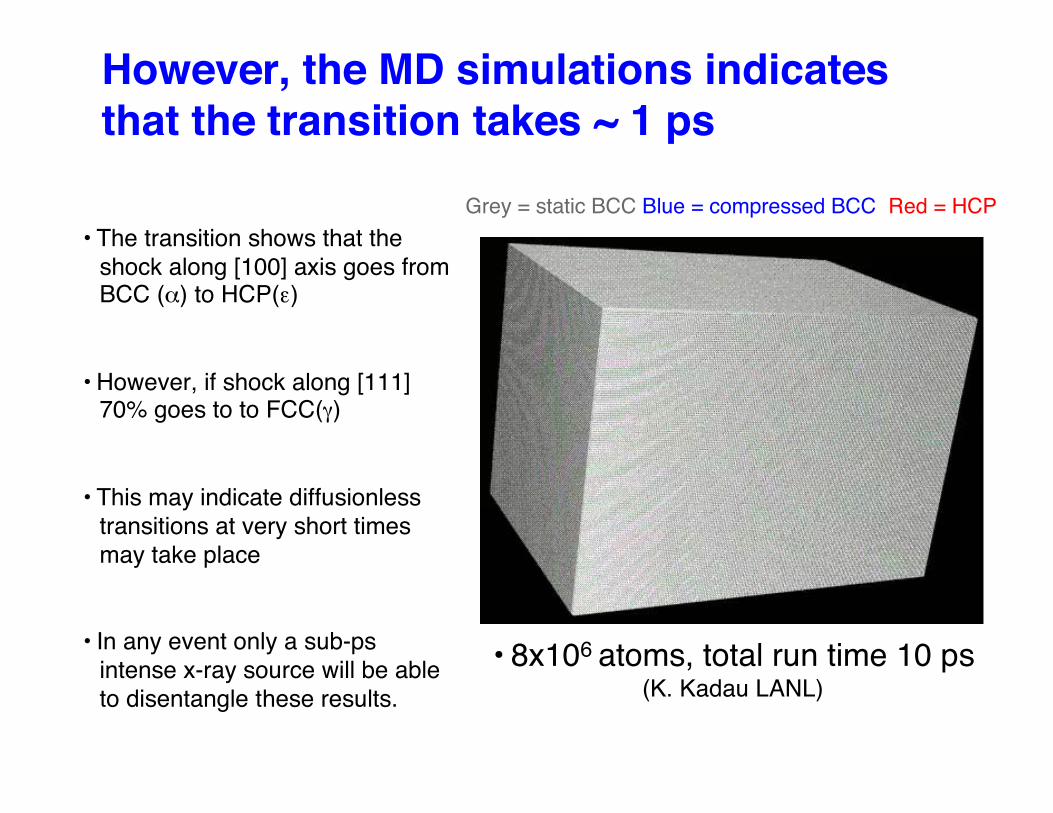
However, the MD simulations indicatesthat the transition takes ~ 1 ps
Grey = static BCC Blue = compressed BCC Red = HCP
• 8x10⁶ atoms, total run time 10 ps(K. Kadau LANL)
• The transition shows that theshock along [100] axis goes fromBCC (α) to HCP(ε)
• However, if shock along [111]70% goes to to FCC(γ)
• This may indicate diffusionlesstransitions at very short timesmay take place
• In any event only a sub-psintense x-ray source will be ableto disentangle these results.
XFELas a
probe
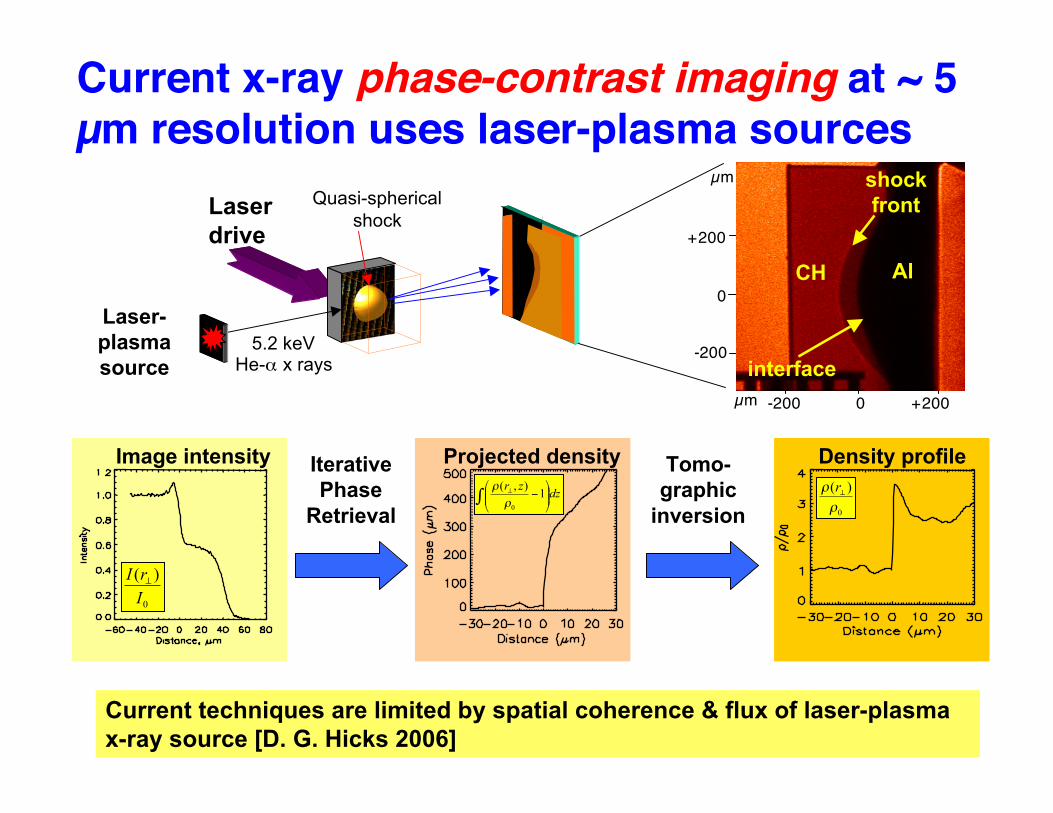
Current x-ray phase-contrast imaging at ~ 5µm resolution uses laser-plasma sources
dzzr
! ""#
$%%&
'() 1),(
0*
*
0
)(
!
! "r
0
)(
I
rI !
Current techniques are limited by spatial coherence & flux of laser-plasmax-ray source [D. G. Hicks 2006]
IterativePhase
Retrieval
Tomo-graphic
inversion
Projected density Density profileImage intensity
Laserdrive
Laser-plasmasource
Quasi-sphericalshock
5.2 keVHe-α x rays
+200
-200
0
+2000-200
µm
µm
shockfront
interface
CH Al
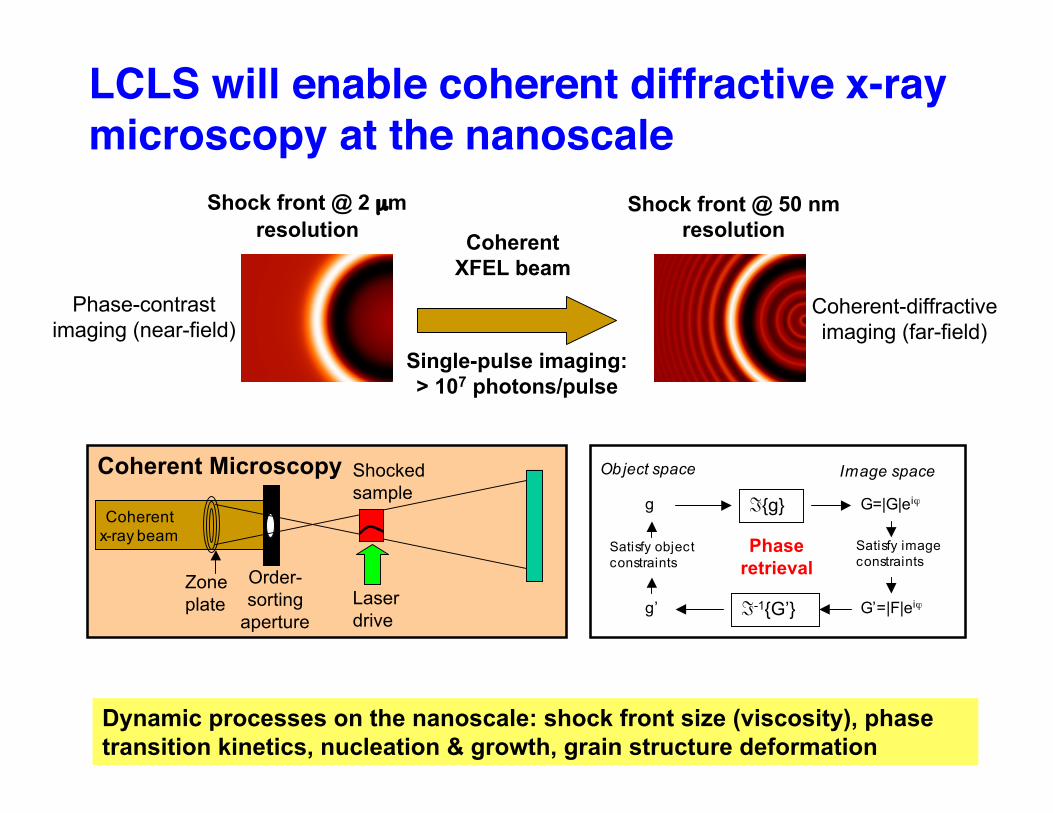
LCLS will enable coherent diffractive x-raymicroscopy at the nanoscale
Dynamic processes on the nanoscale: shock front size (viscosity), phasetransition kinetics, nucleation & growth, grain structure deformation
CoherentXFEL beam
Shock front @ 2 µmresolution
Shock front @ 50 nmresolution
Phase-contrastimaging (near-field)
Coherent-diffractiveimaging (far-field)
Coherentx-ray beam
Zoneplate
Order-sorting
aperture
Shockedsample
Laserdrive
Coherent Microscopy
Single-pulse imaging:> 107 photons/pulse
Phaseretrieval
g
Satisfy imageconstraints
G=|G|eiϕℑ{g}
Satisfy objectconstraints
G’=|F|eiϕg’ ℑ-1{G’}
Object space Image space
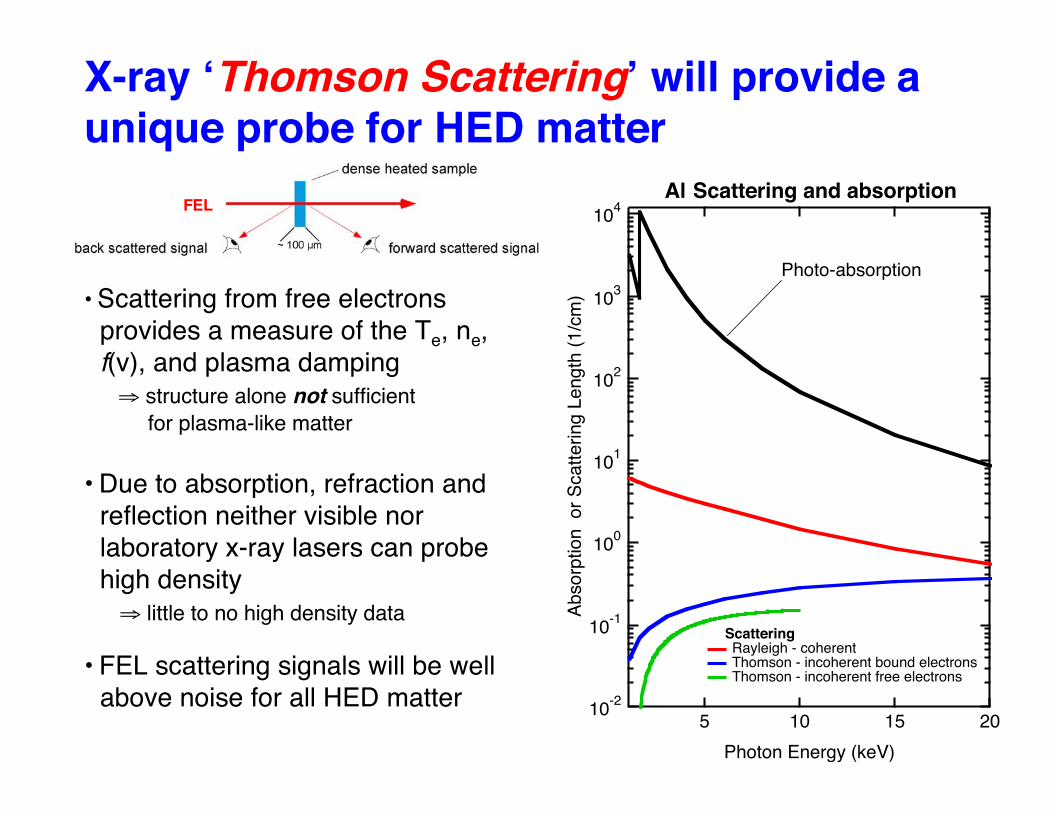
X-ray ‘Thomson Scattering’ will provide aunique probe for HED matter
• Scattering from free electronsprovides a measure of the Te, ne,f(v), and plasma damping
⇒ structure alone not sufficient for plasma-like matter
• Due to absorption, refraction andreflection neither visible norlaboratory x-ray lasers can probehigh density ⇒ little to no high density data
• FEL scattering signals will be wellabove noise for all HED matter
Al Scattering and absorption
10-2
10-1
100
101
102
103
104
Ab
so
rptio
n
or
Sca
tte
rin
g L
en
gth
(1
/cm
)
2015105
Photon Energy (keV)
Photo-absorption
Scattering
Rayleigh - coherent Thomson - incoherent bound electrons Thomson - incoherent free electrons
FEL
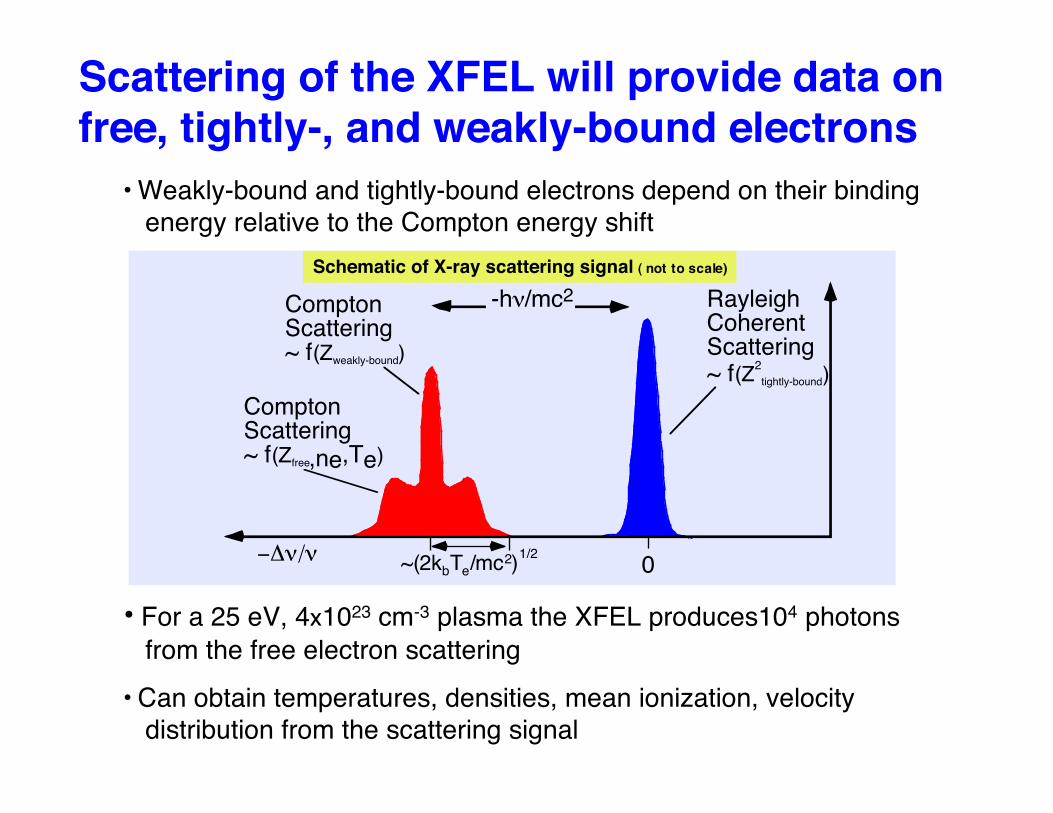
Scattering of the XFEL will provide data onfree, tightly-, and weakly-bound electrons
• Weakly-bound and tightly-bound electrons depend on their bindingenergy relative to the Compton energy shift
• For a 25 eV, 4x1023 cm-3 plasma the XFEL produces104 photonsfrom the free electron scattering
• Can obtain temperatures, densities, mean ionization, velocitydistribution from the scattering signal
Schematic of X-ray scattering signal ( not to scale)
RayleighCoherentScattering~ f(Z
2
tightly-bound)
ComptonScattering~ f(Zfree,ne,Te)
ComptonScattering~ f(Zweakly-bound)
~(2kbTe/mc2)1/2!"#/#
-h#/mc2
0
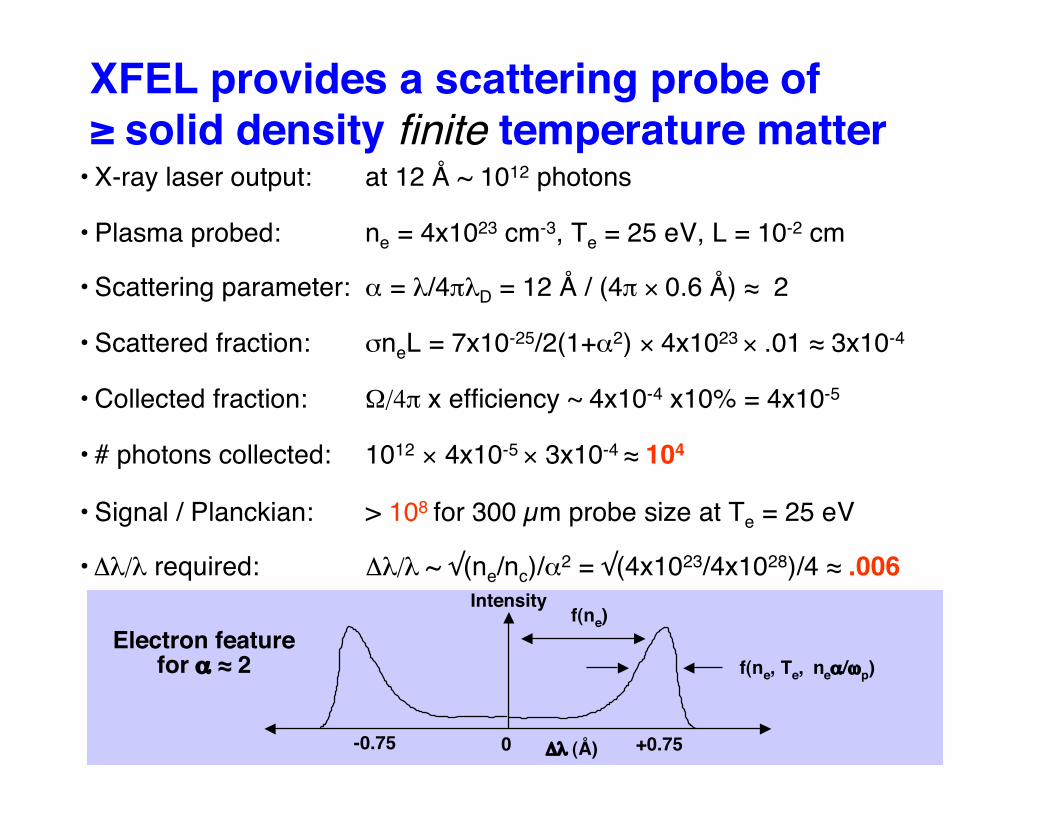
XFEL provides a scattering probe of≥ solid density finite temperature matter
• X-ray laser output: at 12 Å ~ 1012 photons
• Plasma probed: ne = 4x1023 cm-3, Te = 25 eV, L = 10-2 cm
• Scattering parameter: α = λ/4πλD = 12 Å / (4π × 0.6 Å) ≈ 2
• Scattered fraction: σneL = 7x10-25/2(1+α2) × 4x1023 × .01 ≈ 3x10⁻⁴
• Collected fraction: Ω/4π x efficiency ~ 4x10-4 x10% = 4x10⁻⁵
• # photons collected: 1012 × 4x10-5 × 3x10-4 ≈ 104
• Signal / Planckian: > 108 for 300 µm probe size at Te = 25 eV
• Δλ/λ required: Δλ/λ ~ √(ne/nc)/α2 = √(4x10²³/4x1028)/4 ≈ .006
Δλ (Å)
Intensity
0 +0.75-0.75
f(ne)
f(ne, Te, neα/ωp)Electron feature
for α ≈ 2
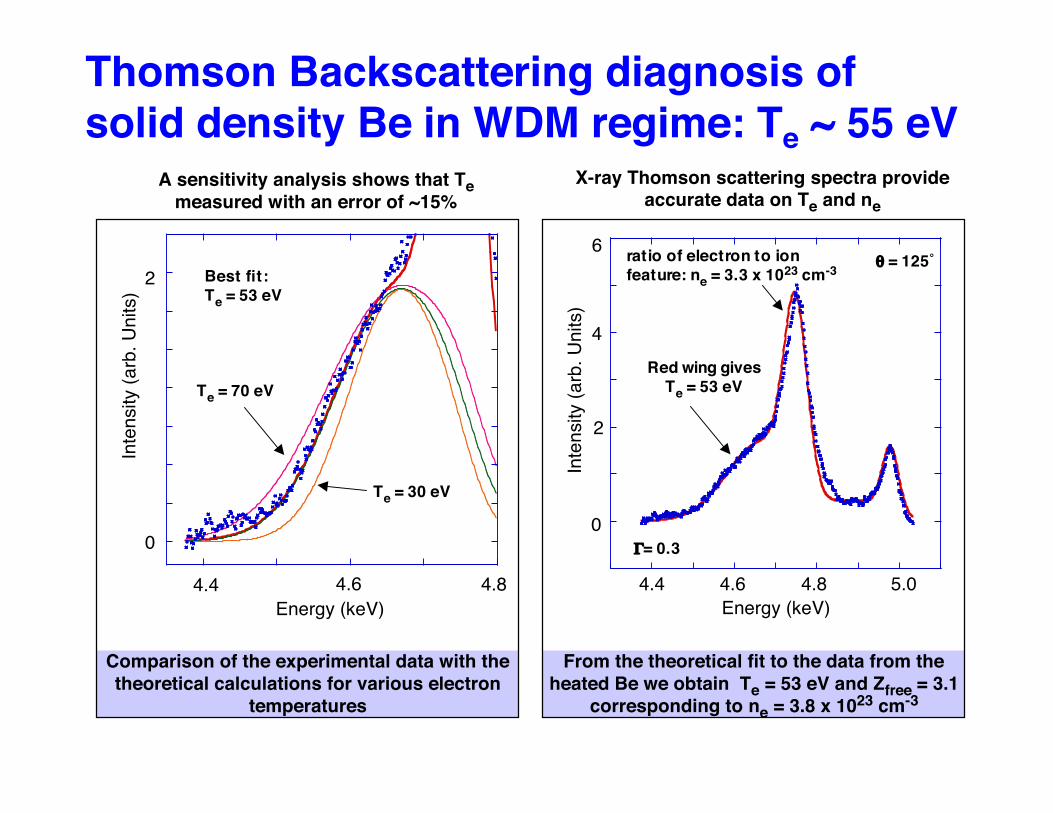
Thomson Backscattering diagnosis ofsolid density Be in WDM regime: Te ~ 55 eV
X-ray Thomson scattering spectra provideaccurate data on Te and ne
From the theoretical fit to the data from theheated Be we obtain Te = 53 eV and Zfree = 3.1
corresponding to ne = 3.8 x 1023 cm-3
0
2
4
6
Inte
nsity
(arb
. Uni
ts)
4.4 4.6 4.8 5.0Energy (keV)
Γ= 0.3
θ = 125˚
Red wing givesTe = 53 eV
ratio of electron to ionfeature: ne = 3.3 x 1023 cm-3
Comparison of the experimental data with thetheoretical calculations for various electron
temperatures
A sensitivity analysis shows that Temeasured with an error of ~15%
0
2
Inte
nsity
(arb
. Uni
ts)
4.4 4.6 4.8Energy (keV)
Te = 70 eV
Te = 30 eV
Best fit:Te = 53 eV
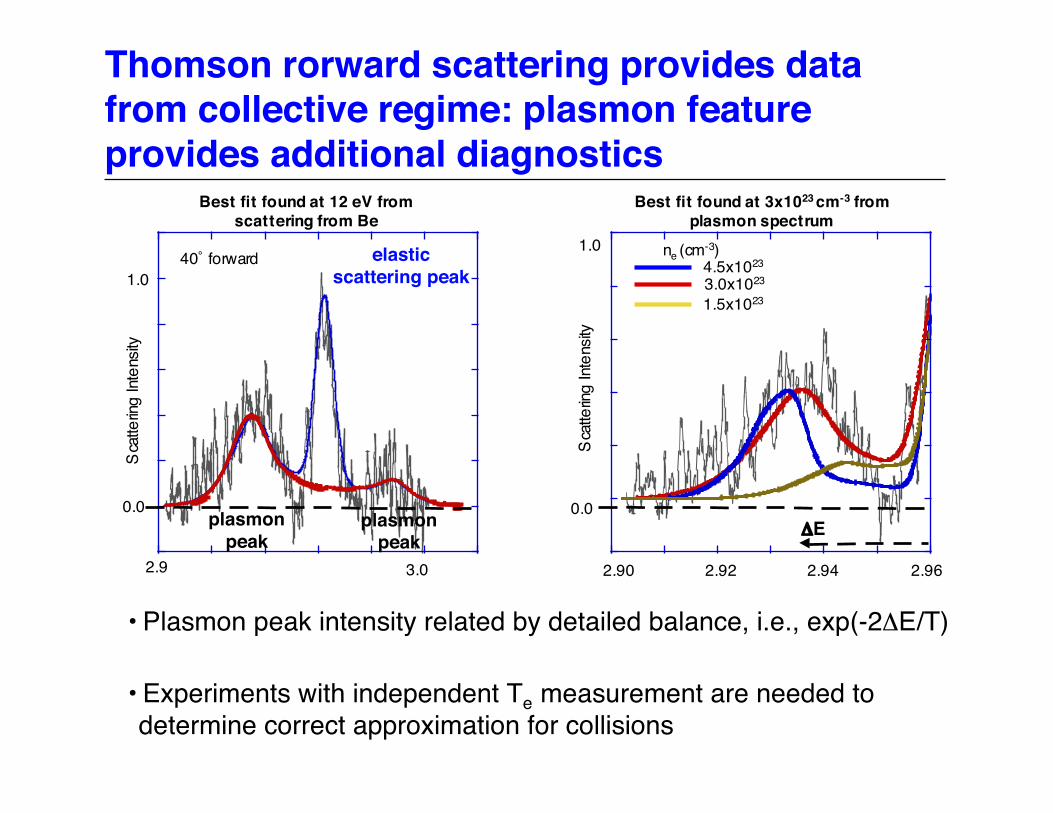
Thomson rorward scattering provides datafrom collective regime: plasmon featureprovides additional diagnostics
2.9 3.0 2.90 2.92 2.94 2.96
0.0
1.0
0.0
1.0elasticscattering peak
plasmonpeak
3.0x10²³
1.5x10²³
4.5x10²³ne (cm-3)
ΔE
Sca
tterin
g In
tens
ity
Sca
tterin
g In
tens
ity
plasmonpeak
Best fit found at 12 eV fromscattering from Be
Best fit found at 3x1023 cm-3 fromplasmon spectrum
• Plasmon peak intensity related by detailed balance, i.e., exp(-2ΔE/T)
• Experiments with independent Te measurement are needed todetermine correct approximation for collisions
40˚ forward
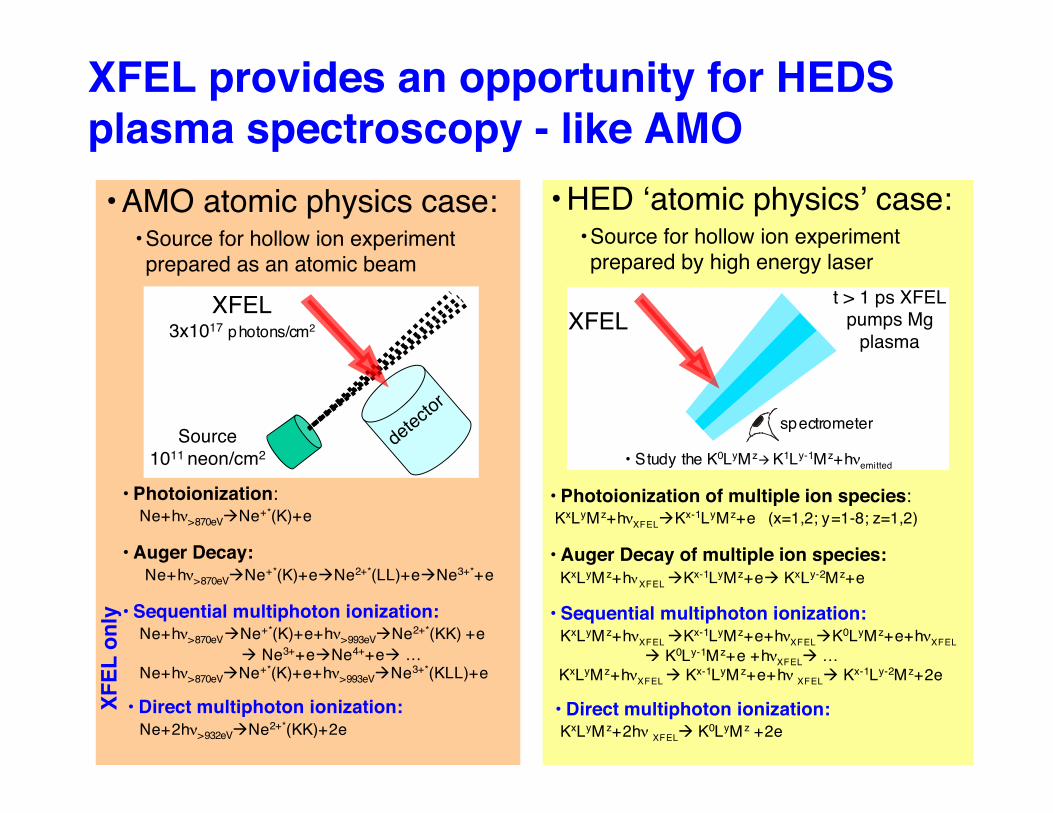
XFEL provides an opportunity for HEDSplasma spectroscopy - like AMO
• HED ‘atomic physics’ case:• Source for hollow ion experimentprepared by high energy laser
• AMO atomic physics case:• Source for hollow ion experimentprepared as an atomic beam
• Photoionization:Ne+hν>870eVNe+*(K)+e
• Auger Decay: Ne+hν>870eVNe+*(K)+eNe2+*(LL)+eNe3+*+e
• Sequential multiphoton ionization:Ne+hν>870eV Ne+*(K)+e+hν>993eVNe2+*(KK) +e
Ne3++eNe4++e …Ne+hν>870eVNe+*(K)+e+hν>993eVNe3+*(KLL)+e
• Direct multiphoton ionization:Ne+2hν>932eVNe2+*(KK)+2e
Source1011 neon/cm2
detector
XFEL3x1017 photons/cm2
XFEL
onl
y
0.1 µm CH
25 µm Mg
Visib lelaser
t = 0 laserirradiates CHwith Mg dot
• Photoionization of multiple ion species: KxLyMz+hνXFELKx-1LyMz+e (x=1,2; y=1-8; z=1,2)
• Auger Decay of multiple ion species: KxLyMz+hνXFEL Kx-1LyMz+e KxLy-2Mz+e
• Sequential multiphoton ionization: KxLyMz+hνXFEL Kx-1LyMz+e+hνXFELK0LyMz+e+hνXFEL
K0Ly-1Mz+e +hνXFEL … KxLyMz+hνXFEL Kx-1LyMz+e+hν XFEL Kx-1Ly-2Mz+2e
• Direct multiphoton ionization: KxLyMz+2hν XFEL K0LyMz +2e
XFEL
spectrometer
t > 1 ps XFELpumps Mg
plasma
• Study the K0LyMz K1Ly-1Mz+hνemitted
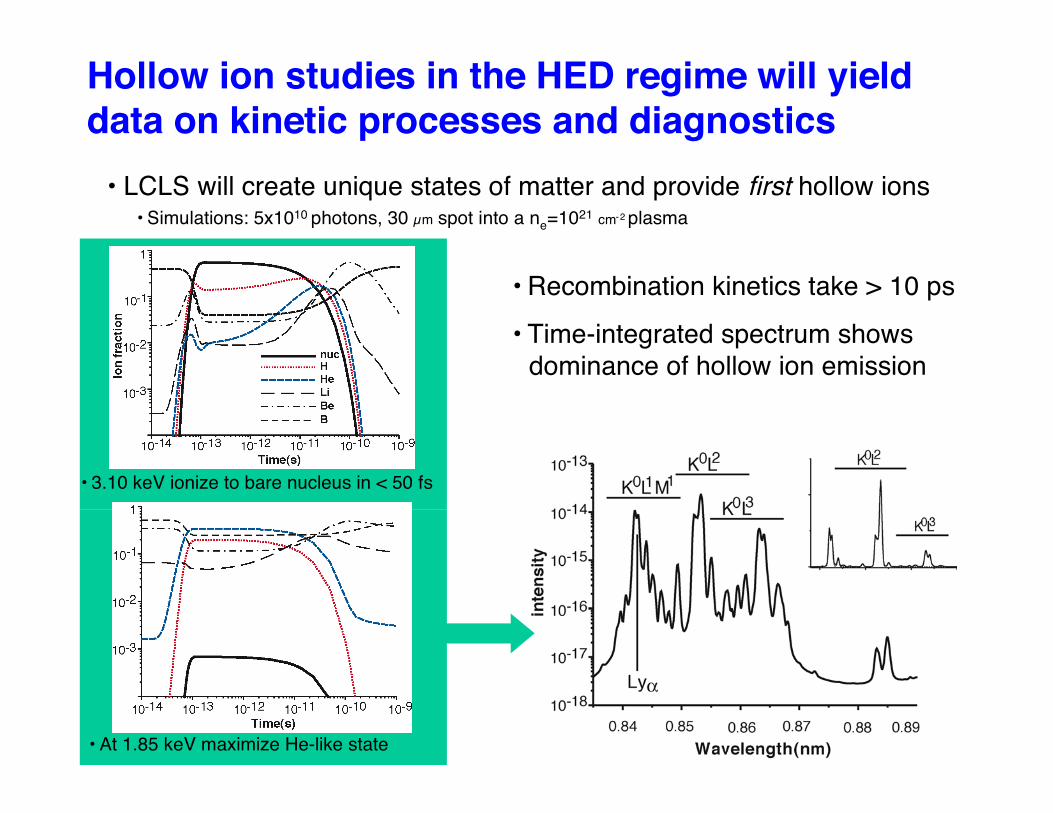
Hollow ion studies in the HED regime will yielddata on kinetic processes and diagnostics
• LCLS will create unique states of matter and provide first hollow ions• Simulations: 5x10¹⁰ photons, 30 µm spot into a ne=1021 cm-2 plasma
• Recombination kinetics take > 10 ps• Time-integrated spectrum shows
dominance of hollow ion emission
• At 1.85 keV maximize He-like state
• 3.10 keV ionize to bare nucleus in < 50 fs
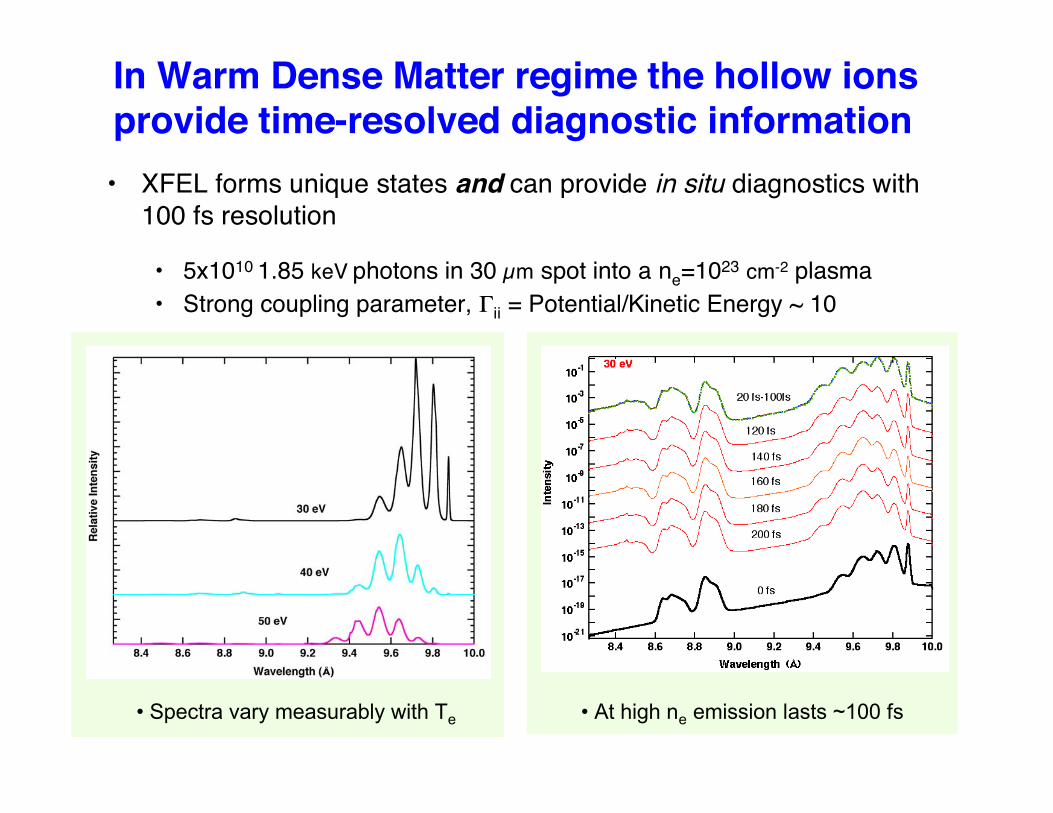
In Warm Dense Matter regime the hollow ionsprovide time-resolved diagnostic information
• XFEL forms unique states and can provide in situ diagnostics with100 fs resolution
• 5x10¹⁰ 1.85 keV photons in 30 µm spot into a ne=1023 cm-2 plasma• Strong coupling parameter, Γii = Potential/Kinetic Energy ~ 10
• Spectra vary measurably with Te • At high ne emission lasts ~100 fs
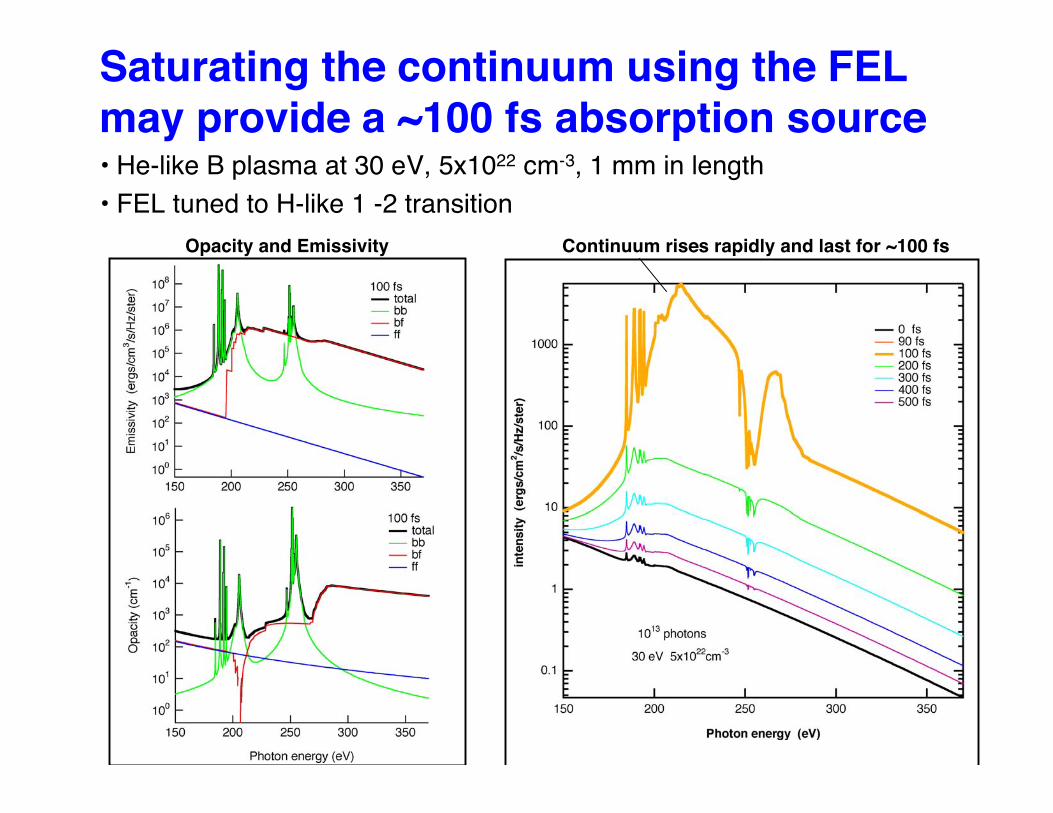
Saturating the continuum using the FELmay provide a ~100 fs absorption source• He-like B plasma at 30 eV, 5x1022 cm-3, 1 mm in length• FEL tuned to H-like 1 -2 transition
Opacity and Emissivity Continuum rises rapidly and last for ~100 fs
Summary of HEDS using sub-ps intensex-ray sources• For both the hot and warm dense matter regimes the
possibilities opened up by the FELs are important
• For WDM the FELs provide• Fast uniform heating source to create WDM• Diagnostic potential: Thomson Scattering, Kα temperature
measurement, fast absorption sources, phase contrast imaging,diffraction for high pressure states
• For HDM the FELs provide:• Fast deposition may create hot, high pressure matter (not shown)• Plasma spectroscopic probes of kinetic and radiative processes• Diagnostic potential: Thomson scattering
• The future looks bright

The End