high differentiation and low standardization: the role of ... · china’s security regulator...
TRANSCRIPT

High Differentiation and Low Standardization:
The Role of Venture Capitalists in Transforming the
Management and Governance of Private Family Firms
This Version: November 12, 2015
Abstract
Using a theoretical framework based on Rajan (2012), we empirically analyze how venture
capital (VC) investments “standardize” family firms by transforming their corporate
governance and top management. We find that family members are more likely to depart
from management positions in VC-backed compared to non-VC-backed firms. Further,
family control rights, cash-flow rights, and the separation between them drop more in
VC-backed firms. These effects are stronger when VCs have greater bargaining power or
board representation. The above effects of VC-backing are causal. We find that the
standardization of VC-backed family firms yields higher IPO firm valuation and post-IPO
operating performance.
Keywords: Family Firm; Corporate Governance; Venture Capital; Standardization
JEL Classification: G24; G34
* Professor of Finance and Hillenbrand Distinguished Fellow, Fulton Hall 330, Carroll School of Management,Boston College, Chestnut Hill, MA 02467, USA. Phone: +1-617-552-3980. E-mail: [email protected].
** Associate Professor of Finance, Hong Kong Polytechnic University, School of Accounting and Finance, M1038, Li Ka Shing Tower, Hung Hom, Kowloon, Hong Kong. Phone: +852-3400-8455. Email: [email protected].
*** Professor of Finance, School of Management, Xiamen University, Xiamen, Fujian 361005, China. E-mail: [email protected].
For helpful comments and discussions, we thank Ye Cai, Agnes Cheng, Sanjiv Das, Jack He, Robert Hendershott, Karthik Krishnan, Sam Lee, Connie Meng, Debarshi Nandy, Carrie Pan, Atulya Sarin, and seminar participants at Boston College, Fudan University, Hong Kong Polytechnic University, Santa Clara University, Shanghai Jiaotong University, Shanghai University of Finance and Economics, and Xiamen University. We thank Qiankun Gu, Di Tang, and Nanzhi Xue for excellent research assistance. We are responsible for any remaining errors or omissions.
Thomas J. Chemmanur* Boston College
Gang Hu** Hong Kong Polytechnic University
Chaopeng Wu*** Xiamen University

High Differentiation and Low Standardization:
The Role of Venture Capitalists in Transforming the
Management and Governance of Private Family Firms
Abstract
Using a theoretical framework based on Rajan (2012), we empirically analyze how venture
capital (VC) investments “standardize” family firms by transforming their corporate
governance and top management. We find that family members are more likely to depart
from management positions in VC-backed compared to non-VC-backed firms. Further,
family control rights, cash-flow rights, and the separation between them drop more in
VC-backed firms. These effects are stronger when VCs have greater bargaining power or
board representation. The above effects of VC-backing are causal. We find that the
standardization of VC-backed family firms yields higher IPO firm valuation and post-IPO
operating performance.
Keywords: Family Firm; Corporate Governance; Venture Capital; Standardization
JEL Classification: G24; G34
1
1. Introduction
In a recent Presidential Address to the American Finance Association, Rajan (2012)
develops a theory of the firm and its financing in a setting where the creation of value
requires many collaborators with their identities changing over time (rather than a single
entrepreneur acting alone). He argues that a private firm undergoes two important
transformations over its early life. He refers to the first transformation as “differentiation,”
whereby an entrepreneur brings together a group of people and the assets they work with to
create an organization, leading to the production of distinctive goods and services. Since a
differentiated, unique enterprise is hard for outsiders to finance, and finance is critical for an
entrepreneur to purchase the assets she needs for enterprise building, Rajan (2012) argues that
the firm needs to undergo a second transformation, namely, “standardization,” whereby the
firm’s operations are standardized so as to make the firm’s key human capital more
replaceable and liquid, even while it continues to produce differentiated products or services.1
Rajan (2012) further argues that equity (rather than debt) is the appropriate security to finance
such a transformation and that equity markets play an important role in this second
transformation (e.g., through an initial public offering (IPO)) by rewarding the entrepreneur
for standardizing the firm. Finally, Rajan (2012) argues that, in a venture capital (VC) backed
firm, the VC can help the standardization process by advising the entrepreneur and by
motivating her to implement this transformation.
Motivated by the above theoretical framework, in this paper we study the role of VCs in
helping private family firms undergo the second transformation above, namely,
standardization, before an IPO. We study family firms pre-IPO, since, as Rajan (2012) points
out, family firms are likely to be high on differentiation and low on standardization prior to
an IPO.2 As Rajan (2012) further points out, an entrepreneur (founding family) has an
incentive to delay standardization; a VC, on the other hand, may be able to use the fact that
some key standardization milestones are contractible (e.g., hiring of professional managers) 1 See Section II of Rajan (2012) for a formal model of standardization, where standardization is modeled as a means for the entrepreneur to appropriate the “going concern” value of the firm. Rajan (2012) credits Myers, Rajan, and Zingales (2005) for an early attempt at formalizing the notion of standardization. See also Zingales (2000) who highlights the growing importance of a firm’s human capital relative to its physical assets. 2 See Figure 3 of Rajan (2012) and the related discussion of the array of possibilities for firms and financing when one considers both differentiation and standardization.

2
to accelerate standardization. We, therefore, compare the transformation of corporate
governance and management in VC-backed versus non-VC-backed family firms to isolate the
incremental effects of VC-backing in accomplishing the standardization process. Further,
since an IPO is the first large infusion of external financing into the firm from the financial
markets, the benefits of standardization will accrue to the firm to the greatest extent at this
time. We therefore focus our empirical analysis of the standardization of family firms at the
time of IPO and the years around the IPO. Finally, it has been well-documented that the
corporate governance of family firms in China and other East-Asian countries is particularly
weak (e.g., pyramidal ownership structures used to expropriate minority shareholders), so
that the role of VC-backing in standardizing family firms is likely to be particularly strong in
this context. Hence we make use of a large sample of Chinese private family firms that went
public during 2004-2012 for our empirical analysis. To the best of our knowledge, there has
been no study so far in the literature that analyzes the effects of VC-backing in transforming
the corporate governance and management of family firms.
We analyze three research questions in this paper. First, the family firm literature has
suggested that the involvement of multiple family members in owning or managing a firm
may be harmful to its performance.3 Therefore, the first set of research questions we analyze
is related to the ability of VCs to help reduce the number of family firm members holding top
management positions in the firm. In particular, we study whether VCs are able to force some
family members to depart from their management positions in the firm and whether the
likelihood of VCs being able to induce such departures increases with the relative power of
VC versus the founding family (as proxied by VCs’ equity ownership) and with VC board
representation. Further, we analyze the original positions from which these family members
depart: top executives, directors, or supervisors. Finally, we analyze the types of family
members, namely, blood-based or marriage-based relatives of the founders, or the firm
founders themselves, that are more likely to depart from firm management.
Second, most of the family firms around the world are controlled by large (family)
3 See, e.g., Bertrand, Johnson, Samphantharak, and Schoar (2008), who, using a sample of Thai family firms, show that the involvement of more of the founders’ sons in the management of family firms is associated with lower firm performance. See also Miller, Le Breton-Miller, Lester, and Cannella (2007), who, using a sample of U.S. family firms, show that Fortune 1,000 family firms that include relatives of the founder as owners or managers never outperform in terms of market valuation, even during the first generation.

3
shareholders, and their control rights usually exceed their cash-flow rights. It has been argued
by the theoretical literature that such an ownership and control structure is suboptimal for
shareholder value maximization and facilitates the controlling shareholders’ expropriation of
minority investors: see, e.g., Grossman and Hart (1988) or Harris and Raviv (1988).
Therefore the second set of research questions we analyze relate to the ability of VCs to
reduce the family’s control rights, cash-flow rights, and the separation between control and
cash-flow rights. Further, if VCs are indeed able to help achieve such ownership and control
right reductions, we analyze whether the VCs’ ability to achieve such reductions increases
with their relative power with respect to the founding family and also with their board
representation. Finally, we analyze the reductions in equity ownership, if any, of different
types of family members, namely, those of blood-based or marriage-based relatives of the
founder, and of the firm founders themselves.
Third, improvements in the corporate governance of family firms are valuable to
shareholders (including to VCs) only if they result in corresponding increases in firm
performance and in firm valuation. Therefore, the third set of research questions we ask deal
with the effect of possible departures of family members from management positions and
reductions in family members’ control and cash flow rights associated with VC-backing on
the subsequent performance and valuation of these firms. In particular, we analyze whether
the above departures of family members from management positions in VC-backed family
firms and the reductions in their control and cash flow rights in the immediate pre-IPO period
(i.e., while these firms are still private) translate into improvements in their post-IPO operating
performance and immediate post-IPO secondary market valuation. We also analyze whether
such performance and valuation improvements associated with changes in the corporate
governance and in the top management of VC-backed family firms are greater than the
corresponding improvements in non-VC-backed family firms.
We address the above research questions using hand-collected data on a sample of 499
Chinese private firms (210 VC-backed and 289 non-VC-backed firms) that went public during
2004-2012. China’s security regulator requires firms going public to disclose in their IPO
prospectuses information regarding their management team (top executives, directors, and
supervisors) and management turnover, as well as every change in equity ownership structure

4
(including detailed information regarding equity transfers and VC investments) since firm
inception: we hand-collect this data from IPO prospectuses for our analysis. We also
hand-collect from IPO prospectuses information regarding family members who are involved
in owning and managing the firm, including their titles, shareholdings, relationships to the
founder, political connections, business connections, gender, and educational background.4
In summary, our data provides us with a complete picture of the changes in the management
teams and ownership and control structures of family firms during the pre-IPO period, as well
as regarding other important variables related to the above changes.
China presents us with an appropriate economic setting for our analysis for two reasons.
First, the governance of family firms in China and other East-Asian countries has been
documented to be weak, with pyramidal ownership structures often used to expropriate
minority shareholders (see, e.g., Claessens, Djankov, and Lang (2000); Claessens, Djankov,
Fan, and Lang (2002)). There is also direct evidence of the expropriation of small
shareholders by controlling shareholders in China: see, e.g., Jiang, Lee, and Yue (2010).
Given this, there is significant room for improvement in the corporate governance of family
firms in China. Second, after about fifteen years of development, China’s venture capital
market has become one of the largest in the world (surpassing the UK and second only to that
in the U.S.), providing us with a large enough sample of VC-backed family firms with
comprehensive data on these firms suitable for our analysis.5 In summary, the severity of the
minority shareholder expropriation problem in China combined with the large number of
VC-backed family firms there provide us with the ideal economic setting to study the role of
VCs in improving the corporate governance of family firms as well as the resulting effects on
firm performance and valuation.
The empirical strategy we adopt to isolate the effects of VC-backing on changes in the
corporate governance of family firms is to compare these changes to those occurring in
4 Since we conduct our analysis not only at the firm-level but also at the family-member level, we also collect a family-member sample which includes 1,378 founding family members who hold top executive, director, and supervisor positions, as well as a sample of 1,341 family members who hold ownership stakes in the firm. 5 The size of the VC investments in China relative to other countries is based on data provided by Dow Jones VentureSource (http://www.dowjones.com/pressroom/releases/ 2012/02022012-Q4CHVC-0010.asp).

5
non-VC-backed family firms.6 At the same time, we recognize that VCs’ choice of family
firms to invest in may not be completely exogenous. This choice may in fact depend on
various firm characteristics such as firm size, industry, geographical location, and also the
difficulty VCs perceive in changing firm corporate governance. Such firm characteristics may
also affect the changes in these firms’ corporate governance after VC financing, potentially
confounding our analysis. To address this potential endogeneity, we adopt two empirical
strategies. First, to address the selection of VCs of firms to invest in based on observables, we
conduct our empirical analysis of corporate governance changes in VC-backed versus
non-VC-backed family firms using a propensity score matched sample of these two groups of
firms matched on the firm characteristics mentioned above. Second, since VCs’ decision to
invest in a family firm may also be based on some unobservable characteristics of family
firms, we conduct an instrumental variable analysis to deal with this potential endogeneity
problem (arising from the possible selection of firms to invest in by VCs based on
unobservable firm characteristics).
The results of our empirical analysis addressing our first set of research questions are as
follows. First, both our ordinary least squares (OLS) regressions and propensity score
matching analyses show that family members are significantly more likely to leave
management positions in VC-backed firms than in non-VC-backed firms.7 When we use the
equity ownership of VCs as a proxy for their power to make changes in the firm, we find that
the larger VC shareholdings, the more likely family members are to leave from top
management positions. We also find that family members are more likely to leave from top
management positions when VCs are represented on the board of directors, consistent with
the notion that board representation is helpful for VCs to be able to exert sufficient pressure
on the founding family to achieve the departure of family members from important
management positions. Second, from our family-member level analysis, we find that family
members serving on the firm’s board of supervisors are more likely to depart due to
6 The idea here is to disentangle the changes in the management positions of family members and their control and cash flow rights occurring due to the VC-backing of family firms from those occurring purely as a result of these firms maturing over time. 7 These results are also economically significant. The turnover probability of family members in VC-backed firms is 8.4 percent higher than that in non-VC-backed firms.

6
VC-backing rather than those serving as executives or on the firm’s board of directors.8
However, in firms where VCs have greater power to make changes relative to the founding
family (as proxied by their share ownership), both executives and members of the board of
supervisors are more likely to depart. Third, we find (again from our family member level
analysis) that while marriage-based relatives of the founder are in general more likely to
leave than blood-based relatives or founders themselves, both blood-based and
marriage-based relatives are more likely to leave their management positions in firms where
VCs have greater equity holding.9
The results of our empirical analysis addressing our second set of research questions are
as follows. First, both our OLS regressions and propensity score matching analyses show that
family control rights, cash-flow rights, and the separation between control and cash-flow
rights drop to a significantly greater extent in VC-backed firms compared to that in
non-VC-baked firms.10 Using the equity ownership of VCs as a proxy for their power to
make changes in the firm, we find that family firms where VCs have greater equity
ownership experience greater reductions in family control rights, cash-flow rights, and the
separation between control and cash flow rights. We also find greater reductions in family
control rights, cash-flow rights, and the separation between control and cash flow rights in
firms where VCs are represented on the board of directors, suggesting that board
representation is helpful for VCs to be able to exert sufficient pressure on the founding family
to reduce their control and cash-flow rights in the firm. Second, both our OLS regressions
and propensity score matching analyses show that the family is more likely to lose voting
8 In our analysis of the changes in family members’ management positions, we classify original positions of family members into top executives, members of the firm’s board of directors, and members of the firm’s board of supervisors. According to China’s company law, executives and directors are in charge of making and executing the company’s major decisions. However, companies are also required to set up a board of supervisors to monitor top executives and members of the board of directors to ensure that they exercise their job functions properly. 9 This may reflect the greater importance placed on blood-based relationships relative to marriage-based relationships in Chinese culture. 10 These results are also economically significant. Thus, the decrease in family control rights is around 8% larger for VC-backed firms than that for non-VC-backed firms. The decline in family cash-flow rights is around 6.5% larger in VC-backed firms than in non-VC-backed firms. The decrease in the separation between family control and cash-flow rights is around 0.8% larger for VC-backed firms than that for non-VC-backed firms.

7
control of the firm in a VC-backed family firm rather than in a non-VC-backed family firm.11
Third, our family-member level analysis shows that the shareholdings of the founders and
their blood-based relatives experience a larger decline in VC-backed firms compared to their
declines in non-VC-backed firms, and that the reductions in the equity ownership of all three
kinds of family members (blood-based relatives, marriage-based relatives, or founder) are
increasing with the VCs’ equity ownership in the firm.
The results of our empirical analysis addressing our third set of research questions are as
follows. First, we find that, in VC-backed family firms, the decline in family firm control
rights and in the separation between family control rights and cash flow rights result in
significant improvements not only in post-IPO operating performance, but also in firm
valuation immediately after IPO.12 Second, the departure of family members from top
management positions has no statistically significant impact on the post-IPO operating
performance or the valuation of VC-backed firms.13 These two results together indicate that,
while the corporate governance reforms associated with the VC-backing of family firms
indeed translate into better subsequent firm performance and valuation, reductions in the
family’s control rights are a more effective corporate governance reform than the departures
of family members from management positions. Third, neither the decline in family firm
control rights (and in the separation between family control rights and cash flow rights) nor
the departure of family members from top management positions, have any statistically
significant effect on the post-IPO operating performance or the valuation of non-VC-backed
firms. This suggests that VCs are not only able to help reduce the control rights of the family
and secure the departure of family members from management positions, but are also able to
help family firms they back in other ways, so that these firms are able to translate corporate
11 This result is also economically significant. The probability of the founding family losing voting control in VC-backed firms is around 10 percent higher than that in non-VC-backed firms. 12 The effect of reductions in family cash flow rights is mixed. While this has a positive effect on operating performance, it has no significant effect on firm valuation. This is not too surprising, since, while reducing the equity ownership of the family reduces their entrenchment within the firm, this also reduces family members’ incentives to exert effort toward maximizing shareholder value (along the lines argued by Jensen and Meckling (1976)). 13 However, while this is true in general, in untabulated results, we find that, for larger magnitudes of the departure of family members from management positions, there is indeed a statistically significant improvement in firm post-IPO operating performance.

8
governance and management changes more effectively into better operating performance and
valuation.14
The rest of the paper is organized as follows. Section 2 discusses how our paper is related
to the existing literature and the contribution it makes relative to this literature. Section 3
develops testable hypotheses. Section 4 describes our data and sample selection procedures
and defines the relevant variables. Section 5 presents our empirical tests and results. Section 6
concludes. An Internet Appendix presents supplemental tables.
2. Relation to the Existing Literature and Contribution
Our paper is related to two strands in the existing literature. The first strand is the
literature on venture capital financing, and in particular, the literature documenting that
venture capitalists may add value to the firms they invest in beyond simply providing external
financing. A few papers in this literature have studied the role of venture capitalists in
intensively monitoring firm managers (Gompers (1995) and Lerner (1995)), and the effects of
VC-backing on corporate board structure (Baker and Gompers (2003) and Hochberg (2012))
and on earnings management by entrepreneurial firms (Hochberg (2012)).15 None of the
above papers study the effects of VC-backing in transforming the management of
entrepreneurial firms or their corporate governance (beyond board structure). Kaplan, Sensoy,
and Stromberg (2009) study 50 VC-backed companies, and analyze how their firm
characteristics (financial performance, line of business, points of differentiation, nonhuman
capital assets, growth strategy, top management, and ownership structure) evolve from
business plan to IPO. While, unlike our paper, their focus is on informing the debate on the
relative importance of the business (“horse”) versus the management team (“jockey”) in
contributing to the success of a firm, their paper can be viewed as related to ours to the extent
that they also study human capital turnover in some VC-backed firms.
14 One possible example of such additional help may be in replacing family shareholders with new shareholders who are able to provide value-added monitoring services to the firm. 15 The large literature analyzing the effects of VC-backing on other aspects of entrepreneurial firm performance is also distantly related to this paper: see, e.g., Chemmanur, Krishnan, and Nandy (2011), who show that VC-backing increases firm efficiency as measured by total factor productivity, and Chemmanur, Simonyan, and Tehranian (2013), who argue that venture capitalists help to improve the quality of the top management of entrepreneurial firms.

9
Hellmann and Puri (2002) study a sample of 170 young high-technology firms in Silicon
Valley and show that VC-backing is positively related to measures of professionalization of
firm management such as the adoption of human resource policies and of stock option plans
and the hiring of a vice-president of sales and marketing. They also find that VC-backed
firms are more likely and faster to replace the founder with an outside CEO. While the above
is related to our paper, ours is the first paper in the literature to study the standardization of
the top management of family firms; further, rather than focusing only on the CEO, we study
the effects of VC-backing in transforming the entire management team of family firms. Ours
is also the first paper to study the effect of VC-backing on the cash flow rights, control rights,
and the wedge between control and cash flow rights of the founding family in family firms.
Finally, ours is also the first paper to analyze how the standardization of top management and
corporate governance of family firms is rewarded by the financial markets through higher
stock market valuation upon IPO.
The second strand is the literature on family firms. Several papers in this literature have
documented that, while family ownership has some advantages in terms of maximizing
shareholder value, for example, due to better monitoring of CEOs (see, e.g., Anderson and
Reeb (2003)), family ownership also suffers from significant disadvantages arising from
conflicts of interest between family shareholders and other shareholders (see, e.g., Shleifer
and Vishny (1997), Anderson and Reeb (2004), and Villalonga and Amit (2009)). A large
literature has documented that, unlike in the case of firms in the U.S. and Japan (where equity
ownership is diffuse), in a typical Asian or European family firm equity ownership is
concentrated, with one or more members of a family tightly holding shares. A number of
papers in this literature have also documented the agency conflicts existing between
controlling (family) shareholders and minority shareholders: see, e.g., La Porta,
Lopez-de-Silanes, and Shleifer (1999), Claessens, Djankov, and Lang (2000), Claessens,
Djankov, Fan, and Lang (2002), Faccio and Lang (2002), Faccio, Lang, and Young (2001),
and Johnson, Boone, Breach, and Friedman (2000). A number of other papers document that,
when a larger number of family members are involved in controlling and operating a family
firm, the performance of the firm suffers: see, e.g., Miller, Le Breton-Miller, Lester, and
Cannella (2007) and Bertrand, Johnson, Samphantharak, and Schoar (2008).

10
A few papers in the family firm literature have also studied possible mechanisms to
mitigate the minority shareholder expropriation problem existing in family firms. One
example is Anderson and Reeb (2004), who show that independent directors may help
alleviate conflicts between family shareholders and outside shareholders and thus improve
firm performance. Another example is Anderson, Duru, and Reeb (2009), who suggest that
financial transparency serves as an additional disciplining mechanism on family shareholders
who attempt to extract private benefits from family firms. Unlike the above papers, the focus
of our paper is on analyzing a new mechanism for improving the corporate governance of
family firms, namely, VC-backing. We show, for the first time in the literature, that VC
investments in family firms help to improve corporate governance by securing the departure
of some family members from management positions and by reducing the separation between
the cash flow and control rights held by the founding family, thereby improving subsequent
firm performance and financial market valuation.
3. Theory and Hypothesis Development
The theoretical framework we use to develop our testable hypotheses is based on the
two-period, three-date standardization model in Rajan (2012). He argues that a private firm
undergoes two important transformations over its early life. The first transformation is
differentiation, whereby an entrepreneur brings together a group of people and the assets they
work with to create an organization, leading to the production of distinctive goods and
services. Since a differentiated, unique enterprise is hard for outsiders to finance, and finance
is critical for an entrepreneur to purchase the assets she needs for enterprise building, Rajan
(2012) argues that the firm needs to undergo a second transformation, namely,
standardization, whereby the firm’s operations are standardized so as to make the firm’s key
human capital more replaceable and liquid, even while it continues to produce differentiated
products or services. We adapt the above framework to the specific context of family firms.
We consider a setting where an entrepreneur (a founder and her family) initially handles
all the basic functions of a firm (e.g., product development, marketing, personnel, and finance)
in its first period. The founding family may fund the firm’s operations in its first period either
using its own private financing (i.e., it does not raise any VC financing) or may choose to

11
raise part of the financing required for its first period operations from a venture capitalist.16
The founder plans to take the firm public in an IPO at the end of the first period. While the
IPO may fund part of the firm’s second period (future) operations, both the founder and the
venture capitalist also plan to sell a substantial fraction of their equity in the IPO. We assume,
following Rajan (2012), that, prior to its IPO, the firm will undergo a process of
standardization, which may involve hiring professional managers to hand various functional
areas such as product development, marketing, personnel, and finance (previously handled by
the founder or her family members). Standardization therefore reduces the idiosyncratic and
personal aspects of the founder and her family’s role in managing the firm, allowing her job
to resemble that of a typical CEO, and making it easier for the firm’s top management team to
be replaced by professional managers.
In the above setting, both the founder and the venture capitalist obtain significant
benefits from standardization through a higher equity market valuation for their holdings in
the firm.17 However, there is a “wedge” between the objectives of the founding family and
the VC. While the founding family receives private benefits from managing the firm, in
addition to the cash flow benefits accruing to their equity stakes in the firm, the VC enjoys
only the cash flow benefits accruing to his equity holdings in the firm. Assuming that the
private benefits enjoyed by the founding family are reduced due to standardization, it can be
shown that the optimal level of standardization preferred by the venture capitalist will be
greater than that preferred by the founding family. We assume that the actual level of
standardization chosen by the firm prior to its IPO in a VC-backed family firm will be
determined as a result of bargaining between the venture capitalist and the founding family.
This means that, in a VC-backed family firm where the VC has greater bargaining power with
respect to the founder, the level of standardization chosen prior to the firm’s IPO will be
16 As Rajan (2012) points out, a VC “is willing to finance the entrepreneur in the early stages of the enterprise if he knows that the entrepreneur has sufficient incentive to standardize later on, and if the expected market value of the venture capitalist’s equity claim compensates for the risk he takes up-front in financing the venture.” 17 To quote Rajan (2012): “The tension between generating NPV, which requires innovation and differentiation of the firm’s assets and human capital, and offering financiers credible repayment, which requires reducing the extent to which the firm’s employees are irreplaceable, has to be lowered by bringing every task done by the enterprise closer to the mainstream (while ensuring that the tasks, taken together, produce the differentiated product). Finance requires successful start-ups to grow up and standardize what they do well, and the entrepreneur has an incentive to make this happen precisely because the firm will be run by others over time.”

12
greater. By the same logic, the level of standardization chosen by a non-VC-backed firm will
be lower than that chosen by a VC-backed firm (since the level of standardization chosen by
a non-VC-backed firm will be the same as the founding family’s preferred optimal
standardization level).
We now make use of the above theoretical framework to develop testable hypotheses on
the role of venture capitalists in transforming the governance and management of family
firms, and the resulting effects on subsequent firm performance and equity valuation.
3.1 The Effect of Venture Capital Investments on Departures of Family Members from
Top Management Positions
We first develop hypotheses related to the departure of family members from
management positions in VC-backed family firms. There is considerable prior evidence that
nepotism based on family relationships hurts the performance of family firms, for example,
by limiting labor market competition for management jobs.18 This suggests that reducing the
involvement of at least the less effective members of the founding family may improve firm
performance. In addition, as discussed above, our theoretical framework based on Rajan
(2012) implies that the level of standardization chosen by VC-backed family firms before
IPO will be greater than that chosen by non-VC-backed family firms. Since standardization
involves replacing founding family members with professional managers, the first hypothesis
we test here is whether VC-backed family firms are more likely to force family members to
depart from top management positions compared to non-VC-backed firms (H1).
Further, the theoretical framework above implies that level of standardization chosen by
a VC-backed family firm will be greater if the bargaining power of the VC relative to the
founding family (as proxied by the VC’s equity ownership in the firm) is greater. Therefore,
we hypothesize that the larger the VC’s shareholdings in the firm, the more likely family
members are to depart from top management positions (H2). 18 For example, Pérez-González (2006) finds that firms where incoming CEOs are related to the departing CEO, to a founder, or to a large shareholder by either blood or marriage, underperform relative to firms that promote unrelated CEOs. Using a sample of Thai family firms, Bertrand, Johnson, Samphantharak, and Schoar (2008) show that the involvement of more of the founders’ sons in the management of family firms is associated with lower firm performance. Finally, using a sample of U.S. family firms, Miller, Le Breton-Miller, Lester, and Cannella (2007) show that Fortune 1,000 family firms that include relatives of the founder as owners or managers never outperform in terms of market valuation, even during the first generation.

13
Another measure of the bargaining power of VCs with respect to the founding family is
board representation of VCs, since this gives them access to more information and greater
ability to potentially influence other board members. Further, in the spirit of Fama and Jensen
(1983) and Williamson (1983), who argue that board composition is shaped by the need for
oversight, it is possible that VCs are more likely to be represented on the boards of family
firms where the need for monitoring is the greatest.19 For both of the above reasons, we
would expect the departure of family members from management positions to be more likely
when VCs are represented on the boards of family firms (H3).
Next, we analyze the original management positions from which family members are
more likely to depart. We classify the original position of family members into top executives,
directors of the board, and members of the board of supervisors. According to China’s
company law, executives and members of the board of directors are in charge of making and
executing the company’s major decisions. However, companies are also required to set up a
board of supervisors to monitor top executives and members of the board of directors to
ensure that they exercise their job functions properly. The positions from which family
members depart may be important for the future performance of the firm: for example, if
family members depart from executive positions or from the board of directors, the effect on
future firm performance may be greater than if they depart from the board of supervisors. We
therefore conjecture that the positions from which family members depart will be related to
the relative power of the VC and the founding family in the firm. Thus, if we use the equity
ownership of VCs as a proxy for their power to make changes in the firm, we expect that the
larger are VC shareholdings, the more likely family members are to depart from executive
positions or from the board of directors; however, if VC shareholdings are smaller, we would
expect family members to depart only from the board of supervisors (which has primarily a
monitoring role) or not to depart at all (H4).
We then explore the effect of VC-backing on the departure of family members with
different relationships to the founder. In Chinese culture, greater importance is placed on
blood-based relationships relative to marriage-based relationships. Therefore, only VCs who
19 Lerner (1995) documents that, in a study of CEO turnovers in biotechnology firms, that VCs’ representation on the boards of their portfolio firms increases around CEO turnover in these firms.

14
have greater bargaining power relative to the founding family are likely to be able to
accomplish the departure of blood-based relatives of the founder from management positions,
while those with lesser power may be able to accomplish the departure of only
marriage-based based relatives or accomplish no departures at all. At the same time, founders
in family firms are long recognized as valuable for the superior performance of family firms,
so that VCs may not encourage founders to leave at all.20 Given the above, using the equity
ownership of VCs as a proxy for their power to make changes in the firm, we hypothesize
that in firms where the VCs have the smallest shareholdings, only marriage-based relatives
are likely to depart from management positions, while in firms with larger VC shareholdings,
both blood-based and marriage-based relatives are likely to depart; with founders expected to
depart only rarely (H5).
3.2 The Effect of Venture Capital Investments on Family Control and Cash Flow Rights
Theoretical papers such as Grossman and Hart (1988) and Harris and Raviv (1988) imply
that deviations from one share-one vote sub-optimally affect firm performance, with the
negative performance effects increasing in the extent of deviation from one share-one vote.
However, there is considerable evidence showing that many family firms are controlled by a
single family, and that the controlling shareholders typically have power over these firms
significantly in excess of their cash flow rights.21 Further, there is evidence that, while firm
value increases with the cash flow rights of the controlling shareholder (consistent with a
positive incentive effect), it falls when the control rights of the largest shareholder exceed his
cash-flow rights (consistent with an entrenchment effect).22
20 See, e.g., Villalonga and Amit (2006), who show that family ownership creates value only when the founder serves as the CEO of the firm or as its Chairman with a hired CEO. See also Fahlenbrach (2009), who find that founder-CEO firms have a higher operating performance and a higher firm valuation than successor-CEO firms. 21 La Porta, Lopez-de-Silanes, and Shleifer (1999) study the firms in 27 wealthy economies and find these firms are typically controlled by families or the State. Further, the controlling shareholders typically have power over these firms significantly in excess of their cash-flow rights, primarily through the use of pyramids. In addition, Claessens, Djankov, and Lang (2000) show that the voting rights of the family frequently exceed their cash-flow rights via pyramid structures and cross-holdings in East Asian countries, and more than two-thirds of these firms are controlled by a single shareholder. 22 Claessens, Djankov, Fan, and Lang (2002) investigate a large number of family firms in eight East Asian countries and find that firm value increases with the cash-flow ownership of the largest shareholder, consistent

15
Given the above, another aspect of standardization is to establish a more balanced
ownership structure in family firms prior to their IPO, so as to obtain a higher equity
valuation upon IPO. To establish such an ownership structure, VCs may encourage founding
families in these firms to give up a part of their ownership, and attempt to reduce the excess
of family control rights over cash flow rights. We therefore postulate that family control
rights and cash-flow rights will drop to a significantly greater extent in VC-backed family
firms compared to non-VC-backed family firms during the three-year period pre-IPO (H6).
Further, since the excess of family owners’ control rights over their cash-flow rights has a
negative effect on firm performance and value, we also expect that the separation between
family control rights and cash-flow rights to be reduced to a significantly greater extent in
VC-backed firms compared to non-VC-backed firms during the three-year period pre-IPO
(H7). We also expect that family owners in VC-backed firms are significantly more likely
than family owners in non-VC-backed firms to lose voting control of the firm (H8).
It is also likely that the power of VCs relative to that of the founding family affects their
ability to make changes in family firms’ ownership and control structure. Therefore, if we use
the equity ownership of VCs as a proxy for their power to make changes in the firm, we
expect family firms where VCs have greater equity ownership to experience greater
reductions in the family’s control rights and the separation between their control and cash
flow rights (H9).23 Further, as discussed under hypothesis H3, since membership on the
firm’s board gives VCs access to more information and greater ability to potentially influence
other board members, we expect the above changes to be more likely in family firms where
VCs serve on the board of directors (H10).
Finally, we analyze the type of family member, namely, founder, blood-based relatives of
the founder, or marriage-based relatives whose shareholdings are most likely to be reduced in
with a positive incentive effect; however, firm value falls when the control rights of the largest shareholder exceed his cash-flow rights, consistent with an entrenchment effect. The above evidence suggests the importance of minimizing the separation between control rights and cash-flow rights of the controlling shareholder. 23 Given the possibly ambiguous effect of reductions in family cash flow rights on firm value (recall that family equity ownership may have both incentive and entrenchment effects), we are agnostic about the direction of the relationship between VC equity ownership and the reduction in family cash flow rights in VC-backed versus non-VC-backed family firms.

16
a VC-backed family firm. Under hypothesis H5, we postulated that marriage-based relatives,
rather than founders or blood-based relatives, are most likely to be forced to depart from
management positions in VC-backed family firms. However, in terms of ownership structure,
only reducing the shareholdings of marriage-based relatives is likely to have little effect on
family control of firms, since the original shareholdings of marriage-based relatives are low.24
Therefore, if VCs want to standardize the ownership structure of a family firm to a greater
extent by reducing the negative effect of family entrenchment and increase the balancing
power of outsider block-holders, they will have to encourage not only marriage-based
relatives, but also founders and blood-based relatives to reduce their equity ownership. We
therefore expect that the ownership of founders and blood-based relatives, as well as that of
marriage-based relatives, will drop to a greater extent in VC-backed than in non-VC-backed
family firms, and that the extent of their ownership reduction will be increasing in the
bargaining power of the VC relative to that of the founding family, as proxied by the VCs’
equity ownership in the firm (H11).
3.3 The Effect of Corporate Governance Changes Induced by VC Investments on the
Post-IPO Operating Performance and Valuation of Family Firms
The benefits arising from standardization in our theoretical framework developed above
is the higher operating performance equity market valuation that will accrue to the firm upon
IPO, and consequently higher cash flow benefits to both the VC and the founding family,
who hold equity stakes in the firm. We therefore hypothesize that the corporate governance
reforms (such as the departure of family members from top management positions, as well as
the reduction of the founding family’s excess control rights over their cash-flow rights)
occurring in the years prior to IPO will translate into improved post-IPO operating
performance for family firms. Further, since, under symmetric information, the stock market
value of a firm is simply the present value of its future cash flow stream, we expect that such
corporate governance reforms accomplished in VC-backed family firms will also translate
24 In our sample, the shareholdings of founders, blood-based relatives, and marriage-based relatives at the beginning of the three-year period prior to IPO are 51%, 12%, and 12%, respectively.

17
into higher immediate (post-IPO) secondary market valuations (H12).25
A related interesting question is whether, if the corporate governance reforms undertaken
by VC-backed family firms indeed translate into better post-IPO operating performance and
firm valuation, these performance and valuation effects are greater in VC-backed firms than
in non-VC-backed firms (H13), i.e., for a given extent of changes in corporate governance,
are the performance and valuation effects greater in VC-backed family firms than in
non-VC-backed family firms? This may indeed be the case if, along with corporate
governance improvements they help firms make, VCs help family firms they invest in make
other changes which make these corporate governance reforms translate more effectively into
better operating performance and valuation. One example of such possible improvements
made by family firms with the help of VCs may be to not only secure the departure of family
members from top management positons, but also to replace these departing family members
with higher quality management team members.26 Further, in terms of changing ownership
structure, VCs may not only be able to help family firms reduce the founding family’s
ownership, but also to secure equity investments from new high value-added shareholders
who may be able to intensively monitor the founding family and top executives, or to bring in
additional business resources helpful to the firm.
4. Data, Sample Selection, and Variables
4.1 Data and Sample
Our original sample contains all family firms listed on China’s SME (Small and
Medium-sized Enterprise) board and GEM (Growth Enterprise Market) from 2004 to 2012.27
We define family firms as firms where founding family members are the largest shareholders
25 Consistent with this, prior literature has shown that firms underperform when multiple family members are involved in owning or managing the business (see, e.g., Miller, Le Breton-Miller, Lester, and Cannella (2007)), or when control rights of the founding family are significantly in excess of their cash-flow rights (see, e.g., La Porta, Lopez-De-Silanes, Shleifer, and Vishny (2002), Claessens, Djankov, Fan, and Lang, (2002), Barontini and Caprio (2006), and Villalonga and Amit (2006)). 26 See, e.g., Hellmann and Puri (2002), or Chemmanur, Simonyan, and Tehranian (2013), who show that VCs may help firms they invest in improve their management quality. 27 China’s SME (Small and Medium-sized Enterprise) board is set up in 2004, and GEM (Growth Enterprise Market) is set up in 2009. There are very few family firms listed on China’s main board because the main purpose of setting up China’s main board is for State-owned enterprises to go public.

18
and more than one member of the founding family continue to hold positions as top
executives, directors, supervisors, or block-holders (ownership being 5% or higher) of the
company.28 After excluding ST (Specially Treated) companies,29 we obtain a final sample of
499 family firms. For each family firm, we hand-collect relevant information on family
members involved in the family business, and we arrive at a sample of 1,378 family members
who hold positions as top executives, directors, or supervisors, as well as a sample of 1,341
family members who hold equity ownership of the family firms.
The main advantage of using data from China for this study compared to data from the
U.S. and other countries is that the China Securities Regulatory Commission (CSRC – the
“Chinese SEC”) requires companies going public to disclose, in their IPO prospectuses,
information including their management teams (top executives, directors, and supervisors)
and all management turnovers, as well as every change of ownership structure (including
changes of shareholders and their shareholdings), from firm inception to IPO. We
hand-collect management positions and management turnover of family members from the
section of “Directors, Supervisors, and Top Executives” in IPO prospectuses. The data for
calculating family ownership structure change is hand-collected from the “Historical Change
of Ownership Structure and Major Assets Restructuring since Inception” section of IPO
prospectuses. We also search the resumes of founders and other family members contained in
IPO prospectuses for information on their political connections, business connections, gender,
age, education background, and their family relationships to firm founders. Accounting data
in the three-year period pre-IPO and in the post-IPO period are obtained from IPO
prospectuses and the CSMAR database, respectively. Stock price data come from the
CSMAR database as well.
28 There is a wide-ranging literature on family business, and it is somewhat difficult to find consensus on the exact definition of family firms. The typical family business has been characterized as an organization controlled and usually managed by multiple family members (see, e.g., Shanker and Astrachan (1996) and Lansberg (1999)), often from multiple generations (see, e.g., Anderson and Reeb (2003), and Gomez-Mejia, Haynes, Nunez-Nickel, Jacobson, and Moyano-Fuentes (2007)). Since most of the family firms in China are established after Deng Xiaoping’s economic reform in 1978, only a few of them have been succeeded by their second generations. 29 ST (Specially Treated) companies are those companies with two consecutive annual losses. The range of daily stock price fluctuations is limited within ±5%. Since their financial and trading characteristics are different from most other listed companies, we exclude these companies.

19
We hand-collect information on each round of VC financing from the section of
“Historical Change of Ownership Structure and Major Assets Restructuring since Inception”
in IPO prospectuses, which provides detailed information on each round of equity financing
from VCs and other shareholders.30 We identify VC financings, i.e., equity financings in
which VCs are new shareholders, if the new shareholder is included in the lists of VCs in the
“2003-2012 China Venture Capital Development Reports (CVCD Reports)” (Wang and Wang,
2003-2012), which are compiled by the Chinese Academy of Science and Technology for
Development (CASTED). In addition to using CVCD Reports, we also use VC lists provided
by the WIND VC database to double-check whether a shareholder is indeed a VC. We
identify 210 family firms as VC-backed among a total of 499 family firms in our sample
(42%). We also hand-collect data on VC shareholdings immediately after the first-round of
VC financing, as well as VC representations on boards (i.e., VCs serving as directors), from
IPO prospectuses.
4.2 Measures of Corporate Governance Changes
In this subsection, we describe the construction and measurement of corporate
governance changes of family firms in the pre-IPO period. We investigate two aspects of
corporate governance changes in sample family firms: departures of family members from
management positions, and changes of family control rights and cash-flow rights.
We measure departures of family members from top management positions at both
firm-level (Turnover1) and family-member-level (Turnover2). For VC-backed firms,
Turnover1 equals one if at least one of the family members depart from the positions of top
executive, director, or supervisor during the period from the first-round of VC investment to
IPO or in the three-year period prior to IPO, and zero otherwise.31 For non-VC-backed firms,
30 The information we collect include the date of financing, the identity of new shareholders, the amount of equity financing, and the ownership structure (i.e., a list of shareholders and their shareholdings) after the financing. 31 In particular, if a VC-backed firm receives the first-round VC investment in the pre-IPO three-year period, we measure departures of family members from management positions during the period from first-round VC investment to immediately before IPO. If a VC-backed firm receives the first-round VC investment before the three-year period pre-IPO, we measure departures of family members from management positions during the three-year period pre-IPO. The same principle is also similarly applied while constructing several other variables, including △Control rights, △Cash-flow rights, △Separation, Control loss, and △Shareholding.

20
Turnover1 equals one if at least one of the family members depart from the positions of top
executives, directors, or supervisors in the three-year period prior to IPO, and zero otherwise.
We focus on management turnover and other corporate governance changes in the three-year
period pre-IPO because 82.5% of VC-backed family firms in our sample received their
first-round VC investments in the three-year period pre-IPO. Following Lehn and Zhao
(2006), we classify a turnover as a forced turnover, if the departing family member is under
the age of 65 and there are no announcements or reports showing that the reason for the
departure is related to death, poor health, or acceptance of another position. The
family-member-level measure of departures of family members from management positions
(Turnover2), equals one if the family member departs after the first-round VC investment and
in the three-year period pre-IPO (for VC-backed firms), or in the three-year period pre-IPO
(for non-VC-backed firms), and zero otherwise.
We also construct the following five variables to measure the change in ownership
structure of family firms. First, the percentage change of control rights (△Control rights). △
Control rights equals the founding family’s control rights immediately before IPO divided by
the founding family’s control rights immediately before the first-round VC investment or at
the beginning of the pre-IPO three-year period, and then minus one (for VC-backed firms), or
the founding family’s control rights immediately before IPO divided by the founding family’s
control rights at the beginning of pre-IPO three-year period, and then minus one (for
non-VC-backed firms). Control rights measure the controlling shareholder’s ability to affect
firm decisions, such as, elections of directors to the board and appointments of supervisors.
Following Claessens, Djankov, and Lang (2000), when there are multiple control chains; we
take control rights to be the sum of the voting rights along the chain with the weakest link of
all the holding layers. For example, family A owns 30% of company B, which in turn owns
20% of company C. In addition, family A owns 20% of company D directly, which in turn
owns 10% of company C (this share ownership structure constitutes the second control chain
of family A over company C). As a result, Family A’s voting rights over company C are
determined as Min(30%, 20%) + Min(20%, 10%) = 30%. We then aggregate direct and
indirect voting rights to obtain total control rights.
Second, the percentage change of cash-flow rights (△Cash-flow rights), equals the

21
founding family’s cash-flow rights immediately before IPO divided by the founding family’s
cash-flow rights immediately before the first-round VC investment or at the beginning of the
pre-IPO three-year period, and then minus one (for VC-backed firms), or the founding
family’s cash-flow rights immediately before IPO divided by the founding family’s cash-flow
rights at the beginning of the pre-IPO three-year period, and then minus one (for
non-VC-backed firms). We measure “cash-flow rights” as the controlling shareholder’s
percentage ownership of profits/losses and dividends of a firm. A high percentage of
ownership by the controlling shareholder provides strong incentives to maximize firm value
and minimize agency misconduct. If there are multiple chains of ownership, then cash-flow
rights along each chain are the product of all ownership rights of intermediate companies
within that chain. The total cash-flow rights are the sum of all cash-flow rights from all
ownership chains, as similarly defined in Claessens, Djankov, and Lang (2000). Using the
example above, the cash-flow rights of family A over company C would be calculated as 30%
×20% + 20%×10% = 8%.
Third, the change of the separation between control rights and cash-flow rights (△
Separation), is measured as the separation between founding family’s control rights and
cash-flow rights immediately before IPO, minus the separation immediately before the
first-round VC investment or at the beginning of the pre-IPO three-year period (for
VC-backed firms), or minus the separation at the beginning of the pre-IPO three-year period
(for non-VC-backed firms). Separation between control rights and cash-flow rights of the
controlling shareholder measures the degree of divergence from the one share-one vote
ownership structure, which can be viewed as the controlling shareholder’s motive to extract
wealth from the firm. Under such a governance structure, the controlling shareholder receives
the entire benefit of wealth expropriation, but bears only a fraction of the cost.
Fourth, losing voting control (Control loss), is an indicator variable which equals one if
(and zero otherwise) the total shareholdings of founding family members declines from above
50% to below 50% during the period from the first-round of VC investment to IPO or during
the three-year period prior to IPO (for VC-backed firms), or during the three-year period prior
to IPO (for non-VC-backed firms). If the founding family does not have voting control of the
firm before the first-round VC investment or at the beginning of the pre-IPO three-year

22
period, we set the Control loss variable as missing value.
Fifth, the change of shareholdings of a specific family member (△Shareholding) is
defined as the shareholdings of a certain family member immediately before IPO divided by
his/her shareholdings immediately before the first-round VC investment or at the beginning
of the pre-IPO three-year period, and then minus one (for VC-backed firms), or the
shareholdings of a certain family member immediately before IPO divided by his/her
shareholdings at the beginning of the pre-IPO three-year period, and then minus one (for
non-VC-backed firms).
4.3 Measurements of Post-IPO Operating Performance and Firm Valuation
Immediately after IPO
To examine the economic outcome of corporate governance changes due to VC-backing,
we construct proxies for post-IPO operating performance and firm valuation immediately
after IPO.
Post-IPO operating performance, △Adjusted OROA, is measured as the change of
industry- and performance-adjusted operating return on assets (OROA) by subtracting the
industry- and performance-adjusted OROA in the year prior to the issue (year -1) from the
industry- and performance-adjusted OROA in subsequent years (years 0 through 3). OROA is
the ratio of operating income over the book value of assets. Industry-adjusted OROA equals
OROA minus the median OROA of the relevant industry. The industry classification (22
groups) here and after is based on the CSRC industry classifications, with two digits for
manufacturing industries and one digit for other industries32. Industry and performance
adjusted OROA is calculated as industry-adjusted OROA minus the median OROA of a
control group of firms with similar performance. Performance controls are created by
dividing all of the firms listed on China’s SME and GEM boards into deciles sorted by
industry-adjusted OROA in the year prior to IPO.
We construct proxies for IPO firm valuation, following the method used in Chemmanur,
Simonyan, and Tehranian (2013). First, we calculate the Tobin’s Q of a specific firm, which
32 We use two digits for manufacturing industries because 60% of listed companies in China belong to manufacturing industries.

23
is the ratio of the market value of assets over the book value of assets, where the market value
of assets is equal to the book value of assets minus the book value of equity plus the product
of the number of shares outstanding and share price. We measure IPO firm valuation in the
secondary market by using either the first trading day closing price as the share price in the
above definition (QFTD) or the share price at the end of the IPO issue month (QIM). Second,
we construct industry-adjusted Q ratios (QFTDADJ and QIMADJ) by subtracting industry
median Q ratios from the above proxies based on CSRC industry classifications. The book
value of assets and the book value of equity for both IPO firms and industry peers are taken
from the first available post-IPO quarter. The number of shares outstanding for IPO firms and
industry peers is taken from the first available post-IPO quarter as well, and the share prices
of industry peers are the IPO month closing prices.
4.4 Other Variables
In order to separate the effect of VC investments from that of other aspects of firm
quality and family characteristics, we include the following variables as controls in our
multivariate tests. First, given that political connections of family members, business
connections and education background of the founder, and the age of the family firm may
affect family control and management, we construct the following variables: Political
connection is a dummy variable that equals one if one of the family members, who serve as
top executives, directors, supervisors, or block-holders, was a former government official,
military officer, deputy of the National People’s Congress (NPC), or a member of the Chinese
People’s Political Consultative Conference (CPPCC), and zero otherwise. Business
connection is a dummy variable that equals one if the founder is serving or used to serve as
the leader of the industry association, and zero otherwise.33 Education takes the value of one
if the founder has received a bachelor’s degree or above, and zero otherwise. Firm age is the
natural logarithm of the number of years from firm inception to IPO.34 In addition, the
33 If there are more than one founders, we select the main founder who has the larger shareholdings than the other founder(s), or hold the higher position (e.g., chairman of board of directors) when his/her shareholdings is the same as the other founder(s). 34 These factors could have positive or negative effects. On the one hand, if family members have stronger political connections, or if the founder has a wider range of business connections, or better education
24
changes in corporate governance are likely to be affected by firms’ financial status. For
example, the poorer the firm performance, perhaps the stronger the incentive of the firm to
improve corporate governance. Thus, we add three financial variables as controls. Size is the
natural logarithm of total assets three years pre-IPO. Leverage is defined as total debt divided
by total assets three years pre-IPO. Prior ROA is defined as net income divided by total assets
three years pre-IPO. In instrumental variable regression analysis, we use two instruments for
VC-backing dummy, namely, Number of local VCs which is the number of VC companies in
the family firm’s headquarter province in the year of firm founding or incorporation, and
Government Research grant/GDP which is the amount of research grants from the provincial
government divided by GDP of the family firm’s headquarter province in the year of firm
founding or incorporation.
4.5 Summary Statistics
Panels A, B, and C of Table 1 present summary statistics of dependent variables,
independent variables, and control variables, respectively. Panel A shows that the mean of
Turnover1 is 32.3%, suggesting that 32.3% of family firms have at least one family member
departing from top management positions during the three-year period prior to IPO. The
mean of family-member-level measure of family members departing from management
positions (Turnover2) is 12.8%, which means that 176 out of 1,378 sample family members
depart from their management positions. During the three-year period prior to IPO, on
average, family control rights drop by 5.7%, family cash-flow rights drop by 6.6%, the
separation of family control rights and cash-flow rights slightly increase by 0.3%, 7.3% of
founding families lose voting control (i.e., family ownership declines from above 50% to
below 50%), and the shareholdings of family members decrease by 4.7%. The changes of
industry- and performance-adjusted operating return on assets (OROA) from the year prior to
IPO (year -1) to IPO year (year 0), and the three years after IPO (years 1 through 3) are -5.7%,
background, or the family has operated the firm for a longer time, the founding family may have stronger negotiation power relative to VCs, and thus VCs could find it more difficult to force family members to depart from management positions, or to reduce family control rights and cash-flow rights. On the other hand, if the founder has a wider range of business connections, or better education background, he/she may rely less on the other family members in managing the family firm, and may provide more support for VCs to change the corporate governance of the family firm.

25
-5.1%, -4.8%, and -2.7%, respectively. It confirms the phenomenon of long-run post-IPO
underperformance of China’s listed companies. The mean (median) value of the two
measures of industry-adjusted Tobin’s Q (QFTDADJ and QIMADJ) are 0.495 (0.196) and
0.343 (0.070), respectively, suggesting that the Tobin’s Q of IPO firms in the secondary
market immediately after the IPO is higher than the Tobin’s Q of their industry peers.
Panel B shows that 42.1% of family firms are VC-backed. The average of VC
shareholdings is 5.1% in the whole sample and 12.2% in VC-backed firms. In 26.9% of
family firms, or 63.9% of VC-backed family firms, at least one venture capitalist serves on
the board of directors. Panel C shows family and firm characteristics of family firms. We find
54.3% of founding families have political connections, 56.3% of them have built a wide
range of business connections in the industry, 58.1% of founders have bachelor’s degrees or
above. The average firm age is around 10 years, and the average firm size is around 455
million Chinese RMB. The average leverage ratio and prior ROA (return on assets) are 55.1%
and 12.6%, respectively. The average number of VC companies in the family firm’s
headquarter province in the year of founding or incorporation is 68.6. The average ratio of
provincial government research grants to GDP in the family firm’s headquarter province in
the year of founding or incorporation is 0.4%.
5. Empirical Tests and Results
5.1 The Effect of VC Investments on Departures of Family Members from Top
Management Positions
5.1.1 Logit Analysis of the Effect of VC Investments on Departures of Family Members
from Top Management Positions
To examine the effect of VC investments on departures of family members from top
management positions, we develop the following logit regression models:
0 1 2 3 4
5 6 7 8 ,
( )
(1)i t
logit Turnover1 VC dummy Political connection Business connection Education
Firm age Size Leverage Prior ROA Industry dummy
0 1 2 3 4
5 6 7 8 ,
( )
(2)i t
logit Turnover2 VC dummy Political connection Business connection Education
Firm age Size Leverage Prior ROA Industry dummy

26
Model (1) is a firm-level regression using a sample of 499 publicly listed family firms.
We regress the firm-level indicator of family members departing from management positions
(Turnover1) on a dummy variable which equals one for VC-backed firms and zero for
non-VC-backed firms (VC dummy), and a set of control variables including political
connections of family members (Political connection), business connections of the founder
(Business connection), education background of the founder (Education), logarithm of firm
age (Firm age), natural logarithm of total assets (Size), leverage ratio (Leverage), prior return
on assets (prior ROA), and industry fixed effects based on the CSRC industry classifications.
Model (2) is a family-member-level regression using a sample of 1,378 individual family
members who hold positions as top executives, directors, or supervisors in family firms. The
dependent variable of Model (2) is the family-member-level indicator of family members
departing from management positions (Turnover2). Definitions of all independent variables
in Model (2) are the same as those in Model (1).
We report estimated results of Model (1) in Columns 1 to 4 of Table 2. Column 1 is the
baseline regression without any control variables. We find that the coefficient of the VC
dummy is positive and statistically significant. In Column 2, this result still holds, after
adding control variables. These results suggest that family members are more likely to depart
from top management positions in VC-backed firms than in non-VC-backed firms. The
coefficients reported in Table 2 are logit estimates of the effect of a marginal change in the
corresponding factor on the probability of family members departing from management
positions. Thus, based on the coefficient estimate in Column 2, the probability of family
members departing from management positions in VC-backed firms is 8.9% higher than that
in non-VC-backed firms. As for control variables, only Business connection is statistically
significant. The positive coefficient estimate might suggest that family firms with wide
business networks rely less on other family members, and thus other family members are
more likely to depart from family businesses.
In Column 3, we further investigate whether the relative power of VCs versus the
founding family affects VCs’ ability to force family members to depart from top management
positions. To examine this, we use a logit regression model similar to Model (1), but the main
independent variable is total shareholdings of VCs immediately after the first-round of VC

27
investment (VC shareholdings), which is a proxy for VCs’ power to make changes in the
firms. The coefficient estimate of VC shareholdings is positive and statistically significant at
1% level, suggesting that the probability of family members departing from top management
positions increases with VC shareholdings.
In Column 4, we further analyze whether VC board representation affect VCs’ ability to
force family members to depart from top management positions. We use a logit regression
model similar to Model (1), but interacting VC dummy with VC director (an indicator variable
taking the value of one if VCs have board representation, and zero otherwise) and with
No-VC director (an indicator variable taking the value of one if VCs do not have board
representation, and zero otherwise), respectively. The regression coefficient of VC
dummy×VC director estimates the effect of VC-backing on the departure of family members
from management position among VC-backed firms where VCs have board representation;
while the estimated coefficient of VC dummy×No-VC director estimates such an effect
among VC-backed firms where VCs do not have board representation. The results in Column
4 show that the coefficient estimate of VC dummy×VC director is positive and significant at 1%
level; while the coefficient estimate of VC dummy×no-VC director is negative and not
significant. The results suggest that VCs are able to force some family members to depart
from top management positions only when VCs serve on the board of directors.
In Columns 5 to 8, we report results for Model (2), which is a family-member-level
analysis. We show that our findings from firm-level analysis still hold. The economic
significance is also not negligible. For example, in Column 6, we find that the turnover
probability of family members in VC-backed firms is 3.7% higher than those in
non-VC-backed firms.
Overall, our results based on both firm-level and family-member-level analyses suggest
that VC-backed family firms are more likely to force family members to depart from top
management positions compared to non-VC-backed family firms, providing support for
hypothesis H1. Our results also suggest that that the larger VC shareholdings, the more likely
family members are to depart from top management positions, providing support for
hypothesis H2. Finally, the results show that family members are more likely to leave top
management positions when VCs are represented on the board of directors, providing support

28
for hypothesis H3.
5.1.2 Propensity Score Matching Analysis of the Effect of VC Investments on Departures
of Family Members from Management Positions
We recognize that the decision of VCs to invest in family firms is not entirely exogenous
and may depend on characteristics of these firms, such as, their industry, size, the proximity
to VC firms, and the difficulty perceived by VCs in changing firm corporate governance.
Ideally, to study the effect of VC-backing on the probability of family members departing
from management positions, we need to measure the probability of family members departing
from management positions of the same firm with versus without VC-backing. However, we
observe each firm only once. After a firm has received VC financing, we will not be able to
observe it without VC financing. Since the decision to receive VC financing is endogenous, it
may introduce bias into our analysis when comparing the probability of family members
departing from management positions in VC-backed firms with that in non-VC-backed firms.
Several papers (see, e.g., Rubin (1974, 1977) and Rosenbaum and Rubin (1983)) have
shown that in such situations comparing firms matched on their propensity of being treated
(in our case, the propensity of receiving VC financing) tends to eliminate the potential bias.
Following the methodology described in Lee and Wahal (2004) and Chemmanur, Simonyan,
and Tehranian (2013), we match each VC-backed firm in our sample with one or several
non-VC-backed firms using the one-to-one “nearest neighborhood” propensity score,
Gaussian kernel, and regression-adjusted local linear matching approaches. This
methodology involves two stages. In the first stage, we run probit regressions with an
indicator variable as the dependent variable, which equals one for VC-backed firms and zero
for non-VC-backed firms, on a set of independent (matching) variables. The set of
independent (matching) variables includes CSRC industry code dummy variables, the
dummy variables indicating the province in which a family firm’s headquarter is located, the
natural logarithm of total assets three years prior to IPO, the natural logarithm of firm age
three years prior to IPO, the number of family members who are co-founders of the family
firm, the total ownership of founding family members when the family firm was first set up,
the education background of founders (a dummy variable which equals one if the founder has

29
received a bachelor degree or above, and zero otherwise). The last three variables are used to
capture the difficulty VCs perceive in changing firm corporate governance. All matching is
conducted with replacement and common support.35
Using each matching estimator, we calculate the mean difference between the probability
of family members departing from management positions in VC-backed firms and matched
non-VC-backed firms, and then compute bootstrapped standard errors (with 50 replications)
of these mean differences to conduct our statistical tests. Panel A of Table 3 reports these
mean differences along with their test statistics. Based on the matching methods, we find
non-VC-backed matching firms for 206 VC-backed firms. The pseudo-R2 of the first-stage
regression is 0.13, suggesting that our matching variables are good predictors of VC-backing.
For brevity, we do not report results for the first-stage regressions.
Panel A of Table 3 shows that with the propensity score method, the average difference
in the probability of family members departing from management positions is 10.7%. The
standard error of this estimate is 4.9%, and the 95% confidence interval is between 1.1% and
20.3%. The average estimates using the Gaussian kernel and regression-adjusted local linear
matching approach are 8.9% and 9.3%, respectively, and these estimates are statistically
significant.
Further, we use our one-to-one propensity score matched sub-sample (206 VC-backed
firms and 126 non-VC-backed firms) to run regressions with the indicator variable of family
members departing from management positions (Turnover1) as the independent variable, on
VC dummy and a set of control variables as described in Model (1). Since in this sub-sample
some non-VC-backed firms are used as a match for several VC-backed firms, we make use of
weighted least squares (WLS) regressions where the weight for each VC-backed firm is equal
to one, whereas the weight for each non-VC-backed firm is equal to the number of times it is
used as a match for VC-backed firms in this sub-sample. The results of the regression are
reported in Panel B of Table 3. We find that VC dummy is positive and statistically significant,
implying that VC-backing increases the probability of family members departing from top
management positions, even after controlling for the potential endogeneity of VC-backing
35 We run probit regressions with the option of “common support,” which drops treatment observations (VC-backed firms) whose propensity scores are higher than the maximum or less than the minimum propensity score of the controls (non-VC-backed firms).

30
and other firm characteristics variables. In summary, the results of the propensity score
matching analysis provide further support for Hypothesis H1.
5.1.3 The Effect of VC Investments on Departures of Different Types of Family Members
from Management Positions
We start by analyzing the original management positions from which family members are
more likely to depart from due to VC investment. We classify the 1,378 sample family
members into three sub-samples based their management positions: board directors (1,059),
top executives (659), and members of board of supervisors (166). The total number of firm
management positions, 1,920 (1,059 + 695 + 166), exceeds the total number of family
members who hold management positions (1,378), because a family member may hold
multiple positions. We estimate the logit model which regresses Turnover2 on VC dummy (an
indicator of VC-backed firms) or VC shareholdings (total shareholdings of VCs after the first
round of VC investments), for the above three subsamples, respectively. We also control for a
set of variables as described in Model (2). Table 4 reports the regression results.
We find that the effect of VC-backing on the probability of family members departing
from top executive positions is not significant (Columns 1 and 2). However, the relative
power of VCs versus the founding family, as proxied by VC shareholdings, has a positive and
statistically significant effect on the probability of family members departing from top
executive positions (Column 3). These results indicate that VCs are able to achieve
departures of family members from important positions, such as top executive positions, only
when they have greater power relative to the founding family.
The results in Columns 4, 5, and 6 show that both VC-backing and VC shareholdings do
not have statistically significant effects on the probability of family members departing from
board directors. By contrast, the effect of VC-backing and VC shareholdings on the
probability of family members departing from the board of supervisors is positive and
statistically significant (Columns 7, 8, and 9). These results suggest that it is easier for VCs to
force family members who serve on the board of supervisors to leave, as the job function of
supervisors is mainly monitoring and advising, and supervisors have less power than top
executives and board directors.

31
Further, we analyze the effect of the relative power of VCs versus the founding family on
the importance of positions from which family members depart, by utilizing an ordered logit
regression model. The dependent variable is the order of importance of departed positions: 3
if family members depart from top executives, 2 if they depart from directors of board, 1 if
they depart from board of supervisors, and 0 if they do not depart from any positions. Our
results show that VC shareholdings (proxy for VCs’ power) have a positive and statistically
significant effect on the order of importance of the positions from which family members
depart (Column 10 in Table 4). In particular, when VC shareholdings are larger, family
members are more likely to depart from top executive positions, while when VC
shareholdings are smaller, family members only depart from the board of supervisors or do
not depart at all. Overall, results in Table 4 provide support for hypothesis H4.
Next, we analyze the effect of VC investments on departures of family members with
different relationships to the founder. We divide sample family members into three
subsamples: blood-based family members (480), marriage-based family members (403), and
founders (495). We estimate Model (2) in these three subsamples, respectively.
The results are presented in Table 5. We find that the effect of VC-backing on the
probability of blood-based relatives departing from management positions is positive but not
statistically significant (Columns 1 and 2). However, VC shareholdings have positive and
significant effect on the probability of blood-based relatives departing from management
positions (Column 3), suggesting that VCs could achieve departures of blood-based relatives
from family firms only when VCs have greater power relative to the founding family. We
further show that the effects of VC-backing and VC shareholdings on the probability of
marriage-based relatives departing from management positions are positive and statistically
significant (Columns 4, 5, and 6). However, VC-backing and VC shareholdings have no
significant effect on the probability of founders departing from management positions
(Columns 7, 8, and 9). In summary, these results together suggest that when VCs have less
power relative to the founding family, they could only force marriage-based relatives to leave,
while when VCs have stronger power, they could even force both marriage-based and
blood-based relatives to leave. The insignificant effect of VC investments on the probability
of founders departing from management positions may suggest that even if VCs have

32
stronger power (i.e., larger shareholdings), it is still difficult for them to force founders to
leave, as VCs’ shareholdings are usually lower than the founding family. It could also suggest
that VCs may not attempt to force founders to leave, because founders are recognized as
valuable for the outperformance of family firms (see e.g., Villalonga and Amit (2006) and
Fahlenbrach (2009)).
Further, we analyze the effect of the relative power of VCs versus the founding family on
the order of departures of family members with different levels of importance in relation to
the founder, by utilizing an ordered logit regression model. The dependent variable is the
order of importance in relation to founders: 3 if founders depart, 2 if blood-based family
members depart, 1 if marriage-based family members depart, and 0 if family members do not
depart from management positions. We find that the coefficient estimate of VC shareholdings
is positive and highly significant, suggesting that the larger the VC shareholdings, the more
likely founders or blood-based family members are to depart from top management
positions.36 On the other hand, if VCs’ shareholdings are smaller, only marriage-based family
members are to depart from management positions, or none of the family members depart.
Overall, results in Table 5 provide support for hypothesis H5.37
5.2 The Effect of VC Investments on Family Control Rights and Cash-flow Rights
5.2.1 Ordinary Least Squares (OLS) Regression Analysis of the Effect of VC Investments
on Family Control Rights and Cash-flow Rights
In this subsection, we examine the effect of VC investments on the change of the
founding family’s control rights, cash-flow rights, and the separation between control rights
and cash-flow rights. We estimate an ordinary least squares (OLS) regression model specified
as follows:
36 Based on results from Columns 1-3 and Columns 7-9 in Table 5, the findings here are driven primarily by departures of blood-based family members, as opposed to founders, from top management positions. 37 For brevity, in untabulated results of this paper (Table A1 in the Internet Appendix), we compute numbers and percentages of different types of departing family members. We find that differences in frequencies of family members departing from management positions between VC-backed and non-VC-backed firms are mainly driven by family members serving on boards of supervisors, and marriage-based family members are more likely to depart in VC-backed firms than in non-VC-backed firms. These findings are consistent with the results reported in Tables 4 and 5.
33
0 1 2 3
4 5 6 7 8 ,
/
(3)i t
Dependent variable VC dummy VC shareholding Political connection Business connection
Education Firm age Size Leverage Prior ROA Industry dummy
where the dependent variables in different specifications are various proxies for the change of
family control rights and cash-flow rights: the percentage change of family control rights (△
Control rights), the percentage change of family cash-flow rights (△Cash-flow rights), the
change of the separation between family control rights and cash-flow rights (△Separation),
and an indicator variable of whether the founding family loses voting control (Control loss).
The main independent variables in different specifications are different measures of VC
investments, which include VC dummy (an indicator variable of whether a family firm is
VC-backed) and VC shareholdings (total shareholdings of VCs after first round of VC
investments in the family firm).
The estimated results of Model (3) are presented in Table 6. Columns 1 to 4 report the
estimated results with the change of family control rights (△Control right) as the dependent
variable. We find that VC-backing has a negative and statistically significant effect on the
change of family control rights (Columns 1 and 2). The economic significance is also
substantial. The decrease of family control rights in VC-backed family firms is 8% larger
than that in non-VC-backed family firms. We further investigate whether the relative power
of VCs versus the founding family, as proxied by VC shareholdings, affect VCs’ ability to
make changes in family control rights. We find that VC shareholdings have a negative and
statistically significant effect on the change of family control rights (Column 3). A 1%
increase in VC shareholdings is associated with a 0.5% decrease in family control rights.
Next, we investigate whether the effect of VC-backing on family control rights is
stronger if VCs serve on the board of directors. We interact VC dummy with VC director (an
indicator variable of whether VCs have board representation) and with no-VC director (an
indicator variable of whether VCs do not have board representation), respectively. The results
presented in Column 4 show that the coefficient estimate of VC dummy×VC director is
negative and statistically significant; while the coefficient estimate of VC dummy×no-VC
director is negative but not significant. These results indicate that the effect of VC-backing
on the reduction of family control rights is statistically significant only when VCs serve on

34
the board of directors.
In terms of control variables, the coefficient of firm size is significantly positive,
suggesting that the founding family loses less control rights when they have stronger
negotiation power arising from larger size. Interestingly, we find that founders with better
education background experience smaller decline of family control rights, than those with
lower education background. This result may suggest that a founder with lower education
background may not be able to satisfy the demand of firm growth and development, and
therefore, the reduction of founding family control rights is optimal for shareholder value
maximization.
In Columns 5 to 8, we use the same specifications to estimate the effect of VC
investment on the change of family cash-flow rights (△Cash-flow rights). We find that both
VC-backing and VC shareholdings are negatively associated with the extent of reduction of
family cash-flow rights (Columns 5, 6, and 7). The extent of reduction of family cash-flow
rights in VC-backed family firms is 6.5% to 6.8% larger than that in non-VC-backed family
firms (based on the coefficient estimates of VC dummy in Columns 5 and 6). We also show
that the effect of VC-backing on the reduction of family cash-flow rights is statistically
significant only when VCs serve on the board of directors (Column 8).
Columns 9 to 12 report estimated results with the change of the separation between
family control rights and cash-flow rights (△Separation) as the dependent variable. We show
that both VC-backing and VC shareholdings are negatively associated with the extent of
reduction of the separation between family control rights and cash-flow rights (Columns 9, 10,
and 11). The decrease in the separation between family control rights and cash-flow rights is
around 0.7-0.8% larger for VC-backed firms than that for non-VC-backed firms (based on
coefficient estimates of VC dummy in Columns 9 and 10). Also, the effect of VC-backing on
the reduction of the separation between family control and cash-flow rights is statistically
significant only when VCs serve on the board of directors (Column 12).
Columns 13 to 16 present results with Control loss, an indicator variable of whether the
founding family loses voting control (family shareholdings decline from above 50% to below
50%), as the dependent variable. The reported coefficients are logit estimates of the effect of
a marginal change in the corresponding independent variable on the probability of the

35
founding family losing voting control, computed at the sample mean of the independent
variable. We find that the effects of VC-backing and VC shareholdings on the probability of
the founding family losing voting control are all positive and highly significant (Columns 13,
14, and 15). The effects are also economically meaningful. The probability of the founding
family losing voting control in VC-backed family firms is 9.9% higher than that in
non-VC-backed family firms (based on coefficient estimates of VC dummy in Columns 13
and 14). The results in Column 16 show that VC-backing has a positive effect on the
probability of the founding family losing voting control, regardless of whether VCs serve on
the board or not.
The control variables in Columns 13 to 16 have expected signs. Firm age is positive and
significant, suggesting that older family firms are more likely to lose voting control. This is
not surprising, as the concentration of ownership usually trends down over time. It may also
reflect that, due to the larger contribution of the founding family in the longer run, the
founding family could have large influence on company decisions even without voting
control. Firm size has significantly negative coefficients, suggesting that founding families of
larger firms have stronger negotiation power with VCs, and they therefore are less likely to
lose voting control.
Overall, the results in Table 6 suggest that after receiving VC financing, family control
rights and cash-flow rights experience significant changes in two aspects. First, the founding
family withdraws part of control rights and cash-flow rights, which could reduce the negative
effect of dominated ownership and lead to the balance of power between the founding family
and outside shareholders. Second, the separation between the founding family’s control rights
and cash-flow rights drops significantly, which could reduce the probability that the founding
family uses control-enhancing mechanisms such as pyramid structures to engage in tunneling
behaviors. These results provide support for our hypotheses H6, H7, and H8. We also show
that family firms where VCs have greater equity ownership (proxied by VC shareholdings)
experience greater reductions in founding families’ control rights, cash-flow rights, and the
separation between their control rights and cash flow rights, providing support for hypothesis
H9. Finally, the above changes in family control rights and cash-flow rights are greater in
family firms where VCs are represented on the board of directors, suggesting that board

36
representation is helpful for VCs to exert sufficient influence and pressure on the founding
family to reduce its control rights and cash-flow rights in the family firm. These results
provide support for hypothesis H10.
5.2.2 Propensity Score Matching Analysis of the Effect of VC Investments on Family
Control Rights and Cash-flow Rights
As discussed in Section 5.1.2, the decision of VCs to invest in family firms may not be
entirely exogenous. To control for the potential endogeneity of VC-backing, we employ
propensity score matching methods to examine the difference of the change of the founding
family’s control rights, cash-flow rights, the separation between control rights and cash-flow
rights, as well as the probability of the founding family losing voting control between
VC-backed and matched non-VC-backed firms. We match each VC-backed firm with a
non-VC-backed firm using propensity score matching methods. In the first stage, we run
probit regressions with the same specifications as those in Section 5.1.2 and Table 3. We then
use the one-to-one propensity score matched sub-sample to run regressions of various proxies
for the change of family ownership on VC dummy, and a set of controls as described in the
previous section. We employ weighted least squares (WLS) regressions where the weight for
each VC-backed firm is equal to one, whereas the weight for each non-VC-backed firm is
equal to the number of times it is used as a match for VC-backed firms in this sub-sample.
The results are reported in Table 7. In Column 1, the change of family control rights (△
Control rights) is the dependent variable. The sample here consists of 202 VC-backed firms
and 119 unique non-VC-backed firms. We show that the VC dummy is still negative and
statistically significant, indicating that family control rights drop to a greater extent in
VC-backed firms than in non-VC-backed firms, even after controlling for the potential
endogeneity of VC-backing. In Columns 2, 3, and 4, the dependent variables are the change
of family cash-flow rights (△Cash-flow rights), the change of the separation between family
control rights and cash-flow rights (△Separation), and an indicator variable of whether the
founding family loses voting control (Control loss), respectively. The samples consist of 202
VC-backed firms and 119 non-VC-backed firms in Column 2, 203 VC-backed firms and 128
non-VC-backed firms in Column 3, and 171 VC-backed firms and 91 non-VC-backed firms

37
in Column 4. In Columns 2 and 3, the coefficient estimates of VC dummies are both negative
and highly significant, suggesting that even after controlling for the potential endogeneity of
VC-backing and firm characteristics, family cash-flow rights and the separation between
family control rights and cash-flow rights both drop to a greater extent in VC-backing firms
than in non-VC-backed firms. In Column 4, the coefficient estimate of the VC dummy is
positive and significant, suggesting that even after controlling for the potential endogeneity of
VC-backing and firm characteristics, the probability of the founding family losing voting
control increases to a greater extent in VC-backing firms than in non-VC-backed firms.38
Overall, our findings in this section suggest that after controlling for the endogeneity of
VC-backing, VC-backing still has significant effect on the change of family control rights,
cash-flow rights, the separation between the two, and the probability of the family losing
voting control, which provide further support for hypotheses H6, H7, and H8.
5.2.3 The Effect of VC Investments on Shareholdings of Family Members with Different
Relationships to the Founder
We conduct family-member level analysis in this subsection, examining the effect of VC
investment on the change of shareholdings of family members with different relationship to
the founder. We regress the change of shareholdings of a certain family member during the
pre-IPO period (△Shareholding) on VC dummy or VC shareholdings, as well as a set of
controls as described before. The results of ordinary least square (OLS) regressions are
reported in Table 8.
Columns 1 to 3 report results for the whole sample (1,341 family members who hold
ownership stakes). We find coefficient estimates of VC dummy and VC shareholdings are
significantly negative. The economic significance is non-negligible. In VC-backed firms, the
decline of family members’ shareholdings is about 7% larger than that in non-VC-backed
38 We also conduct univariate tests for propensity score matching analysis. We match each VC-backed firm with one or several non-VC-backed firms using three matching methods: propensity score, Gaussian kernel, and regression-adjusted local linear. These results are not tabulated in this paper, for brevity (Table A2 in the Internet Appendix). Our univariate results show that mean differences of changes of family control rights, cash-flow rights, separation between the two, and the probability of the founding family losing voting control between VC-backed firms and matched non-VC-backed firms are statistically significant, regardless which matching method is employed. Univariate results are consistent with multivariate results of propensity score matching reported in Table 7.

38
firms (Columns 1 and 2). A 1% increase in VC shareholdings is associated with a 0.6%
decrease in family members’ shareholdings (Column 3).
In Columns 4 to 12, we further divide the whole sample into three sub-samples:
blood-based family members subsample (Columns 4, 5, and 6), marriage-based family
members subsample (Columns 7, 8, and 9), and founders subsample (Columns 10, 11, and
12). The coefficients on VC dummy are negative and statistically significant only in the
subsample of blood-based family members and the subsample of founders, but not
statistically significant in the subsample of marriage-based family members. These results
suggest that the declines of shareholdings of founders and blood-based family members are
larger in VC-backed firms than in non-VC-backed firms. The negative but insignificant effect
of VC-backing on shareholdings of marriage-based relatives may be due to the fact that
original shareholdings of marriage-based relatives are low.39 Further, we find that the
coefficients of VC shareholdings are negative and statistically significant in all three
subsamples, suggesting that greater power of VCs relative to the founding family (proxied by
VC shareholdings) is associated with larger declines in shareholdings of founders,
blood-based relatives, and marriage-based relatives.
The results of family-member level analysis in Table 8 suggest that VCs could encourage
founders, and both blood-based and marriage-based family members to give up parts of their
shareholdings, for the sake of establishing a more balanced ownership structure in family
firms. These results, therefore, provide support for hypothesis H11.
5.3 Instrumental Variable Regression Analysis of the Effect of VC Investments on
Corporate Governance Changes of Family Firms
Our results so far have shown that VC-backing has a significant effect on corporate
governance changes of family firms, and we also use propensity score matching analysis to
correct for potential endogeneity of receiving VC financing based on observable
characteristics of family firms. However, it is possible that VCs’ decision to invest in a
family firm is based on unobservable characteristics of the family firm. If this is the case,
39 In our sample, the shareholdings of founders, blood-based relatives, and marriage-based relatives at the beginning of the three-year period pre-IPO are 51%, 12%, and 12%, respectively.

39
then our logit and OLS analysis could suffer from a further endogeneity problem, as the
VC-backing dummy could potentially be correlated with the residual term, causing logit and
OLS coefficient estimates to be biased.
We utilize instrumental variable regressions to deal with potential endogeneity problems.
A valid instrument needs to satisfy two conditions: it should be correlated with the
VC-backing dummy (the validity requirement), but it should not be correlated with the
residual term in the regression of corporate governance changes (the exclusion restriction).
Following Chemmanur, Krishnan, Nandy (2011), we choose two instruments that are
correlated with the demand and supply of venture funds in the economy, but are independent
of future changes of corporate governance in VC-backed family firms, namely, the number of
VC companies in the family firm’s headquarter province in the year of firm founding or
incorporation, and the amount of research grants from the provincial government divided by
GDP of the family firm’s headquarter province in the year of firm founding or incorporation.
In particular, we expect that family firms located in provinces with greater numbers of VC
companies are more likely to receive VC funding. We also expect that the greater supply of
research grants from the local government to entrepreneurial firms leads to less demand for
VC funds. Since the number of local VC companies and research grants from local
governments capture exogenous variations in terms of both the supply of, and the demand for,
VC funds, we do not expect these two IVs to directly affect future changes of corporate
governance in family firms.
We obtain data on inception date and headquarter location of VC companies from the
WIND VC database which covers over 4,299 VC companies. We then calculate the number
of VC companies headquartered in each province each year. We also obtain data on the
amount of research grants supplied by provincial governments and GDP of each province
during our sample period from the National Bureau of Statistics of China.
The results of our instrumental variable analysis are presented in Table 9. Column 1
presents first stage regressions of the VC-backing dummy on the two instruments and other
control variables. The two instruments are confirmed to be significant determinants of
whether family firms receive VC investments. The reported partial F-test statistics in the first
stage confirm that Number of local VCs and Government research grant/GDP are strong

40
instruments, with an F-statistic of 14.04, exceeding the cutoff of 11.59.40
We report the second stage results of IV regressions of the probit model in Columns 2
and 6, where the dependent variables are dummy variables (Turnover1 and Control loss,
respectively), and the second stage results of IV regressions with two-stage least squares
(2SLS) estimator in Columns 3, 4, and 5, where the dependent variables are continuous
variables (△Control rights, △Cash-flow rights, and △Separation, respectively). Consistent
with our previous findings, our second stage regressions here indicate that, even after
controlling for potential endogeneity of VC-backing, it still has a significantly positive effect
on the probability of family members departing from top management positions, and the
probability of the founding family losing voting control, and a significantly negative effect on
the change of family control rights, cash-flow rights, and the separation between the two.
Although we cannot directly test whether the instruments are uncorrelated with the error
terms in regression models in Columns 2 to 6, we can conduct the over-identification test
since the number of instruments is greater than the number of endogenous regressors. The
joint null hypothesis of the over-identification test is that the excluded instruments are valid
instruments, i.e., uncorrelated with the error term and correctly excluded from the estimated
equation. A rejection would cast doubt on the validity of the instruments (see, e.g.,
Wooldridge (2002)). The reported Amemiya-Lee-Newey minimum chi-square statistic (for
IV-Probit) and Hansen-J statistics (for IV-2SLS) in Columns 2 to 6 cannot reject the null
hypothesis. Therefore, we could not reject the hypothesis that our two instruments are
uncorrelated with the error term.
Since VC shareholdings can be potentially endogenous as well, we also employ
instrumental variable regressions similar to those in Table 9 to deal with potential
endogeneity of VC shareholdings. The two instruments for VC shareholdings are the same as
those for the VC-backing dummy. We find that even after controlling for potential
40 Larcker and Rusticus (2010) demonstrate that when the instrument is only weakly correlated with the endogenous variable, IV methods can produce highly biased estimates even when the variable is only slightly endogenous. This is the so-called weak-instrument problem. In their survey of the weak-instrument literature, Stock, Wright, and Yogo (2002) develop benchmarks for the F-statistic: when the number of instruments is 1, 2, 3, 5, and 10, the suggested critical F-values are 8.96, 11.59, 12.83, 15.09, and 20.88, respectively. If the first-stage partial F-statistic falls below these critical values, the instruments are considered to be weak and the validity of inference is potentially compromised.

41
endogeneity, VC shareholdings still have a significantly positive effect on the probability of
family members departing from top management positions, and the probability of the
founding family losing voting control, and a significantly negative effect on the change of
family control rights, cash-flowing rights, and the separation between the two. These results
are omitted for brevity. Overall, our instrumental variable regression analysis provides further
support for hypotheses H1, H2, H6, H7, H8, and H9.
5.4 The Effect of Corporate Governance Changes due to VC-backing on Firm Valuation
and Performance
In this section, we test our hypothesis regarding the effect of corporate governance
changes due to VC-backing on IPO firm valuation and post-IPO operating performance. The
OLS regression takes the following form:
0 1 2 3
4 5 6 7 10 ,
- ( ) '
(4i t
Post IPO operating performance or Valuation Y Political connection Business connection
Education Firm age Size Leverage Prior ROA Industry dummy
)
The dependent variables in different specifications are: firm valuation in the secondary
market immediately after IPO (industry-adjusted Tobin’s Q, denoted as QFTDADJ and
QIMADJ), and post-IPO operating performance. The key independent variable, Y’, is changes
of corporate governance in family firms, which in different specifications are: △Control
rights (the change of family control rights), △Cash-flow rights (the change of family
cash-flow rights), △Separation (the change of the separation between family control rights
and cash-flow rights), Control loss (an indicator variable of the family losing voting control),
and Turnove1 (departures of family members from top management positions). Control
variables include political connections of family members (Political connection), business
connections of the founder (Business connection), education background of the founder
(Education), natural logarithm of firm age (Firm age), natural logarithm of total assets (Size),
leverage ratio (Leverage), return on assets (prior ROA), and industry fixed effects based on
CSRC industry classifications.
We analyze the effect of corporate governance changes on IPO firm valuation in the
secondary market immediately after IPO in the subsample of VC-backed firms and the

42
subsample of non-VC-backed firms separately. The estimated results are reported in Table 10.
Panel A of Table 10 shows that a decrease of family control rights leads to a significant
increase in the valuation of VC-backed firms (Columns 1 and 2). However, this effect is not
significant among non-VC-backed firms (Columns 3 and 4). The differences between the
coefficient estimates of △Control rights among VC-backed firms versus non-VC-backed
firms are significantly different from zero for Column 1 versus Column 3, with
industry-adjusted Tobin’s Q on the first trading day (QFTDADJ) as dependent variables. This
suggests that the effect of the reduction of family control rights on the improvement of firm
valuation on the IPO day is stronger among VC-backed firms than that among
non-VC-backed firms. Table 10 Panel B shows that the reduction of family cash-flow rights
has no significant effect on IPO firm valuation both among VC-backed and among
non-VC-backed firms.
Panel C of Table 10 shows that the change of the separation between family control
rights and cash-flow rights has a significantly positive effect on IPO firm valuation in the
secondary market in the subsample of VC-backed firms. However, this effect becomes
insignificant in the subsample of non-VC-backed firms. In Panel D of Table 10, we show that
founding family losing voting control of the firm pre-IPO has a significantly positive effect
on firm valuation among VC-backed firms, while this effect is again insignificant among
non-VC-backed firms. We also find that the effect of family losing voting control on the
improvement of firm valuation on the first trading day is stronger among VC-backed firms
than that among non-VC-backed firms. In Panel E of Table 10, we find that departures of
family members from top management positions have no statistically significant impact on
IPO firm valuation both among VC-backed and among non-VC-backed firms.
Finally, we explore whether the effect of corporate governance changes due to VC on the
improvement of firm valuation would increase with the relative power of VCs versus the
founding family (as proxied by VCs’ equity ownership) and with VC board representation.
We use the same specification but add interactions of corporate governance changes (Y’) with
VC shareholdings (or VC director), as well as VC shareholdings (or VC director) into the
model. We find that none of the coefficient estimates of the interaction terms (Y’×VC

43
shareholdings or Y’×VC director) are statistically significant (not tabulated).41
Our findings in Table 10 can be summarized as follows. First, the decrease of family
control rights, and the separation between family control rights and cash flow rights
significantly increase firm valuation immediately after IPO. However, these effects only exist
among VC-backed family firms, or are stronger among VC-backed firms versus those among
non-VC-backed firms. These results may suggest that, along with changes of family firms’
ownership and control structure they help family firms make, VCs help family firms make
other changes, which in turn make such changes translate more effectively into higher firm
valuation. For example, VCs may not only be able to help family firms reduce the founding
family’s ownership, but may also be able to secure equity investments from new high
value-added shareholders who may be able to intensively monitor the founding family and
top executives, or bring in business resources helpful to the firm.42
Second, contrasting the insignificant effect of departures of family members from top
management positions on firm valuation with the significant effect of reductions in family
control rights and the separation between family control rights and cash-flow rights on firm
valuation, one may conclude that reductions in family control rights are a more effective
corporate governance reform than departures of family members from top management
positions. Overall, the results in Table 10 support our hypotheses H12 and H13.
Our empirical results on the effect of corporate governance changes due to VC-backing
on post-IPO operating performance of firms are similar to our results above on equity
valuation post-IPO. While, due to space constraints, we do not tabulate and discuss them here,
these results on post-IPO operating performance also support our hypotheses H12 and H13.43
41 The results may be driven by two offsetting effects of VC-backing on firm valuation. First, as we have found, the reduction of family control rights, and the separation between family control rights and cash flow rights due to VC-backing translate more effectively into higher firm valuation immediately after IPO. Second, the investors in the secondary market have concerns that VCs will exit after the IPO, which will result in the ending of VCs’ value-added monitoring, and VCs often resign from the board after they exit. 42 We also could not rule out the possibility that the insignificant effect of corporate governance changes on firm valuation is driven by the effect that family control rights, cash-flow rights, and the separation between the two experiences less change during the pre-IPO 3-year period in non-VC-backed firms compared to VC-backed firms. 43 These results are presented in Table A3 of the Internet Appendix, and discussed in detail there.

44
6. Conclusions
Using a theoretical framework based on Rajan (2012), we have empirically analyzed how
venture capital investments help to standardize family firms by transforming their corporate
governance and top management. We find that family members are more likely to depart
from management positions in VC-backed compared to non-VC-backed firms. Further,
family control rights, cash-flow rights, and the separation between them drop more in
VC-backed firms in the three years pre-IPO. These effects are stronger when VCs have
greater bargaining power or board representation. Using Propensity-Score matching and
Instrumental Variable analyses, we show that the above effects of VC-backing are causal.
Finally, we find that the standardization of VC-backed family firms yields higher IPO firm
valuation and post-IPO operating performance.

45
References
Anderson, R., Duru, A., Reeb, D., 2009. Founders, heirs, and corporate opacity in the United States. Journal of Financial Economics 92, 205-222.
Anderson, R., Reeb, D., 2003. Founding-family ownership and firm performance: Evidence from the S&P 500. Journal of Finance 58, 1301-1327.
Anderson, R., Reeb, D., 2004. Board composition: balancing family influence in S&P 500 firms. Administrative Sciences Quarterly 49, 209-237.
Baker, M., Gompers, P., 2003. The determinants of board structure at the initial public offering. Journal of Law and Economics 46, 569-598.
Barontini, R., Caprio, L., 2006. The effect of family control on firm value and performance: evidence from continental Europe. European Financial Management 12, 689-723.
Bertrand, M., Johnson, S., Samphantharak, K., Schoar, A., 2008. Mixing family with business: A study of Thai business groups and the families behind them. Journal of Financial Economics 88, 466-498.
Chemmanur, T. J., Krishnan, K., Nandy, D., 2011. How does venture capital financing improve efficiency in private firms? A look beneath the surface. Review of Financial Studies 24, 4037-4090.
Chemmanur, T. J., Simonyan, K., Tehranian, H., 2013. The role of management quality in the IPOs of venture-backed entrepreneurial firms. Available at SSRN: http://ssrn.com/abstract=2245374 or http://dx.doi.org/10.2139/ssrn.2245374.
Claessens, S., Djankov, S., Fan, J., Lang, L., 2002. Disentangling the incentive and entrenchment effects of large shareholdings. Journal of Finance 57, 2741-2771.
Claessens, S., Djankov, S., Lang, L., 2000. The separation of ownership and control in east Asian corporations. Journal of Financial Economics 58, 81-112.
Faccio, M., Lang, L., 2002. The ultimate ownership of Western European corporations. Journal of Financial Economics 65, 365-395.
Faccio, M., Lang, L., Young, L., 2001. Dividends and expropriation. American Economic Review 91, 54-78.
Fahlenbrach, R. 2009. Founder-CEOs, investment decisions, and stock market performance. Journal of Financial and Quantitative Analysis 44, 439-466.
Fama, E. F., Jensen, M. C., 1983. Separation of ownership and control. Journal of Law and Economics 26, 301-325.
Gomez-Mejia, L., Haynes, K., Nunez-Nickel, M., Jacobson, K., Moyano-Fuentes, J., 2007. Family owned firms: risk loving or risk averse? Administrative Science Quarterly 52, 206-137.

46
Gompers, P., 1995. Optimal investment, monitoring, and the staging of venture capital. Journal of Finance 50, 1461–1490.
Grossman, S. J., Hart, O. D., 1988. One share-one vote and the market for corporate control. Journal of Financial Economics 20, 175-202.
Harris, M., Raviv, A., 1988. Corporate governance: voting rights and majority rules, Journal of Financial Economics 20, 203-235.
Hellmann, T., Puri, M., 2002. Venture capital and the professionalization of start-up firms: empirical evidence. Journal of Finance 57, 169-197.
Hochberg, Y. V., 2012. Venture capital and corporate governance in the newly public firm. Review of Finance 16, 429-480.
Jensen, M. C. and Meckling, W. H., 1976, Theory of the firm: managerial behavior, agency costs, and ownership structure. Journal of Financial Economics 3, 305-360.
Jiang, G., Lee, C., Yue, H., 2010. Tunneling through inter-corporate loans: the China experience. Journal of Financial Economics 98, 1-20.
Johnson, S., Boone, P., Breach, A., Friedman, E., 2000. Corporate governance in the Asian financial crisis. Journal of Financial Economics 58, 141-186.
Kaplan, S., Sensoy, B., Stromberg, P., 2009. Should investors bet on the jockey or the horse? Evidence from the evolution of firms from early business plans to public companies. Journal of Finance 64, 75-114.
La Porta, R., Lopez-de-Silanes, F., Shleifer, A., 1999. Corporate ownership around the world. Journal of Finance 54, 471-517.
La Porta, R., Lopez-De-Silanes, F., Shleifer, A., and Vishny, R., 2002. Investor protection and corporate valuation. Journal of Finance 57, 1147-1170.Lansberg, I., 1999. Succeeding generations. Harvard Business School Press, Boston, MA.
Larcker, D., Rusticus, T., 2010. On the use of instrumental variables in accounting research. Journal of Accounting and Economics 49, 186–205.
Lee, P. M., Wahal, S., 2004. Grandstanding, certification and the underpricing of venture capital backed IPOs. Journal of Financial Economics 73, 375–407.
Lehn, K., Zhao, M., 2006. CEO turnovers after acquisitions: Are bad bidders fired? Journal of Finance 61, 1759-1811.
Lerner, J., 1995. Venture capitalists and the oversight of private firms. Journal of Finance 50, 301-318.
Miller, D., Le Breton-Miller, I., Lester, R., Cannella, Jr. A., 2007. Are family firms really superior performers? Journal of Corporate Finance 13, 829-858.

47
Myers, S., Rajan, R., and Zingales, L., 2005. Financing organizations 1: Start-up. Working paper, University of Chicago.
Pérez-González, F., 2006. Inherited control and firm performance. American Economic Review 96, 1559-1588.
Rajan, R. G., 2012. Presidential Address: The corporation in finance. Journal of Finance 67, 1173-1217.
Rosenbaum, P., Rubin, D., 1983. The central role of propensity score in observational studies for causal effects. Biometrica 70, 41-55.
Rubin, D, 1974. Estimating causal effects of treatments in randomized and nonrandomized studies. Journal of Educational Psychology 66, 688-701.
Rubin, D, 1977. Assignment to treatment group on the basis of a covariate. Journal of Educational Statistics 2, 1-26.
Shanker, M., Astrachan, J., 1996. Myths and realities: family businesses’ contribution to US economy—A framework for assessing family business statistics. Family Business Review 9, 107-123.
Shleifer, A., Vishny, R., 1997. A survey of corporate governance. Journal of Finance 52, 737-783.
Stock, J., Wright, J., Yogo, M., 2002. A survey of weak instruments and weak identification in generalized method of moments. Journal of Business & Economics Statistics, 20, 518–529.
Villalonga, B., Amit, R., 2006. How do family ownership, control and management affect firm value? Journal of Financial Economics 80, 385-417.
Villalonga, B., Amit, R., 2009. How are U.S. family firms controlled? Review of Financial Studies 22, 3047-3091.
Wang, S., Wang, Y., 2003-2012. Venture capital development in China (2003-2012). Economy and Management Press, Beijing, China.
Williamson, O. E., 1983. Organization form, residual claimants, and corporate control. Journal of Law and Economics 26, 351-366.
Wooldridge, J. M., 2002. Econometric analysis of cross section and panel data. The MIT Press, Cambridge.
Zingales, L., 2000. In search of new foundations. Journal of Finance 60, 1623-1653.

48
Table 1. Summary Statistics
Panels A, B, and C provide summary statistics. The data set is made up of the 499 family firms publicly listed during the period from 2004 to 2012, and 1,378 family members who hold the positions of top executives, members of board of directors, or members of board of supervisors in family firms. Turnover1 is the firm-level measure of management turnover, which equals one if at least one of the family members are forced to depart in the pre-IPO period, zero otherwise. Turnover2 is the family-member-level measure of management turnover, which equals one if the family member departs in the pre-IPO period. △Control rights is the percentage change of family control rights during the pre-IPO period. △Cash-flow rights is the percentage change of family cash-flow rights during the pre-IPO period. △Separation is the change of the separation between family control rights and cash-flow rights during the pre-IPO period. Control loss is an indicator of the total shareholdings of founding family members declining from above 50% to below 50% during the pre-IPO period. Shareholding is the percentage change of shareholdings of family members during the pre-IPO period. △Adjusted OROA, is the change of industry- and performance-adjusted operating return on assets (OROA) by subtracting the industry- and performance-adjusted OROA in the year prior to the issue (year -1) from the industry- and performance-adjusted OROA in subsequent years (years 0 through 3). QFTDADJ, and QIMADJ are two definitions of industry-adjusted Tobin’s Q. Tobin’s Q is the ratio of the market value of assets to the book value of assets, where the market value of assets is equal to the book value of assets minus the book value of common equity plus the number of shares outstanding times the market price (either IPO first trading day closing price (for QFTDADJ), or the closing price at the end of the issue month (for QIMADJ)), or times the share price at the end of the issue month (for industry peers). Industry-adjusted Tobin’s Q is the difference between IPO firm’s Tobin’s Q and the median Tobin’s Q of its industry peers based on CSRC industry classification. VC dummy is an indicator variable which equals one if the family firm is VC-backed, and zero otherwise. VC shareholdings is the total shareholding of VCs after the first-round of VC investment in the family firm. VC director is a dummy which equals one if the family firm is VC-backed and at least one venture capitalist serve on the board of directors, and zero otherwise. No-VC director is a dummy which equals one if the family firm is VC-backed but none of the venture capitalists serve on the board of directors, and zero otherwise. Political connection is a dummy variable that equals one if at least one of the family members, who serve as top executives, directors, supervisors or block-holders, was a former government official, military officer, deputy of the NPC (National People’s Congress), or member of the CPPCC (Chinese People’s Political Consultative Conference), and zero otherwise. Business connection is a dummy variable that equals one if the founder is serving or has previously served as the leader of the industry association, and zero otherwise. Education takes the value of one if the founder has received a bachelor’s degree or above, and zero otherwise. Firm age is the number of years from the firm’s inception to IPO. Size is total assets in millions of RMB. Leverage is defined as total debt divided by total assets. Prior ROA is net income divided by total assets in the prior year. Number of local VCs is the number of VC companies in the family firm’s headquarter province in the year of founding or incorporation. Government Research grant/GDP is the amount of research grants from provincial government divided by the GDP of the family firm’s headquarter province in the year of founding or incorporation.
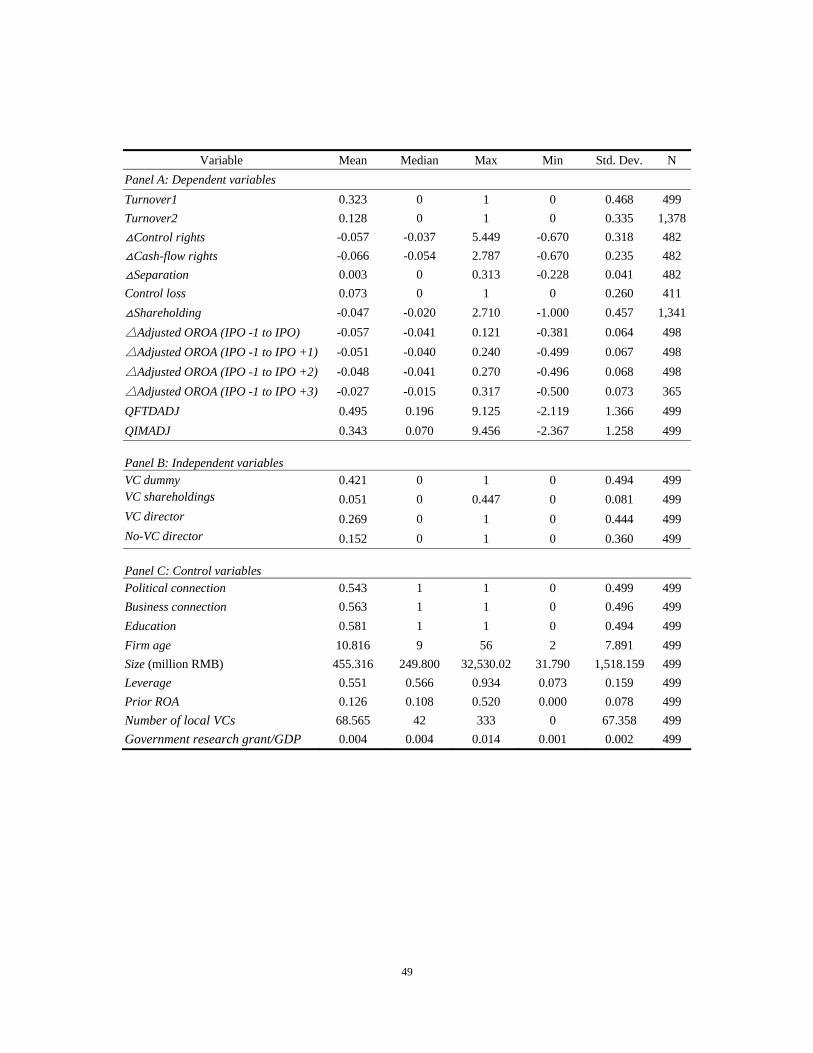
49
Variable Mean Median Max Min Std. Dev. N
Panel A: Dependent variables
Turnover1 0.323 0 1 0 0.468 499
Turnover2 0.128 0 1 0 0.335 1,378
Control rights -0.057 -0.037 5.449 -0.670 0.318 482
Cash-flow rights -0.066 -0.054 2.787 -0.670 0.235 482
Separation 0.003 0 0.313 -0.228 0.041 482
Control loss 0.073 0 1 0 0.260 411
Shareholding -0.047 -0.020 2.710 -1.000 0.457 1,341
△Adjusted OROA (IPO -1 to IPO) -0.057 -0.041 0.121 -0.381 0.064 498
△Adjusted OROA (IPO -1 to IPO +1) -0.051 -0.040 0.240 -0.499 0.067 498
△Adjusted OROA (IPO -1 to IPO +2) -0.048 -0.041 0.270 -0.496 0.068 498
△Adjusted OROA (IPO -1 to IPO +3) -0.027 -0.015 0.317 -0.500 0.073 365
QFTDADJ 0.495 0.196 9.125 -2.119 1.366 499
QIMADJ 0.343 0.070 9.456 -2.367 1.258 499
Panel B: Independent variables VC dummy 0.421 0 1 0 0.494 499 VC shareholdings 0.051 0 0.447 0 0.081 499 VC director 0.269 0 1 0 0.444 499 No-VC director 0.152 0 1 0 0.360 499
Panel C: Control variables Political connection 0.543 1 1 0 0.499 499
Business connection 0.563 1 1 0 0.496 499
Education 0.581 1 1 0 0.494 499
Firm age 10.816 9 56 2 7.891 499
Size (million RMB) 455.316 249.800 32,530.02 31.790 1,518.159 499
Leverage 0.551 0.566 0.934 0.073 0.159 499
Prior ROA 0.126 0.108 0.520 0.000 0.078 499
Number of local VCs 68.565 42 333 0 67.358 499
Government research grant/GDP 0.004 0.004 0.014 0.001 0.002 499

50
Table 2. The Effect of VC Investments on Departures of Family Members from Management Positions
Columns 1 to 4 are firm-level regressions, where the dependent variable is Turnover1, the firm-level measure of management turnover. Columns 5 to 8 are family-member-level regressions, where the dependent variable is Turnover2, the family-member-level measure of management turnover. The reported coefficients are logit regression estimates of the effect of a marginal change in the corresponding regressor on the probability of family management turnover, computed at the sample mean of the independent variables. Coefficients of industry dummies are omitted for brevity. Z-statistics based on robust standard errors are reported in parentheses. ***, **, and * indicate significance at 1%, 5%, and 10%, respectively.
Sample Firm level
Firm level
Firm level
Firm level
Family-member level
Family-member level
Family-member level
Family-member level
Dependent Variable Turnover1 Turnover1 Turnover1 Turnover1 Turnover2 Turnover2 Turnover2 Turnover2 (1) (2) (3) (4) (5) (6) (7) (8) VC dummy 0.084** 0.089** 0.037** 0.037** (1.972) (2.037) (1.987) (1.998)
VC shareholdings 0.733*** 0.231** (2.957) (2.323)
VC dummy×VC director 0.151*** 0.054** (2.907) (2.343)
VC dummy×No-VC director
-0.021 0.008 (-0.335) (0.292)
Political connection -0.039 -0.044 -0.035 -0.026 -0.027 -0.025 (-0.827) (-0.922) (-0.731) (-1.264) (-1.311) (-1.217)Business connection 0.102** 0.110** 0.107** 0.034* 0.037* 0.035* (2.228) (2.377) (2.321) (1.805) (1.929) (1.857) Education 0.020 0.015 0.023 0.009 0.007 0.009 (0.462) (0.332) (0.525) (0.486) (0.380) (0.488) Firm age 0.033 0.034 0.034 0.009 0.008 0.008 (0.919) (0.945) (0.955) (0.596) (0.544) (0.554)Size -0.031 -0.025 -0.031 -0.011 -0.008 -0.011 (-1.044) (-0.868) (-1.061) (-0.893) (-0.712) (-0.898) Leverage -0.114 -0.126 -0.111 -0.012 -0.020 -0.012 (-0.617) (-0.679) (-0.600) (-0.160) (-0.269) (-0.158) Prior ROA 0.465 0.507 0.456 0.142 0.155 0.133 (1.338) (1.462) (1.289) (1.001) (1.079) (0.917)Industry Dummy Yes Yes Yes Yes Yes Yes Observations 499 499 499 499 1,378 1,378 1,378 1,378 pseudo R-squared 0.006 0.036 0.043 0.046 0.004 0.017 0.018 0.019

51
Table 3. Propensity Score Matching Analysis of the Effect of VC Investments on Departures of Family Members from Management Positions Panel A reports mean differences in probabilities of family members departing from management positions between VC-backed and matched non-VC-backed IPO firms. Each VC-backed family firm is matched with one or more non-VC-backed firms using propensity score, Gaussian kernel, or regression-adjusted local linear matching approaches, respectively. Matching is conducted with replacement. Standard errors are bootstrapped standard errors with 50 replications. Confidence intervals are 95% selection bias adjusted confidence intervals. Panel B presents multivariate weighted least squares (WLS) regressions of the firm-level family management turnover (Turnover1) on VC dummy and other control variables. The weight for each VC-backed firm is equal to one, whereas the weight for each non-VC-backed firm is equal to the number of times it is used as a match for VC-backed firms. Propensity score matching is implemented using the one-to-one “nearest neighbors” methodology with common support. Matching variables used in both Panels A and B include CSRC industry code dummies, family firm headquarter province dummies, ln(total assets) at the end of IPO -3 year, ln(firm age) at the end of IPO -3 year, number of family members (co-)founding the firm, total ownership of founding family members at firm startup, and education background of founders. ***, **, and * indicate significance at 1%, 5%, and 10%, respectively.
Panel B: Multivariate analysis
Panel A:Univariate tests Propensity Score Gaussian Kernel Regression-Adjust Local Linear Difference in means 0.107 0.089 0.093 Standard error 0.049 0.041 0.045 z-statistics 2.18** 2.16** 2.04** Confidence interval [0.011, 0.203] [0.083, 0.170] [0.004, 0.182]
Dependent Variable Turnover1 VC dummy 0.098** (2.120) Political connection -0.034 (-0.613)Business connection 0.148*** (2.784) Education -0.028 (-0.544) Firm age 0.050 (1.248)Size -0.073** (-2.073) Leverage 0.068 (0.354) Prior ROA 0.340 (0.915)Industry Dummy Yes Observations pseudo R-squared
412 0.046

52
Table 4. The Effect of VC Investments on Departures of Family Members from Different Types of Management Positions Columns 1 to 9 present results of logit regression analysis of the effect of VC investments on departures of family members from different types of management positions using three subsamples, namely, top executive subsample (Columns 1 to 3), member of board of directors subsample (Columns 4 to 6), and member of board of supervisors (Columns 7 to 9). The dependent variable in Columns 1 to 9 is Turnover2, the family-member-level measure of management turnover. The reported coefficients are logit regression estimates of the effect of a marginal change in the corresponding regressor on the probability of family members departing from management positions, computed at the sample mean of the independent variables. Column 10 reports results of ordered logit regression analysis on the effect of the relative power of VCs versus the founding family on the type (or importance) of positions from which family members depart. The dependent variable in Column 10 is the order of importance of departed positions, which equals 3 if departing from top executives, 2 if departing from members of board of directors, 1 if departing from members of board of supervisors, and 0 if no departures. Coefficients of industry dummies are omitted for brevity. Z-statistics based on robust standard errors are reported in parentheses. ***, **, and * indicate significance at 1%, 5%, and 10%, respectively.
Sample Top Executive Director Supervisor Ordered Logit (1) (2) (3) (4) (5) (6) (7) (8) (9) (10) VC dummy 0.015 0.012 -0.003 -0.002 0.160** 0.170** (0.966) (0.824) (-0.178) (-0.122) (2.075) (2.089) VC shareholdings 0.143** 0.005 0.861* 2.199*** (2.323) (0.041) (1.698) (3.010) Political connection 0.000 0.000 -0.001 -0.001 -0.101 -0.119 -0.234 (0.022) (0.011) (-0.039) (-0.031) (-1.107) (-1.419) (-1.347) Business connection -0.009 -0.005 0.007 0.006 0.159* 0.145 0.317* (-0.635) (-0.324) (0.430) (0.328) (1.727) (1.607) (1.827) Education 0.015 0.013 0.001 -0.000 0.115 0.107 0.064 (0.923) (0.751) (0.031) (-0.010) (1.352) (1.357) (0.407) Firm age -0.009 -0.007 -0.001 -0.001 0.090 0.061 0.062 (-0.681) (-0.505) (-0.058) (-0.079) (1.019) (0.736) (0.433) Size 0.011 0.012 0.005 0.005 -0.020 -0.000 -0.061 (1.285) (1.398) (0.491) (0.436) (-0.333) (-0.008) (-0.585) Leverage -0.066 -0.072* -0.052 -0.051 0.184 0.121 -0.255 (-1.482) (-1.669) (-0.750) (-0.684) (0.482) (0.331) (-0.399) Prior ROA -0.155 -0.138 0.135 0.123 0.452 0.409 1.219 (-1.407) (-1.360) (1.090) (1.048) (0.623) (0.602) (1.152) Industry Dummy Yes Yes Yes Yes Yes Yes Yes Observations 695 695 695 1,059 1,059 1,059 166 166 166 1,378 pseudo R-squared 0.004 0.032 0.047 0.000 0.009 0.007 0.019 0.062 0.047 0.012

53
Table 5. The Effect of VC Investments on Departures of Family Members with Different Relationships to the Founder Columns 1 to 9 present results of logit regression analysis of the effect of VC investments on departures of three types of family members: blood-based family members (Columns 1 to 3), marriage-based family members (Columns 4 to 6), and founders (Columns 7 to 9). The dependent variable in Columns 1 to 9 is Turnover2, the family-member-level measure of management turnover. The reported coefficients are logit regression estimates of the effect of a marginal change in the corresponding regressor on the probability of family members departing from management positions, computed at the sample mean of the independent variables. Column 10 reports results of ordered logit regression analysis on the effect of the relative power of VCs versus the founding family on the order of departure of family members with different levels of importance of their relationships with founders. The dependent variable in Column 10 is the level of importance of their relationships with founders: which equals 3 if founders themselves depart, 2 if blood-based family members depart, 1 if marriage-based family members depart, and 0 if none of the family members depart. Coefficients of industry dummies are omitted for brevity. Z-statistics based on robust standard errors are reported in parentheses. ***, **, and * indicate significance at 1%, 5%, and 10%, respectively.
Sample Blood-based Marriage-based Founders Ordered Logit (1) (2) (3) (4) (5) (6) (7) (8) (9) (10) VC dummy 0.040 0.040 0.082** 0.086** 0.000 0.001 (1.086) (1.081) (1.997) (2.041) (0.045) (0.192) VC shareholdings 0.423** 0.302** 0.009 2.117*** (2.419) (2.309) (0.227) (3.092) Political connection -0.090** -0.095** -0.000 -0.004 0.005 0.005 -0.243 (-2.142) (-2.402) (-0.003) (-0.108) (0.797) (0.818) (-1.415) Business connection 0.034 0.041 0.052 0.052* 0.007 0.006 0.344** (0.910) (1.146) (1.187) (1.871) (1.437) (1.136) (2.018) Education 0.019 0.017 0.041 0.041 -0.010 -0.010 0.040 (0.518) (0.474) (0.989) (1.123) (-1.520) (-1.374) (0.251) Firm age 0.029 0.033 0.017 0.010 -0.008* -0.008* 0.080 (0.892) (1.030) (0.468) (0.561) (-1.731) (-1.857) (0.571) Size -0.015 -0.010 -0.026 -0.023 -0.001 -0.001 -0.076 (-0.662) (-0.435) (-0.947) (-0.659) (-0.185) (-0.227) (-0.716) Leverage -0.027 -0.033 0.057 0.054 0.022 0.027* -0.250 (-0.181) (-0.238) (0.322) (0.218) (1.537) (1.894) (-0.391) Prior ROA 0.023 0.048 0.486 0.491 0.012 0.011 1.301 (0.076) (0.188) (1.400) (1.439) (0.435) (0.359) (1.206) Industry Dummy Yes Yes Yes Yes Yes Yes Yes Observations pseudo R-squared
480 0.003
480 0.029
480 0.031
403 0.010
403 0.030
403 0.024
495
0.024 495
0.166 495
0.139
574 0.012

54
Table 6. The Effect of VC Investments on Family Control Rights, Cash-Flow Rights, and the Separation between the Two
The dependent variables in Columns 1 to 4, 5 to 8, 9 to 12, and 13 to 16, are △Control rights, △Cash-flow rights, △Separation, and Control loss, respectively. Columns 1 to 12 report OLS regression coefficients, while Columns 13 to 16 report logit regression coefficients. Coefficients of industry dummies are omitted for brevity. Z-statistics (t-statistics) based on robust standard errors are reported in parentheses. ***, **, and * indicate significance at 1%, 5%, and 10%, respectively.
(1) (2) (3) (4) (5) (6) (7) (8) (9) (10) (11) (12) (13) (14) (15) (16)
Dependent variable △Control rights △Cash-flow rights △Separation Control loss
VC dummy -0.080*** -0.081*** -0.065*** -0.068*** -0.007* -0.008** 0.099*** 0.099***
(-2.943) (-3.688) (-3.010) (-3.575) (-1.938) (-1.993) (3.600) (3.720)
VC shareholdings -0.469*** -0.417*** -0.032* 0.371***
(-3.999) (-3.809) (-1.953) (3.832)
VC dummy×VC director
-0.099***
(-4.337)
-0.082***
(-4.001)
-0.008*
(-1.804)
0.111***
(2.664)VC dummy×No-VC director
-0.048
(-1.308)
-0.042 (-1.245)
-0.007
(-1.348)
0.184***
(2.762)
Political connection 0.013 0.017 0.012 0.007 0.011 0.006 -0.002 -0.001 -0.002 0.018 0.013 0.018
(0.594) (0.811) (0.559) (0.369) (0.587) (0.337) (-0.500) (-0.453) (-0.503) (0.916) (0.568) (0.927)
Business connection 0.034 0.029 0.032 0.020 0.016 0.019 0.004 0.004* 0.004 -0.010 -0.007 -0.011
(1.423) (1.244) (1.374) (1.040) (0.837) (0.997) (1.141) (2.085) (1.118) (-0.509) (-0.318) (-0.554)
Education 0.085** 0.086** 0.084** 0.069*** 0.070*** 0.068*** 0.004 0.004* 0.004 -0.030 -0.037 -0.030
(2.205) (2.234) (2.180) (2.792) (2.828) (2.769) (0.958) (2.245) (0.950) (-1.211) (-1.422) (-1.240)
Firm age 0.017 0.019 0.016 -0.003 -0.001 -0.003 0.002 0.003 0.002 0.039* 0.042* 0.039*
(0.365) (0.417) (0.355) (-0.097) (-0.027) (-0.107) (0.579) (0.630) (0.576) (1.892) (1.797) (1.872)
Size 0.066* 0.063* 0.065* 0.052** 0.050** 0.052** 0.001 0.001 0.001 -0.027* -0.029 -0.027*
(1.890) (1.830) (1.884) (2.448) (2.359) (2.436) (0.399) (0.440) (0.399) (-1.801) (-1.514) (-1.853)
Leverage -0.215 -0.216 -0.214 -0.156 -0.157 -0.156 0.006 0.006 0.007 -0.012 -0.007 -0.012
(-1.074) (-1.073) (-1.067) (-1.336) (-1.328) (-1.324) (0.392) (0.390) (0.393) (-0.186) (-0.088) (-0.188)
Prior ROA 0.333 0.315 0.340 0.211 0.195 0.216 0.028 0.027 0.028 -0.061 -0.036 -0.057
(1.524) (1.427) (1.546) (1.359) (1.234) (1.376) (0.981) (1.355) (0.986) (-0.393) (-0.186) (-0.380)
Constant -0.023 -1.399** -1.360** -1.392** -0.039*** -1.103*** -1.066*** -1.098*** 0.006** -0.051 -0.049 -0.051
(-1.064) (-2.062) (-2.011) (-2.051) (-2.834) (-2.706) (-2.631) (-2.689) (2.355) (-0.821) (-1.233) (-0.819)
Industry Dummy Yes Yes Yes Yes Yes Yes Yes Yes Yes Yes Yes Yes
Observations 482 482 482 482 482 482 482 482 482 482 482 482 411 411 411 411 Pseudo R-squared/R-squared
0.016 0.070 0.069 0.073 0.019 0.076 0.076 0.079 0.008 0.026 0.022 0.026 0.070 0.139 0.114 0.142
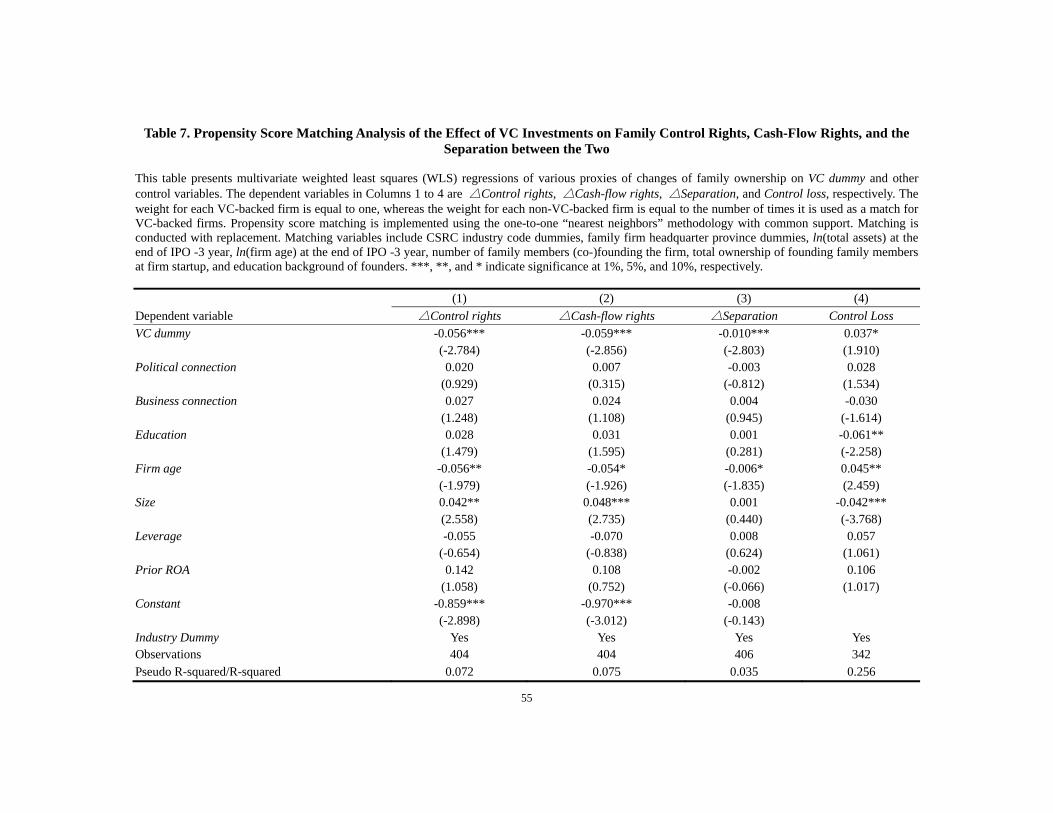
55
Table 7. Propensity Score Matching Analysis of the Effect of VC Investments on Family Control Rights, Cash-Flow Rights, and the Separation between the Two
This table presents multivariate weighted least squares (WLS) regressions of various proxies of changes of family ownership on VC dummy and other control variables. The dependent variables in Columns 1 to 4 are △Control rights, △Cash-flow rights, △Separation, and Control loss, respectively. The weight for each VC-backed firm is equal to one, whereas the weight for each non-VC-backed firm is equal to the number of times it is used as a match for VC-backed firms. Propensity score matching is implemented using the one-to-one “nearest neighbors” methodology with common support. Matching is conducted with replacement. Matching variables include CSRC industry code dummies, family firm headquarter province dummies, ln(total assets) at the end of IPO -3 year, ln(firm age) at the end of IPO -3 year, number of family members (co-)founding the firm, total ownership of founding family members at firm startup, and education background of founders. ***, **, and * indicate significance at 1%, 5%, and 10%, respectively.
(1) (2) (3) (4)
Dependent variable △Control rights △Cash-flow rights △Separation Control Loss
VC dummy -0.056*** -0.059*** -0.010*** 0.037* (-2.784) (-2.856) (-2.803) (1.910)
Political connection 0.020 0.007 -0.003 0.028 (0.929) (0.315) (-0.812) (1.534)
Business connection 0.027 0.024 0.004 -0.030 (1.248) (1.108) (0.945) (-1.614)
Education 0.028 0.031 0.001 -0.061** (1.479) (1.595) (0.281) (-2.258)
Firm age -0.056** -0.054* -0.006* 0.045** (-1.979) (-1.926) (-1.835) (2.459)
Size 0.042** 0.048*** 0.001 -0.042*** (2.558) (2.735) (0.440) (-3.768)
Leverage -0.055 -0.070 0.008 0.057 (-0.654) (-0.838) (0.624) (1.061)
Prior ROA 0.142 0.108 -0.002 0.106 (1.058) (0.752) (-0.066) (1.017)
Constant -0.859*** -0.970*** -0.008 (-2.898) (-3.012) (-0.143)
Industry Dummy Yes Yes Yes Yes Observations 404 404 406 342 Pseudo R-squared/R-squared 0.072 0.075 0.035 0.256

56
Table 8. The Effect of VC Investments on Shareholdings of Family Members with Different Relationships to the Founder
This table presents OLS regression results of the effect of VC investments on changes of family ownership using the whole sample (Columns 1 to 3) and three subsamples: blood-based family members (Columns 4 to 6), marriage-based family members (Columns 7 to 9), and founders (Columns 10 to 12). The dependent variable is
Shareholding. Coefficients of industry dummies are omitted for brevity. T-statistics based on robust standard errors are reported in parentheses. ***, **, and * indicate significance at 1%, 5%, and 10%, respectively.
Whole sample
Blood-based family members
Marriage-based family members
Founders
(1) (2) (3) (4) (5) (6) (7) (8) (9) (10) (11) (12)
VC dummy -0.065** -0.075*** -0.094* -0.109** -0.023 -0.042 -0.067** -0.062** (-2.534) (-2.948) (-1.829) (-2.047) (-0.432) (-0.824) (-2.465) (-2.471)
VC shareholdings -0.579*** -0.821*** -0.505** -0.375***
(-4.455) (-2.862) (-1.980) (-2.875)
Political connection -0.024 -0.019 -0.020 -0.011 -0.104* -0.101* 0.026 0.030
(-0.960) (-0.744) (-0.408) (-0.230) (-1.931) (-1.883) (0.962) (1.095)
Business connection 0.041 0.035 0.033 0.022 0.129** 0.126** -0.023 -0.027
(1.511) (1.293) (0.606) (0.403) (2.465) (2.401) (-0.757) (-0.866)
Education 0.044* 0.046* 0.056 0.057 0.035 0.041 0.037 0.039
(1.678) (1.746) (1.018) (1.028) (0.768) (0.884) (1.270) (1.308)
Firm Age -0.050* -0.052* -0.092 -0.094* -0.093* -0.096* 0.020 0.022
(-1.823) (-1.871) (-1.627) (-1.686) (-1.707) (-1.764) (0.667) (0.719)
Size 0.038** 0.036** 0.039 0.034 0.026 0.025 0.046** 0.044*
(2.351) (2.217) (1.171) (1.019) (0.950) (0.930) (2.043) (1.961)
Leverage -0.133 -0.135 -0.142 -0.144 -0.313* -0.307* 0.038 0.038
(-1.238) (-1.253) (-0.609) (-0.617) (-1.875) (-1.804) (0.346) (0.336)
Prior ROA -0.370* -0.393* -1.065*** -1.093*** -0.726** -0.760** 0.674** 0.659**
(-1.671) (-1.770) (-2.800) (-2.854) (-1.989) (-2.070) (2.233) (2.174) Constant -0.021 -0.457 -0.413 0.032 -0.443 -0.330 -0.076*** -0.306 -0.276 -0.033* -1.177** -1.143**
(-1.350) (-1.407) (-1.266) (1.008) (-0.733) (-0.544) (-2.657) (-0.592) (-0.531) (-1.718) (-2.568) (-2.505)
Industry Dummy Yes Yes Yes Yes Yes Yes Yes Yes Observations 1,341 1,341 1,341 483 483 483 384 384 384 474 474 474 R-squared 0.005 0.024 0.027 0.007 0.047 0.050 0.001 0.055 0.061 0.012 0.059 0.059

57
Table 9. Instrumental Variable Regression Analysis of the Effect of VC Investments on Corporate Governance Changes of Family Firms
In the first-stage regression, the dependent variable is VC dummy. In second-stage regressions, VC dummy hat is the predicted value of VC dummy from the first-stage regression. Number of local VCs is the number of VC companies in the family firm’s headquarter province in the year of founding or incorporation. Government Research grant/GDP is the amount of research grants from provincial government divided by the GDP of the family firm’s headquarter province in the year of founding or incorporation. Coefficients of industry dummies are omitted for brevity. Z-statistics (t-statistics) based on robust standard errors are reported in parentheses. ***, **, and * indicate significance at 1%, 5%, and 10%, respectively.
First-stage regression Second-stage regression Estimation method IV-Probit IV-2SLS IV-2SLS IV-2SLS IV-Probit Dependent variables VC dummy Dependent variables Turnover1 △Control right △Cash-flow right △Separation Control loss (1) (2) (3) (4) (5) (6) Number of local VCs 0.002*** VC dummy hat 0.886* -0.356*** -0.207** -0.056** 1.249* (5.248) (1.714) (-2.978) (-1.990) (-2.131) (1.768) Government research grant/GDP -57.681*** Political connection -0.080 0.003 0.002 -0.003 0.210 (-4.005) (-0.614) (0.133) (0.113) (-0.786) (0.944) Political connection 0.003 Business connection 0.275** 0.039 0.023 0.005 -0.100 (0.071) (2.104) (1.390) (1.091) (1.139) (-0.476) Business connection -0.006 Education 0.011 0.104** 0.078*** 0.007 -0.337 (-0.129) (0.082) (2.296) (2.793) (1.438) (-1.449) Education 0.068 Firm age 0.148 -0.015 -0.019 -0.003 0.510** (1.471) (1.348) (-0.365) (-0.618) (-0.583) (2.355) Firm age -0.089** Size -0.074 0.066* 0.053** 0.001 -0.280 (-2.384) (-0.913) (1.860) (2.417) (0.399) (-1.555) Size -0.019 Leverage -0.412 -0.202 -0.150 0.009 -0.301 (-0.653) (-0.833) (-1.011) (-1.290) (0.470) (-0.387) Leverage 0.252 Prior ROA 1.246 0.295 0.192 0.022 -0.547 (1.343) (1.302) (1.260) (1.179) (0.680) (-0.320) Prior ROA -0.005 Constant 1.243 -1.337* -1.054** -0.039 2.224 (-0.014) (0.756) (-1.876) (-2.463) (-0.577) (0.612) Constant 0.807 Industry dummy Yes Yes Yes Yes Yes (1.392) Industry dummy Yes Observations 499 R2 0.073 Observations 499 482 482 482 411 Partial-F of IVs 14.02
(p=0.000) Over-identification test
2.198 (p=0.138)
1.405 (p=0.236)
0.634 (p=0.426)
1.088 (p=0.297)
0.739 (p=0.390)

58
Table 10. The Effect of Corporate Governance Changes due to VC-backing on Firm Valuation This table presents results on the effect of corporate governance changes during the pre-IPO period on firm valuation in the secondary market immediately post-IPO for subsamples of VC-backed firms and non-VC-backed firms, separately. The dependent variables are QFTDADJ and QIMADJ. The main independent variables in different panels are: △Control rights (Panel A), △Cash-flow rights (Panel B), △Separation (Panel C), Control loss (Panel D), and Turnover1 (Panel E), respectively. In Panels B, C, D, and E, we only report results for the main independent variable and omit results on control variables for brevity. Coefficients of industry dummies are omitted for brevity. Z-statistics (t-statistics) based on robust standard errors are reported in parentheses. ***, **, and * indicate significance at 1%, 5%, and 10%, respectively. Panel A: The effect of the change of family control rights on firm valuation VC-backed firms Non-VC-backed firms (1) (2) (3) (4) Dependent variables QFTDADJ QIMADJ QFTDADJ QIMADJ △Control rights -0.293* -0.351* 0.597 0.268 (-1.686) (-1.752) (1.284) (0.614) Political connection 0.057 0.033 -0.079 -0.035 (0.371) (0.240) (-0.470) (-0.231) Business connection -0.262 -0.086 0.406** 0.268* (-1.830) (-1.321) (2.413) (1.783) Education -0.209 -0.190 0.343** 0.207 (-0.703) (-0.633) (2.207) (1.481) Firm age 0.009 -0.034 0.081 0.013 (0.041) (-0.217) (0.691) (0.128) Size -0.311** -0.171 -0.500*** -0.436*** (-3.268) (-1.516) (-5.801) (-5.543) Leverage -0.702 -1.471** -0.290 -0.415 (-1.287) (-3.180) (-0.461) (-0.651) Prior ROA 2.441 1.942 -1.671 -1.567 (0.933) (0.823) (-0.978) (-0.863) Constant 6.471** 4.459* 10.513*** 9.778*** (2.936) (2.194) (6.126) (5.918) Industry Dummy control control control controlObservations 203 203 279 279 R-squared 0.142 0.117 0.157 0.140 Difference between the coefficient estimates of △Control rights in VC-backed and non-VC-backed firms (Chi-square in parentheses) △Control rights (VC-backed)- △Control rights (non-VC-backed)
-0.890 (-2.98)*
-0.619 (-1.56)
Panel B: The effect of the change of family cash-flow rights on firm valuation △Cash-flow rights 0.181 0.169 0.792 0.413 (0.350) (0.281) (1.571) (0.983) Other controls Yes Yes Yes Yes Observations 203 203 279 279 R-squared 0.141 0.115 0.160 0.141 Difference between the coefficient estimates of △Cash-flow rights in VC-backed and non-VC-backed firms (Chi-square in parentheses) △Cash-flow rights(VC-backed)- △Cash-flow rights (non-VC-backed)
-0.611 (-0.83)
-0.244 (-0.12)

59
Panel C: The effect of the change of separation between family control and cash-flow rights on firm valuation △Separation -4.719* -4.861* -1.219 -1.088
(-1.861) (-1.826) (-0.567) (-0.574)Other controls Yes Yes Yes YesObservations 203 203 279 279R-squared 0.153 0.129 0.153 0.139Difference between the coefficient estimates of △Separation in VC-backed and non-VC-backed firms (Chi-square in parentheses) △Separation (VC-backed)- △Separation (non-VC-backed)
-3.500 (-1.17)
-3.773 (-1.41)
Panel D: The effect of founding family losing voting controls on firm valuationControl loss 0.693** 0.603* -0.202 -0.141
(1.981) (1.819) (-0.518) (-0.395)Other controls Yes Yes Yes YesObservations 178 178 233 233R-squared 0.157 0.144 0.149 0.132Difference between the coefficient estimates of Control loss in VC-backed and non-VC-backed firms (Chi-square in parentheses) Control loss (VC-backed)- Control loss (non-VC-backed)
0.895 (3.11)*
0.744 (2.49)
Panel E: The effect of family members departing from management positions on firm valuation Turnover1 -0.256 -0.166 0.147 0.108
(-1.303) (-0.852) (0.784) (0.664)Other controls Yes Yes Yes YesObservations 210 210 289 289R-squared 0.156 0.120 0.154 0.140Difference between the coefficient estimates of Turnover1 in VC-backed and non-VC-backed firms (Chi-square in parentheses) Turnover1 (VC-backed)- Turnover1 (non-VC-backed)
-0.403 (-2.32)
-0.274 (-1.23)

1
High Differentiation and Low Standardization:
The Role of Venture Capitalists in Transforming the
Management and Governance of Private Family Firms
Internet Appendix
(not for journal publication)

2
Table A1. Characteristics of Family Members Departing from Management Positions
This table presents numbers and percentages of family members departing from management positions subsamples of VC-backed firms and non-VC-backed firms, separately. We further sort departing family members by their original positions (Panel A), their relationships to founders (Panel B), and their gender (Panel C). The sample consists of 1,378 family members who held management positions in 499 sample family firms.
Panel A: Numbers of family members departing from management positions sorted by original positions
VC-backed Non-VC-backed
Number percent Number percent
Director 30 5.24% 46 5.71%
Supervisor 40 6.98% 35 4.35%
Top executive 16 2.79% 10 1.24%
Number of departing family members in the subsample 86 15.01% 91 11.30%
Total number family members in the subsamples 573 805
Panel B: Numbers of family members departing from management positions sorted by relationships to founders VC-backed Non-VC-backed
Number percent Number percent
The founder 3 0.52% 4 0.50%
Blood-based family members 41 7.16% 49 6.09%
Father 8 1.40% 6 0.75%
Mother 3 0.52% 0 0.00%
Brother 13 2.27% 20 2.48%
Sister 5 0.87% 6 0.75%
Cousins 1 0.17% 2 0.25%
Son 5 0.87% 5 0.62%
Daughter 2 0.35% 8 0.99%
Nephew 1 0.17% 1 0.12%
Others 3 0.52% 1 0.12%
Marriage-based family members 42 7.33% 38 4.72%
Wife 26 4.54% 24 2.98%
Husband 1 0.17% 0 0.00%
Father/mother in-law 2 0.35% 1 0.12%
Wife’s brother 2 0.35% 2 0.25%
Wife’s sister 2 0.35% 4 0.50%
Brother/sister in-law 4 0.70% 2 0.25%
Daughter in-law 0 0.00% 3 0.37%
Others 5 0.87% 2 0.25%
Number of departing family member in the subsample 86 15.01% 91 11.30%
Panel C: Numbers of family members departing from management positions sorted by gender
VC-backed Non-VC-backed
Number percent Number percent
Male 43 7.50% 43 5.34%
Female 43 7.50% 48 5.96%
Number of departing family member in the subsample 86 15.01% 91 11.30%

3
Table A2. Propensity Score Matching Analysis of the Effect of VC-backing on Family Control
Rights, Cash-Flow Rights, and the Separation between the Two: Univariate Tests
This table reports mean differences of changes of family control rights, cash-flow rights, and the separation between the two between VC-backed and matched non-VC-backed family firms. Each VC-backed family firm is matched with one or more non-VC-backed firms using propensity score, Gaussian kernel, or regression-adjusted local linear matching approaches, respectively. Matching is conducted with replacement and common support. Standard errors are bootstrapped standard errors with 50 replications. Confidence intervals are 95% selection bias adjusted confidence intervals. Matching variables include CSRC industry code dummies, family firm headquarter province dummies, ln(total assets) at the end of IPO -3 year, ln(firm age) at the end of IPO -3 year, number of family members (co-)founding the firm, total ownership of founding family members at firm startup, and education background of founders. Proxies of changes of family ownership include △Control rights (Panel A), △Cash-flow rights (Panel B), △Separation (Panel C), and Control Loss (Panel D). ***, **, and * indicate significance at 1%, 5%, and 10%, respectively.
Propensity Score Gaussian Kernel Regression-Adjust
Local Linear Panel A: The percentage change of family control rights (△Control rights) Difference in means -0.055 -0.057 -0.056 Standard error 0.025 0.020 0.022 z-statistics -2.22** -2.91*** -2.59*** Confidence interval [-0.104, -0.006] [-0.095, -0.019] [-0.099, -0.014] Panel B: The percentage change of family cash-flow rights (△Cash-flow rights) Difference in means -0.058 -0.053 -0.052 Standard error 0.022 0.023 0.022 z-statistics -2.61*** -2.26** -2.37** Confidence interval [-0.101, -0.014] [-0.099, -0.007] [-0.095, -0.009] Panel C: The change of separation between control rights and cash-flow rights (△Separation) Difference in means -0.010 -0.006 -0.006 Standard error 0.004 0.003 0.003 z-statistics -2.32** -1.86* -1.68* Confidence interval [-0.018, -0.002] [-0.012, 0.0003] [-0.012, 0.001] Panel D: Dummy of founding family losing voting control (Control Loss) Difference in means 0.064 0.060 0.060 Standard error 0.032 0.029 0.029 z-statistics 2.02** 2.11** 2.06** Confidence interval [0.002, 0.127] [0.004, 0.116] [0.003, 0.116]

4
Table A3. The Effect of Corporate Governance Changes due to VC-backing on Post-IPO Operating Performance This table presents results of the effect of corporate governance changes during the pre-IPO period on the improvement of post-IPO operating performance for subsamples of VC-backed firms and non-VC-backed firms, separately. The dependent variable, △Adjusted OROA, is the change of industry- and performance-adjusted operating return on assets (OROA), which subtracts the industry- and performance-adjusted OROA in the year prior to IPO (year -1) from the industry- and performance-adjusted OROA in subsequent years (years 0 through 3). The main independent variables in different panels are: △Control rights (Panel A), △Cash-flow rights (Panel B), △Separation (Panel C), Control loss (Panel D), and Turnover1 (Panel E), respectively. In Panels B, C, D, and E, we only report results for the main independent variable and omit results on control variables for brevity. Coefficients of industry dummies are omitted for brevity. Z-statistics (t-statistics) based on robust standard errors are reported in parentheses. ***, **, and * indicate significance at 1%, 5%, and 10%, respectively. Panel A: The effect of the change of family control rights on post-IPO operating performance
VC-backed firms Non-VC-backed firms
(1) (2) (3) (4) (5) (6) (7) (8)
Dependent variables
△Adjusted
OROA (IPO -1
to IPO)
△Adjusted
OROA (IPO -1
to IPO +1)
△Adjusted
OROA (IPO -1
to IPO +2)
△Adjusted
OROA (IPO -1
to IPO +3)
△Adjusted
OROA (IPO -1
to IPO +0)
△Adjusted
OROA (IPO -1
to IPO +1)
△Adjusted
OROA (IPO -1
to IPO +2)
△Adjusted
OROA (IPO -1
to IPO +3)
△Control rights -0.054** -0.068*** -0.046* -0.044 0.032 0.029 0.027 0.036
(-2.495) (-2.631) (-1.667) (-1.545) (1.479) (1.503) (1.275) (1.193)
Political connection 0.006 0.016 0.011 0.013 0.004 0.002 0.004 0.018*
(0.706) (1.423) (1.003) (1.016) (0.573) (0.198) (0.579) (1.688)
Business connection 0.005 -0.005 -0.003 0.009 -0.010 0.005 0.000 -0.005
(0.614) (-0.426) (-0.255) (0.701) (-1.325) (0.591) (0.055) (-0.525)
Education -0.005 0.003 0.007 -0.014 -0.007 -0.006 -0.016** -0.014
(-0.655) (0.363) (0.523) (-1.087) (-0.888) (-0.686) (-2.097) (-1.539)
Firm age -0.006 0.001 0.005 0.001 0.003 0.015** 0.015** 0.007
(-0.867) (0.171) (0.499) (0.152) (0.475) (2.321) (2.422) (0.987)
Size 0.012** 0.012* 0.007 -0.002 0.016*** 0.009* 0.005 0.002
(2.304) (1.911) (1.005) (-0.180) (3.162) (1.781) (1.044) (0.231)
Leverage -0.008 0.004 -0.055 -0.016 0.040 0.035 0.049 0.040
(-0.273) (0.149) (-1.327) (-0.333) (1.035) (1.021) (1.427) (0.772)

5
Prior ROA -0.253*** -0.207** -0.262*** -0.111 -0.219*** -0.112 -0.047 -0.008
(-2.774) (-2.000) (-2.629) (-0.850) (-2.648) (-1.417) (-0.624) (-0.059)
Constant -0.275** -0.216 -0.143 0.009 -0.349*** -0.255*** -0.174* -0.099
(-2.325) (-1.501) (-1.026) (0.047) (-3.705) (-2.702) (-1.855) (-0.770)
Industry Dummy control control control control control control control control
Observations 202 202 202 142 279 279 279 217
R-squared 0.248 0.181 0.108 0.072 0.269 0.157 0.146 0.072
Difference between the coefficient estimates of △Control rights in VC-backed and non-VC-backed firms (Chi-square in parentheses)
△Control rights (VC-backed)
-△Control rights
(non-VC-backed)
-0.086
(-8.32)***
-0.097
(-9.57)***
-0.073
(-4.11)**
-0.080
(-4.00)**
Panel B: The effect of the change of family cash-flow rights on post-IPO operating performance
△Cash-flow rights -0.039* -0.054** -0.044* -0.034 0.031 0.027 0.026 0.031
(-1.802) (-2.159) (-1.766) (-1.297) (1.452) (1.512) (1.249) (1.050)
Other controls Yes Yes Yes Yes Yes Yes Yes Yes
Observations 202 202 202 142 279 279 279 217
R-squared 0.236 0.172 0.108 0.067 0.269 0.156 0.146 0.070
Difference between the coefficient estimates of △Cash-flow rights in VC-backed and non-VC-backed firms (Chi-square in parentheses)
△Cash-flow rights
(VC-backed)-△Cash-flow
rights (non-VC-backed)
-0.070
(-5.59)**
-0.081
(-7.36)***
-0.070
(-4.23)**
-0.065
(-2.91)*
Panel C: The effect of the change of separation between family control and cash-flow rights on post-IPO operating performance
△Separation -0.144* -0.168** -0.175* -0.155** 0.057 0.090 0.057 0.108
(-1.858) (-2.037) (-1.693) (-2.082) (0.671) (1.225) (0.742) (1.359)
Other controls Yes Yes Yes Yes Yes Yes Yes Yes
Observations 202 202 202 142 279 279 279 217
R-squared 0.231 0.160 0.104 0.066 0.265 0.156 0.143 0.070

6
Difference between the coefficient estimates of △Separation in VC-backed and non-VC-backed firms (Chi-square in parentheses)
△Separation (VC-backed)-
△Separation
(non-VC-backed)
-0.201
(-3.23)*
-0.258
(-5.77)**
-0.232
(-2.94)*
-0.263
(-6.28)**
Panel D: The effect of founding family losing voting controls on post-IPO operating performance
Control loss -0.002 0.002 0.004 0.000 -0.005 0.000 0.022 0.044
(-0.212) (0.207) (0.261) (0.010) (-0.210) (0.014) (0.956) (1.237)
Other controls Yes Yes Yes Yes Yes Yes Yes Yes
Observations 177 177 177 122 233 233 233 184
R-squared 0.191 0.175 0.092 0.085 0.244 0.160 0.159 0.076
Difference between the coefficient estimates of Control loss in VC-backed and non-VC-backed firms (Chi-square in parentheses)
Control loss (VC-backed)-
Control loss
(non-VC-backed)
0.003
(0.01)
0.002
(0.01)
-0.018
(-0.51)
-0.044
(-1.28)
Panel E: The effect of family members departing from management positions on post-IPO operating performance
Turnover1 -0.010 -0.013 -0.011 -0.016 0.007 0.013 0.006 0.005
(-1.239) (-1.254) (-0.949) (-1.027) (0.888) (1.541) (0.769) (0.485)
Other controls Yes Yes Yes Yes Yes Yes Yes Yes
Observations 209 209 209 147 289 289 289 218
R-squared 0.208 0.149 0.116 0.060 0.264 0.160 0.151 0.067
Difference between the coefficient estimates of Turnover1 in VC-backed and non-VC-backed firms (Chi-square in parentheses)
Turnover1 (VC-backed)-
Turnover1 (non-VC-backed)
-0.017
(-2.40)
-0.026
(-4.03)**
-0.017
(-1.57)
-0.021
(-1.37)

7
In Table A3 above, we test our hypothesis regarding the effect of corporate governance
changes due to VC-backing on post-IPO operating performance. The dependent variable is
post-IPO operating performance (△Adjusted OROA), which is the change of industry- and
performance-adjusted operating return on assets (OROA) from the year prior to IPO (year -1)
to the year of IPO (year 0), and the three years post-IPO (year 1 through year 3).
Panel A of Table A3 reports the estimated effect of the change of family control rights on
the improvement of post-IPO operating performance among VC-backed firms (Columns 1-4)
and non-VC-backed firms (Columns 5-8). The results in Columns 1 to 3 suggest that
VC-backed firms with larger reduction of family control rights experience greater
improvement of post-IPO operating performance in the two years post-IPO. The estimated
coefficient of △Control rights in Column 4 is also negative, but marginally insignificant,
possibly because the number of observations of operating performance goes down
significantly in the third year post-IPO. Columns 5 to 8 of Panel A show that the effect of the
change of family control rights on post-IPO performance is not significant within
non-VC-backed firms. At the bottom of Panel A, we also report the differences between the
coefficient estimates of △ Control rights in the subsamples of VC-backed and
non-VC-backed firms, which are all negative and significantly different from zero at 1% or 5%
level. These findings indicate that the effect of the reduction of family control rights on the
improvement of post-IPO operating performance is significantly greater among VC-backed
firms than among non-VC-backed firms.
Panel B of Table A3 reports the estimated effect of the change of family cash-flow rights
on the improvement of post-IPO operating performance. In Panel B and all the later panels of
Table A3, we only report the coefficient estimates of corporate governance change variables,
and omit the controlling variables to save space. Results in Panel B show that a decrease of
family cash-flow rights will lead to an increase in post-IPO performance among VC-backed
firms (Columns 1 to 4). On the other hand, this effect is not significant among
non-VC-backed firms (Columns 5 to 8). The differences between the coefficient estimates of
△Cash-flow rights in the subsamples of VC-backed and non-VC-backed firms are all
negative and significant, suggesting that the effect of the reduction of family cash-flow rights
on the improvement of post-IPO operating performance is stronger among VC-backed firms

8
than among non-VC-backed firms.
In Panel C of Table A3, we find that the coefficient estimates of the change of the
separation between family control rights and cash-flow rights (△Separation) are all negative
and statistically significant in the subsample of VC-backed firms (Columns 1 to 4). These
effects are also economically significant. A one standard deviation decrease in the separation
between family control rights and cash-flow rights (0.041) improves the adjusted operating
performance of VC-backed firms by 0.59%, 0.69%, 0.72%, and 0.64% in year 0, 1, 2, and 3
post-IPO relative to the year prior to IPO, respectively. In Columns 5 to 8, we show that none
of the coefficient estimates of△Separation among non-VC-backed firms is significant. At the
bottom of Panel C, we also show that the effect of the change of separation between family
control rights and cash-flow rights on post-IPO operating performance is significantly
stronger among VC-backed firms compared to that among non-VC-backed firms.
Panel D of Table A3 shows that whether the founding family loses voting control has no
statistically significant effect on the improvement of post-IPO operating performance, among
both VC-backed and non-VC-backed firms. Panel E of Table A3 shows that departures of
family members from top management positions have no significant effect on the
improvement of post-IPO operating performance among both VC-backed and
non-VC-backed firms. We further investigate whether the reduction of family members
holding top management positions to 2 persons or less could result in the improvement of
post-IPO performance (the median number of family members holding top management
positions in the year prior to IPO is 2). We find that such reduction of family members to 2 or
less indeed improves firm post-IPO operating performance (not tabulated).
We further explore whether the effect of corporate governance changes due to
VC-backing on the improvement of post-IPO firm operating performance increases with the
relative power of VCs versus the founding family (as proxied by VCs’ equity ownership) and
with VC board representation. To address this question, we add the interaction terms of
corporate governance changes (Y’) with VC shareholdings (or VC director), as well as VC
shareholdings (or VC director) into Model (4), and estimate the regression model among
sample VC-backed family firms. We find that the coefficient estimates of the interaction
terms of corporate governance changes (Y’) with VC shareholdings (or VC director) are

9
negative and statistically significant when corporate governance changes (Y’) is proxied by
△Control rights, △Cash-flow rights, or △Separation, but not statistically significant when
Y’ is proxied by Control loss or Turnove1 (not tabulated). These results suggest that declines
in family control rights, cash-flow rights, and the separation between the two translate more
effectively into better firm operating performance when VCs have greater power relative to
the founding family (as proxied by VCs’ shareholdings) and when VCs have board
representation.