hidrogen production
TRANSCRIPT
7/25/2019 Hidrogen Production
http://slidepdf.com/reader/full/hidrogen-production 1/7
Hydrogen production by methane and hydrogen
sulphide reaction: Kinetics and modeling study
over Mo/La2O3eZrO2 catalyst
A.L. Martı́ nez-Salazar a,* , J.A. Melo-Banda a, J.M. Domı́ nguez- Esquivel b,V.H. Martı́ nez-Sifuentes a, Y. Salazar-Cerda a, M.A. Coronel-Garcı́ a a,M.A. Meraz-Melo c
a
Instituto Tecnologico de Ciudad Madero, Los Mangos, 1 de Mayo s/n col., Cd. Madero, Tamaulipas, 89440, M
exicob Instituto Mexicano del Petroleo, Eje Central Lazaro Cardenas 152, San Bartolo Atepehuacan, Gustavo A. Madero,
Ciudad de Mexico, Distrito Federal, 07730, Mexicoc Instituto Tecnologico de Iztapalapa III, Av. Cuitlahuac, Col. Los Reyes Culhuacan, Del. Iztapalapa, Mexico, D.F.,
Mexico
a r t i c l e i n f o
Article history:
Received 8 January 2015
Received in revised form
11 March 2015
Accepted 16 March 2015Available online 22 April 2015
Keywords:
Hydrogen production
Methane reforming with H2S
Kinetics
a b s t r a c t
Actually, catalytic steam reforming method is a widely used to produce hydrogen or syngas
as the first step for the conversion of methane into liquid fuels through the Fischer-
Tropsch synthesis.
The reforming of CH4 by H2S can be considered as an alternative route to produce
hydrogen from methane. With this process, the removal of H2S in natural gas streams is no
longer necessary and sulfur, usually considered as a strong pollutant on liquid fuels in
refineries, is used as a reagent in H2S form of hydrodesulphurization processes. This
alternative produces hydrogen, a valuable chemical and clean energy source, as the
principal product and carbon disulphide as a secondary petrochemical with high com-
mercial value.
The open literature concerning the kinetic study of the methane-hydrogen sulphide
reaction is very poor. In this research the reaction of CH4 and H2S over zirconia catalyst
modified with lanthanum oxide impregnated with molybdenum has been studied in a fixed
bed tubular reactor varying the inlet CH4 flow rate over a temperatures range of 1023
e1323 K and feed molar ratio CH4:H2S of 1:12. The LangmuireHinshelwood theory has been
used to analyze kinetic models. Model discrimination has been performed and the kinetic
parameters and adsorption constants calculated.
Finally, the simulation process of reforming CH4 by H2S has been developed in whichseparation of the produced hydrogen and no reacted H2S involves absorption through
diethanolamine. A tubular reactor from kinetic parameters was dimensioned. Aspen Plus ®
11.1 and Hysys V.8 simulation software was used. Preliminary results showed a high purity
H2 can be produced by this route.
Copyright © 2015, Hydrogen Energy Publications, LLC. Published by Elsevier Ltd. All rights
reserved.
* Corresponding author. Tel.: þ52 8332111039.E-mail address: [email protected] (A.L. Martı́nez-Salazar).
Available online at www.sciencedirect.com
ScienceDirect
j o u r n a l h o m e p a g e : w w w . e l s e v i er . c o m / l o c a t e / he
i n t e r n a t i o n a l j o u r n a l o f h y d r o g e n e n e r g y 4 0 ( 2 0 1 5 ) 1 7 3 5 4 e1 7 3 6 0
http://dx.doi.org/10.1016/j.ijhydene.2015.03.074
0360-3199/Copyright © 2015, Hydrogen Energy Publications, LLC. Published by Elsevier Ltd. All rights reserved.
7/25/2019 Hidrogen Production
http://slidepdf.com/reader/full/hidrogen-production 2/7
Introduction
Hydrogen, in addition to be used as essential in the industry of
petroleum for obtaining improved fuels, is considered an
attractive energy supply because it can be burned like gasoline
and natural gas, or converted to electricity without any carbon
emissions at the point of use [1]. Its main advantage is that itscombustion produces only water, which means that does not
emit greenhouse gases, such as fossil fuels and biomass. This
makes it particularly appropriate to replace the petroleum-
based products.
Catalytic reforming of CH4 and H2S to produce H2 and CS2
has poor experimental evidence recorded last years. Mass
catalysts or simple supports that have been used, given their
catalytic properties, do not meet the needs of activation,
selectivity or stability required for this reaction.
Recently, research has been focusing on the structure of
catalysts that have characteristics that generate high potential
for conversion on moderate conditions of operation that could
be the basis of an interesting option of process in the produc-tion of hydrogen. One of these catalysts is zirconia catalyst
modified with lanthanum oxide impregnated with molybde-
num, Mo/La2O3eZrO2, which has shown some advantages in
the improvement of the properties of the catalyst, achieving
high selectivity to hydrogen (64%) in its catalytic performance
[2]. The incorporation of lanthanum oxide in zirconia allowed
the increase of its surface area with enhancedthermal stability
[3]. Also, molybdenum disulfide (MoS2), obtained from the
sulfurization step in the tubular reactor before the reaction
stage, has proven to be a highly effective catalyst for the
decomposition of hydrogen sulfide reaching conversions
higher than 95% at temperatures above 600 C [4].
In this work, kinetics of the reactive system reforming of CH4 by H2S using Mo/La2O3eZrO2 catalyst, based on the
methodology of Langmuir-Hinshelwood-Hougen-Watson was
studied. Pilot plant experimental data of conversion for a
range of temperatures and residence times were obtained
and, by means of them, it was determined which kinetic
model among several possible gave the best setting to the
experimental data. The kinetic parameters and adsorption
constants were obtained for adequate model.
In order to observe an engineering application of the re-
sults of the project, two simulation models were created: one
to propose a process flowsheet that, based on the conditions
of the reaction studied, allows obtain and separate from the
reaction system products with commercially acceptable pu-rity. The other is for calculating the sizing of a tubular reactor
for a given production, based on the kinetic parameters and
adsorption constants calculated.
Proposed kinetic mechanism and models
Catalytic reactions involved in this research work, for the
kinetic study of the reforming of methane with hydrogen
sulfide are as follows:
2H2S þ CH4/CS2 þ 4H2 R1
2H2S/
S2 þ 2H2 R2
At the temperature range in which research took place,
1023e1323 K; and with H2S/CH4 ¼ 12 as a feed molar ratio,
the reaction of pyrolysis of methane can be ignored [5].
The reactions of Table 1 represent the mechanism pro-
posed for this study. Writing rate expressions every step is
considered as an elementary reaction; the only difference is
that the concentration of the species in gas phase isreplaced by its respective partial pressures.
The expressions of rate for adsorption of methane and
hydrogen sulfide are:
rAD1 ¼ kA1
PCH4$CV
CCH2ðsÞ
KCH4
$PH2
(1)
rAD2 ¼ kA2
P4
H2S$C4V
C4SðsÞ
KH2S$P4
H2
! (2)
The expressions of rate for the step of surface reactions
that produce adsorbed carbon disulfide and sulfur and
hydrogen in gaseous phase are:
rs1 ¼ krs1
"CCH2ðsÞ$C2
SðsÞ CCS2ðsÞ$PH2
$C2V
Krs1
# (3)
rs2 ¼ krs2
CSðsÞ$CSðsÞ
CS2ðsÞ$CV
Krs2
(4)
The expressions of rate for desorption of the carbon di-
sulfide and sulfur are:
rD1 ¼ kD1
CCS2ðsÞ
PCS2$CV
KDCS2
(5)
rD2 ¼ kD2
CS2ðsÞ
PS2$CV
KDS2
(6)
For the mechanism postulated in the sequence given by
Table 1, we want to determine the limiting step of the speed.
First, it is supposed that one of thesteps limits speed(controls
rate) and then rate expressions are formulated in terms of
partial pressures of the present species.
a) Assuming surface reactions is the rate controlling step.
rs1 ¼ k1
"PCH4
P2H2S
P3H2
PCS2
$PH2
Ke1
# 1
Q 3r(7)
Table 1 e Steps of a LangmuireHinshelwood kineticsmechanism.
CH4 + (s) CH2(s) + H2
Adsorption4H2S + 4(s) 4S(s) + 4H2
CH2(s) + 2S(s) CS2(s) + H2 + 2(s)Surface reaction
S(s) + S(s) S2(s) + (s)
CS2(s) CS2 + (s)Desorption
S2(s) S2 + (s)
i n t e r n a t i o n a l j o u r n a l o f h y d r o g e n e n e r g y 4 0 ( 2 0 1 5 ) 1 7 3 5 4 e1 7 3 6 0 17355
7/25/2019 Hidrogen Production
http://slidepdf.com/reader/full/hidrogen-production 3/7
rs2 ¼ k2
"P2
H2S
P2H2
PS2
Ke2
# 1
Q 2r(8)
where
1 þ
KCH4$PCH4
PH2
þKH2 S$PH2 S
PH2
þ KCS2$PCS2
þ KS2$PS2
¼ Q r (9)
b) Assuming adsorption of methane and hydrogen sulfide
over the surface is the rate controlling step.
rAD1 ¼ k1
"PCH4
PCS2$P2
H2
Ke1
# 1
Q r(10)
rAD2 ¼ k2
"PH2S
P0:5S2
$PH2
Ke2
# 1
Q r(11)
where
"1 þ
KCS2$PCS2
$PH2$Krs2
Krs1$KS2$PS2
þK0:5
S2$P0:5
S2
K0:5rs2
þ KCS2$PCS2
þ KS2$PS2
#¼ Q r
(12)
c) Assuming desorption of the carbon disulfide and sulfur
from the surface is the rate controlling step.
rD1 ¼ k1
"PCH4
$P2H2S
P4H2
PCS2
Ke1
# 1
Q r(13)
rD2 ¼ k2
"P2
H2 S
P2H2
PS2
Ke2
# 1
Q r(14)
where
Experimental
Procedure for the analysis of the models and estimation of
the kinetics parameters
A serial of experimental evaluations were carried out at pilot
level using a quartz fixed bed reactor of 1” diameter, for
studying the kinetics of CH4 and H2S reaction. Themass of the
catalyst was fixed as 3 g of Mo/La2O3eZrO2. The experimental
set was constituted by three sections, the first one consisting
of a gas supply (H2S, CH4) unit fitted to a gas control module.
The second section included the reaction system, consisting
of a quartz vertical reactor and an oven (Thermolyne 11000),
which included an internal temperature controller. The third
section was the analytical unit consisting of a gas chromato-
graph Varian Star 3400, with a capillary column Pora-Q bond,
having a length of 25 m, 0.32 mm i.d. diameter, 5 mm phase,
No. CP7361. Before the reaction the catalyst was dried at 393 K
for 2 h under nitrogen (N2), using a flow of 6.84 L/h. The gas
flow carrying the mixture of N2 and H2S (5.95 L/h) was added
while raising thetemperature to about 723K, at a rate of 353K/
h, while keeping it under these conditions for 4 h in order to
ensure the formation of the metal sulfides, i.e., molybdenum
disulfide (MoS2). Then, the flow of N2 gas was substituted by a
flow of helium (He), at a rate of 6.84 L/h, while increasing the
temperature from 723 to 1023 K, at a rate of 353 K/h. Then theCH4:H2S ratio was adjusted to 1:12 to avoid the formation of
carbon; according to previous thermodynamic research [5].
Methane was introduced at the top side of the reactor, at a
flow rate of 0.189 L/h, while H2S was introduced in form of a
gas flow, which was fed at a rate of 2.268 L/h. The reaction
began at 1023 K and it was increased steeply to reach 1123,
1223 and 1323 K, while maintaining the reaction temperatures
for 4 h, respectively, then the analysis of the gaseous products
was performed starting at a time zero and every hour after-
wards. Before releasing the exhaust gases into the atmo-
sphere, the products were sent through a 2 L scrubber
containing a mixture of sodium hydroxide (NaOH, 6 M) solu-
tion with hydrogen peroxide (H2O2), which was proven toremove H2S and other thiols in the gaseous exhaust
effectively.
The previous procedure was repeated varying molar feed
flows for the purpose of obtain experimental data to calculate
the kinetic parameters of the reaction system. The ideal gas
equation has been applied to obtain the profile of volumetric
flows used, shown in Table 2. The initial volumetric flow was
the minimal that the pilot plant can control, 0.189 L/h of CH4
(higher conversion, residence time ¼ 1.46 kg cat.h/mol),
decreasing the residence time in equal intervals according to
the total of experimental tests.
Measurement of the compositions of inlet and outlet of the
reactor allowed to calculate variables to graph results. These
are: the total conversion of methane (xCH4 ) and the conversion
of H2S to S2 (xS2 ) versus residence time, t.
xCH4 ¼ mole of inlet CH4 mole of outlet CH4
mole de inlet CH4(16)
Table 2 e Variation of feed flows.
Volumetric feed flows
Experimentalrun
CH4 (L/h) H2S (L/h)
1 0.189 2.268
2 0.236 2.83
3 0.315 3.78
4 0.4725 5.67
5 0.945 11.34
"1 þ
KCH4$PCH4
PH2
þ KH2 S$PH2S
PH2
þKCH4
$PCH4$K2
H2 S$P2H2 S$Krs1
P4H2
þK2
H2S$P2H2S$Krs2
P2H2
#¼ Q r (15)
i n t e r n a t i o n a l j o u r n a l o f h y d r o g e n e n e r g y 4 0 ( 2 0 1 5 ) 1 7 3 5 4 e1 7 3 6 017356
7/25/2019 Hidrogen Production
http://slidepdf.com/reader/full/hidrogen-production 4/7
xS2 ¼
mole of outlet S2
moles of inlet H2S (17)
t ¼ mcat
.FE
CH4 (18)
a) Conversions were calculated: total conversion of
methane and conversion of H2S t o S2, as a function of inletand
outlet moles of species. Moles were calculated by means of the
experimental data of composition obtained for the differentvalues of temperature in the range of 1023e1323 K and at the
different values of residence times in the range of
0.5e1.46 kg cat.h/mol.
b) For a given temperature, through Excel, constants were
calculated fitting polynomial function to the experimental
data curves conversion versus residence time (t),
xCH4 ¼ a0 þ a1t þ a2t
2 þ a3t3 (19)
and
xS2 ¼ b0 þ b1t þ b2t
2 þ b3t3 (20)
c) By means of the equations
rCH4 ¼
vxCH4
vt¼ a1 þ 2a2t þ 3a3t
2 (21)
and
rS2 ¼ vxS2
vt¼ b1 þ 2b2t þ 3b3t
2 (22)
A table of values of reaction rate versus residence time was
obtained for each temperature.
d) Since
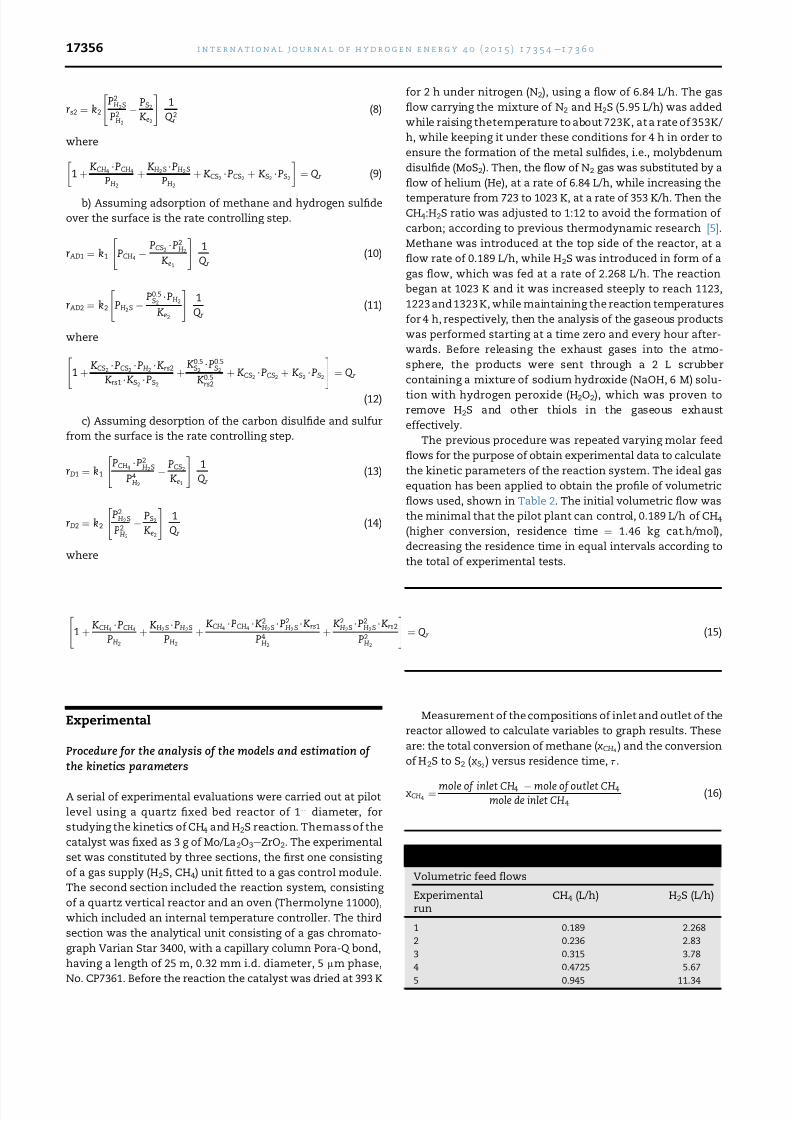
Fig. 1 e Total conversion of CH4 vs residence time at different temperatures, with a feed relation of CH4 :H2S (1:12) and Mo/
La2O3eZrO2 as catalyst.
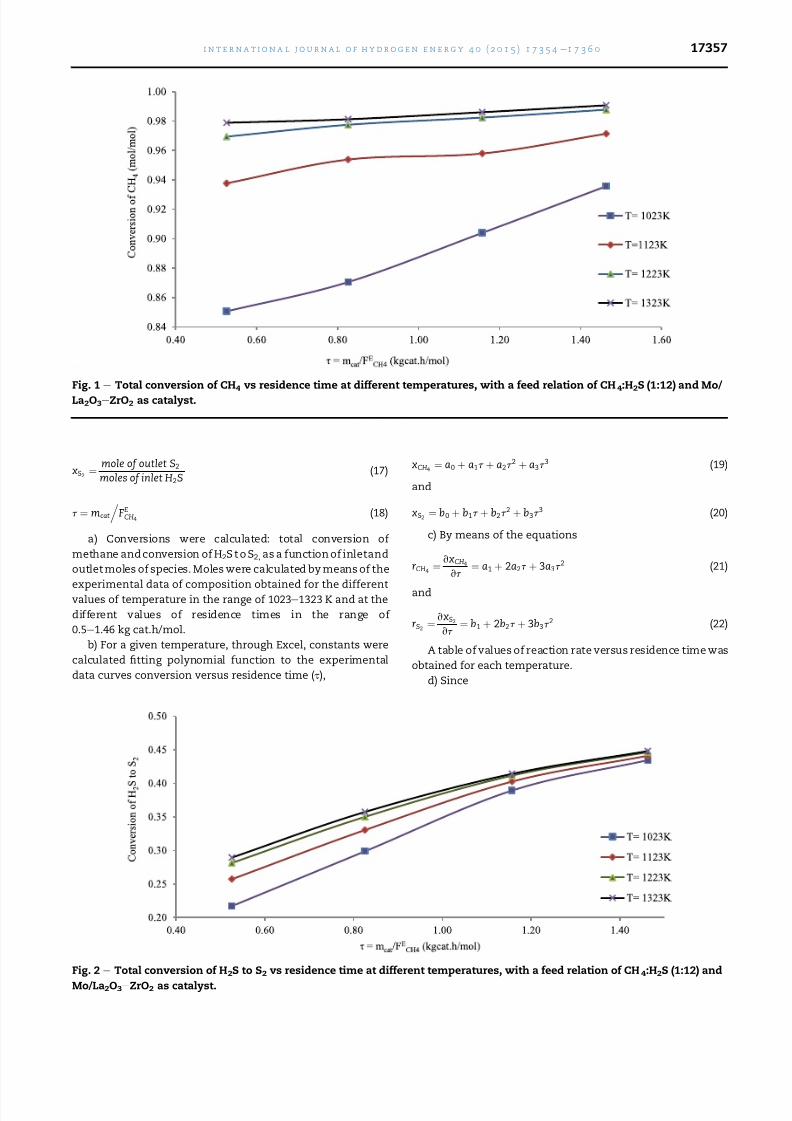
Fig. 2 e Total conversion of H2S to S2 vs residence time at different temperatures, with a feed relation of CH4 :H2S (1:12) and
Mo/La2O3e
ZrO2 as catalyst.
i n t e r n a t i o n a l j o u r n a l o f h y d r o g e n e n e r g y 4 0 ( 2 0 1 5 ) 1 7 3 5 4 e1 7 3 6 0 17357
7/25/2019 Hidrogen Production
http://slidepdf.com/reader/full/hidrogen-production 5/7
rCH4 ¼ rs1
and
rS2 ¼ rs2
We have now the information needed to calculate the
values of the kinetic rate constants k1 and k2, as well as the
values of the constants of adsorption equilibrium KCH4, K H2 S,
KCS2 and KS2
, through an iterative calculation procedure,
assuming that they depend only on the temperature. Com-puter program Polymath was used; this program lets you
know so well is the fitting that makes the model to the
experimental data and, as a consequence, compare models.
e) Based on the results obtained in the last step for the best
model, pre-exponential factors of reaction rate, A j, where
j ¼ 1,2 and pre-exponential factors of adsorption, Aadi, where
i ¼ CH4, H2S, CS2, S2, are calculated. Also activation energies,
E j, and adsorption enthalpies, DHi are obtained in the same
calculation. For these calculations, values of k j vs T and Ki vs T,
obtained in the last step are used, as well as the well-known
equations
ln k j ¼ ln A j E jR
1T
(23)
ln Ki ¼ ln Aadi
DHi
R
1
T
(24)
A graph ln k j o ln Ki as a functionof (1/T) is built, according to
we are calculating [6].
Process flowsheet
The proposed process flowsheet was created with the support
of process Simulator Aspen plus and has as basic initial part a
stoichiometric reactor, Rstoic, in which occur the reactions of
the reforming of methane with hydrogen sulfide at 1223 K,
1 atm of pressure and with a feed molar relationship of H2S/
CH4 ¼ 12. Fractional conversions of 0.99 and 0.28 were given as
data, respectively.
Sizing of a tubular reactor
The size of a reactor for the rates of reactants used in process
flowsheet of the last section was calculated for a catalytic
reactor using, process simulator Hysys V8.4 and Plug flow
reactor model [7].
Kinetic methodology calculation
Plots of conversion versus residence time are shown as Figs. 1
and 2.
For each temperature, at a given value of t the reaction
rates rCH4 y rS2 were calculated with the corresponding
quadratic equations. Partial pressures of the species at the
given t value were calculated with the equation P i ¼ (n i /nT )P
were ni are moles of specie i y nT are total moles. Both, ni y nT ,
were calculated as a function of the fractional conversions
xCH4 y xS2 at the given value of t.
The next step was proving the proposed kinetic models
because we already had a table of reaction rate versus resi-
dence time and versus Pi, for each temperature.
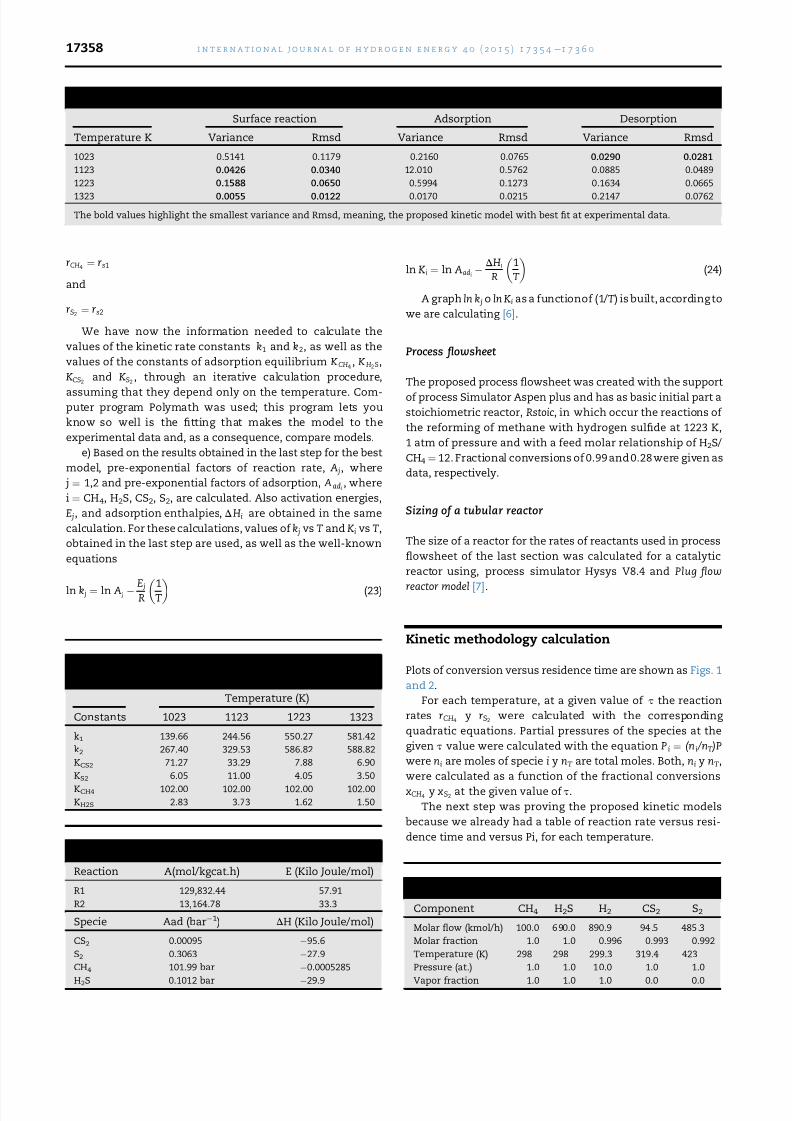
Table 3 e Variances and Rmsd of solved models, using the LevenbergeMarquardt algorithm.
Surface reaction Adsorption Desorption
Temperature K Variance Rmsd Variance Rmsd Variance Rmsd
1023 0.5141 0.1179 0.2160 0.0765 0.0290 0.0281
1123 0.0426 0.0340 12.010 0.5762 0.0885 0.0489
1223 0.1588 0.0650 0.5994 0.1273 0.1634 0.0665
1323 0.0055 0.0122 0.0170 0.0215 0.2147 0.0762
The bold values highlight the smallest variance and Rmsd, meaning, the proposed kinetic model with best fit at experimental data.
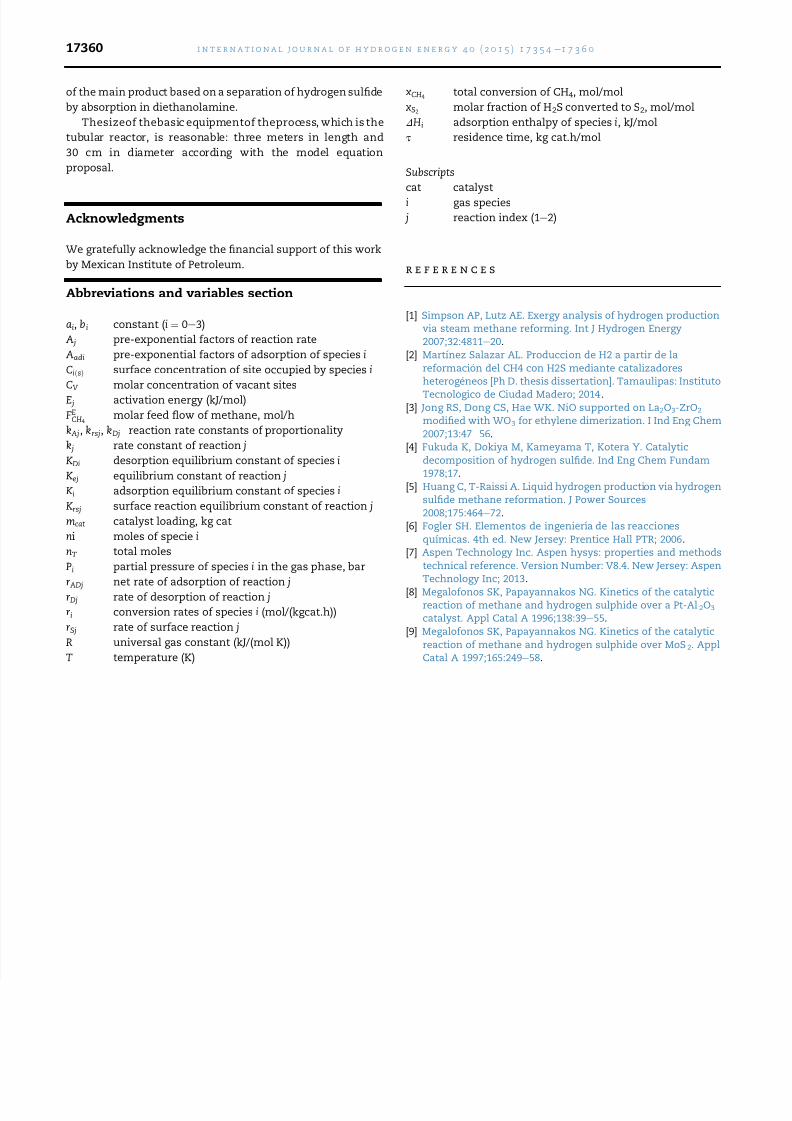
Table 4 e Values of the kinetic constants and equilibriumadsorption constants as a function of temperature.
Temperature (K)
Constants 1023 1123 1223 1323
k1 139.66 244.56 550.27 581.42
k2 267.40 329.53 586.82 588.82
KCS2 71.27 33.29 7.88 6.90
KS2 6.05 11.00 4.05 3.50
KCH4 102.00 102.00 102.00 102.00KH2S 2.83 3.73 1.62 1.50
Table 5 e Kinetic parameters and adsorption constants.
Reaction A(mol/kgcat.h) E (Kilo Joule/mol)
R1 129,832.44 57.91
R2 13,164.78 33.3
Specie Aad (bar1) DH (Kilo Joule/mol)
CS2 0.00095 95.6
S2 0.3063 27.9
CH4 101.99 bar 0.0005285
H2S 0.1012 bar 29.9
Table 6 e Results of the main streams of the flowsheet.
Component CH4 H2S H2 CS2 S2
Molar flow (kmol/h) 100.0 690.0 890.9 94.5 485.3
Molar fraction 1.0 1.0 0.996 0.993 0.992
Temperature (K) 298 298 299.3 319.4 423
Pressure (at.) 1.0 1.0 10.0 1.0 1.0
Vapor fraction 1.0 1.0 1.0 0.0 0.0
i n t e r n a t i o n a l j o u r n a l o f h y d r o g e n e n e r g y 4 0 ( 2 0 1 5 ) 1 7 3 5 4 e1 7 3 6 017358
7/25/2019 Hidrogen Production
http://slidepdf.com/reader/full/hidrogen-production 6/7
The values of kinetic constants k1 y k2 as well as the values
of the adsorption constants KCH4, KH2S, KCS2 y KS2, were solved
for each proposed kinetic model, by means of the software
Polymath using the Levenberg eMarquardt (LM) algorithm for
non-linear regression. Values of the results of variance and
Rmsd (Root mean square deviation) are shown in Table 3.
These indicators were used for comparison of various models
representing the same dependent variable and thus be able to
make a discrimination among them. The model with the
smaller variance and Rmsd represents data with more
accuracy.
For the present study, the surface reaction model gener-
ates smaller values of indicators. There is a good concor-dance, which implies that the proposed mechanism could be
correct and the controlling step of the speed is the surface
reaction.
In Table 4 can be observed the values of the kinetic con-
stants k1 y k2 and equilibrium adsorption constants KCS2 y KS2,
KCH4, KH2S obtained, taking the surface reactions as the rate
controlling step.
Finally, pre-exponential factors, activation energies and
adsorption enthalpies were calculated. Results are shown in
Table 5.
Results and discussion
Kinetic study of the reactive system
The activation energies of the reforming reactions in the
current study are found smaller than the data reported
by Megalofonos and Papayannakos [8,9] for platinum catalyst
on alpha alumina support and MoS2 catalyst (57.91 kJ/mol
versus 431.66 and 94.62 kJ/mol respectively). This means that
the zirconia catalyst modified with lanthanum oxide
impregnated with molybdenum used in the current study is
more active than catalysts used in previous researches. It
could be attributable a good interaction between active phase
and support, also to high temperatures as consequence a good
dispersion of materials [2].
Process flowsheet
Results of variables in the important currents of input and
output of the proposed flowsheet are observed in Table 6. It
can be observed high purity in all products and significant
production of hydrogen, since it is produced in both reactions.
Additionally, the flowsheet of the process validates the sepa-
ration feasibility of the reaction products and H2S via ab-
sorption with diethanolamine instead of a cryogenic
distillation or the use of membranes [5]. Under those condi-tions the proposal equations demonstrated the possible
thermodynamic process, also an effective separation of main
products.
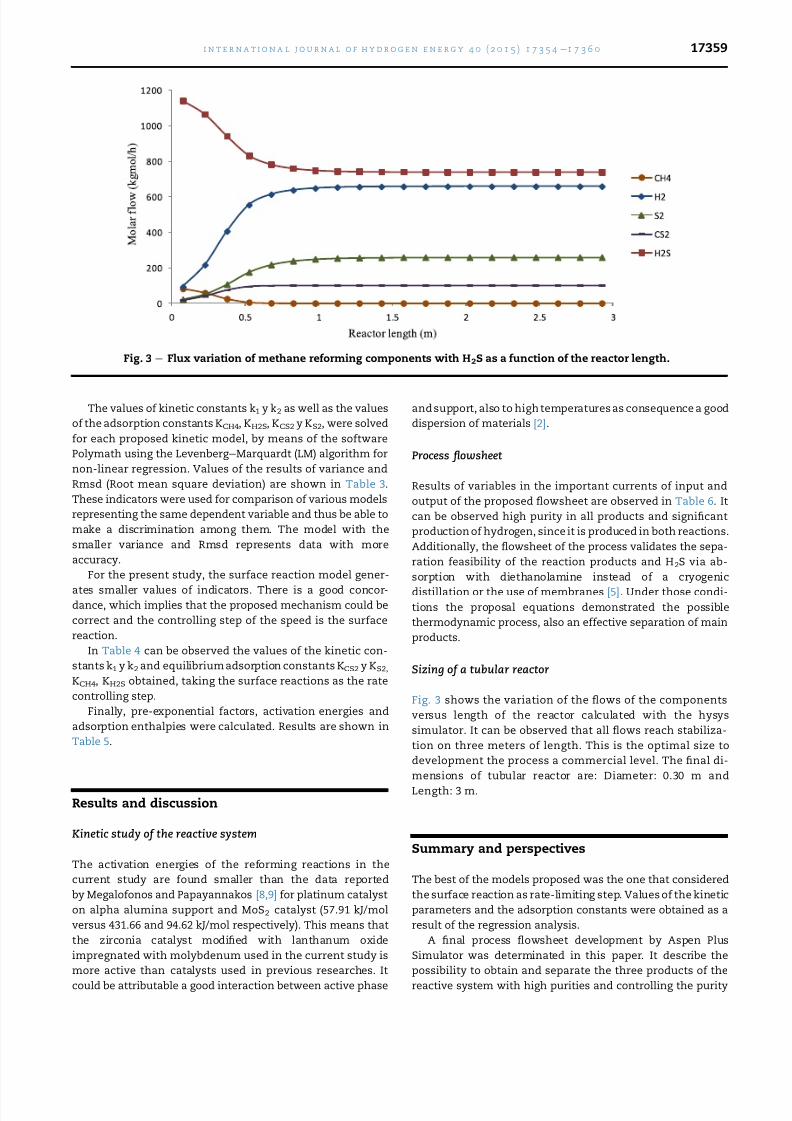
Sizing of a tubular reactor
Fig. 3 shows the variation of the flows of the components
versus length of the reactor calculated with the hysys
simulator. It can be observed that all flows reach stabiliza-
tion on three meters of length. This is the optimal size to
development the process a commercial level. The final di-
mensions of tubular reactor are: Diameter: 0.30 m and
Length: 3 m.
Summary and perspectives
The best of the models proposed was the one that considered
the surface reaction as rate-limiting step. Values of the kinetic
parameters and the adsorption constants were obtained as a
result of the regression analysis.
A final process flowsheet development by Aspen Plus
Simulator was determinated in this paper. It describe the
possibility to obtain and separate the three products of the
reactive system with high purities and controlling the purity
Fig. 3 e Flux variation of methane reforming components with H2S as a function of the reactor length.
i n t e r n a t i o n a l j o u r n a l o f h y d r o g e n e n e r g y 4 0 ( 2 0 1 5 ) 1 7 3 5 4 e1 7 3 6 0 17359
7/25/2019 Hidrogen Production
http://slidepdf.com/reader/full/hidrogen-production 7/7
of the main product based on a separation of hydrogen sulfide
by absorption in diethanolamine.
Thesizeof thebasic equipmentof theprocess, which is the
tubular reactor, is reasonable: three meters in length and
30 cm in diameter according with the model equation
proposal.
Acknowledgments
We gratefully acknowledge the financial support of this work
by Mexican Institute of Petroleum.
Abbreviations and variables section
ai, bi constant (i ¼ 0e3)
A j pre-exponential factors of reaction rate
Aadi pre-exponential factors of adsorption of species i
CiðsÞ surface concentration of site occupied by species i
CV molar concentration of vacant sites
E j activation energy (kJ/mol)
FECH4
molar feed flow of methane, mol/h
kAj, krsj, kDj reaction rate constants of proportionality
k j rate constant of reaction j
KDi desorption equilibrium constant of species i
Kej equilibrium constant of reaction j
Ki adsorption equilibrium constant of species i
Krsj surface reaction equilibrium constant of reaction j
mcat catalyst loading, kg cat
ni moles of specie i
nT total moles
Pi partial pressure of species i in the gas phase, bar
rADj
net rate of adsorption of reaction j
rDj rate of desorption of reaction j
ri conversion rates of species i (mol/(kgcat.h))
rSj rate of surface reaction j
R universal gas constant (kJ/(mol K))
T temperature (K)
xCH4 total conversion of CH4, mol/mol
xS2 molar fraction of H2S converted to S2, mol/mol
DHi adsorption enthalpy of species i, kJ/mol
t residence time, kg cat.h/mol
Subscripts
cat catalyst
i gas species
j reaction index (1e2)
r e f e r e n c e s
[1] Simpson AP, Lutz AE. Exergy analysis of hydrogen productionvia steam methane reforming. Int J Hydrogen Energy2007;32:4811e20.
[2] Martı́nez Salazar AL. Produccion de H2 a partir de lareformacion del CH4 con H2S mediante catalizadoresheterog eneos [Ph D. thesis dissertation]. Tamaulipas: Instituto
Tecnologico de Ciudad Madero; 2014.[3] Jong RS, Dong CS, Hae WK. NiO supported on La2O3-ZrO2
modified with WO3 for ethylene dimerization. I Ind Eng Chem2007;13:47e56.
[4] Fukuda K, Dokiya M, Kameyama T, Kotera Y. Catalyticdecomposition of hydrogen sulfide. Ind Eng Chem Fundam1978;17.
[5] Huang C, T-Raissi A. Liquid hydrogen production via hydrogensulfide methane reformation. J Power Sources2008;175:464e72.
[6] Fogler SH. Elementos de ingenierı́a de las reaccionesquı́micas. 4th ed. New Jersey: Prentice Hall PTR; 2006.
[7] Aspen Technology Inc. Aspen hysys: properties and methodstechnical reference. Version Number: V8.4. New Jersey: AspenTechnology Inc; 2013.
[8] Megalofonos SK, Papayannakos NG. Kinetics of the catalyticreaction of methane and hydrogen sulphide over a Pt-Al2O3
catalyst. Appl Catal A 1996;138:39e55.[9] Megalofonos SK, Papayannakos NG. Kinetics of the catalytic
reaction of methane and hydrogen sulphide over MoS2. ApplCatal A 1997;165:249e58.
i n t e r n a t i o n a l j o u r n a l o f h y d r o g e n e n e r g y 4 0 ( 2 0 1 5 ) 1 7 3 5 4 e1 7 3 6 017360