hhe report no. heta-2017-0174-3335, evaluation of police ... · logistics: donnie booher, james...
TRANSCRIPT

Evaluation of Police Officers’ Exposure to Secondhand Cannabis Smoke at Open-air Stadium Events
HHE Report No. 2017-0174-3335
March 2019

Authors: Douglas M. Wiegand, PhD
Mark M. Methner, PhD, CIH
G. Reed Grimes, MD, MPH
Analytical Support: Lanqing Wang, Li Zhang, Benajamin Blount
Desktop Publisher: Jennifer Tyrawski
Editor: Cheryl Hamilton
Industrial Hygiene Field Assistance: Mike Grant, Bradley King
Logistics: Donnie Booher, James Couch, Kevin Moore, Mihir Patel
Medical Field Assistance: Belinda Johnson, Shirley Robertson, Deborah Sammons, Laura Reynolds
The authors gratefully acknowledge the assistance provided by members of the University’s Department of Environmental Health and Safety.
Keywords: North American Industry Classification System (NAICS) 922120 (Police Protection), Cannabis, Marijuana, Secondhand Cannabis Smoke, Airborne Exposure, Blood Test, Urine Test, Law Enforcement, Event Security, Open-air Concert, Tetrahydrocannabinol, THC
Disclaimer
The Health Hazard Evaluation Program investigates possible health hazards in the workplace under the authority of the Occupational Safety and Health Act of 1970 (29 U.S.C. § 669(a)(6)). The Health Hazard Evaluation Program also provides, upon request, technical assistance to federal, state, and local agencies to investigate occupational health hazards and to prevent occupational disease or injury. Regulations guiding the Program can be found in Title 42, Code of Federal Regulations, Part 85; Requests for Health Hazard Evaluations (42 CFR Part 85).
Availability of Report
Copies of this report have been sent to the employer and employees at the participating police departments. The state and local health department and the Occupational Safety and Health Administration Regional Office have also received a copy. This report is not copyrighted and may be freely reproduced.
Recommended Citation
NIOSH [2019]. Evaluation of police officers’ exposure to secondhand cannabis smoke at open-air stadium events. By Wiegand DM, Methner MM, Grimes GR. Cincinnati, OH: U.S. Department of Health and Human Services, Centers for Disease Control and Prevention, National Institute for Occupational Safety and Health, Health Hazard Evaluation Report 2017-0174-3335, https://www.cdc.gov/niosh/hhe/reports/pdfs/2017-0174-3335.pdf.

Table of Contents
Main Report
Introduction ....................................................................................................................................................... 1
Our Approach ................................................................................................................................................... 1
Our Key Findings .............................................................................................................................................. 2
Our Recommendations .................................................................................................................................... 2
Supporting Technical Information
Section A: Workplace Information ............................................................................................................ A-1
Venue ......................................................................................................................................................... A-1
Employee Information ............................................................................................................................ A-1
Section B: Methods, Results, and Discussion .......................................................................................... B-1
Methods: Personal and Area Air Sampling ........................................................................................... B-1
Results: Personal and Area Air Sampling .............................................................................................. B-1
Methods: Biological Testing ................................................................................................................... B-2
Results: Biological Testing ...................................................................................................................... B-3
Methods: Medical Questionnaire ........................................................................................................... B-3
Results: Medical Questionnaire .............................................................................................................. B-4
Discussion ................................................................................................................................................. B-4
Limitations ................................................................................................................................................. B-6
Conclusions ............................................................................................................................................... B-6
Section C: Tables .......................................................................................................................................... C-1
Section D: References .................................................................................................................................. D-1

This page left intentionally blank

1
Introduction
Request
In September 2017, the Department of Environmental Health and Safety of a university requested a health hazard evaluation about possible exposure to secondhand cannabis smoke among police officers providing security for campus concert events. The university was concerned about how exposure to secondhand cannabis smoke might affect police officers’ health while they perform security and law enforcement activities.
Background
Numerous states have legalized cannabis, also known as marijuana, for medicinal or recreational use. The extent of health effects from potential occupational exposure to secondhand cannabis smoke is unknown.
Workplace
Police officers who participated in this evaluation worked in areas within and around the university’s football stadium. The stadium is an open-air venue with a seating capacity of approximately 53,600. Officers were assigned to different locations and patrolled on foot, on bicycles, and in small vehicles before, during, and after concert events.
To learn more about the workplace, go to Section A in the Supporting Technical Information
Our Approach
We visited the venue on two consecutive concert days to evaluate police officers’ exposure to secondhand cannabis smoke and potential health symptoms experienced during work at those concerts. We completed the following activities during the evaluation:
• Observed work processes, practices, and workplace conditions.
• Collected full-shift personal air samples and area air samples to test for tetrahydrocannabinol (THC), the active ingredient in cannabis.
• Collected preshift and postshift (preconcert and postconcert) urine samples to test for the following substances:
o THC and two other chemical markers produced when the body breaks down THC.
o Creatinine, a substance produced by the body that helps us understand the urine results.
• Collected postconcert blood samples to test for THC and the two chemical markers mentioned.
• Invited officers to complete an anonymous questionnaire asking about any potential health symptoms they may have experienced while working at the concert.
2
To learn more about our methods, go to Section B in the Supporting Technical Information
Our Key Findings
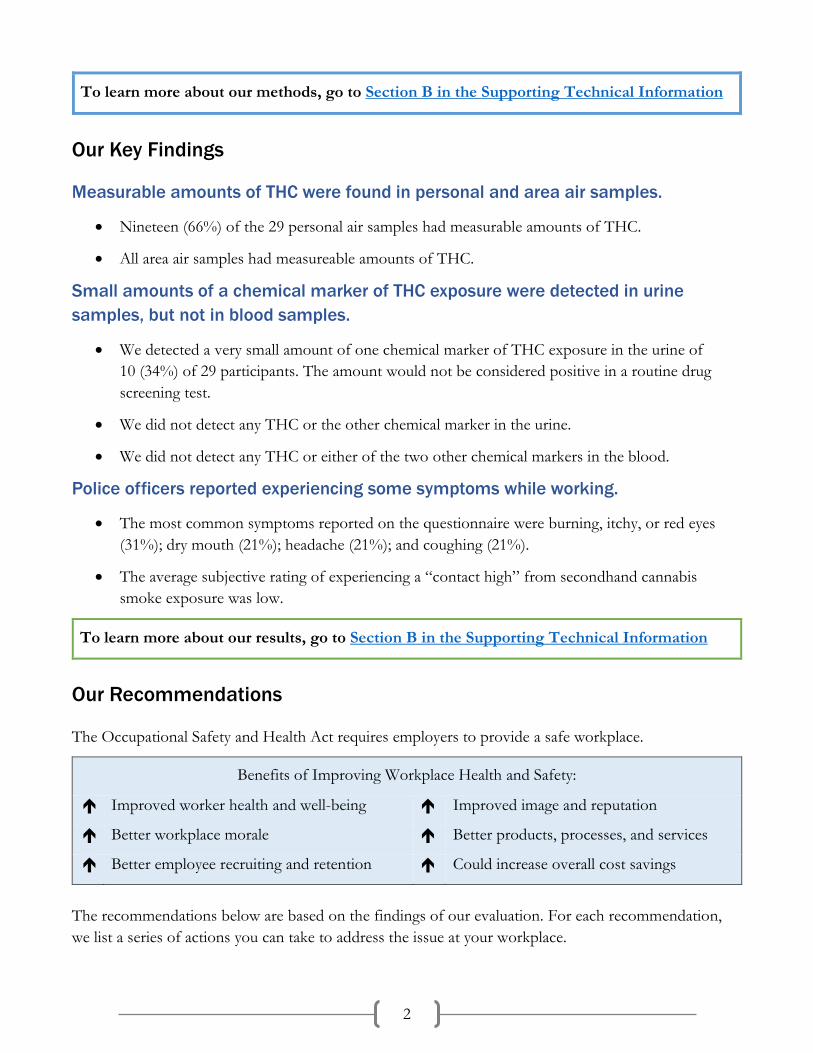
Measurable amounts of THC were found in personal and area air samples.
• Nineteen (66%) of the 29 personal air samples had measurable amounts of THC.
• All area air samples had measureable amounts of THC.
Small amounts of a chemical marker of THC exposure were detected in urine samples, but not in blood samples.
• We detected a very small amount of one chemical marker of THC exposure in the urine of 10 (34%) of 29 participants. The amount would not be considered positive in a routine drug screening test.
• We did not detect any THC or the other chemical marker in the urine.
• We did not detect any THC or either of the two other chemical markers in the blood.
Police officers reported experiencing some symptoms while working.
• The most common symptoms reported on the questionnaire were burning, itchy, or red eyes (31%); dry mouth (21%); headache (21%); and coughing (21%).
• The average subjective rating of experiencing a “contact high” from secondhand cannabis smoke exposure was low.
To learn more about our results, go to Section B in the Supporting Technical Information
Our Recommendations
The Occupational Safety and Health Act requires employers to provide a safe workplace.
Benefits of Improving Workplace Health and Safety:
Improved worker health and well-being Improved image and reputation
Better workplace morale Better products, processes, and services
Better employee recruiting and retention Could increase overall cost savings
The recommendations below are based on the findings of our evaluation. For each recommendation, we list a series of actions you can take to address the issue at your workplace.

3
We encourage the employer to use a health and safety committee to discuss our recommendations and develop an action plan. Both employee representatives and management representatives should be included on the committee. Helpful guidance can be found in Recommended Practices for Safety and Health Programs at https://www.osha.gov/shpguidelines/index.html.
Recommendation 1: Encourage police officers to report to their supervisors any symptoms they believe result from secondhand cannabis smoke exposure.
Why? The Police Department can periodically review this information to help determine whether changes in current procedures are needed. They can use this information to potentially identify trends affecting any associated health effects due to secondhand cannabis smoke exposure.
How? At your workplace, we recommend these specific actions:
Emphasize to police officers that reporting possible symptoms contributes to a healthy and safe workplace.
Recommendation 2: Assign police officers who report that they are bothered by secondhand cannabis smoke to a work location where potential exposure is believed to be relatively low or nonexistent.
Why? Individuals differ in their sensitivity and tolerance to secondhand cannabis smoke exposure. What may impact one person may have no effect on others. This variation in people can guide task/location assignments to minimize police officers’ exposures who report sensitivity to the smoke.
How? At your workplace, we recommend these specific actions:
Ask police officers if they are typically bothered by secondhand cannabis smoke exposure, and use this information when assigning them to locations during events.

Supporting Technical Information
Evaluation of Police Officers’ Exposure to Secondhand Cannabis Smoke at Open-air Stadium Events
HHE Report No. 2017-0174-3335
March 2019

A-1
Section A: Workplace Information
Venue
The two concerts were held on consecutive days in July 2018. Police officers who participated in this health hazard evaluation (HHE) worked in areas inside and around the university’s football stadium. The stadium is an open-air venue with a seating capacity of approximately 53,600. Police officers were assigned to locations and patrolled on foot, bicycles, and in small vehicles.
Employee Information
Because of the large size of the concert events, multiple agencies joined forces to provide security, including the university police department, the city police, and the county sheriffs’ offices. This is typical of large-scale events. On the first day, 93 officers worked security, while on the second day, there were 83 officers. For each day, all officers were invited to participate in the HHE. On the second day, we encouraged officers to participate who either did not work on Day 1 or who worked but did not participate in the HHE. No police officers participated in the evaluation on both days.
On the second day, two employees from the university’s athletics department participated who were not police officers, but assisted with security functions during the concert as needed. In total, 29 officers participated in our HHE over the two-day period, 14 officers on the first day and 15 officers on the second day.
Most (86%) participants were male, with a median age of 39 years (range 23–64 years) and a median length of tenure in law enforcement of 10 years (n = 25; range < 1–41 years). Most police officers were on duty from approximately 3:00 p.m.–11:30 p.m.

B-1
Section B: Methods, Results, and Discussion
The objectives of this evaluation were to 1. Measure the concentrations of secondhand cannabis smoke in the stadium using personal air
and environmental (area) sampling methods. 2. Determine if exposure to secondhand cannabis smoke results in THC and its chemical markers
(metabolites) being present in police officers’ urine and/or blood plasma. 3. Describe health symptoms reported by police officers after potential exposure to secondhand
cannabis smoke. 4. Provide recommendations to improve work organization factors to limit officers’ potential
exposure to THC while working.
Methods: Personal and Area Air Sampling
Personal Air Sampling We used an internally-developed air sampling and analysis method to measure THC on all air samples. Each officers’ breathing zone was sampled using a belt-mounted personal sampling pump pulling air at a flow rate of 3 liters per minute across a 37-millimeter polytetrafluoroethylene filter cassette. The THC was then extracted from each filter cassette using 2 milliliters (mL) of a solvent made of 80% acetonitrile and 20% water. Each sample was quantified using high-performance liquid chromatography and an ultraviolet light detector. We submitted field blank cassettes, which were handled, shipped, and analyzed along with all other samples, for sampling and analysis quality control. None of the analyzed field blank samples contained THC (< 50 nanograms [ng] per field blank).
Area Air Sampling A stationary, full-shift area air sample was collected at each of the following locations over the 2 days:
• The right side of the main stage.
• The left side of the main stage.
• The sound stage located on the field level, in the center and in front of the main stage.
• The field house: this was an enclosed structure on the upper level of the west side of the stadium, adjacent to the plaza, which was used for vendor displays and food and beverage sales. It had garage-style doors at each end that were kept open to provide natural ventilation. Although it had a heating and cooling system for climate control, no mechanical ventilation occurred during the event.
Results: Personal and Area Air Sampling
Personal Air Sampling A total of 29 full-shift personal air samples were collected across the 2 days (Table C1). Nineteen of these had measureable amounts of THC, while 10 samples were considered not detected (ND) because they were below the minimum detectable concentration (MDC) of 40 nanograms per cubic meter

B-2
(ng/m3) of air. On Day 1, THC concentrations ranged from ND to 330 ng/m3, while on Day 2, concentrations ranged from ND to 290 ng/m3.
On Day 1, the highest concentrations were measured on staff who worked at the east stadium gates and on the field level. On Day 2, the highest concentrations of THC were found on air samples from staff working in the plaza and the field house (220 to 290 ng/m3) as well as on the field level (140 ng/m3). The THC concentrations for staff working at other locations, on both days, were below the MDC. We did not compare air sampling results to any occupational exposure limits (OELs) set by the Occupational Safety and Health Administration (OSHA), NIOSH, or the American Conference of Governmental Industrial Hygienists (ACGIH) because none exist.
Area Air Sampling All area air sampling results showed measureable air concentrations of THC. These ranged from 53 to 390 ng/m3 on Day 1 and 150 to 480 ng/m3 on Day 2 (Table C2). The sound stage had the highest area air concentration measured on Day 1 (390 ng/m3), and the sample inside the field house had the highest (480 ng/m3) on Day 2.
Methods: Biological Testing
Urine Samples We collected urine in sterile polypropylene specimen containers, immediately transferring 4 mL into silanized glass vials to measure for THC and its metabolites. We then transferred 1.5 mL into 2 mL cryovials to measure creatinine levels. The vials were frozen on dry ice and shipped to the National Center for Environmental Health’s (NCEH) Tobacco and Volatiles Branch laboratory. This NCEH laboratory used an ultra-high performance liquid chromatography coupled with tandem mass spectrometry and positive electrospray ionization mode to measure the levels of the psychoactive ingredient of cannabis, THC, and two metabolites that are chemical markers of exposure: 11-nor-delta-9-tetrahydrocannabinol-9-carboxylic acid (THC-COOH) and 11-nor-hydroxy-delta-9-tetrahydrocannabinol (OH-THC) [Wei et al. 2015]. The limits of detection for these urine analyses were 0.005 nanograms per milliliter (ng/mL) for THC, 0.015 ng/mL for THC-COOH, and 0.017 ng/mL for OH-THC.
Although we could not compare urine sample results to any OELs, we did compare urine results to standard workplace cannabis screening (50 ng/mL) and confirmation (15 ng/mL) thresholds [Swotinsky 2015]. The screening threshold is less specific and uses an immunoassay method to identify a broad group of THC and its metabolites. If a urine sample exceeds the screening threshold, it is re-analyzed using a gas chromatography-mass spectrometry test that specifically measures the level of THC-COOH [Swotinsky 2015]. These threshold values are the minimum concentrations that must be present in a urine specimen for it to be considered a positive result. Urine thresholds are used as markers of exposure and not as markers of health effects.
Urine specimens were also analyzed for creatinine, which is an indicator of the degree of urine dilution. All urine samples were creatinine-corrected to measure changes in urine concentration over the shift. We then calculated the change of THC-COOH concentration measured in the urine from preshift to postshift to determine if THC-COOH levels increased, decreased, or remained the same across a shift.
B-3
Blood Samples Each blood sample was drawn into a 6-mL lavender top ethylenediaminetetraacetic acid (EDTA) tube and centrifuged to separate the plasma from the other blood constituents. From each sample, 1.5 mL of plasma was removed and placed into a separate cryovial. These blood plasma samples were then frozen on dry ice and shipped to a contract laboratory that used high performance liquid chromatography coupled with mass spectrometry to detect THC, THC-COOH, and OH-THC. The limits of detection for the blood plasma analyses were 0.5 ng/mL for THC, 5.0 ng/mL for THC-COOH, and 1.0 ng/mL for OH-THC.
We compared blood plasma results to a threshold used by some law enforcement agencies during for cause (reasonable suspicion) drug testing, which is 5 ng/mL of THC in the whole blood [Governors Highway Safety Association, no date]. We could not compare blood results to any OELs because none exist. Like urine, blood thresholds are generally used as markers of firsthand exposure. However, a recent study by Cone et al. [2015b] showed that secondhand cannabis exposures may result in quantifiable blood THC levels.
Results: Biological Testing
Fourteen individuals participated in biological (blood plasma/urine) testing on Day 1 and 15 on Day 2, leading to a total of 58 urine samples and 29 blood plasma samples.
Urine Samples We did not detect THC or OH-THC in any of the 58 urine samples. However, we did detect small amounts of THC-COOH in the urine of some individuals. A summary of the urine sampling results for raw (creatinine uncorrected) THC-COOH values is shown in Table C3, and the creatinine-corrected results are shown in Table C4. We found detectable THC-COOH (all < 1.0 ng/mL) in 15 of 58 (26%) urine samples (these 15 samples were among 10 individuals). All THC-COOH levels were well below any screening (50 ng/mL) or confirmation (15 ng/mL) thresholds used for workplace drug testing. We detected levels of THC-COOH in the urine more frequently in samples collected on Day 2 (14 of 15 detectable results from 9 participants) than on Day 1.
Nearly all individuals (90%) with detectable levels of THC-COOH in their urine had levels that increased across their work shift. These across-shift increases were small, ranging from less than 0.001 to 0.082 nanogram per milligram (ng/mg) of creatinine.
Blood Samples We did not detect THC, THC-COOH, or OH-THC in any of the blood plasma samples.
Methods: Medical Questionnaire
Participants completed a postconcert questionnaire asking about demographic information and whether (yes, no, or unsure) they experienced any symptoms or sensations consistent with cannabis intoxication during their work shift [APA 2013; DEA 2017; NIDA 2018].
We asked participants, “On a scale from 0 (not at all) to 10 (very much), how would you rate your perception of experiencing a ‘contact high’ from exposure to secondhand cannabis smoke during tonight’s concert?” Responses of 0–3 indicated a low perception of cannabis intoxication, 4–6 indicated

B-4
a moderate perception of cannabis intoxication, and scores of 7 or greater indicated a high perception of cannabis intoxication.
We also asked participants to rate their perceived level of secondhand cannabis smoke exposure during the past 30 days (none, mild, moderate, or severe) and whether they lived with a cannabis user (yes/no).
Results: Medical Questionnaire
Twenty-nine questionnaires were completed and analyzed. Table C5 shows the frequency of responses to whether the participants perceived experiencing any symptoms or sensations of cannabis intoxication during their work shift. The most commonly reported symptoms were burning, itchy, or red eyes (31%); dry mouth (21%); headache (21%); and coughing due to lung irritation (21%).
The average rating of perceived cannabis intoxication was 1.6 (range 0–9), indicating low perceptions by participants. On the basis of individual perceived cannabis intoxication ratings, 24 (83%) indicated a low level of perceived cannabis intoxication, 4 (14%) indicated a moderate level of perceived cannabis intoxication, and 1 (3%) indicated a high level of perceived cannabis intoxication.
In terms of past potential exposure to secondhand cannabis smoke, 66% (n = 19) of participants reported no exposure to secondhand cannabis, and 34% (n = 10) reported mild exposure to secondhand cannabis smoke in the past 30 days. No participant reported moderate or severe secondhand exposure in the past 30 days. One participant reported living with a regular cannabis user.
Discussion
In both personal and area air results, we measured higher levels of THC in some areas of the stadium compared with other areas. For example, personal THC air exposures to officers working around the east gates, the field house, and the field level areas were generally higher than those working in the vendor area, the main gate, bike patrol, backstage, and headquarters (a building located across the street from the stadium), among others. However, these differences varied from Day 1 to Day 2, most likely due to the amount of smoking in the area, and the magnitude and direction of ambient wind currents.
We examined the air sampling and biological data to determine whether any patterns emerged, but none were found. For example, there were instances where officers were working in areas where THC was detected in the air, but the officers’ blood plasma and urine results did not contain the THC metabolite THC-COOH. Conversely, in stadium areas where THC was not detected in the air, urine results from some officers showed detectable amounts of this THC metabolite.
The pharmacokinetics of cannabis and its metabolites are complex. The psychoactive component of cannabis smoke, THC, is rapidly absorbed in the lungs after exposure and is distributed throughout the body. THC is fat soluble and enters into fat (adipose) tissue, the brain, the liver, and the spleen. In the liver, THC is metabolized to OH-THC, which is subsequently metabolized to THC-COOH. THC that has been distributed to tissues other than the liver is slowly released back into the blood, where it circulates and is ultimately metabolized and excreted in the feces or urine. THC-COOH can be reliably measured in the urine during excretion to determine if an individual has recently used or been exposed to cannabis [Musshoff and Madea 2006].
B-5
The slow release, recurrent metabolism, and long half-life of THC-COOH (approximately 140 hours) allows for THC and its metabolites to be dependably detected by workplace screening tests for approximately a 30-day period. Some officers that participated on Day 2 of our evaluation had worked the concert the day before. These officers could have been exposed to secondhand cannabis smoke on the first day that could have resulted in a detectable THC-COOH level in the urine on the second day. This may have contributed to a larger number of officers having detectable levels of THC-COOH in the urine on Day 2 (9) than Day 1 (1).
We found that nearly all individuals (9 of 10) with detectable levels of THC-COOH in urine had creatinine-corrected levels that increased across the shift. Such a finding indicates that exposure was occurring during these concerts. However, the amount of cannabis exposure was very small and would not be considered positive on typical workplace drug screening tests.
Historically, studies in the 1980s showed that it was highly unlikely for a nonsmoking person to unintentionally inhale enough secondhand cannabis smoke to cause a positive drug test [Cone et al. 1987; Law et al. 1984; Perez-Reyes et al. 1983]. These studies characterized exposures to secondhand cannabis smoke in laboratory settings using low-potency cannabis strains (less than 3% THC), and often in extreme circumstances (e.g., a small, unventilated room where 16 cannabis cigarettes were smoked). Currently, cannabis strains circulating in the United States routinely exceed 10% THC [ElSohly et al. 2016].
Cone et al. [2015a] identified one individual who exceeded the screening threshold of 50 ng/mL THC-COOH for urine, thus confirming the possibility that secondhand cannabis smoke exposure can result in levels exceeding workplace screening tests. Researchers have begun to characterize whether exposure to secondhand cannabis smoke with a higher concentration of THC results in higher levels of THC, THC-COOH, and OH-THC in blood and urine [Cone et al. 2015a,b; Herrmann et al. 2015]. However, these studies continue to evaluate exposures in a controlled, laboratory setting, which may not be representative of typical workplace environments. Thus, we sought to characterize if exposure to potentially higher THC concentrations in a workplace environment could result in measureable levels of THC in the urine and blood plasma.
To evaluate acute or recent exposures and possible impairment, testing of whole blood or blood plasma is preferred over urine testing. Whole blood testing is more commonly used than blood plasma in workplace screening tests. We elected to test the blood plasma because the method can reliably detect levels that are half that which is present in whole blood, thereby making it a more sensitive method. Despite using the most sensitive method, we did not identify any samples that contained THC, OH-THC, or THC-COOH in the blood plasma.
The identification of low levels of THC-COOH in the urine and the absence of all THC constituents in the blood plasma is likely due to the difference in the limits of detection for each test. Detectable levels in the blood plasma were considerably higher than those in the urine, with urine results detecting metabolites at levels at or below 0.017 ng/mL. For example, the limit of detection for THC-COOH in the blood plasma samples was over 300 times higher (5 ng/mL) than it was for urine testing (0.015 ng/mL). Regardless, the limits of detection for both urine and blood plasma were well below

B-6
drug screening thresholds and would detect levels approaching the “positive” cut-off values used during current drug testing protocols.
Some scientists and legal authorities associate blood THC levels with impairment. For example, law enforcement agencies in Colorado, Montana, and Washington use a whole blood level of 5.0 ng/mL as evidence that a driver is intoxicated from cannabis use [Governors Highway Safety Association, no date]. Our blood plasma testing revealed that on the days of our evaluation, participant levels did not approach this threshold. Therefore, they were not exposed to THC at concentrations associated with impairment. This finding is supported by low levels of perceived “contact high” and limited symptom reporting during our evaluation.
Limitations
This evaluation was subject to the following limitations:
• We were unable to determine exact times during the concert that officers experienced cannabis exposure. Because THC in the blood plasma is highest within minutes of an exposure while urine levels peak within hours of exposure, it is possible that an exposure early in the concert would decline in the plasma matrix, but would not result in sufficient metabolism of THC to be detected in the urine.
• The questionnaire responses were based on self-reporting of subjective perceptions of experiencing a “contact high” or other symptoms consistent with exposure to secondhand cannabis smoke. Because the questionnaire was anonymous, we were unable to clarify any responses or ask follow-up questions once the responses were analyzed. For example, we were not able to follow up with one participant who reported a high level (9 on a scale of 10) of perceived cannabis “contact high,” despite discordant responses to other questionnaire items and contradictory air and biological results, all of which did not detect any THC. Also, while the symptoms reported are associated with cannabis intoxication, they are non-specific and may be attributed to other factors.
• We had 15%–18% of on-duty police officers participate in this HHE. This limited participation restricts how generalizable our findings are to the entire group of police officers working at this or other similar events.
Although responses to the questionnaire were anonymous, because the participants were police officers, they may have felt the need to respond to the questionnaire items in a socially desirable manner to avoid any questioning of their fitness for duty.
Conclusions
Exposure to THC in air did occur for some officers, but the magnitude of these exposures were very low. Similarly, very low levels of THC-COOH was found in the urine of some officers. To our knowledge, this is the first evaluation examining occupational exposure to secondhand cannabis smoke in a real-world, open-air setting. Given this scenario, coupled with the absence of OELs, drawing definitive conclusions about exposure and biomonitoring data are challenging.

C-1
Section C: Tables
Table C1. Results of full-shift* personal air samples for THC Participant’s work location Concentration (ng/m3) Day 1 East gates 2,5,6 300 East gates 2,5,6 180 East gates 7,8,9 240 Southwest gates 2,3 [51]† Field level 330 290 [94] [81] Plaza/Field house ND‡ ND Roving outside stadium, in vendor area [49] Roving west side of stadium ND Bike patrol outside stadium ND Directed operations (Headquarters building) ND Day 2 Plaza/Field house 220 250 Field level, gate 13 290 Field house, gate 6 [120] Field house, gate 6 [90] Field house, gate 6 [64] Field level [99] 140 Roving east side of stadium, rooftop [41] Roving field level, concourse [92] Bike patrol outside stadium ND East ramp behind stage (fixed location) ND Backstage ND Main entry gate ND Directed operations (Headquarters building) ND Minimum detectable concentration (MDC)§ 40 Minimum quantifiable concentration (MQC)¶ 140 *Sampling times ranged from 343 minutes to 501 minutes. †Values in brackets were between the MDC and MQC. More uncertainty is associated with these values. ‡ND = none detected, below the MDC of 40 ng/m3. §The MDC was calculated by dividing the analytical limit of detection of 50 ng per sample by an average air sample volume of 1.25 m3. ¶The MQC was calculated by dividing the analytical limit of quantification of 170 ng per sample by an average air sample volume of 1.25 m3.

C-2
Table C2. Results of full-shift* area air samples for THC, in ng/m3 Sample location Concentration, Day 1 Concentration, Day 2 Main stage, left 180 150 Main stage, right [53]† 260 Sound stage 390 190 Field house 170 480 Minimum detectable concentration (MDC)‡ 40 Minimum quantifiable concentration (MQC)§ 140 *Sampling times ranged from 260 minutes to 397 minutes. †Values in brackets were between the MDC and MQC. More uncertainty is associated with these values. ‡The MDC was calculated by dividing the analytical limit of detection of 50 ng per sample by an average air sample volume of 1.25 m3. §The MQC was calculated by dividing the analytical limit of quantification of 170 ng per sample by an average air sample volume of 1.25 m3.

C-3
Table C3. Creatinine-uncorrected concentrations of THC-COOH in urine samples, by day THC-COOH concentration
in ng/mL (range) Percent detected (%)
Day 1 (n = 28) ND*–0.015 3.5% Preconcert urine (n = 14) ND 0% Postconcert urine (n = 14) ND–0.015 7%
Day 2 (n = 30) ND–0.92 47% Preconcert urine (n = 15) ND–0.92 33% Postconcert urine (n = 15) ND–0.70 60%
Total (n = 58) ND–0.92 26% *ND = not detected, below the limit of detection of 0.015 ng/mL.

C-4
Table C4. Creatinine-corrected concentrations of THC-COOH in urine samples, by day THC-COOH concentration
in ng/mg creatinine (range) Day 1 (n = 28) ND*–0.019
Preconcert urine (n = 14) ND Postconcert urine (n = 14) ND–0.019
Day 2 (n = 30) ND–0.44 Preconcert urine (n = 15) ND–0.44 Postconcert urine (n = 15) ND–0.22
Total (n = 58) ND–0.44 *ND = not detected, below the limits of detection of 0.015 ng/mL for THC-COOH and 1.1 mg/deciliter for creatinine.

C-5
Table C5. Self-reported symptoms and sensations associated with cannabis intoxication (n = 29) Symptom/Sensation* % Yes (n) % No (n) % Not sure (n) Burning, itchy, or red eyes 31 (9) 69 (20) 0 (0) Dry mouth† 21 (6) 76 (22) 0 (0) Headache† 21 (6) 75 (21) 3 (1) Coughing due to lung irritation 21 (6) 79 (23) 0 (0) Increased appetite 14 (4) 83 (24) 3 (1) Rapid heartbeat 10 (3) 86 (25) 3 (1) Euphoria or feeling “high” 3 (1) 93 (27) 3 (1) Anxiety 3 (1) 97 (28) 0 (0) Sensation of slowed time 3 (1) 97 (28) 0 (0) Lightheadedness 3 (1) 97 (28) 0 (0) *We asked about additional symptoms/sensations, which were not reported by any officers. These included impaired coordination, impaired judgement, social withdrawal, altered senses, inappropriate or excessive laughter, feelings of superiority or invincibility, feeling “sluggish” or lazy, impaired short-term memory, difficulty with thinking and problem-solving, mood changes, paranoia, increased sociability, shallow breathing, cold or hot hands and/or feet, increased introspection or self-reflection, slurred speech, feeling a loss of control or panic, and confusion. †n = 28

D-1
Section D: References
Exposure and Health Effects of Cannabis Smoke
APA [2013]. Diagnostic and statistical manual of mental disorders. 5th ed. Arlington, VA: American Psychiatric Association, http://dsm.psychiatryonline.org/doi/book/10.1176/appi.books.9780890425596.
Cone EJ, Bigelow GE, Herrmann ES, Mitchell JM, LoDico C, Flegel R, Vandrey R [2015a]. Non-smoker exposure to secondhand cannabis smoke. I. Urine screening and confirmation results. J Anal Toxicol 39(1):1–12, https://doi.org/10.1093/jat/bku116.
Cone EJ, Bigelow GE, Herrmann ES, Mitchell JM, LoDico C, Flegel R, Vandrey R [2015b]. Nonsmoker exposure to secondhand cannabis smoke. III. Oral fluid and blood drug concentrations and corresponding subjective effects. J Anal Toxicol 39(7):497–509, http://doi.org/10.1093/jat/bkv070.
Cone EJ, Johnson RE, Darwin WD, Yousefnejad D, Mell LD, Paul BD, Mitchell J [1987]. Passive inhalation of marijuana smoke: urinalysis and room air levels of delta-9-tetrahydrocannabinol. J Anal Toxicol 11(3):89–96, https://doi.org/10.1093/jat/11.3.89.
DEA [2017]. Drugs of abuse: a DEA resource guide. Washington, D.C.: U.S. Department of Justice, U.S. Drug Enforcement Administration, https://www.dea.gov/documents/2017/06/15/drugs-abuse.
ElSohly MA, Mehmedic Z, Foster S, Gon C, Chandra S, Church JC [2016]. Changes in cannabis potency over the last two decades (1995–2014): analysis of current data in the United States. Biol Psychiatry 79(7):613–619, https://dx.doi.org/10.1016/j.biopsych.2016.01.004.
Governors Highway Safety Association [no date]. Drug impaired driving. Date accessed: December 11, 2018, https://www.ghsa.org/state-laws/issues/drug%20impaired%20driving.
Herrmann ES, Cone EJ, Mitchell JM, Bigelow GE, LoDico C, Flegel R, Vandrey R [2015]. Non-smoker exposure to secondhand cannabis smoke II: effect of room ventilation on the physiological, subjective, and behavioral/cognitive effects. Drug Alcohol Depend 151:194–202, https://dx.doi.org/10.1016/j.drugalcdep.2015.03.019.
Law B, Mason PA, Moffat AC, King LJ, Marks V [1984]. Passive inhalation of cannabis smoke. J Pharm Pharmacol 36(9):578–581, http://dx.doi.org/10.1111/j.2042-7158.1984.tb04901.x.
Musshoff F, Madea B [2006]. Review of biological matrices (urine, blood, hair) as indicators of recent or ongoing cannabis use. Ther Drug Monit 28(2):155–163, http://dx.doi.org/10.1097/01.ftd.0000197091.07807.22.
NIDA [2018]. Drug facts: marijuana. Rockville, MD: U.S. Department of Health and Human Services, National Institutes of Health, National Institute on Drug Abuse, https://www.drugabuse.gov/publications/drugfacts/marijuana.

D-2
Perez-Reyes M, Di Guiseppi S, Mason AP, Davis KH [1983]. Passive inhalation of marijuana smoke and urinary excretion of cannabinoids. Clin Pharmacol Ther 34(1):36–41, http://dx.doi.org/10.1038/clpt.1983.125.
Swotinsky RB [2015]. The medical review officer’s manual: MROCC’s guide to drug testing. 5th ed. Beverly Farms, MA: OEM Press.
Wei B, Wang L, Blount BC [2015]. Analysis of cannabinoids and their metabolites in human urine. Anal Chem 87(20):10183–10187, https://dx.doi.org/10.1021%2Facs.analchem.5b02603.

This page left intentionally blank
Delivering on the Nation’s promise: Promoting productive workplaces through safety and health research
Get More Information
Find NIOSH products and get answers to workplace safety and health questions:
1-800-CDC-INFO (1-800-232-4636) | TTY: 1-888-232-6348 CDC/NIOSH INFO: cdc.gov/info |cdc.gov/niosh Monthly NIOSH eNews: cdc.gov/niosh/eNews