heta 98–0149–2734 u. s. army corps of engineers libby … · heta 98–0149–2734 u. s. army...
TRANSCRIPT

HETA 98–0149–2734U. S. Army Corps of Engineers
Libby Dam ProjectLibby, Montana
Randy L. Tubbs, Ph.D.
This Health Hazard Evaluation (HHE) report and any recommendations made herein are for the specific facility evaluated and may not be universally applicable. Any recommendations made are not to be considered as final statements of NIOSH policy or of any agency or individual involved. Additional HHE reports are available at http://www.cdc.gov/niosh/hhe/reports
This Health Hazard Evaluation (HHE) report and any recommendations made herein are for the specific facility evaluated and may not be universally applicable. Any recommendations made are not to be considered as final statements of NIOSH policy or of any agency or individual involved. Additional HHE reports are available at http://www.cdc.gov/niosh/hhe/reports
This Health Hazard Evaluation (HHE) report and any recommendations made herein are for the specific facility evaluated and may not be universally applicable. Any recommendations made are not to be considered as final statements of NIOSH policy or of any agency or individual involved. Additional HHE reports are available at http://www.cdc.gov/niosh/hhe/reports
This Health Hazard Evaluation (HHE) report and any recommendations made herein are for the specific facility evaluated and may not be universally applicable. Any recommendations made are not to be considered as final statements of NIOSH policy or of any agency or individual involved.
This Health Hazard Evaluation (HHE) report and any recommendations made herein are for the specific facility evaluated and may not be universally applicable. Any recommendations made are not to be considered as final statements of NIOSH policy or of any agency or individual involved. Additional HHE reports are available at http://www.cdc.gov/niosh/hhe/reports
applicable. Any recommendations made are not to be considered as final statements of NIOSH policy or of any agency or individual involved. Additional HHE reports are available at http://www.cdc.gov/niosh/hhe/reports

ii
PREFACEThe Hazard Evaluations and Technical Assistance Branch of NIOSH conducts field investigationsof possible health hazards in the workplace. These investigations are conducted under the authorityof Section 20(a)(6) of the Occupational Safety and Health Act of 1970, 29 U.S.C. 669(a)(6) whichauthorizes the Secretary of Health and Human Services, following a written request from anyemployer or authorized representative of employees, to determine whether any substance normallyfound in the place of employment has potentially toxic effects in such concentrations as used orfound.
The Hazard Evaluations and Technical Assistance Branch also provides, upon request, technical andconsultative assistance to Federal, State, and local agencies; labor; industry; and other groups orindividuals to control occupational health hazards and to prevent related trauma and disease.Mention of company names or products does not constitute endorsement by the National Institutefor Occupational Safety and Health.
ACKNOWLEDGMENTS AND AVAILABILITY OF REPORTThis report was prepared by Randy L. Tubbs, Ph.D., of the Hazard Evaluations and TechnicalAssistance Branch, Division of Surveillance, Hazard Evaluations and Field Studies (DSHEFS).Desktop publishing was performed by Nichole Herbert. Review and preparation for printing wasperformed by Penny Arthur.
Copies of this report have been sent to employee and management representatives at Libby Dam andthe OSHA Regional Office. This report is not copyrighted and may be freely reproduced. Singlecopies of this report will be available for a period of three years from the date of this report. Toexpedite your request, include a self–addressed mailing label along with your written request to:
NIOSH Publications Office4676 Columbia ParkwayCincinnati, Ohio 45226
800–356–4674
After this time, copies may be purchased from the National Technical Information Service (NTIS)at 5825 Port Royal Road, Springfield, Virginia 22161. Information regarding the NTIS stocknumber may be obtained from the NIOSH Publications Office at the Cincinnati address.
For the purpose of informing affected employees, copies of this report shall beposted by the employer in a prominent place accessible to the employees for aperiod of 30 calendar days.

iii
National Institute for Occupational Safety and Health(NIOSH) Evaluation of Noise Exposure and Hearing Loss at
Libby Dam Summary of Findings
What NIOSH Did# Measured employees personal noise
exposures
# Measured low pitched sounds in thepowerhouse
# Reviewed program’s hearing test results
# Evaluated the overall hearing conservationprogram at the facility
What NIOSH Found
# Personal noise exposures did not exceedOSHA regulations
# Area noise measurements did not findhazardous levels of low pitched sounds
# There may be some building vibrations thatemployees feel
# The hearing test program is flawed
# The “Draft Hearing Protection Plan” is agood beginning for the project’s hearingconservation program
What Libby Dam ProjectManagers Can Do
# Make sure the provider of the hearing testsfollows professional guidelines
# Continue to meet with the employees anddevelop the hearing protection plan
# The safety office should continue to log thenoise measurements made in the powerhouse
# Move all office and control room operationsto the new building
What the Libby Dam ProjectEmployees Can Do
# Wear hearing protection devices in allrequired areas all of the time
# Tell management any problems they arehaving with the hearing protection plan. Also, point out the good things about theplan.
# Use the new lunchroom as a break area to beaway from noise
# Use good hearing conservation judgmentaway from the job
CDCCENTERS FOR DISEASE CONTROL
AND PREVENTION
What To Do For More Information:We encourage you to read the full report. If you
would like a copy, either ask your health andsafety representative to make you a copy or call
1–513–841–4252 and ask for HETA Report # 98–0149–2734

iv
Health Hazard Evaluation Report 98–0149–2734U. S. Army Corps of Engineers
Libby Dam ProjectLibby, Montana
April 1999
Randy L. Tubbs, Ph.D.
SUMMARYThe U.S. Army Corps of Engineers requested that NIOSH conduct a health hazard evaluation at theLibby Dam project in Libby, Montana. The management and employees of this hydroelectricpowerhouse were concerned about low frequency noise exposures to the employees working in thefacility. A site visit was conducted by a NIOSH investigator on May 20–21, 1998, where area andpersonal noise measurements were obtained. The audiometric examinations of the employees werealso provided to the NIOSH investigator for analysis.
The full–shift, personal noise exposure measurements collected from five Libby Dam employees didnot exceed any OSHA criteria for noise. The NIOSH criterion was equaled in two of the fivesamples. The area sound measurements revealed a predominant sound energy in the 125 Hzthird–octave band that is most likely the result of the generation and distribution of electricity. Nointense sound energy was measured in the very low (less than 20 Hz) frequency range. There wassome indication that structure–borne vibrational energy may be perceived by workers, particularlythose who sit in front of computers at a desk. The analysis of the audiometric data collected fromthe employees showed that the hearing testing program was extremely variable, making it difficultto use these data to pin–point deficiencies in the hearing conservation program at this project.
The findings collected in this evaluation are inconclusive as to whether the employees aresubjected to hazardous levels of noise in their jobs. The OSHA limits for occupational noiseexposure were not exceeded in the five employees surveyed. The analysis of theaudiometric data does, however, show many deficiencies are present in this component ofthe facility’s hearing conservation program. Recommendations are made that will improvethe audiometric testing program and the rest of the project’s hearing conservation program.
Keywords: SIC 4911 (Electric Services), hydroelectric power plant, noise, structure–borne vibration,dosimetry, spectral analysis, audiometry

TABLE OF CONTENTS
Preface . . . . . . . . . . . . . . . . . . . . . . . . . . . . . . . . . . . . . . . . . . . . . . . . . . . . . . . . . . . . . . . . . . . . . . . . . . . . ii
Acknowledgments and Availability of Report . . . . . . . . . . . . . . . . . . . . . . . . . . . . . . . . . . . . . . . . . . . . . ii
Summary of Findings . . . . . . . . . . . . . . . . . . . . . . . . . . . . . . . . . . . . . . . . . . . . . . . . . . . . . . . . . . . . . . . . . iii
Summary . . . . . . . . . . . . . . . . . . . . . . . . . . . . . . . . . . . . . . . . . . . . . . . . . . . . . . . . . . . . . . . . . . . . . . . . . . iv
Introduction . . . . . . . . . . . . . . . . . . . . . . . . . . . . . . . . . . . . . . . . . . . . . . . . . . . . . . . . . . . . . . . . . . . . . . . . 1
Background . . . . . . . . . . . . . . . . . . . . . . . . . . . . . . . . . . . . . . . . . . . . . . . . . . . . . . . . . . . . . . . . . . . . . . . . 1
Methods . . . . . . . . . . . . . . . . . . . . . . . . . . . . . . . . . . . . . . . . . . . . . . . . . . . . . . . . . . . . . . . . . . . . . . . . . . . 1
Evaluation Criteria . . . . . . . . . . . . . . . . . . . . . . . . . . . . . . . . . . . . . . . . . . . . . . . . . . . . . . . . . . . . . . . . . . . 2Noise . . . . . . . . . . . . . . . . . . . . . . . . . . . . . . . . . . . . . . . . . . . . . . . . . . . . . . . . . . . . . . . . . . . . . . . . . . 2
Results . . . . . . . . . . . . . . . . . . . . . . . . . . . . . . . . . . . . . . . . . . . . . . . . . . . . . . . . . . . . . . . . . . . . . . . . . . . . 3
Discussion . . . . . . . . . . . . . . . . . . . . . . . . . . . . . . . . . . . . . . . . . . . . . . . . . . . . . . . . . . . . . . . . . . . . . . . . . 5
Conclusions . . . . . . . . . . . . . . . . . . . . . . . . . . . . . . . . . . . . . . . . . . . . . . . . . . . . . . . . . . . . . . . . . . . . . . . . 5
Recommendations . . . . . . . . . . . . . . . . . . . . . . . . . . . . . . . . . . . . . . . . . . . . . . . . . . . . . . . . . . . . . . . . . . . 6
References . . . . . . . . . . . . . . . . . . . . . . . . . . . . . . . . . . . . . . . . . . . . . . . . . . . . . . . . . . . . . . . . . . . . . . . . . 6
Health Hazard Evaluation Report No. 98–0149 Page 1
INTRODUCTIONThe National Institute for Occupational Safetyand Health (NIOSH) received a request fromthe U.S. Army Corps of Engineers, LibbyDam Project on March 16, 1998. The requestfor a health hazard evaluation (HHE) wasconcerned about noise and vibrationexposures to employees of the Libby Damhydroelectric power plant and the hearinglosses measured in them. Previousevaluations of the facility by the Region X’sFederal Occupational Health (FOH), U.S.Public Health Service found noise levels thatdid not explain the hearing loss exhibited bythe employees. However, FOH was unable tomeasure the noise spectrum of power plantoperations below 31.5 Hertz (HZ) and it wasthought that maybe the low frequency noiseexposures could possibly account for thehearing decrements. FOH personnelrecommended that NIOSH be consulted.
A NIOSH investigator visited the Libby Dampower plant on May 20–21, 1998. An initialwalk–through survey of the facility wasconducted on May 20, and full–shift noisedosimeter sampling and spectral noiseanalyses were completed on May 21, 1998.The NIOSH investigator requested the hearingtest results from employees at the Libby Damproject during the visit. The audiometric testsfrom 1977 to 1998 were sent to NIOSH inJune 1998.
BACKGROUNDLibby Dam spans the Kootenai River 17 milesupstream of Libby, Montana. The dam is astraight–axis, concrete gravity structure thatwas authorized by Congress in 1951.Construction by the U.S. Army Corps ofEngineers and their contractor began in 1966.The dam was finished in 1972 and thepowerhouse in 1976. The power plant has 5F r a n c i s t u r b i n e s t h a t g e n e r a t e120,000 kilowatts (kW) of electricity each.
The number of generators that are placed inservice depends on the amount of headwaterin the reservoir and how much water is neededdownstream of the dam. On the day of theNIOSH evaluation, four of the five turbineswere operational. Construction activities werepresent during the HHE with a new, separatecontrol room and office building being builtadjacent to the power plant. Libby Dam has32 permanent employees, of whom 23 work inthe powerhouse. Job classifications includeengineers, electricians, mechanics, controlroom operators, technicians, laborers, andadministrative personnel. Day shift personnelin the powerhouse normally work a 10–hourperiod.
Parts of a hearing conservation program havebeen in effect at Libby Dam for many years.Audiometric testing has been given toemployees since at least 1977. Hearingprotection devices have also been madeavailable to employees for several years. Aninitial writeup of a new hearing conservationprogram developed jointly by the employeesand management was given to the NIOSHinvestigator during the site visit.
METHODSQuest® Electronics Model M–27 NoiseLogging Dosimeters were worn by fiveemployees, selected because of their job titles,on March 21, 1998. The noise dosimeterswere attached to the wearer’s belt and a smallremote microphone was fastened to thewearer’s shirt at a point mid–way between theear and the outside of the employee’sshoulder. Because the employees remained atthe powerhouse during lunch, they were askedto wear the dosimeters throughout the day.One of the employees wearing a dosimetercarried a small notebook with him during theday and wrote down the times of major noiseevents so that the noise data could becorrelated to the particular event. At the endof the shift, the dosimeters were removed and

Page 2 Health Hazard Evaluation Report No. 98–0149
paused to stop data collection. Theinformation was downloaded to a personalcomputer for interpretation with QuestSuitefor Windows® computer software. Thedosimeters were calibrated before and after thework shift according to the manufacturer’sinstructions.
Real–time area noise sampling was conductedwith a Larson–Davis Laboratory Model2800 Real–Time Analyzer and aLarson–Davis Laboratory Model 2575 1"pressure response microphone. The analyzerallows for the analysis of noise into itsspectral components in a real–time mode. The1" diameter microphone has a frequencyresponse range (± 2 decibels [dB]) from 2.6Hz to 8 kilohertz ( kHz) that allows for theanalysis of low frequency sounds. Theone–third octave center frequency bands from2 Hz to 8 kHz were integrated for 60 secondsand stored in the analyzer. The analyzer wasmounted on a tripod placed at variouslocations in the powerhouse with themicrophone at approximately the level ofemployees’ ears if they had been in the area.Employees were generally not present whilesampling took place.
EVALUATION CRITERIAAs a guide to the evaluation of the hazardsposed by workplace exposures, NIOSH fieldstaff employ environmental evaluation criteriafor the assessment of a number of chemicaland physical agents. These criteria areintended to suggest levels of exposure towhich most workers may be exposed up to 10hours per day, 40 hours per week for aworking lifetime without experiencing adversehealth effects. It is, however, important tonote that not all workers will be protectedfrom adverse health effects even though theirexposures are maintained below these levels.A small percentage may experience adversehealth effects because of individualsusceptibility, a pre–existing medicalcondition, and/or a hypersensitivity (allergy).
In addition, some hazardous substances mayact in combination with other workplaceexposures, the general environment, or withmedications or personal habits of the workerto produce health effects even if theoccupational exposures are controlled at thelevel set by the criterion. These combinedeffects are often not considered in theevaluation criteria. Also, some substances areabsorbed by direct contact with the skin andmucous membranes, and thus potentiallyincrease the overall exposure. Finally,evaluation criteria may change over the yearsas new information on the toxic effects of anagent become available.
The primary sources of environmentalevaluation criteria for the workplace are: (1)NIOSH Recommended Exposure Limits(RELs),1 (2) the American Conference ofGovernmental Industrial Hygienists'(ACGIH®) Threshold Limit Values(TLVs®),2 and (3) the U.S. Department ofLabor, Occupational Safety and HealthAdministration (OSHA) Permissible ExposureLimits (PELs).3 NIOSH encouragesemployers to follow the OSHA limits, theNIOSH RELs, the ACGIH TLVs, orwhichever are the more protective criterion.The OSHA PELs reflect the feasibility ofcontrolling exposures in various industrieswhere the agents are used, whereas NIOSHRELs are based primarily on concerns relatingto the prevention of occupational disease. Itshould be noted when reviewing this reportthat employers are legally required to meetthose levels specified by an OSHA standard.
NoiseNoise–induced loss of hearing is anirreversible, sensorineural condition thatprogresses with exposure. Although hearingability declines with age (presbycusis) in allpopulations, exposure to noise produceshearing loss greater than that resulting fromthe natural aging process. This noise–inducedloss is caused by damage to nerve cells of the

Health Hazard Evaluation Report No. 98–0149 Page 3
inner ear (cochlea) and, unlike someconductive hearing disorders, cannot betreated medically.4 While loss of hearing mayresult from a single exposure to a very briefimpulse noise or explosion, such traumaticlosses are rare. In most cases, noise–inducedhearing loss is insidious. Typically, it beginsto develop at 4000 or 6000 Hz (the hearingrange is 20 Hz to 20000 Hz) and spreads tolower and higher frequencies. Often, materialimpairment has occurred before the conditionis clearly recognized. Such impairment isusually severe enough to permanently affect aperson's ability to hear and understand speechunder everyday conditions. Although theprimary frequencies of human speech rangefrom 200 Hz to 2000 Hz, research has shownthat the consonant sounds, which enablepeople to distinguish words such as "fish"from "fist," have still higher frequencycomponents.5
The A–weighted decibel [dB(A)] is thepreferred unit for measuring sound levels toassess worker noise exposures. The dB(A)scale is weighted to approximate the sensoryresponse of the human ear to soundfrequencies near the threshold of hearing. Thedecibel unit is dimensionless, and representsthe logarithmic relationship of the measuredsound pressure level to an arbitrary referencesound pressure (20 micropascals, the normalthreshold of human hearing at a frequency of1000 Hz). Decibel units are used because ofthe very large range of sound pressure levelswhich are audible to the human ear. Becausethe dB(A) scale is logarithmic, increases of 3dB(A), 10 dB(A), and 20 dB(A) represent adoubling, tenfold increase, and 100–foldincrease of sound energy, respectively. Itshould be noted that noise exposuresexpressed in decibels cannot be averaged bytaking the simple arithmetic mean.
The OSHA standard for occupationalexposure to noise (29 CFR 1910.95)6 specifiesa maximum PEL of 90 dB(A) for a duration of8 hours per day. The regulation, in calculating
the PEL, uses a 5 dB time/intensity tradingrelationship, or exchange rate. This meansthat a person may be exposed to noise levelsof 95 dB(A) for no more than 4 hours, to 100dB(A) for 2 hours, etc. Conversely, up to 16hours exposure to 85 dB(A) is allowed by thisexchange rate. The duration and sound levelintensities can be combined in order tocalculate a worker's daily noise dose accordingto the formula:
Dose = 100 X (C1/T1 + C2/T2 + ... + Cn/Tn),
where Cn indicates the total time of exposureat a specific noise level and Tn indicates thereference duration for that level as given inTable G–16a of the OSHA noise regulation.During any 24–hour period, a worker isallowed up to 100% of his daily noise dose.Doses greater than 100% are in excess of theOSHA PEL.
The OSHA regulation has an additional actionlevel (AL) of 85 dB(A); an employer shalladminister a continuing, effective hearingconservation program when the 8–hourtime–weighted average (TWA) value exceedsthe AL. The program must includemonitoring, employee notification,observation, audiometric testing, hearingprotectors, training, and record keeping. Allof these requirements are included in 29 CFR1910.95, paragraphs (c) through (o). Finally,the OSHA noise standard states that whenworkers are exposed to noise levels in excessof the OSHA PEL of 90 dB(A), feasibleengineering or administrative controls shall beimplemented to reduce the workers' exposurelevels.
NIOSH, in its Criteria for a RecommendedStandard,7 and the ACGIH,2 propose exposurecriteria of 85 dB(A) as a TWA for 8 hours, 5dB less than the OSHA standard. The criteriaalso use a more conservative 3 dBtime/intensity trading relationship incalculating exposure limits. Thus, a worker

Page 4 Health Hazard Evaluation Report No. 98–0149
can be exposed to 85 dB(A) for 8 hours, but tono more than 88 dB(A) for 4 hours or91 dB(A) for 2 hours.
RESULTSThe Quest dosimeters collect data in a mannerthat allows one to directly compare the noiselevels to the OSHA PEL and AL, and to theNIOSH REL, i.e., three different criteria aresimultaneously used in the calculation of theemployee’s noise dose. The OSHA criteriause a 90 dB(A) criterion and 5 dB exchangerate for both the PEL and AL. The differencebetween the two is the threshold levelemployed, with a 90 dB(A) threshold used forthe PEL and a 80 dB(A) threshold for the AL.The NIOSH criterion differs in that thecriterion is 85 dB(A), the threshold is 80dB(A) and it uses a 3 dB exchange rate.These threshold comparisons for the fiveemployees sampled during the evaluation areshown in Table 1. In no instance are theOSHA criteria exceeded for the surveyedemployees. The electrician and one of themechanics match the NIOSH REL, bothshowing results of 85 dB(A) for the sampledperiod. The real–time noise exposures wereplotted and are shown in Figures 1–5. Theelectrician carried a small notebook during theday and noted the times of noisy events orlocations. These are marked on Figure 1.Inspection of all the real–time data show thateach of the employees spent much of the dayin noise levels between 70 and 80 dB(A).
In addition to the employees’ personal noiseexposure measurements, various areas in thepowerhouse were chosen for a spectralanalysis of the sound. Over 20 locations wereselected and sound measurements made withthe real–time analyzer while either four or fiveof the generators were in operation.Throughout the facility, a predominant soundfrequency of 125 Hz was seen in most of thedata. An example of this pattern is seen inFigure 6, from data obtained at the top floor of
the powerhouse next to unit #3. Unit #5 wasnot in operation at the time this measurementwas made, but the other four units wereon–line. As can be seen in this figure, the 1/3octave band sound energy centered at 125 Hzis 15 dB greater than any other third–octaveband. The predominance of sound energy at125 Hz is seen in other areas of the powerplant (Figure 7) as well as outside of thefacility near the transformers (Figure 8).
Office locations in the powerhouse weremeasured with the real–time spectral noiseanalyzer (Figures 9–12). While not aspronounced, the 125 Hz third–octave bandsound energy is consistently one of the highestin these locations. However, the overallsound energy is low, ranging from 59.5 to71.5 dB(A) and 74.7 to 85.0 dB(C). The 16Hz third octave band energy is also one of thehigher sound energy bands in the office areas.Finally, sound levels in the old lunchroomlocated in the powerhouse and the newlunchroom recently occupied in the newbuilding next to the power plant werecompared. The new lunchroom (Figure 14)clearly offers a quieter environment forworkers to take their breaks. The overalllevels for the two spaces were measured at63.6 dB(A) and 81.1 dB(C) for the oldlunchroom and 38.1 dB(A) and 66.0 dB(C) inthe new building.
The U.S. Army Corps of Engineers medicaldepartment forwarded audiometricexaminations from 53 individuals to NIOSHfor analysis. The hearing test results wentback to 1977 for some of the employees andup to January 1998, the last time hearing testswere given to employees before the HHEoccurred. Not all of the records belonged toemployees who worked in the powerhouse;some tests were for park rangers or others whoworked in the Welcome Center of the LibbyDam project. Nearly all of the employees hadgaps in their audiometric data, having yearswhere they were not given a hearing test for anunknown reason. A total of 315 hearing tests

Health Hazard Evaluation Report No. 98–0149 Page 5
were analyzed for the 53 employees. Someemployees had as few as one audiometric testand one employee had 14 hearing tests.
The OSHA noise regulation defines a standardthreshold shift (STS) as a change in hearingthreshold relative to the baseline audiogram ofan average of 10 dB or more at 2000, 3000,and 4000 Hz in either ear when the baselineaudiogram is compared to the annual hearingtest.6 For these data, the earliest hearing testwas used as the initial baseline audiogram. Ifa STS was discovered, it was recorded and theannual audiogram became the new baselinefor comparison to future hearing tests, asspecified in the OSHA regulation. Thisprocedure was duplicated whenever an employeemet the definition of a 10dB average shift atthe designated test frequencies. In thismanner, an individual could exhibit multipleSTSs over the data record. Of the 53employees whose records were available foranalysis, 5 individuals only had oneaudiometric test so that a comparison was notpossible. Twenty–two of the remaining48 employees did not exhibit a STS while26 employees had at least one STS. Thislatter group broke down as follows: 16 hadone STS, 5 had two STS’s, 4 had three STS’s,and 1 worker showed five shifts.
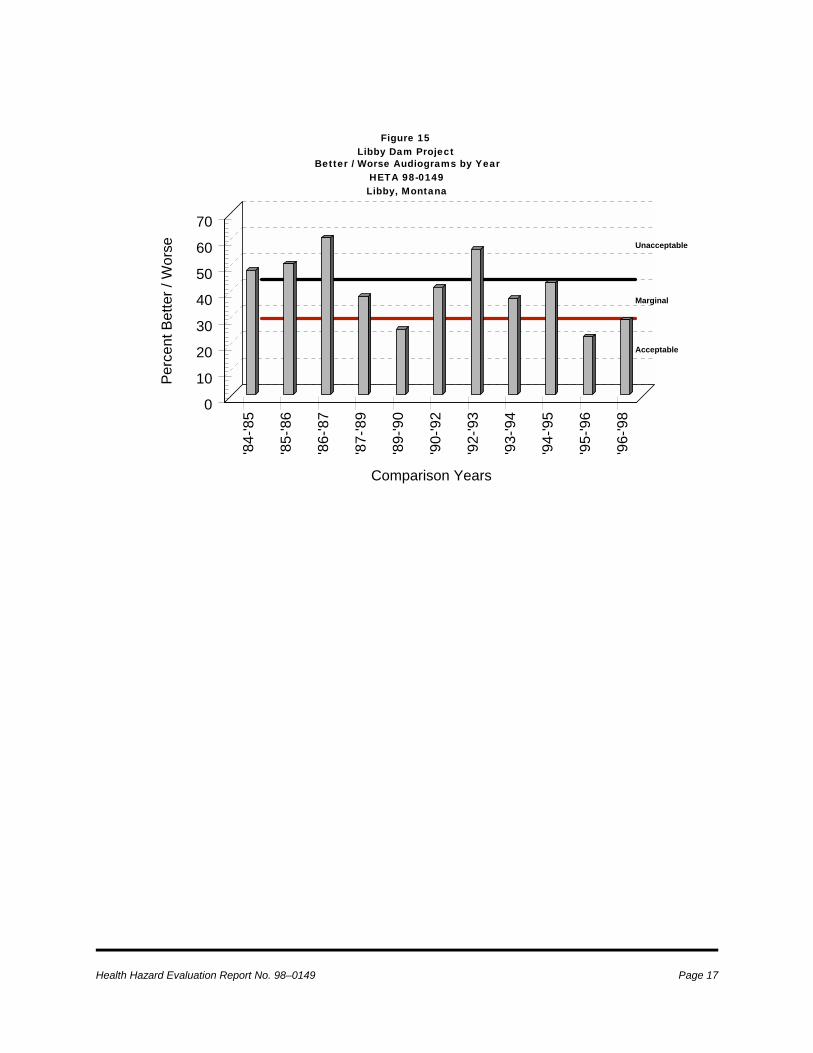
The audiometric data were reviewed from ahearing conservation program effectivenessperspective using the American NationalStandards Institute (ANSI) S12.13 percentbetter or worse sequential metric (%BW).8,9
This metric uses the percent of the testedpopulation that shows a 15–dB shift eithertoward better hearing or worse hearing at anytest frequency in either ear between twosequential annual audiograms. As notedearlier, most employees with multiple testshad time gaps in their hearing tests. Workerswere included in this analysis only when theirhearing tests were on an annual schedule. Ifhearing tests were given, but the employeewas not included, for whatever reason, thenthey were not analyzed for that year. For
example, if an employee had hearing tests in1984, 1985, 1987, 1992, and 1993, their testswould be analyzed for the %BW metric for1984 to 1985 and 1992 to 1993. Nocomparison would be made between the years1985 and 1987, or between 1987 and1992 because hearing tests were given by theU.S. Army Corps of Engineers for the years inbetween their examinations, but the employeewas not tested. Of the 315 audiometric testsin this population, a %BW comparison wasmade for 184 of them as they met thiscriterion. In order to evaluate the hearingconservation program, the percentage ofworkers who exhibit a 15 dB or greaterchange are recorded for each time periodwhere a comparison can be made. Accordingto the ANSI standard, if the percentageexceeds 25% of the compared population theprogram is labeled as marginal. If the percentof employees compared exceeds 40%, then theprogram is labeled as unacceptable. Theresults are graphically displayed in Figure 15.Only 2 of the 11 comparison periods fall intothe acceptable range, while 4 of them werefound to be unacceptable.
DISCUSSIONNoise exposure levels measured during theNIOSH evaluation were not exceedingly high.In no instance were the OSHA criteria fornoise surpassed. The NIOSH REL was met intwo of the five dosimeter measurements.Inspection of the dosimeter results do show apotential for intense noise exposures toemployees since there were occasions wherethe real–time exposure data approached 100dB(A). However, the amount of time spent innoisy activities was brief on the day of thissurvey. This finding is not surprising due tothe nature of the work at the Libby Damproject. Noise exposures are dependent on thetasks that these maintenance employeesperform and the levels will vary from dayswhen normal operations are occurring to days

Page 6 Health Hazard Evaluation Report No. 98–0149
when preventative overhaul and emergencyrepair operations happen.
The area noise measurements made in thepowerhouse show a predominant lowfrequency centered at 125 Hz, which is mostlikely attributable to the actual generation ofelectricity. Very low frequency sounds (lessthan 16 Hz) are not present in the power plantat high energy levels. During informaldiscussions with employees during the survey,the office workers described uneasy feelingswhile working in the powerhouse, particularlywhen using their computers. Many of themfelt symptoms that they equated to “motionsickness.” Because these kind of symptomscan be related to structure–borne vibration, theNIOSH investigator attempted to measurevibration in the facility in a rudimentaryfashion by placing a dime on the surface ofvarious structures to see if there was sufficientenergy to cause the coin to move. Movementwould indicate that the vibration forceexceeded the force of gravity which is anacceleration value of 9.81 meters per secondper second (m / sec2). No movement wasdetected in the dime when placed on top ofunit #2. However, the dime did move in somelocations on the top of unit #3. Also, the dimewould move when placed on stair railings nearunits #1, #3, and #4. When the coin wasplaced on the console in the control room, nomovement was detected. This primitiveexamination of structure–borne vibrationpoints to a possible problem for theemployees. If the work area has sufficientvibration energy to put it into motion, thismovement will be perceived by employees.Visual tasks, such as looking at a computerscreen, may cause the person to lose a sense ofa stable horizon which can lead to feelings ofmotion sickness. The phenomenon is similarto reading a book while riding in anautomobile; the rider loses visual sight of thehorizon while their body is moving in the car.
Inspection of the hearing test data foremployees at the Libby Dam project seems toindicate that longer–term workers do havehigh frequency hearing loss that is indicativeof excessive noise exposure. However, thefluctuations in the year–to–year test resultsmake it difficult to determine if the losses arepersistent or if they might be of occupationalorigin. Nine of the 11 possible comparisonsof the audiometric tests fell into the marginalto unacceptable program range. This amountof variability calls into question the reliabilityand validity of the hearing test data. Beforeany conclusions can be made aboutoccupational hearing loss, this project’saudiometric test program needs to bestrengthened. In the interim, the draft HearingProtection Plan given to the NIOSHinvestigator seems to be a reasonableguideline for employees and management tofollow until better audiometric data becomeavailable. The mandatory use of hearingprotection in the powerhouse when three ormore units are on line and the use of doubleprotection for the louder maintenanceactivities seems to be a conservative approachto protecting the hearing of the employees atthe Libby Dam project.
CONCLUSIONSThe survey results from this evaluation areinconclusive as to whether a noise hazard existsfor this facility. The personal noise exposuremeasurements made with the dosimeters were notespecially intense. The NIOSH REL was reachedin only two of the five samples. OSHA criteriawere not exceeded. The area spectralmeasurements did not reveal any excessive lowfrequency sound energy in the power plant’s workareas. There were indications thatstructure–borne vibrations are being perceived byemployees, resulting in symptoms of motionsickness for a few of the workers.
Analysis of the audiometric testing programrevealed many deficiencies. Several employeeshave been tagged as exhibiting STSs as defined inthe OSHA noise regulation. Thirteen of

Health Hazard Evaluation Report No. 98–0149 Page 7
1. NIOSH [1992]. Recommendations foroccupational safety and health: compendium ofpolicy documents and statements. Cincinnati,OH: U.S. Department of Health and HumanServices, Public Health Service, Centers forDisease Control, National Institute forOccupational Safety and Health, DHHS (NIOSH)Publication No. 92–100.
2. ACGIH [1998]. 1998 TLVs® and BEIs®:threshold limit values for chemical substances andphysical agents. Cincinnati, OH: AmericanConference of Governmental IndustrialHygienists.
3. Code of Federal Regulations [1997]. 29 CFR1910.1000. Washington, DC: U.S. GovernmentPrinting Office, Federal Register.
53 employees were labeled as having multipleshifts, a finding more indicative of a workplacethat has very intense noise exposures. Thereliability of these data come into question whenanalyzed for stability. The hearing tests of theworkers vary tremendously, both for the betterand for the worse, from year to year. Thesefluctuations make it very difficult to determine thevalidity of the hearing losses and the source of thelosses in order to make changes in the hearingconservation program to better protect theemployees’ hearing.
RECOMMENDATIONSBased on the measurements and observationsmade during the evaluation at the Libby Damproject and the subsequent analysis of employees’hearing tests, NIOSH investigators offer thefollowing recommendations to improve the workenvironment for employees at the facility.
1. The U.S. Army Corps of Engineers needs toimprove its audiometric test program. Eventhough hearing tests have been provided to allemployees for many years, the information gainedfrom this testing program is too variable toprovide the necessary feedback to improve theeffectiveness of their hearing conservationprogram. The U.S. Army Corps of Engineersneeds to make sure that the provider of theaudiometric testing services follows professionalguidelines established to ensure that accurate andvalid hearing tests are obtained during the annualtests.10
2. Management at the Libby Dam project shouldtake an audit of their hearing conservationprogram. The draft Hearing Protection Plancertainly is an excellent beginning towardsimplementation of a more effective program. Thedraft plan is a very conservative approach toreducing hearing loss in employees of the facility.However, because of the unreliable audiometricdata currently available, it would be prudent formanagement to take this kind of an approach untilthe hearing tests show that the workers areadequately protected and that some of therequirements of the Hearing Protection Plan canbe reduced or eliminated. Additional help infacilitating an effective program can be found ina recent NIOSH technical report.11
3. The documentation of workers’ noiseexposures by the Safety Office should becontinued. Periodic monitoring of daily noiseexposures for routine power generation days andfor scheduled and unscheduled maintenanceactivities should be logged along with the areasound level survey results.
4. Employee reports of symptoms similar tomotion sickness may be the result ofstructure–borne vibration in their work areas. Thevibration levels are well below any criteria relatedto health problem or performance decrements.12
However, people can still perceive the motionwhich may lead to their uneasy feelings. The factthat a new administration building has beenrecently erected outside of the powerhouse leadst o t h e r e c o m m e n d a t i o n t h a t a l loffice/administrative activities be moved to thisnew location as soon as possible. This willeliminate any structure–borne vibration that maybe affecting the employees. This would includethe movement of the control room to the newbuilding. The new building also offers a betterquiet area for workers to take breaks away fromthe noise of the powerhouse in the newlunchroom.
REFERENCES

Page 8 Health Hazard Evaluation Report No. 98–0149
4. Ward WD [1986]. Anatomy & physiology ofthe ear: normal and damaged hearing. Chapter 5.In: Berger EH, Ward WD, Morrill JC, RoysterLH, eds. Noise & hearing conservation manual.4th ed. Akron, OH: American Industrial HygieneAssociation, pp 177–195.
5. Suter AH [1978]. The ability of mildlyhearing–impaired individuals to discriminatespeech in noise. Washington, DC: U.S.Environmental Protection Agency, JointEPA/USAF study, EPA 550/9–78–100,AMRL–TR–78–4.
6. Code of Federal Regulations [1992]. OSHA.29 CFR 1910.95. Washington, DC: U.S.Government Printing Office, Federal Register.
7. NIOSH [1998]. Criteria for a recommendedstandard: occupational noise exposure (revisedcriteria 1998). Cincinnati, OH: U.S. Departmentof Health and Human Services, Centers forDisease Control and Prevention, National Institutefor Occupational Safety and Health, DHHS(NIOSH) Publication No. 98–126.
8. ANSI [1991]. Draft American nationalstandard: evaluating the effectiveness of hearingconservation programs. New York, NY:American National Standards Institute, DraftANSI S12.13–1991.
9. Royster JD and Royster LH [1990] Hearingconservation programs: Practical guidelines forsuccess. Chelsea, Michigan: Lewis Publishers,Inc.
10. Suter AH [1993]. Hearing conservationmanual. Third Edition. Milwaukee, WI: Councilfor Accreditation in Occupational HearingConservation.
11. Franks JR, Stephenson MR, and Merry CJ[1996]. Preventing occupational hearing loss – apractical guide. Cincinnati, OH: U.S. Departmentof Health and Human Services, Centers forDisease Control and Prevention, National Institutefor Occupational Safety and Health, DHHS
(NIOSH) Publication No. 96–110.
12. ISO [1997]. Mechanical vibration and shock– evaluation of human exposure to whole–bodyvibration Part 1: general requirements. Geneva,Switzerland, ISO 2631–1:1997(E).

Health Hazard Evaluation Report No. 98–0149 Page 9
Table 1Noise Dosimeter Data
U.S. Army Corps of EngineersLibby Dam Project
Libby, MontanaHETA 98–0149May 21, 1998
Job Title Sample Time OSHA PELa OSHA Alb NIOSH RELc Maximum Leveld
Electrician 8 hr : 40 min 73.0 dB(A) 79.4 dB(A) 84.7 dB(A) 111 dB(A)
Mechanic “A” 8 hr : 29 min 74.7 dB(A) 78.5 dB(A) 85.4 dB(A) 108 dB(A)
Mechanic “B” 8 hr : 34 min 57.7 dB(A) 71.8 dB(A) 79.0 dB(A) 111 dB(A)
PowerplantOperator 8 hr : 24 min 61.3 dB(A) 71.4 dB(A) 78.6 dB(A) 100 dB(A)
Laborer 8 hr : 21 min 66.0 dB(A) 73.2 dB(A) 80.7 dB(A) 110 dB(A)
EvaluationCriteria 90 dB(A) 85 dB(A) 85 dB(A)
a – Data collected with a 90 dB criterion, 90 dB threshold, and 5 dB exchange rateb – Data collected with a 90 dB criterion, 80 dB threshold, and 5 dB exchange rate [Lavg]c – Data collected with a 85 dB criterion, 80 dB threshold, and 3 dB exchange rate [Leq]d – Maximum slow–response level measured during sampling period

Page 10 Health Hazard Evaluation Report No. 98–0149
Libby Dam Power PlantElectrician
8:0
0 A
M
8:3
0 A
M
9:0
0 A
M
9:3
0 A
M
10:0
0 A
M
10:3
0 A
M
11:0
0 A
M
11:3
0 A
M
1 2:0
0 P
M
12:3
0 P
M
1:0
0 P
M
1:3
0 P
M
2:0
0 P
M
2:3
0 P
M
3:0
0 P
M
3:3
0 P
M
4:0
0 P
M
4:2
2 P
M
Time of Day
0102030405060708090
100110
Noi
se L
evel
[dB(
A)]
HETA 98-0149Libby, Montana
May 21, 1998Lavg - 79.4 dB(A)Leq - 84.7 dB(A)
2 3
1
4 5 6
1 - Behind Breaker #32 - In Unit #3 Brush Housing3 - Unit #3 Wicket Gate4 - Unit #3 Draft Tube Acess Door5 - Unit #5 Air Housing [At full speed, no load]6 - Unit #5 Breaker tripped
Figure 1Figure 1Figure 1Figure 1
Libby Dam Power PlantMechanic "A"
8:0
0 A
M
8:3
0 A
M
9:0
0 A
M
9:3
0 A
M
10:0
0 A
M
10:3
0 A
M
11:0
0 A
M
11:3
0 A
M
12:0
0 P
M
12:3
0 P
M
1:0
0 P
M
1:3
0 P
M
2:0
0 P
M
2:3
0 P
M
3:0
0 P
M
3:3
0 P
M
4:0
0 P
M
4:2
7 P
M
Time of Day
0102030405060708090
100110
Noi
se L
evel
s [d
B(A)
]
HETA 98-0149Libby, Montana
May 21, 1998 Lavg - 78.5 dB(A)Leq - 85.4 dB(A)
Figure 2Figure 2Figure 2Figure 2

Health Hazard Evaluation Report No. 98–0149 Page 11
Libby Dam Power PlantMechanic "B"
8:0
0 A
M
8:3
0 A
M
9:0
0 A
M
9:3
0 A
M
10:0
0 A
M
10:3
0 A
M
11:0
0 A
M
1 1:3
0 A
M
12:0
0 P
M
12:3
0 P
M
1:0
0 P
M
1:3
0 P
M
2:0
0 P
M
2:3
0 P
M
3:0
0 P
M
3:3
0 P
M
4:0
0 P
M
4:3
0 P
M
Time of Day
0102030405060708090
100110
Noi
se L
evel
[dB (
A)]
HETA 98-0149Libby, Montana
May 21, 1998 Lavg - 71.8 dB(A)Leq - 79.0 dB(A)
Figure 3Figure 3Figure 3Figure 3
Libby Dam Power PlantControl Room Operator
8:0
2 A
M
8:3
0 A
M
9:0
0 A
M
9:3
0 A
M
10:0
0 A
M
10:3
0 A
M
11:0
0 A
M
11:3
0 A
M
12:0
0 P
M
12:3
0 P
M
1:0
0 P
M
1:3
0 P
M
2:0
0 P
M
2:3
0 P
M
3:0
0 P
M
3:3
0 P
M
4:0
0 P
M
4:2
6 P
M
Time of Day
0102030405060708090
100110
Noi
se L
evel
[dB(
A)]
HETA 98-0149Libby, Montana
May 21, 1998 Lavg - 71.4 dB(A)Leq - 78.6 dB(A)
Figure 4Figure 4Figure 4Figure 4

Page 12 Health Hazard Evaluation Report No. 98–0149
Libby Dam Power PlantLaborer
8:0
3 A
M
8:3
0 A
M
9:0
0 A
M
9:3
0 A
M
10:0
0 A
M
10:3
0 A
M
11:0
0 A
M
11:3
0 A
M
1 2:0
0 P
M
12:3
0 P
M
1:0
0 P
M
1:3
0 P
M
2:0
0 P
M
2:3
0 P
M
3:0
0 P
M
3:3
0 P
M
4:0
0 P
M
4:2
6 P
M
Time of Day
0102030405060708090
100110
Noi
se L
evel
[dB (
A)]
HETA 98-0149Libby, Montana
May 21, 1998 Lavg - 73.2 dB(A)Leq - 80.7 dB(A)
Figure 5Figure 5Figure 5Figure 5
Figure 6Libby Dam Power Plant
Generator #3 - Top FloorHETA 98-0149
Libby, MontanaMay 21, 1998
0
20
40
60
80
100
120
2.00 Hz
4.00 Hz
8.00 Hz
16.0 Hz
31.5 Hz
63.0 Hz
125 Hz
250 Hz
500 Hz
1.00kHz
2.00kHz
4.00kHz
8.00kHz
1/3 Octave Bands
dB S
PL

Health Hazard Evaluation Report No. 98–0149 Page 13
Figure 7Libby Dam Power Plant
Generator/Turbine Floor Between #3 & #4HETA 98-0149
Libby, MontanaMay 21, 1998
020406080
100120
2.00 Hz
4.00 Hz
8.00 Hz
16.0 Hz
31.5 Hz
63.0 Hz
125 Hz
250 Hz
500 Hz
1.00kHz
2.00kHz
4.00kHz
8.00kHz
1/3 Octave Bands
dB S
PL
Figure 8Libby Power Plant
Outside TransformerHETA 98-0149Libby, MontanaMay 21, 1998
0
20
40
60
80
100
2.00 Hz
4.00 Hz
8.00 Hz
16.0 Hz
31.5 Hz
63.0 Hz
125 Hz
250 Hz
500 Hz
1.00kHz
2.00kHz
4.00kHz
8.00kHz
1/3 Octave Bands
dB S
PL

Page 14 Health Hazard Evaluation Report No. 98–0149
Figure 9Libby Dam Power PlantAdministrative Office
HETA 98-0149Libby, MontanaMay 21, 1998
0
20
40
60
80
2.00 Hz
4.00 Hz
8.00 Hz
16.0 Hz
31.5 Hz
63.0 Hz
125 Hz
250 Hz
500 Hz
1.00kHz
2.00kHz
4.00kHz
8.00kHz
1/3 Octave Bands
dB S
PL
Figure 10Libby Dam Project
Project Manager's Office HETA 98-0149
Libby, MontanaMay 21, 1998
0
20
40
60
80
2.00 Hz
4.00 Hz
8.00 Hz
16.0 Hz
31.5 Hz
63.0 Hz
125 Hz
250 Hz
500 Hz
1.00kHz
2.00kHz
4.00kHz
8.00kHz
1/3 Octave Bands
dB S
PL

Health Hazard Evaluation Report No. 98–0149 Page 15
Figure 11Libby Dam Project
Control RoomHETA 98-0149Libby, MontanaMay 21, 1998
0
20
40
60
80
2.00 Hz
4.00 Hz
8.00 Hz
16.0 Hz
31.5 Hz
63.0 Hz
125 Hz
250 Hz
500 Hz
1.00kHz
2.00kHz
4.00kHz
8.00kHz
1/3 Octave Bands
dB S
PL
Figure 12Libby Dam Project
Safety Office - Five Units OperatingHETA 98-0149Libby, MontanaMay 21, 1998
0
20
40
60
80
100
2.00 Hz
4.00 Hz
8.00 Hz
16.0 Hz
31.5 Hz
63.0 Hz
125 Hz
250 Hz
500 Hz
1.00kHz
2.00kHz
4.00kHz
8.00kHz
1/3 Octave Bands
dB S
PL

Page 16 Health Hazard Evaluation Report No. 98–0149
Figure 13Libby Dam Project
Old LunchroomHETA 98-0149Libby, MontanaMay 21, 1998
0
20
40
60
80
2.00 Hz
4.00 Hz
8.00 Hz
16.0 Hz
31.5 Hz
63.0 Hz
125 Hz
250 Hz
500 Hz
1.00kHz
2.00kHz
4.00kHz
8.00kHz
1/3 Octave Bands
dB S
PL
Figure 14Libby Dam ProjectNew LunchroomHETA 98-0149Libby, MontanaMay 21, 1998
0
20
40
60
80
2.00 Hz
4.00 Hz
8.00 Hz
16.0 Hz
31.5 Hz
63.0 Hz
125 Hz
250 Hz
500 Hz
1.00kHz
2.00kHz
4.00kHz
8.00kHz
1/3 Octave Bands
dB S
PL
Health Hazard Evaluation Report No. 98–0149 Page 17
Figure 15Libby Dam Project
Better / Worse Audiograms by YearHETA 98-0149Libby, Montana
'84 -
'85
'85-
'86
'86-
' 87
'87-
'89
'89-
'90
'90-
'92
'92-
'93
'93-
'94
'94-
' 95
'95-
'96
'96-
'98
Comparison Years
0
10
20
30
40
50
60
70
Perc
ent B
ette
r / W
orse Unacceptable
Marginal
Acceptable

For Information on OtherOccupational Safety and Health Concerns
Call NIOSH at:1–800–35–NIOSH (356–4676)
or visit the NIOSH Homepage at:http://www.cdc.gov/niosh/homepage.html
!!!!Delivering on the Nation’s promise:
Safety and health at work for all peoplethrough research and prevention