hertfordshire’s local transport plan · previous transport strategy that was largely car based to...
TRANSCRIPT

Hertfordshire’sLocal Transport Plan2018 - 2031
www.hertfordshire.gov.uk/ltp
•DrivingProsperity•EnhancingPlaces•SupportingPeople
May 2018


ContentsForeword 4
5
10
13
116
112
113
44
94
107
15
32
37
2.TheLocalTransportPlan
Glossary
5.LTPThemes,ObjectivesandPrinciples
8.LTP4Implementation,FundingandMonitoring
ExecutiveSummary
3.Challenges,OpportunitiesandTransport
6.PoliciesandActivities
9.References
1.Introduction
4.DriversofChangeandHertfordshireFutures
7.MajorSchemesandCorridorCommentary
10.Acronyms&Abbreviations

Local Transport Plan 2018 - 2031
The full strategy, evidence baseand strategic assessments are available at www.hertfordshire.gov.uk/ltp
There is also an easy read versionof the executive summary available.
Strategic Transport and Rail TeamEnvironment & InfrastructureDepartmentPostal Point CHN216,Hertfordshire County Council,Pegs Lane, Hertford,SG13 8DN
If you require any of the materialsin an alternative format orlanguage, please contact theStrategic Transport and Rail TeamEmail: [email protected]: 0300 123 4040
Foreword By 2031 there will be 175,000 more people living in Hertfordshire using the transport system, not to mention the growing populations outside the county travelling to and through the county. We must plan positively for this, to support our vision to be a county of opportunity and ensure everyone has a good quality of life. Planning positively means addressing the challenges of today and foreseeing and adapting to the challenges and change ahead. It also means shaping growth in the county to 2031 and beyond.
As a car driver I recognise it is the mode of choice for many and is the only realistic mode of travel for many journeys in the county. However, I also recognise that if we continue to depend on it as much as we do currently as our population grows, there will be serious consequences. Our response to growth cannot be to just build more roads and encourage more and more car use. Technology may well help avoid some of the problems with excessive car use but it isn’t a panacea. Our health, local environments and urban centres will be vastly improved if we can get more people to walk, cycle and use passenger transport.
We need to achieve a change in travel behaviour in Hertfordshire so people choose to travel by other modes for journeys that don’t need to be made by car. There is huge potential for this within towns and between adjacent towns. A combination of policies and improvements will be required to tip the balance in favour of non-car modes, and it will be to everyone’s benefit that by 2031 we have evolved our transport system to be less dependent on the car.
Technology will shape transport hugely in the coming years. This plan will help us embrace the opportunities it presents in a way that supports our vision for the county. We should not be passive recipients of the changes that arise, and must ensure technology supports delivery of our objectives and benefits everybody.
I believe this plan strongly supports the county council’s vision for the county in a way that is pragmatic but also sufficiently ambitious to respond to the challenges faced. As residents and/or users of the transport system in the county everyone has a stake in this plan.
Derrick Ashley Hertfordshire County Councillor Executive Member for Growth, Infrastructure, Planning and the Economy

5Hertfordshire’s Local Transport Plan 2018
Executive SummaryWhat is this plan for?This plan sets out how transport can help deliver a positive future vision of Hertfordshire. As well as providing for safe and efficient travel, transport has a major input into wider policies such as economic growth, meeting housing needs, improving public health and reducing environmental damage.
The plan covers the period up to 2031, which is the timescale for most of the housing proposals being set out in the ten district Local Plans. However, it also considers how future planning decisions and emerging technology might affect the way that transport needs to be provided in the longer term.
The overall approach to transportThis plan accelerates the transition from a previous transport strategy that was largely car based to a more balanced approach which caters for all forms of transport and seeks to encourage a switch from the private car to sustainable transport (e.g. walking, cycling and passenger transport) wherever possible.
The Local Transport Plan sets out the objectives, policies, and key schemes that will achieve this switch. The packages of smaller schemes and activities that are essential to successful outcomes will be considered through a series of “Supporting documents” covering particular topic areas, and include Growth and Transport Plans for specific geographic areas.
Current challengesSignificant housing growth is planned in future years, much greater in scale than in recent times. The county’s population is forecast to grow by 21% by 2039, from 1.18million people in 2016 to 1.43million. This will fuel an increase in travel demand. Economic growth is a national priority and will be needed to provide employment for the growing population in the region. Transport has a key role to play in facilitating economic growth and delivering sustainable housing development.
Hertfordshire has high levels of car ownership, good north-south links but relatively poor east-west connections, high levels of cross-boundary commuting and complicated movement patterns due to the high number of medium-sized towns.
This results in congestion between and within towns, rail overcrowding, and air quality problems. Those who live in rural areas, people who have a disability or other mobility impairment, or people who do not have access to a car often struggle to access key services, because alternatives to the private car are currently not realistic, affordable or convenient. High levels of car use is a factor in low levels of physical activity contributing to obesity and poor health.
Future challengesWith travel demand increasing in future years, continued reliance on high levels of car use will lead to worsening congestion and journey time reliability, both of which are constraints on economic growth. Further traffic growth and congestion will have a negative impact on public health and the quality of the urban, rural and natural environment.
A transport strategy that seeks to cater for future increases in travel demand with significant increases in highway capacity will at best be very expensive, difficult to deliver, environmentally damaging and result in congestion being displaced elsewhere on the network. At worst such an approach could be largely ineffective as the capacity created would soon be filled by more traffic travelling at the busiest times of day, and so eventually reducing any of the benefits from the scheme.
to address this traffic growth and congestion will be
A programme of
ROAD WIDENINGAND BUILDING
extremelyexpensive
environmentallydamaging
increasing carbon emissions
CO2£

Hertfordshire’s Local Transport Plan 20186
Addressing the challenge of increased future travel demand will require significantly stronger support for walking, cycling, passenger transport, and traffic demand management measures where appropriate. However, such solutions must be delivered against a background of public spending pressures. The Local Transport Plan will therefore seek to maximise the opportunities for alternative sources of funding.
An uncertain futureMajor changes to transport provision take many years to deliver. However, this plan has been written at a time of rapid change in technology in areas such as fuels, autonomous vehicles and data sharing. The outcome of these changes is difficult to predict but they will affect the volume and form of future transport demand and the type of infrastructure required. Housing developments are only mapped out to 2031, beyond this the locations are unknown.
We cannot delay tackling the existing problems, but we will need to be alert to a changing future by ensuring the strategy is adaptable to alternative scenarios. The key to success will be awareness of change and flexibility in our approach.
Themes, Objectives and PrinciplesThe foundation for this strategy is a set of nine objectives to deliver the positive future vision framed by the three themes of Prosperity, Place and People in recognition of transport’s contribution to most aspects of life. The strategy to deliver these objectives is guided by four principles (application of technology, cost effectiveness, integrating land use and transport planning, encouraging modal shift and active travel) which should be common to all areas of local transport policy and activity.
IMPLEMENTATION
VISION
OBJECTIVES
POLICIES
SUPPORTINGDOCUMENTS&
FURTHERSTUDIES
PR
INC
IPLE
S
KEYCORRIDOR&MAJORSCHEMES
LTP4 policies, schemes and supporting documents will deliver the objectives and be guided by the principles.

7Hertfordshire’s Local Transport Plan 2018
PoliciesA core feature of our plan is to do more to improve conditions for sustainable modes such as walking, cycling and passenger transport. This is in recognition of their role in reducing traffic growth, reducing environmental impact, increasing physical activity and improving health. It will include a more prominent consideration of their needs in all transport schemes, strategies and new developments as well as improvements to cycling infrastructure, walking environments and multi modal interchanges. It will also include work to enhance the attractiveness of bus travel in the county and the application of more bus priority measures.
Rail travel, particularly into London, will continue to grow in the future so sufficient capacity and service levels are essential, but the plan also seeks to increase service levels and connectivity to other destinations, as well as enabling rail to serve local interurban travel needs better.
Travel behaviour change will be encouraged through various initiatives but crucially this will need to be supported where appropriate by a greater emphasis on demand management, such as with the development of plans to constrain car use through parking charges and supply.
The plan seeks to update understanding of accessibility issues where some people find it difficult to access key services and participate fully in society. With an updated understanding of accessibility need, resources supporting transport services and initiatives can be better targeted.
Road safety remains a high priority and the plan seeks continued improvements. Transport security is also a priority particularly where it could deter use of sustainable modes, and to ensure the network is resilient to major alerts and incidents.
Transport and growth presents a threat to the local environment and it is important that the full range of impacts are understood and minimised. The impact of vehicle emissions on people’s health from poor air quality has become a more prominent issue in recent years. This plan outlines the current approach to this, but recognises it should be kept under review in light of changes in government policy.
With the potential for significant traffic growth the focus of the plan is to make optimum use of existing capacity supported by technology, but also by achieving modal shift away from cars. Some new highway capacity is likely to be required in future years because of population growth and existing levels of car ownership and use, but this will be carefully planned so as not to encourage even greater levels of car dependence.
Key scheme proposalsThe Local Transport Plan transport proposals are a blended approach of improvements in highways, passenger transport, walking and cycling (see Transport Proposals Map), focussed on key movement corridors in the county. They build on schemes which are already committed and those being promoted by other agencies in and around the county.

Hertfordshire’s Local Transport Plan 20188
Transport Proposals Map Legend
© Crown copyright and database rights 2018 OS EUL 100019606You are permitted to use this data solely to enable you to respond to, or interact with, the organisation that provided you with the data. You are not permitted to copy, sub-licence, distribute or sell any of this data to third parties in any form.

9Hertfordshire’s Local Transport Plan 2018
Notable proposals include:• Sustainable Travel Towns will
comprise comprehensive packages of improvements for walking, cycling and passenger transport, combined with activity to encourage more sustainable travel behaviour.
• An east west bus rapid transit scheme between Hemel Hempstead and Welwyn Garden City, with potential future extensions of this to Hertford and Harlow.
• A programme of A414 highway improvements including a Hertford Bypass
These schemes and accompanying corridor narratives set the overall strategic approach, but the detailed programme for particular areas will be developed through the Local Transport Plan supporting documents and further studies.
Implementation, Funding and MonitoringAn online Local Transport Plan implementation plan will be published that will give updated information on the delivery timescales for planned improvements. An annual monitoring report will also be produced to provide an update on the delivery of schemes and objectives. Realising new sources of funding to provide greater levels of investment in sustainable travel initiatives, and greater certainty over funding and delivery will be essential in future years. Exploring the potential of new innovative funding sources will be a key area of council activity to enable delivery of this plan.

10 Hertfordshire’s Local Transport Plan 2018
1. Introduction
This Local Transport Plan (LTP) sets out how transport can help deliver a positive future vision of Hertfordshire, as follows;
Hertfordshire VisionWe want Hertfordshire to continue to be a county where people have to opportunity
to live healthy, fulfilling lives in thriving, prosperous communities.
Prosperity• Better links between towns & cities
• Reduced need to travel
• Resilient and reliable network
• Less car dependent and more integrated, accessible & sustainable transport
• Positioned in the Golden Triangle (London, Oxford and Cambridge)
• Increased business and tourism opportunities
Place• Limited impacts of climate change
• Development and regeneration
• Improved local environment and green infrastructure
• Heritage and places of character retained
• Adequate, affordable & environmentally sensitive housing
People• Improved quality of life
• Vibrant and healthy communities
• Active and inclusive transport
• Varied and accessible employment opportunities
Figure 1.1: Hertfordshire Vision
In order to achieve this vision, the LTP aims to deliver nine transport objectives which contribute strongly to the Place, Prosperity and People elements of the vision. Cutting across the objectives are four principles guiding activity, which should be features common to activities to manage and improve the transport system. These are summarised in figure 1.2.
• ThisLocalTransportPlansetsouthowtransportcanhelpdeliverapositivefuturevisionofHertfordshire,focussedaroundthethemesofpeople,placeandprosperity.
• Itwilldeliverablendedapproachofimprovementsinhighways,passengertransport,walkingandcycling.
• Itseekstomanageatransitionawayfromafocusonhighwaycapacityimprovementsandpreparethelocaltransportsystemforaperiodofsignificantchangeenabledbytechnologicaladvances.
• Itwillguidetransportandlandusedecisionsto2031andbeyond.

11Hertfordshire’s Local Transport Plan 2018
Themes, Objectives and Principles
Themes Objectives
1. Improve access to international gateways and regional centres outside Hertfordshire
Integration of land use and transport planning
Application and adoption of technology
Cost effective delivery and maintenance
Modal shift and encouraging active travel
PR
OSP
ERIT
YP
EOP
LEP
LAC
E
5. Enhance the quality and vitality of town centres
2. Enhance connectivity between urban centres in Hertfordshire
6. Preserve the character and quality of the Hertfordshire environment
8. Make journeys and their impact safer and healthier
3. Improve accessibility between employers and their labour markets
7. Reduce carbon emissions
9. Improve access and enable participation in everyday life through transport
4. Enhance journey reliability and network resilience across Hertfordshire
Principles
Figure 1.2: Themes, Objectives and Principles of the LTP
In turn, these objectives and principles are translated into policies and schemes.
This Local Transport Plan:• Provides the framework and long term
vision to guide all future transport planning activity
• Sets out policies to help guide transport and land use decisions to 2031 and beyond
• Identifies major transport schemes required over the next 30 years to support growth and development
• Provides the evidence base and justification for future funding and policy decisions, including discussions with other transport providers

12 Hertfordshire’s Local Transport Plan 2018
TECHNOLO
GY
is havinga significant impact on TRANSPORTsuch as
electricvehicles
traffic management systems
real-time travel information apps
driverless carsOn the horizon are developments in
which could revolutionise travel
This new LTP for Hertfordshire is a break from the plans that have preceded it, and seeks to set the county on a different path in the development of its transport system. It is a transition in how we plan for a future transport system in the county in two aspects:
• A move away from a focus on car-based investment and capacity enhancement. These are now seen as a last resort because of the financial and environmental cost, question marks over their value in the long term, and because they often perpetuate car dependence, unhealthy lifestyles and unsustainable travel behaviour;
• A growing appreciation that transport is on the verge of great change. Technology and other drivers of change look likely to challenge the trend for increased economic growth to be accompanied with increased levels of car ownership and use. The pace of change and revolutionary impact of these technological changes has been likened to the transition from horse drawn power to the internal combustion engine, and would mark an end to the dominant model of transport provision that has held sway since the mid-20th century.
Whilst highways intervention will still be required, a blended strategic approach combining improvements in walking, cycling, passenger transport and highways provision is seen as optimum, accompanied by efforts to achieve travel behaviour change. Although this approach was common to previous LTPs it has not achieved modal shift. The new plan seeks to go further in striking a more appropriate
balance between highway provision and support for more sustainable modes of travel. Changing travel behaviour in the county is a core theme of this LTP, and it is acknowledged previous strategies have not been sufficient in this respect. Instead, comprehensive packages are required which manage demand and encourage people to change their travel behaviour. Major schemes and physical improvements alone are not sufficient.
This LTP is alive to the potential speed and scale of change, but recognises the significant uncertainty it holds for transport provision. The strategy aims to ensure the local transport system can support and adapt to future changes in transport demand and supply and do so in a manner that supports local aspirations and objectives.
The county faces an unprecedented scale of housing development in the next few decades generating further development to employ and serve this growing population. Failure to implement an appropriate strategic approach to transport provision in the county will have serious consequences in the future, for both the economy and quality of life.
The county will aim to work closely with its neighbours for improved cross border and cooperative working. This is particularly important due to the significant levels of housing growth expected in Hertfordshire and neighbouring authorities.

13Hertfordshire’s Local Transport Plan 2018
2. The Local Transport Plan• Thecountycouncilisrequiredbylawto
publishaLocalTransportPlan.
• Ithastohaveregardtootherlocalandnationalpolicyareas,recognisingtransport’sroleindeliveringotherobjectives.
• Theplansetsouttheoveralldirectionandpolicies.Detailsofhowthesewillbedeliveredarecoveredinasuiteofsupportingdocuments.
What is an LTP?The Local Transport Plan is a statutory requirement that sets out how the county council will improve transport in Hertfordshire. It considers how transport currently operates and future challenges and opportunities. The plan also outlines how transport can support the housing development proposed in district / borough councils’ Local Plans and the economic growth being facilitated by the Local Enterprise Partnership and its Strategic Economic Plan.
The new Local Transport Plan (LTP4) builds on the Local Transport Plan 3 which was published in 2011 to cover the period to 2031. However, it is good practice to review such plans every five years, and more importantly there are three key reasons why there is a need for a new LTP.
These are:• A new planning and economic context and
direction for Hertfordshire
• Deficiencies in the existing transport network that jeopardise the delivery of planned growth
• An existing transport strategy that will not meet future challenges
Given these reasons, a new transport strategy featuring major scheme proposals and a refreshed policy framework to guide operation and investment decisions is required.
Travel and movement trends in the county over the past few decades show that a continuation of existing strategy is not an option if Hertfordshire is to remain an attractive place in which to live, work and invest.
LTP Structure: Strategy and Supporting DocumentsThe LTP comprises this strategy document and a suite of subsequent supporting documents. The supporting documents build on the strategic level information set out within this document, providing further detail and focusing on either specific aspects of transport service delivery (such as walking, cycling and Rights of Way) or specific geographical areas or locations where more in depth analysis is required regarding localised issues and options. In some cases, supporting documents will include operational policies (such as those within the Network Management Strategy), in other cases they will be guidance. It is intended that most of the supporting documents will be published by 2019; however, there may be exceptions such as some of the Growth and Transport Plans which may not be completed until 2020. Supporting documents are likely to be updated on a five yearly basis.
The LTP Implementation Plan is a regularly updated list of measures arising from the strategy and supporting documents. The Annual Monitoring Report will show the progress being made with delivering the LTP. It will also report on any changes in the transport planning context. Figure 2.1 explains how this suite of LTP documents fits together.
The development of the LTP4 has been informed by a Strategic Environmental Assessment (SEA) and Habitats Regulation Assessment (HRA), underwent public consultations. The undertaking of an SEA on any plans that are likely to have a significant effect on the environment is a legal requirement (EU directive). There is also a legal requirement to undertake an HRA on the LTP4.

14 Hertfordshire’s Local Transport Plan 2018
Highway Infrastructure Asset Management Plan
Accessibility Strategy
Implementation Plan
Supp
orti
ng D
ocum
ents
Growth and Transport Plans
Road Safety Strategy
Sustainable Modes of Travel to School Strategy
Intalink Bus Strategy
Rural Transport Strategy
Roads in Hertfordshire: A Design Guide
Rail Strategy
Air Quality Strategy
Speed Management Strategy
LTP4 Strategy Document
Network Management Strategy
Active Travel Strategy
Progress Report
Rights of Way Improvement Plan
Figure 2.1: LTP Strategy and supporting documents
Policy Context Overview The Transport Act 2000 (amended 2008) places a statutory requirement on Local Transport Authorities (the county council in Hertfordshire’s case) to produce a Local Transport Plan and regularly review this document. The policy context for the LTP is set out in Figure 2.2. This reflects the mixture of national and local policies, strategies and guidance which have influenced the policy direction contained within this LTP. Future LTP monitoring reports will provide any notable updates to this context and explain how this is shaping the strategy delivery.
Figure 2.2: Primary National and Local Policy documents that have influenced the development of this Local Transport Plan.

15Hertfordshire’s Local Transport Plan 2018
3. Challenges and Opportunities• Apredicted21%increaseinthe
populationofHertfordshire(252,000extrapeople)by2039willincreasethedemandfortravel.
• Transportcansupporteconomicgrowthbyenhancingconnectivity,supportingregenerationandoperatingefficiently.
• Transporthasanimportantroleintacklinghealthissuessuchasobesityandairpollution,andinimprovingoverallqualityoflife.
• Thesolutionstotheseissuesmustbedeliveredagainstabackgroundofpublicspendingpressures.
Hertfordshire faces many challenges in future years which will have direct implications for transport. Crucially, where there are challenges there also opportunities, and it is important these are recognised and our transport strategy maximises the advantages that can be taken from them. The following section explains these key strategic issues and their transport implications in more detail.
Housing and Population GrowthLatest (2014 based) population projections estimate that Hertfordshire’s population will increase from 1.18million people in 2016, to 1.35million in 2031 and 1.43million by 20392. This represents an increase of 252,000 people (21%) in the next 23 years. Figure 3.1 shows how current population projections represent a different scale of population growth than preceding periods.
87,000
18%
incr
ease
15%
incr
ease
POPULATION
EXTRAHOUSEHOLDS
175,000
Current projectionsestimate the county
(ONS and MHCLG 2014 based projections)
will grow by an additional
between
&2 0 1 6 2 0 3 1
&
Historical Population (ONS Census)
Tota
l Pop
ulat
ion
Year
Projected Population (ONS 2014 based sub-national population projections)
1980
1,500,000
1,400,000
1,300,000
1,200,000
1,100,000
1,000,000
900,0001985 1990 1995 2000 2005 2010 2015 2020 2025 2030 2035 2040
Figure 3.1: Historical & projected population growth in Hertfordshire.

16 Hertfordshire’s Local Transport Plan 2018
Household growth is spread across the county (illustrated in Figure 3.2) with increases in households to 2031 forecast to range from 26-37% in each of the ten district and borough councils3. In addition to growth being delivered within Hertfordshire, neighbouring authorities are also planning significant levels of housing development, with particularly high rates in Aylesbury Vale, Luton, Central Bedfordshire, South Cambridgeshire, Enfield and Barnet.
Figure 3.2: Planned residential development in Hertfordshire, and housing growth levels in neighbouring authorities
Population growth fuels travel demand. The dispersed nature of the growth in Hertfordshire means the impacts will be widespread and not easily addressed by individual transport improvements, or by passenger transport services. This is because lower density and dispersed forms of development struggle to sustain viable and frequent bus services.
© Crown copyright and database rights 2017 OS EUL 100019606 You are permitted to use this data solely to enable you to respond to, or interact with, the organisation that provided you with the data. You are not permitted to copy, sub-licence, distribute or sell any of this data to third parties in any form.
Residential development sites are based on thoseincluded in emerging Local Plans as at September2016. These sites were included in the countywidetransport model (COMET) forecasts featured in theJanuary 2017 Forecasting Report, which forms partof the LTP evidence base. The size of thedevelopment sites shown in this map may notreflect the actual numbers assigned to that location.For more detail on specific growth sites and theiraccompanying policies, please refer to the relevantdistrict/borough Local Plan. The map only shows growth planned by the LocalPlanning Authorities in the county. Additional sitesmay be promoted by external parties for sites notshown on the map.
Dwellings per annum figure based on latest available information in district Local Plans and Strategic Housing Market Assessments (SHMA). Local Plan figures for most districts plan to 2031. A number of Local Plans only plan to 2026 / 2027. SHMA projection timeframes across Hertfordshire and surrounding districts vary to between 2026-2036. Where possible, annual Local Plan housing projections to 2031 have been used. In the cases of districts with older plans that only forecast to 2026 / 2027, the latest SHMA information has been used.
© Crown copyright and database rights 2018 OS EUL 100019606You are permitted to use this data solely to enable you to respond to, or interact with, the organisation that provided you with the data. You are not permitted to copy, sub-licence, distribute or sell any of this data to third parties in any form.

17Hertfordshire’s Local Transport Plan 2018
Economic GrowthThe Local Transport Plan will support the delivery of Hertfordshire’s Local Enterprise Partnership’s (LEP) Strategic Economic Plan (SEP) by enhancing connectivity between Hertfordshire, London and elsewhere, supporting regeneration of urban areas, and facilitating smart growth by making better use of resources and transport capacity.
The SEP emphasises how Hertfordshire’s connectivity and position next to London is critical to driving economic growth, and focusses on 3 broad corridors:• M1 and West Coast Mainline
• A1(M) and East Coast Mainline
• A10 and West Anglia Mainline
In addition the SEP recognises east west connectivity as having the potential to also drive growth with Luton and Stansted airports at either end, and the growth planned along the A414 corridor features in an emerging economic narrative.
A number of regeneration and growth initiatives are planned or already underway in and around Hertfordshire which will support future economic growth and employment.
These include:• Hertfordshire Enviro-tech Enterprise
Zone: Covering Maylands Business Park at Hemel Hempstead, the Building Research Establishment (BRE) at Garston and Rothamsted Research at Harpenden.
• Stevenage First: Investment in housing and town centre regeneration, and investment in key employment areas and sectors (attracting high tech industries including research and development, advanced engineering and bioscience to Gunnels Wood).
• Hatfield 2030+: Regeneration of the town and improving its transport system over the next 20 years.
• London Stansted Cambridge Corridor (LSCC): Development along the corridor which includes Kings Cross and the Olympic Park, Harlow, Stansted, through to Cambridge and Peterborough.
In addition to these, areas surrounding Hertfordshire have their own growth strategies underway which will provide employment and business opportunities for the county, and drive travel demand. These include:
• Luton/Dunstable/Houghton Regis – Substantial housing and jobs growth agenda with an Enterprise Zone surrounding Luton Airport.
• Harlow – Substantial housing and jobs growth, with an Enterprise Zone covering two sites in the town.
• Luton Airport – Making the best use of the existing runway with assessments identifying the capacity of the existing runway being 36-38 mppa, or in the region of 240,000 aircraft movements per year.
• Stansted Airport – Is expecting to exceed 35mppa by the mid-2020s, and aims to make full use of remaining capacity within its existing runway which could mean as many as 45mppa.
• A120 corridor in Essex – Proposed to become a focus for growth in West Essex, with major town expansion and new settlements being considered.
• The new draft London Plan aims to accommodate all London’s Growth within its boundaries however, it also identifies an interest in working with willing partners beyond London to explore potential for housing growth in sustainable locations.

18 Hertfordshire’s Local Transport Plan 2018
Socio-economic inequalities, housing affordability and healthIn Hertfordshire approximately 80% of working age residents are in employment, which is above the national average, and unemployment is at its lowest rate for ten years4. However, there are parts of Hertfordshire that have high levels of socio-economic deprivation (see Figure 3.3), particularly in the more densely populated areas such as parts of Stevenage, Watford, Hemel Hempstead, Hatfield and Broxbourne. Transport can play a role in supporting access to employment, education and training, but also in tackling other issues present in some deprived communities such as poorer health outcomes and lower quality environments.
Poor access to services can be a factor in social exclusion. Transport provision, the location and manner in which services are provided (e.g. hours of operation or whether services can be accessed remotely) can all contribute significantly.
(HCC Environment Survey 2015)
7%
19%
DO NOT
KEY SERVICES
of the population
of people think
BUSSERVICEPROVISION
is a major issue
find it easy to access
&
Index of Multiple Deprivation 2015 for HertfordshireHertfordshire Deciles (LSOA)
1(10%MostDeprived)2345678910(10%LeastDeprived)
Figure 3.3: Index of Multiple Deprivation 2015 for Hertfordshire
© Crown copyright and database rights 2018 OS EUL 100019606You are permitted to use this data solely to enable you to respond to, or interact with, the organisation that provided you with the data. You are not permitted to copy, sub-licence, distribute or sell any of this data to third parties in any form.

19Hertfordshire’s Local Transport Plan 2018
Hertfordshire’s appeal and its growth constraints are factors in it being one of the most expensive places to buy a property outside London. This means many people cannot afford to live in Hertfordshire and are forced to commute into the county. Conversely, the cost of property in London results in high levels of outward commuter flows into the capital from areas of relatively more affordable housing such as Hertfordshire.
As with many parts of the country there is significant scope for improvement in the health of Hertfordshire’s population. Raising levels of active travel can make a significant contribution to raising levels of physical activity and overall health and wellbeing.
20%1960’s
less active than in the
People today are
and physical inactivity directlycontributes to 1 in 6 deaths inthe UK; the same numberas smoking.
(Lee I-M et al (2012) Effect of physical inactivity on majornon-communicable diseases worldwide: an analysis of
burden of disease and life expectancy)
(Ng SW, Popkin B (2012) Time use and physical activity:a shift away from movement across the globe)
Around 1 in 4 Hertfordshire adult residents do less than
moderate activity a week.Source: Sport England (2013) Public Health Outcomes
Framework, Active People Survey
30 minutes
(excluding costs relating to obesity and mental health conditions).
£16 million per year
Physical inactivity costs the health economy in Hertfordshire more than
Sport England (2014) The Local Sport Profile Tool
One of the most direct impacts on health by transport is through lives lost and life limiting conditions caused by road collisions and poor air quality. There is evidence to suggest that the premature deaths (40-50,000 per year in the UK)6 caused by poor air quality in the UK5 dwarfs the number of deaths caused by road casualties (1,732 in 2015 in Great Britain),and public awareness of poor air quality, its impacts and the contribution of transport to this has grown in recent years.
20%1960’s
less active than in the
People today are
and physical inactivity directlycontributes to 1 in 6 deaths inthe UK; the same numberas smoking.
(Lee I-M et al (2012) Effect of physical inactivity on majornon-communicable diseases worldwide: an analysis of
burden of disease and life expectancy)
(Ng SW, Popkin B (2012) Time use and physical activity:a shift away from movement across the globe)
Around 1 in 4 Hertfordshire adult residents do less than
moderate activity a week.Source: Sport England (2013) Public Health Outcomes
Framework, Active People Survey
30 minutes
(excluding costs relating to obesity and mental health conditions).
£16 million per year
Physical inactivity costs the health economy in Hertfordshire more than
Sport England (2014) The Local Sport Profile Tool
Environment and Urban RegenerationA characteristic of Hertfordshire is its array of small and medium sized towns, with no dominant large centre that residents rely on for access to goods and services. The settlements themselves are varied and there is a rich urban heritage comprising traditional market towns, historic towns, garden cities, post war new towns and metropolitan centres. The backdrop to these towns is a largely rural environment dotted by villages and hamlets, with notable physical features including the Chiltern Hills and the Lea and Colne river valleys. A challenge is supporting growth and increased travel without reducing the quality of the environment, and where possible enhancing the features that attract people to the county.
The dominance of the Green Belt and areas of protected environmental status in Hertfordshire both limits growth opportunities and attracts people to live in the county. Environmental conservation is a priority not just in the county’s rural areas, but also its urban areas which contain buildings of historical importance that also need protecting, which again requires careful consideration of development options.
20%1960’s
less active than in the
People today are
and physical inactivity directlycontributes to 1 in 6 deaths inthe UK; the same numberas smoking.
(Lee I-M et al (2012) Effect of physical inactivity on majornon-communicable diseases worldwide: an analysis of
burden of disease and life expectancy)
(Ng SW, Popkin B (2012) Time use and physical activity:a shift away from movement across the globe)
Around 1 in 4 Hertfordshire adult residents do less than
moderate activity a week.Source: Sport England (2013) Public Health Outcomes
Framework, Active People Survey
30 minutes
(excluding costs relating to obesity and mental health conditions).
£16 million per year
Physical inactivity costs the health economy in Hertfordshire more than
Sport England (2014) The Local Sport Profile Tool

20 Hertfordshire’s Local Transport Plan 2018
Nearly a quarter of Hertfordshire’s population live in one of its New Towns (which include Hatfield, Hemel Hempstead, Stevenage, Welwyn Garden City) which are a priority for the LEP’s SEP for renewal of employment land, improved infrastructure, better retail offer and enhanced public realm. Higher density development and opportunities at rail hubs are highlighted as part of the approach.
(Department for Business, Energy and Industrial Strategy 2016)
2.3t5 10 15 20 25 30
( tonnes)
On average,road use by each resident produces
which is higher than the East of England Average
CO2
It is important that transport contributes positively to urban renewal and regeneration, but also that it minimises its negative impacts on both the manmade and natural environment. Noise and visual impact are obvious negative impacts, but there are also less overt impacts such as pollution of waterways, habitat destruction and those arising from vehicle emissions including carbon dioxide which contributes to climate change.
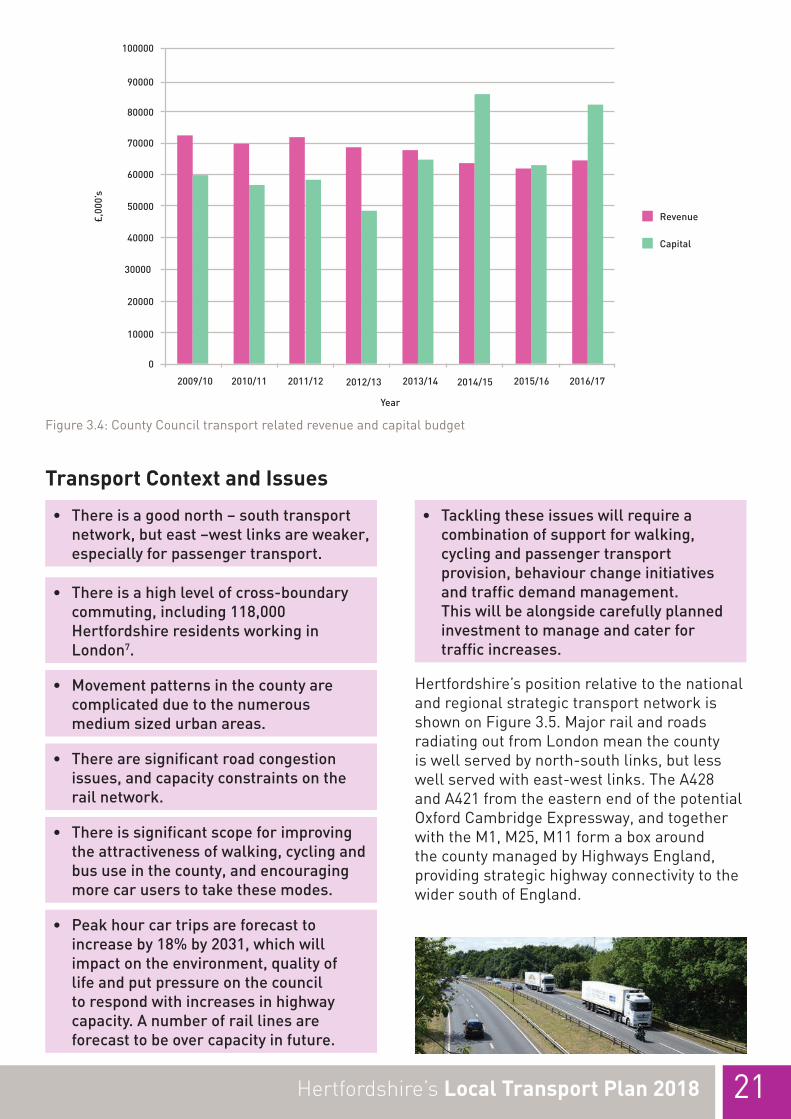
Public Spending Pressures and GovernanceThe 2008 financial crisis has resulted in continued pressure on the level of funding available for transport. Revenue funding for areas such as bus service support, and some sustainable transport, maintenance and road safety activity has been particularly squeezed. Capital funding for new and upgraded infrastructure has been relatively stable, as government sees this as important for supporting economic growth.
TRANSPORT REVENUE FUNDING
2009/10 to 2016/17
has reduced by8.1m (13%)£
£
(which funds road safety,sustainable transportand some maintenance activities)
The county council has to work in partnership with other organisations which also fund elements of transport, including the ten district/borough councils (such as via developer contributions), the Hertfordshire LEP, the Department for Transport (DfT), Highways England, Network Rail, train operating companies, and bus service providers. This adds complexity to the planning and delivery of transport improvements. A significant proportion of local transport funding comes from the LEP (which allocates some central government funding), funding from developers and competitive funding bids to central government. This adds further complexity with funding levels outside the county council’s control and highly uncertain.
Government has been inviting devolution proposals with a number of deals being agreed with groups of local authorities in return for additional powers and resources. Whilst providing opportunities for transport planning and improvement, there are risks and challenges, and Hertfordshire is still considering its position on the merits of joining a formal partnership arrangement with other local authorities. Regardless of the outcome, the scale of sub-regional population change and planning for this will necessitate a high level of cross boundary working and cooperation.
21Hertfordshire’s Local Transport Plan 2018
Revenue
Capital
Year
2009/10
100000
90000
80000
70000
60000
40000
50000
30000
20000
10000
0
2010/11 2011/12 2012/13 2013/14 2014/15 2015/16 2016/17
£,00
0’s
Figure 3.4: County Council transport related revenue and capital budget
Transport Context and Issues
• Thereisagoodnorth–southtransportnetwork,buteast–westlinksareweaker,especiallyforpassengertransport.
• Thereisahighlevelofcross-boundarycommuting,including118,000HertfordshireresidentsworkinginLondon7.
• Movementpatternsinthecountyarecomplicatedduetothenumerousmediumsizedurbanareas.
• Therearesignificantroadcongestionissues,andcapacityconstraintsontherailnetwork.
• Thereissignificantscopeforimprovingtheattractivenessofwalking,cyclingandbususeinthecounty,andencouragingmorecaruserstotakethesemodes.
• Peakhourcartripsareforecasttoincreaseby18%by2031,whichwillimpactontheenvironment,qualityoflifeandputpressureonthecounciltorespondwithincreasesinhighwaycapacity.Anumberofraillinesareforecasttobeovercapacityinfuture.
• Tacklingtheseissueswillrequireacombinationofsupportforwalking,cyclingandpassengertransportprovision,behaviourchangeinitiativesandtrafficdemandmanagement.Thiswillbealongsidecarefullyplannedinvestmenttomanageandcaterfortrafficincreases.
Hertfordshire’s position relative to the national and regional strategic transport network is shown on Figure 3.5. Major rail and roads radiating out from London mean the county is well served by north-south links, but less well served with east-west links. The A428 and A421 from the eastern end of the potential Oxford Cambridge Expressway, and together with the M1, M25, M11 form a box around the county managed by Highways England, providing strategic highway connectivity to the wider south of England.

22 Hertfordshire’s Local Transport Plan 2018
Significant Regional Transport Schemes
Hertfordshire
London
Colchester
Ipswich
Norwich
Birmingham
Oxford
Northampton
Bedford
Peterborough
Cambridge
Significant Regional Transport Schemes
Oxford - Cambridge Expressway
East - West Rail
Other Schemes
Basemap
Points of Interest
* = Indicative Route
Hertfordshire
London
Colchester
Ipswich
Norwich
Birmingham
Oxford
Northampton
Bedford
Peterborough
Cambridge
Significant Regional Transport Schemes
Oxford - Cambridge Expressway
East - West Rail
Other Schemes
Basemap
Points of Interest
* = Indicative Route
Hertfordshire
London
Colchester
Ipswich
Norwich
Birmingham
Oxford
Northampton
Bedford
Peterborough
Cambridge
Significant Regional Transport Schemes
Oxford - Cambridge Expressway
East - West Rail
Other Schemes
Basemap
Points of Interest
* = Indicative Route
Kilometers0 5 10 20 30
Points of Interest
Figure 3.5: Regional Transport Context and Schemes
The rail network is focussed around radial routes from London, providing for the commuter market and north-south movements. However, there are no east-west routes to provide connectivity between the radial lines.
There are a number of planned or proposed improvements to the national strategic transport network that will affect Hertfordshire in future years. These include:
• High Speed 2 (HS2): The new high speed railway between London Euston and Birmingham due to open in 2026, with later extensions to Manchester and Leeds. The scheme will free up capacity for more local and middle distance services to be accommodated on existing lines.
• East West Rail (EWR): A proposed new rail link between Oxford, Milton Keynes, Bedford and Cambridge. Completion of the section between Bedford and Cambridge (in the early 2030s) will improve connectivity from Hertfordshire’s rail routes.
• Highways England A1 Strategic Study: Aimed at identifying improvements which will bring consistency to the route between the M25 and Peterborough and addressing issues such as poor journey time reliability and environmental problems.
• Oxford Cambridge expressway: A study to investigate the case for linking and upgrading existing roads to create a high quality strategic east-west link between Oxford and Cambridge via Bedford and Milton Keynes. The transport benefits for Hertfordshire are few, but there could be economic benefits and transport pressures from the growth this facilitates.
A1 Strategic Study
Airport
© Crown copyright and database rights 2018 OS EUL 100019606You are permitted to use this data solely to enable you to respond to, or interact with, the organisation that provided you with the data.
You are not permitted to copy, sub-licence, distribute or sell any of this data to third parties in any form.

23Hertfordshire’s Local Transport Plan 2018
• Crossrail 2: The scheme will directly benefit Hertfordshire given it is proposed to serve Broxbourne, Cheshunt and Waltham Cross stations, and release capacity for other services on the West Anglia Mainline. The aim is for the service to be operational by the early 2030s. Work to secure government commitment continues.
The County Transport System and Travel PatternsSince 1950 and the start of mass car ownership, Hertfordshire and its transport system have experienced great change. The M25, M1 and A1(M) motorways have been constructed along with numerous highway upgrades and bypass schemes, the building of new towns, the growth of Luton and Stansted airports as major international gateways, the decline and rationalisation of the rail network through the Beeching cuts of the early 1960s
and the current rail passenger revival of the last two decades. This period of time has seen car ownership in Hertfordshire increase from only one in ten households in 19508, to nearly nine in ten households today.
Currently some 118,000 Hertfordshire residents work in Greater London, and half (51%) travel by rail/tube9. Combined with longer distance commuters traveling through the county to access London, this means much of the county’s rail network is at or approaching full capacity at busy times.
The proximity of Hertfordshire to London and the important role the county plays as a commuting base for workers to the capital is a very noticeable part of existing travel patterns. The top Hertfordshire origins for this London commute are St Albans, Watford, Cheshunt, Harpenden, Welwyn Garden City, Hemel Hempstead, Borehamwood and Stevenage.
Figure 3.6: Significant County Commuter Patterns. Source: AECOM Travel Pattern Analysis
© Crown copyright and database rights 2018 OS EUL 100019606You are permitted to use this data solely to enable you to respond to, or interact with, the organisation that provided you with the data. You are not permitted to copy, sub-licence, distribute or sell any of this data to third parties in any form.

24 Hertfordshire’s Local Transport Plan 2018
The A1 corridor has significant movements (Figure 3.6) between the towns along it particularly between the northern towns (Letchworth Garden City, Hitchin) and Stevenage, and between Stevenage and the southern towns (Welwyn Garden City, Hatfield). The majority of trips along the corridor are by car, despite the parallel rail provision.
In terms of east to west travel the strongest flows are between towns in close proximity to each other; Hemel Hempstead, Watford and St Albans, along with Hatfield and Welwyn Garden City. Flows are less strong from the A1 corridor to the east, but there are still notable relationships between neighbouring towns. This includes links between Hertford and Ware, and between these towns and Welwyn Garden City to the west and Broxbourne to the south. East west travel is predominantly by car but data suggests there is little demand for travel fully from one side of the county to the other. There are also notable flows from Luton and Dunstable into Hemel Hempstead, Harpenden, St Albans and Stevenage.
In addition there are a considerable number of commuting trips coming into the county from
the north London boroughs to destinations including Watford, Borehamwood and Cheshunt. In the east of Hertfordshire, commuting patterns from Bishop’s Stortford are predominantly to central London (by rail) and Stansted Airport (by car). Movement is also seen between Harlow and adjacent areas in the south east and east of the county.
Bus and Coach Network An extensive commercial bus network operates in the county (see Figure 3.7). In addition to this the county council supports a relatively small proportion (around 6% by patronage) of local bus services in Hertfordshire10. The county council only supports those journeys that the commercial sector would not provide, and in the absence of which would be unlikely to operate at all, or at a sufficient level to meet need.
In addition to the bus network there are a number of express coach services that operate commercially and serve parts of the county. These typically operate on a less than hourly frequency and connect local towns to London, regional centres, airports and with the national coach network.
Hertfordshire Bus and Coach Service Provision
Figure 3.7: Bus and coach service provision in Hertfordshire (excludes school services)
Bus route data accurate as of 2017
© Crown copyright and database rights 2018 OS EUL 100019606You are permitted to use this data solely to enable you to respond to, or interact with, the organisation that provided you with the data. You are not permitted to copy, sub-licence, distribute or sell any of this data to third parties in any form.

25Hertfordshire’s Local Transport Plan 2018
Sustrans National Cycle Network in Hertfordshire
Figure 3.8: Sustrans National Cycle Network in Hertfordshire
Cycle NetworkThe National Cycle Network (NCN) was established by the charity Sustrans and routes 1, 6, 12, 57 and 61 all pass through Hertfordshire (see Figure 3.8) although some are incomplete, comprising a mixture of on and off road paths. It utilises and links with numerous urban and rural cycle networks in the county, benefiting utility and recreational cyclists.
The county has an extensive rights of way network catering for walkers, cyclists and horse riders. There are also two systems of navigable waterways in Hertfordshire, the Grand Union Canal through Berkhamsted in the west of the county, and the Lea and Stort Rivers between Hertford and Bishop’s Stortford. These are used for recreational purposes with tow paths catering for walkers and cyclists.
Transport issues todayHigh demand for road travel across Hertfordshire means the county’s road network is under great pressure. As a consequence, there is
regular congestion and network disruption resulting in unreliable journeys and limited resilience, as well as harmful vehicle emissions and other environmental impacts.Figure 3.9 highlights some of the significant problems already experienced on the transport network, some of which will worsen due to growth already underway, although others will be relieved by the committed transport schemes being delivered in the medium term.
© Crown copyright and database rights 2018 OS EUL 100019606You are permitted to use this data solely to enable you to respond to, or interact with, the organisation that provided you with the data. You are not permitted to copy, sub-licence, distribute or sell any of this data to third parties in any form.

26 Hertfordshire’s Local Transport Plan 2018
Current Transport Network Problems & Issues
Figure 3.9: Current transport network problems and issues
Rail congestion is experienced on most lines in Hertfordshire, both in terms of seating capacity and the number of trains that can be run. This is a result of the high level of demand for commuting into London, and due to the lines being shared with local, regional and national passenger services and freight. Rail capacity is especially tested on the two-track sections, either with specific pinch points such as Welwyn Viaduct or whole routes such as the West Anglia Main Line.
What will growth mean for transport?
up to 17% - 18%
(COMET)
b y 2 0 3 1
car trips
made in
PEAKPERIODS
15%Average traffic speeds across the county will reduce by
33mphin 2014
28mphin 2031
(County Wide COMET Local Plan 2031 Do Minimum forecasts (version 2) – January 2017)
more
© Crown copyright and database rights 2018 OS EUL 100019606You are permitted to use this data solely to enable you to respond to, or interact with, the organisation that provided you with the data. You are not permitted to copy, sub-licence, distribute or sell any of this data to third parties in any form.

27Hertfordshire’s Local Transport Plan 2018
12 minutesHERTFORD to HEMEL HEMPSTEAD
(County Wide COMET Local Plan 2031 Do Minimum forecasts (version 2) – January 2017)
in the PM peak will take an extra
Compared to 2014, in 2031 Compared to 2014, in 2031
Compared to 2014, in 2031 Compared to 2014, in 2031
12
7 minutesWELWYN GARDEN to WATFORD
(County Wide COMET Local Plan 2031 Do Minimum forecasts (version 2) – January 2017)
in the AM peak will take an extra 7
6 minutesCHESHUNT to HERTFORD
(County Wide COMET Local Plan 2031 Do Minimum forecasts (version 2) – January 2017)
in the AM peak will take an extra 6
5 minutesSTEVENAGE to BOREHAMWOOD
(County Wide COMET Local Plan 2031 Do Minimum forecasts (version 2) – January 2017)
in the AM peak will take an extra 5Increased travel demand generated by population and economic growth is forecast to increase peak period car trips by 17-18% by 203111. This will lead to peak spreading (people travelling at different times of day to avoid the worst congestion) AM peak travel times are predicted to increase 50% with a 15% reduction in average speed12. New congestion locations emerge alongside existing ones and significant parts of the network in 2031 are shown to operate at capacity with traffic increasing on all routes. Journey times are predicted to increase between many urban areas, and it is also worth noting that journey time benefits from the A1(M) junction 6-8 smart motorway scheme are predicted to be negated by additional delays north and south of it.
12 minutesHERTFORD to HEMEL HEMPSTEAD
(County Wide COMET Local Plan 2031 Do Minimum forecasts (version 2) – January 2017)
in the PM peak will take an extra
Compared to 2014, in 2031 Compared to 2014, in 2031
Compared to 2014, in 2031 Compared to 2014, in 2031
12
7 minutesWELWYN GARDEN to WATFORD
(County Wide COMET Local Plan 2031 Do Minimum forecasts (version 2) – January 2017)
in the AM peak will take an extra 7
6 minutesCHESHUNT to HERTFORD
(County Wide COMET Local Plan 2031 Do Minimum forecasts (version 2) – January 2017)
in the AM peak will take an extra 6
5 minutesSTEVENAGE to BOREHAMWOOD
(County Wide COMET Local Plan 2031 Do Minimum forecasts (version 2) – January 2017)
in the AM peak will take an extra 5These statistics are taken from the county council’s transport model (COMET) which assumes current travel behaviour continues into the future. It also does not include any transport interventions beyond those currently committed and does not take into account the impact of technological changes. The model predicts a significant amount of suppressed demand, particularly in the AM peak, where demand cannot be accommodated on the network resulting in trips being taken at different times or not at all.
The forecast suggests a transport strategy focussed on catering for the increased traffic demand would be at best very expensive, difficult to deliver, environmentally damaging and result in congestion simply being displaced to other parts of the network. At worst such an approach could be largely ineffective as any new capacity created would be filled by suppressed demand.
12 minutesHERTFORD to HEMEL HEMPSTEAD
(County Wide COMET Local Plan 2031 Do Minimum forecasts (version 2) – January 2017)
in the PM peak will take an extra
Compared to 2014, in 2031 Compared to 2014, in 2031
Compared to 2014, in 2031 Compared to 2014, in 2031
12
7 minutesWELWYN GARDEN to WATFORD
(County Wide COMET Local Plan 2031 Do Minimum forecasts (version 2) – January 2017)
in the AM peak will take an extra 7
6 minutesCHESHUNT to HERTFORD
(County Wide COMET Local Plan 2031 Do Minimum forecasts (version 2) – January 2017)
in the AM peak will take an extra 6
5 minutesSTEVENAGE to BOREHAMWOOD
(County Wide COMET Local Plan 2031 Do Minimum forecasts (version 2) – January 2017)
in the AM peak will take an extra 5
A number of Hertfordshire’s rail lines are forecast to be over capacity by 2031 - Midland Main Line long distance services to St Pancras are forecast to be at 133% of capacity by 2031, with West Coast Main Line suburban services at 107%, Great Northern services to Moorgate at 104%, and Chiltern services to Marylebone at 100%. Forecast rail growth up to 2043 (39% on the West Anglia Main Line and 53% on the Midland Main Line) will quickly erode much of the spare capacity delivered by the Thameslink programme and Crossrail 213.12 minutesHERTFORD to HEMEL HEMPSTEAD
(County Wide COMET Local Plan 2031 Do Minimum forecasts (version 2) – January 2017)
in the PM peak will take an extra
Compared to 2014, in 2031 Compared to 2014, in 2031
Compared to 2014, in 2031 Compared to 2014, in 2031
12
7 minutesWELWYN GARDEN to WATFORD
(County Wide COMET Local Plan 2031 Do Minimum forecasts (version 2) – January 2017)
in the AM peak will take an extra 7
6 minutesCHESHUNT to HERTFORD
(County Wide COMET Local Plan 2031 Do Minimum forecasts (version 2) – January 2017)
in the AM peak will take an extra 6
5 minutesSTEVENAGE to BOREHAMWOOD
(County Wide COMET Local Plan 2031 Do Minimum forecasts (version 2) – January 2017)
in the AM peak will take an extra 5

28 Hertfordshire’s Local Transport Plan 2018
Can the increased pressure of the transport system be reduced?
there has been negligible REDUCTIONS IN CAR USE
In the last 15 YEARS in the county...
andmode
SHIFTTO
bus rail walking cycling
While there is limited evidence of modal shift from cars to more sustainable modes in the county in recent years, there remains significant potential for this. Over a quarter of commuters travel less than 5 miles to their place of work, and 43% travel less than 10 miles14. With the exception of trips to Central London where most trips are undertaken by rail, car is the main mode of travel for trips in Hertfordshire. The inter-urban trip with the highest mode share by bus is between St Albans and Hatfield, but this is still relatively low at approximately 10%. Rates of walking and cycling are highest within relatively small and dense urban areas such as Baldock and Hertford15. Rates of cycling are particularly low across the county, even in urban areas which have large numbers of local residents working locally, such as Stevenage, Hemel Hempstead and Welwyn Garden City. Rates in Stevenage are particularly disappointing given the extent of its cycle path network.
of ALL TRIPS in the county areestimatedto be under
(HCTS 2015)
63%5 MILES
In Hertfordshire
of JOURNEYSTO WORK are UNDER 10 MILES
(HCTS 2015)
53%10
of ALL TRIPS in the county areestimatedto be under
(HCTS 2015)
63%5 MILES
In Hertfordshire
of JOURNEYSTO WORK are UNDER 10 MILES
(HCTS 2015)
53%10

29Hertfordshire’s Local Transport Plan 2018
In larger towns
among people wholive & work in the same townis no more than
(census 2011) 6%
CYCLING TO WORKRATES
Hertfordshire
national average
of people USE BUSto get to WORK
(census 2011)
3%7%
ANALYSIS OF TRAVEL PATTERNSsuggests there is scope to increase mode share by
through better connections within and between towns
bus rail walking cycling
Evidence suggests that on its own investment to improve provision for and encourage use of alternative modes of travel to the car will not be sufficient to change existing travel behaviour, and deliver sufficient modal shift. Other areas have successfully encouraged higher levels of walking, cycling and passenger transport use by restrictive car parking policies. Examples include London, Oxford, Cambridge and Nottingham. Local evidence exists from analysis conducted on the Local Sustainable Transport Fund project during the previous LTP period (see case study), on the difficulties of achieving travel behaviour change in the absence of car parking constraints.
In larger towns
among people wholive & work in the same townis no more than
(census 2011) 6%
CYCLING TO WORKRATES
Hertfordshire
national average
of people USE BUSto get to WORK
(census 2011)
3%7%
ANALYSIS OF TRAVEL PATTERNSsuggests there is scope to increase mode share by
through better connections within and between towns
bus rail walking cycling

30 Hertfordshire’s Local Transport Plan 2018
Case Study: Local Sustainable Transport Fund and Modal ShiftHertfordshire County Council secured over £10m from the DfT’s Local Sustainable Transport Fund (LSTF) in the period 2011/12-2014/15. This funded the ‘BIGHERTSBIGIDEAS’ project which was a package of sustainable transport measures aimed at improving the local economy and reducing carbon emissions in Watford, St Albans and Hemel Hempstead.
Maylands Business Park in Hemel Hempstead was a particular focus, with initiatives including a designated Travel Plan Co-ordinator for the business park; sustainable travel marketing and promotional activities; new and improved cycling routes and facilities; urban realm improvements to support walking; bus infrastructure improvements; a new express bus service between Maylands Business Park and Hemel Hempstead town centre/ rail station, and a dedicated lift share website.
The DfT commissioned researchers to study findings from three LSTF Strategic Employment Sites. Maylands being Hertfordshire’s site (with Hatfield Business Park as a control site) was compared with sites in Slough and the West of England. The academic research has now been completed and a suite of detailed documents will be published in Autumn 2017. Findings indicate that restricting the amount of employee parking, which was not a feature of the Hertfordshire project, whilst providing and promoting alternative modes of sustainable transport is more effective at achieving modal shift.
A new approachThe current low level of sustainable mode use and the forecast growth in transport demand and pressure underlines the need to rethink the long term transport strategy for the county. The constrained public sector funding environment is making it increasingly difficult to fund transport improvements and initiatives that have a proven track record in achieving modal shift and reductions in car use. This transport strategy therefore needs to go further in its efforts to tackle congestion and constrain traffic growth than previous LTPs, but also do so in what is a more challenging funding environment.
The travel links between adjacent towns and the containment of trips within some larger urban areas indicate there is potential for sustainable travel modes to assume a greater role than at present. Too often the car is seen as the easy first option, even for short trips and adjacent locations well served by bus or rail. Improved provision and support for sustainable modes is clearly required. However Stevenage illustrates that a good level of provision for a sustainable mode (Stevenage is noted for its segregated cycleway network) is insufficient on its own to encourage people to use their car less. Improving the attraction of sustainable modes relative to car use will also require policies to reduce the ease and convenience of car use as well, to provide a nudge to people who could readily change their travel behaviour.
Increased pressure on the road network in the next 15 years is likely to be unavoidable. Traffic management and capacity enhancements will have a role to play to accommodate the committed spatial pattern of growth but where these are needed they should not only focus on catering for car use, but also on supporting improved urban environments and enhanced sustainable travel provision. Crucially demand management to reduce car use where appropriate must also play a role in supporting sustainable travel improvements and encouraging modal shift.

31Hertfordshire’s Local Transport Plan 2018
Challenges &Opportunities
Retaining Hertfordshire’s character & enhancing its environment • Urbanrenewaland
regeneration• Environmentally
sensitive&protectedlocations
• Carbonemissions• Environmental
protection
Existing transport deficiencies and a future network struggling to cope • Raillineandseatingcapacity
pressuretoday,withsomelinesforecasttobeovercapacityin2031
• Limitedmodalshifttodatefromcarstopublictransport,walking&cycling
• Congestion,unreliablejourneytimes&otherexistingtransportproblems
• Landuseplanningto2031&beyondinfluencinglevelsofcaruse
• Forecasttrafficgrowth,congestion,deterioratingreliability&journeytimes
• Travelpatternsindicatepublictransportunderutilised
Public spending pressures and local governance • Budgetreductions,particularlyrevenuespending
forbussubsidies,maintenance,roadsafety&sustainabletravelinitiatives
• Arrayofpublicagenciesandserviceproviderswithtransportroles(District/BoroughCouncils,LocalEnterprisePartnership,HighwaysEngland,NetworkRail)
• Devolutionagenda
Socio-economic inequalities, housing affordability and health• Accesstoservicesandriskofexclusion• Airqualityandroadcasualties• Unhealthylifestylesandhealthinequalities• Worseninglevelsoflocalhousingaffordability• Areasofdeprivation
Housing growth & economic development • Reinvigoratingnewtowns• Newcommunity&growthatHarlow• Reinforcedsettlementpattern&
growthontownperipheries• Airportexpansion&employment
growth• Enterprisezones-HertsEnviro-Tech,
Luton&Harlow• GrowthconcentratedonA1(M),A414
&A10/M11• LondonStanstedCambridgegrowth
corridor&Luton/Dunstable/Houghton
• Londongrowth
Figure 3.10: Strategic LTP challenges and opportunities summary

32 Hertfordshire’s Local Transport Plan 2018
Driver of Change Key uncertaintiesLand use planning • Scale and distribution of future housing and land use development
Socio-economic factors • Ageing population, increased retirement age and ageing workforce• Employment growth and the pull of London• House prices locally and in London• ‘Gig economy’ & multiple jobs shifting travel patterns• Flexible working• Lower propensity to have driving licence or own a car among
young people
Technology • New fuel and energy technologies• Connected autonomous (“driverless”) vehicles• Shared mobility and changing car ownership models• Growth in internet shopping and deliveries• 3D printing (local production but increased raw material transport)• Increased data collection and provision• Internet of things and connected infrastructure• Enhanced digital connectivity and speeds• Electric bikes
Political context • Social media facilitated two way community engagement• Increased partners in transport arena with emergence of new digital,
data, vehicle manufacturing and mobility companies.• Ageing population changing political priorities• Changing policies and legislation• Funding levels and sources for local transport
Environmental • More variable weather conditions• Steps taken nationally to address climate change• National policy initiatives to tackle poor air quality
Figure 4.1: Drivers of change
4. Drivers of Change and Hertfordshire Futures• Housingdevelopmentsareonlymapped
outto2031.Beyondthiswedonotknowwherehouseswillbebuilt.
• Thereisrapidchangeintechnologyinareassuchasfuels,autonomousvehiclesanddatasharing.Wecannotpredictforcertainhow,butthiswillallaffectthevolumeandformoffuturetransportdemandandthetypeofinfrastructurerequired.
• Weneedtostarttacklingexistingproblemsnow,butwillneedtobealerttoachangingfuturebyensuringsolutionscanadapttoalternativefuturescenarios.
Figure 4.1 illustrates various drivers of change which in the future will interact to change the
demands on and capabilities of the transport system. They represent significant uncertainty, and so we have undertaken a future scenario testing of our LTP Strategy to make it more robust. Whilst we cannot completely future proof the strategy, we can ensure it is as informed and adaptable as it can be to be more responsive to future change. Two areas warrant particular appreciation before we consider the messages from the scenario testing work; Land Use Planning and Technology.
Forecasts to
suggest the proportion of thecounty population
will go from(NOMIS)
2050
over 65
16%23%
to
33Hertfordshire’s Local Transport Plan 2018
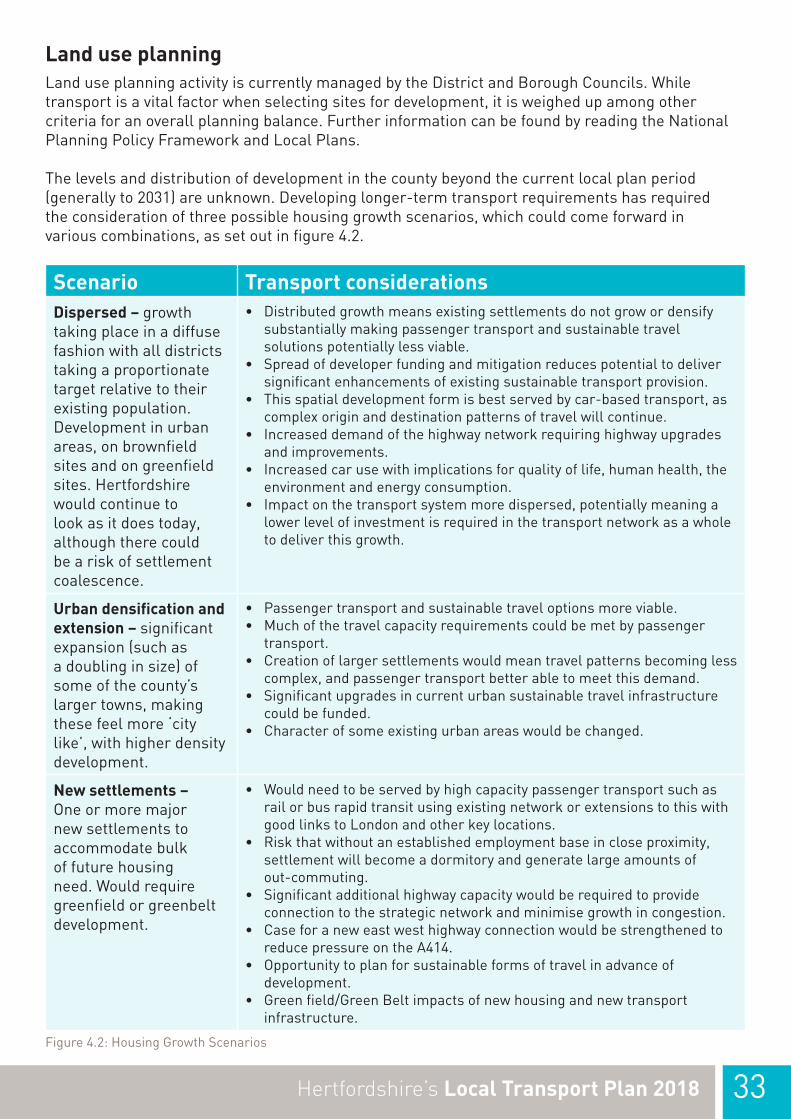
Land use planningLand use planning activity is currently managed by the District and Borough Councils. While transport is a vital factor when selecting sites for development, it is weighed up among other criteria for an overall planning balance. Further information can be found by reading the National Planning Policy Framework and Local Plans.
The levels and distribution of development in the county beyond the current local plan period(generally to 2031) are unknown. Developing longer-term transport requirements has requiredthe consideration of three possible housing growth scenarios, which could come forward invarious combinations, as set out in figure 4.2.
Scenario Transport considerationsDispersed – growth taking place in a diffuse fashion with all districts taking a proportionate target relative to their existing population. Development in urban areas, on brownfield sites and on greenfield sites. Hertfordshire would continue to look as it does today, although there could be a risk of settlement coalescence.
• Distributed growth means existing settlements do not grow or densify substantially making passenger transport and sustainable travel solutions potentially less viable.
• Spread of developer funding and mitigation reduces potential to deliver significant enhancements of existing sustainable transport provision.
• This spatial development form is best served by car-based transport, as complex origin and destination patterns of travel will continue.
• Increased demand of the highway network requiring highway upgrades and improvements.
• Increased car use with implications for quality of life, human health, the environment and energy consumption.
• Impact on the transport system more dispersed, potentially meaning a lower level of investment is required in the transport network as a whole to deliver this growth.
Urban densification and extension – significant expansion (such as a doubling in size) of some of the county’s larger towns, making these feel more ‘city like’, with higher density development.
• Passenger transport and sustainable travel options more viable.• Much of the travel capacity requirements could be met by passenger
transport.• Creation of larger settlements would mean travel patterns becoming less
complex, and passenger transport better able to meet this demand.• Significant upgrades in current urban sustainable travel infrastructure
could be funded.• Character of some existing urban areas would be changed.
New settlements – One or more major new settlements to accommodate bulk of future housing need. Would require greenfield or greenbelt development.
• Would need to be served by high capacity passenger transport such as rail or bus rapid transit using existing network or extensions to this with good links to London and other key locations.
• Risk that without an established employment base in close proximity, settlement will become a dormitory and generate large amounts of out-commuting.
• Significant additional highway capacity would be required to provide connection to the strategic network and minimise growth in congestion.
• Case for a new east west highway connection would be strengthened to reduce pressure on the A414.
• Opportunity to plan for sustainable forms of travel in advance of development.
• Green field/Green Belt impacts of new housing and new transport infrastructure.
Figure 4.2: Housing Growth Scenarios

34 Hertfordshire’s Local Transport Plan 2018
Transport TechnologyTechnology is driving change in transport that is bigger than seen for many generations. These ‘revolutions’ are altering the way services are planned and delivered, the choices available to users, and the players involved in the market. This presents a significant level of uncertainty as to which direction the public and private sector will and should take for the supply and demand for different transport modes, technologies and systems. A number of areas are discussed below.
New fuel and energy technologies which include hydrogen, electric, hybrid and liquefied natural gas (LNG) could lead to a shift away from traditional fuels which will help improve air quality at the point of use, but may also help lower the cost of transport for residents and hence encourage more travel.
Connected autonomous (“driverless”) vehicles offer the potential to significantly improve access for those that are unable to drive at the present time. Autonomous vehicles could reduce road congestion by allowing
cars to drive at consistent speeds and closer together, allow passengers to make more efficient use of time and lead to improved road safety. Alternatively they could result in traffic increases and congestion if they enable greater levels of travel at busier times.
The driver currently represents approximately 60% of the operational costs of a traditional bus service16. This can act as a limiting factor on routes that offer low patronage, particularly outside of peak hours. Automated vehicles operating on-demand could help to significantly bolster the accessibility of different areas, as well as improving their economic activity.
Driverless vehicle technology is developing at a rapid pace with trials already taking place on UK roads. There is uncertainty over when highly or fully autonomous vehicles will represent a certain proportion of the fleet, but there are high levels of private sector investment in this area and the national government is taking a positive stance to facilitating the technology.
Examples of automated vehicles

35Hertfordshire’s Local Transport Plan 2018
The sharing economy is changing the way in which people purchase transport services. Ownership models are changing with a potential shift to purchasing access. Car clubs, bike sharing (including electric bikes), lift sharing and on demand/ ride-hailing minibuses and taxis are all features of this trend. Smartphones and data processing are facilitating the matching of people with transport services and together with pay-as-you go models and on-demand applications the concept of mobility-as-a-service (MAAS) has been gaining momentum.
The way residents consume goods and services is also likely to change. More items will be purchased and delivered to households, resulting in fewer trips to town centres and shops, but will increase the number of delivery vehicles. New technology such as 3D printers in households may also mean that some items no longer need to be transported to a household or production hub, resulting in fewer trips by individuals, but may result in changes to raw material transportation.
Connectivity and use of big data – Increased access to real time data from a variety of networks, products and services, and advances in data analytics offers the potential to obtain a better understanding of travel behaviour and provision, and make more efficient use of resources. Superfast broadband and wireless technology will enable vehicle-to-infrastructure and vehicle-to-vehicle interaction, to better inform travellers and network operators. There would be potential for greater control, influence and monitoring of travel patterns.
Planning for Uncertainty: Scenario testing the LTPThe alignment of potential Local Transport Plan interventions has been tested against a set of plausible future scenarios for Hertfordshire. Detail on the scenarios and the testing exercise are included in the published LTP evidence base.
It is important this transport strategy does not rule out solutions to current and future transport challenges solely on the basis of it aligning poorly with a hypothetical future scenario. However, from the scenario testing exercise a number of interventions offered a stronger fit against a wide range of future scenarios, and can be considered more resilient to future uncertainty. These were:• Introduction of new demand management
mechanisms;
• Active travel schemes, particularly in urban areas; and
• Bus priority infrastructure.
Other policy areas and schemes, for example highways and junction schemes, although not aligning closely with all scenarios, are still likely to continue to play an important role to some extent in delivering the transport objectives of the county in the future. As such, a consideration of scenarios helps to prioritise rather than rule out possible solutions. A further application of the scenario testing work is to inform the extent, detail or type of scheme and intervention, and its flexibility in response to changing scenarios. For example under some scenarios there is a greater need for improved inter-urban provision, while in others there is a need for an urban focus. Key conclusions regarding some of the other interventions which were considered but did not align closely to all scenarios are set out in Figure 4.3:

36 Hertfordshire’s Local Transport Plan 2018
Passenger Transit Systems
Effectiveness questionable under future scenarios where extensive travel by road is popular and viable, while good quality transit systems needed under other scenarios. The need for flexibility in design and operation very important, possibly with demand responsive preferred over expensive to implement fixed routes.
Significant highway junction upgrades and bypasses
Questionable benefit in future scenarios where cost of energy is higher. Park and ride could complement. Schemes could have stronger justification if delivering other benefits than just facilitating traffic movement, such as unlocking development sites and facilitating sustainable urban transport systems.
Strategic (out of town) passenger transport hubs
Weaker alignment in scenarios with reduced interurban travel. Hubs should be flexible in their form and function such as by serving as online retail collection points, or first/last mile services using autonomous vehicles.
New rail stations Weaker alignment in scenarios with reduced long distance and interurban travel. Similar flexibility needed in form and function to passenger transport hubs. Need supportive land use policies (housing distribution and density).
Interurban cycleways Weaker alignment in scenarios where digital accessibility preferred, and could play less of a commuting role in some scenarios and more of a leisure role.
Figure 4.3: Interventions not aligned with some future scenarios
The future scenarios exercise also generated a series of additional interventions for the next 10 years which aligned well against a number of scenarios, and should be further investigated by the county council. These are:
General• Establish mechanisms to stay abreast of
market developments and trends in relation to connected, autonomous, shared and alternative fuelled vehicles and services
• Review policies and local strategies to understand how these trends could be supported
Shared mobility• Create an enabling environment for
shared mobility (e.g. from a regulatory and legislative standpoint)
• Undertake feasibility studies to establish where shared mobility services could be best focused
• Engage with the market to understand appetite for deploying services locally, and
potentially use developer funding to support services being established.
• Work with major employers and developers to encourage behaviour that aligns with county council policies
• Consider the procurement mechanisms for shared mobility services, and whether an adjustment to current practices is necessary
Alternative fuels• Facilitate the installation of charging
infrastructure and other facilities to support low emissions schemes
• Undertake a review of the grey fleet (vehicles used for business travel but not owned by the business) and county council fleet
• Support access to an electric vehicle car club where appropriate
• Procure electric vehicles within the county council fleet to show leadership

37Hertfordshire’s Local Transport Plan 2018
5. LTP Themes, Objectives and Principles• TheLTPisdeliveredagainstthethemesof
Prosperity,PeopleandPlace.TransportcancontributetotheseinmultiplewaysandtheLTPobjectivesclarifyhow.
• EvidenceanddataanalysedconcerningeachoftheobjectiveshighlightsanumberofmorespecificissueswhichtheLTPpoliciesandinterventionsmustseektoaddress.
• FourPrinciplesrepresentkeyfeaturesofourapproach,andshouldbeevidentintheLTPpoliciesandschemes.
The positive vision for Hertfordshire is arranged around the three themes of Prosperity, People and Place. The LTP Strategy is directed by nine objectives which sit beneath these three overarching themes, and which clarify how transport can support the delivery of the vision. The LTP also identifies a set of four principles (as identified in figure 1.2 on page 11) which will be features of our strategic approach to delivering the objectives.
Transport’s role in facilitating prosperityOne of the means by which transport can sustain and strengthen the local economy is by providing effective links to other regional and national centres of economic growth, as well as to international gateways. This regional connectivity is a key factor in why businesses locate and grow in the county, and will be a critical factor in future economic growth, allowing businesses to be closer to their labour markets, customers and suppliers.
While commuting is the most visible interaction between transport and the economy, the links between business to other businesses and to their customers are also important. By reducing travel times between places, a greater concentration of economic activity can be achieved. This is known as agglomeration and it can operate at a local level by bringing neighbouring settlements and locations in the county closer together, but
also at a national and regional level, by linking cities and international gateways more closely.
Hertfordshire benefits from a good level of connectivity comparable to national and regional averages, with particularly good connections to London and international airports. However east-west connections within the county compromise the ability to reach the appropriate north-south radial routes to external destinations by road or rail. The limited number of Intercity trains serving Hertfordshire also limits connectivity to the north, and passenger transport access to airports at Luton and Stansted requires improvement.
There are 27 urban centres within Hertfordshire that have a population over 10,000, and large towns such as Luton/Dunstable/Houghton Regis and Harlow are just over the county boundary. Based on considerations of population and employment size, agglomeration potential (from analysis of economic data detailed in the Vision Stage 2 report which forms part of the LTP evidence base), current travel patterns (indicating existing relationship between towns) and future growth levels, we have identified improved connectivity between the following towns as being of particular importance: • Stevenage• Hemel Hempstead• St Albans• Watford• Welwyn Garden City & Hatfield – combined
due to their proximity• Luton• Harlow
Based on an appreciation of these, regional centres and international gateways, as well as existing traffic and freight levels has resulted in the identification of the following key multimodal movement corridors in the county. These corridors should be the focus for improved connectivity within the county.

38 Hertfordshire’s Local Transport Plan 2018
Corridor 1: Aylesbury – Watford – London Corridor 2: London – Watford – Luton – Milton Keynes
Corridor 3: London-Stevenage – Peterborough Corridor 4: London – Harlow – Stansted – Cambridge
Corridor 5: Hemel & Watford – St Albans – Harlow
Corridor 6: Luton – Stevenage
Corridor 7: Stevenage – Cambridge Corridor 8: Stevenage - Stansted
With the possible exception of Corridor 8, these corridors are already well served by highways and there is a danger that road based connectivity improvements will perpetuate greater car use and traffic growth, undermining other LTP objectives. Particular attention is required on enhancing the attraction of rail on these corridors (where already available), and on improving passenger transport given this is where there are particular deficiencies in the county with regards to service levels and speeds. Connectivity will also benefit from improved
interchange between modes particularly at rail stations.
Good accessibility between businesses and employees will drive prosperity in the county as it will enable businesses access to labour markets. Greater choice and availability of employment, and access to education and training opportunities, will improve living standards. It is also important to improve intra-urban connectivity and accessibility, particularly by active and passenger transport modes, given it is critical to the first and last mile of journeys.
Figure 5.1: Key multimodal movement corridors
© Crown copyright and database rights 2018 OS EUL 100019606You are permitted to use this data solely to enable you to respond to, or interact with, the organisation that provided you with the data.
You are not permitted to copy, sub-licence, distribute or sell any of this data to third parties in any form.

39Hertfordshire’s Local Transport Plan 2018
Objective Key IssuesImprove access to international gateways and regional centres outside Hertfordshire
• Rail overcrowding on routes into London• Connections between local towns and regional centres, particularly by
passenger transport but also some highway routes, not very direct and relatively slow when not in the same north-south corridor.
• Passenger transport access to international gateways (airports and international railway stations) inferior to car.
• Infrequent intercity stops at Stevenage & Watford Junction stations.
Enhance connectivity between urban centres in Hertfordshire
• Poor East-West connectivity for highways (reliability and direct routes) and Passenger Transport.
• Passenger Transport connectivity (journey times, frequency, reliability, journey experience) between local urban centres
• Low levels of rail use for intra-county trips• Quality of multimodal connectivity and integration at passenger
transport hubs
Improve accessibility between employers and their labour markets
• Cost of local housing meaning people must travel further for work. • Proximity and economic growth of, and housing supply in, London
increasing rates of commuting from Hertfordshire• Local balance of jobs vs working population meaning districts are
less contained.• High car mode share for commuting trips, even for intra-urban
commutes, with inadequacies in passenger transport, walking and cycling provision.
• Location of some large employment sites remote from town centres and passenger transport hubs less accessible by non-car modes.
• Low level of business engagement on sustainable travel matters, and quality and coverage of travel plans.
Enhance journey reliability and network resilience across Hertfordshire
• Current congestion on urban and on interurban routes resulting in slow and unreliable journey times.
• High level of car dependence in county. Population growth expected to fuel future traffic growth. Issues of excess demand and inadequate supply and a less resilient highway network when problems occur.
• Risk of more extreme weather events (particularly flooding)• Freight and logistics trends resulting in growth of Light Goods Vehicles,
as well as issue of Heavy Goods Vehicles using inappropriate or unsuitable routes.
• Rail capacity from growth in travel demand.
Figure 5.2: “Prosperity” Objectives and Issues
Transport’s role in enhancing and preserving the quality of placeHertfordshire is an attractive place to live with a rich and varied natural, historic and built environment. The county has its own university, a proud modern history in town planning and engineering, a thriving film and science industry, and is home to an array of historic sites and buildings exemplified by the city of
St Albans. Ensuring Hertfordshire maintains and continues to improve its desirability is vital in ensuring it remains a place where people choose to live, work and visit.
Renewing and revitalising the county’s urban centres is a key challenge, particularly among the new towns, some of which have started to show their age and have been in decline.

40 Hertfordshire’s Local Transport Plan 2018
Successful regeneration will have sustainable transport benefits by encouraging populations and economic activity to cluster closer together around established passenger transport interchanges.
Within the plans and visions for large towns and those undergoing regeneration there are a number of common transport elements, representing a shared understanding of how transport planning and the transport system can support the delivery of local aspirations. It is evident that there is a desire to promote non-car travel, encouraging walking and cycling and improve access by passenger transport. Attractive and high quality public realms are also very prominent, as is recognition that high levels of car use and
congestion are not conducive to future positive visions of the central urban areas.
As well as its role in enhancing places by making them more accessible, vibrant and aesthetically appealing, transport can also harm the quality of place. This can include land take for new transport infrastructure, in addition to environmental damage caused by emissions/air quality, pollutants and noise. Carbon emissions are an environmental impact with global consequences, and as such need to be a priority against which transport can make a significant contribution, and in so doing reduce the risk of damaging, and potentially very costly, future climate change.
Objective Key IssuesEnhance the quality and vitality of town centres
• A number of towns in need of renewal and regeneration, and transport plays a role in improving urban environment.
• Negative impact of high levels of car use and congestion on the urban environment (noise, air quality, aesthetics, historic & natural environment) and limits potential to improve provision for other modes.
• Need to enhance accessibility to town centres to support growth, development and vitality
• Quality of walking and cycling environments in towns• Towns highly accessible by car with typical ample and relatively low
cost parking encouraging access by car. Demand Management could be considered as set out in policy 4.
Preserve the character and quality of the Hertfordshire environment
• Transport negatively impacts on the rural character of the county, such as from land take for infrastructure, noise, light pollution and visual intrusion.
• Transport impacts on the natural environment, for example biodiversity, air pollution, diffuse water pollution, noise and light pollution.
• Built and historic environment should be protected from transport impacts. This includes designated and undesignated heritage assets, listed and historic buildings, and ancient roads
Reduce carbon emissions
• High levels of car use and traffic (congestion) with further growth forecast as population grows. Relatively low levels of bus, walking and cycling
• Low take-up of Electric Vehicles and other low emission technologies, and possible barriers to this
• Carbon emissions from HCC organisation and its transport operations relating to maintenance, management and development of the network
• Growth in Light Goods Vehicles
Figure 5.3: “Place” Objectives and Issues

41Hertfordshire’s Local Transport Plan 2018
Transport’s role in improving the lives of peopleTransport can significantly impact on people and quality of life. Effective transport links enable more accessible services such as healthcare, leisure, education and employment – all vital to ensuring people can live successful, healthy and happy lives, and play an active part in society. There are a number of groups in the county at risk of social exclusion whose access needs may not be being met, and are not well understood. Whilst in a minority there is a sizeable population in the county who have difficulty accessing services. Resident surveys indicate there is scope for improvements in local bus service provision, however services to meet access needs are under significant funding pressure, and there are limitations to how alternative models of provision to timetabled buses can fill the gap left by service reductions. Transport infrastructure such as roads and rail lines can also limit accessibility by severing communities, and by acting as a physical barrier to walking and cycling.
The quality of local transport links and environment can also be a factor in levels of physical activity, with implications for people’s health and wellbeing. As with other parts of England, there are high levels of obesity among the population of Hertfordshire, with a lack of physical activity being a significant factor. Increasing levels of active travel can contribute to healthier weight, but also reduce the risk of a number of major diseases. There is scope to increase rates of physical activity in most districts, and increasing rates of walking and cycling can be a way of achieving this. It could also play a role in addressing health inequalities given some of the districts with the lowest rates of walking and cycling activity also contain some of the county’s more deprived areas.
Hertfordshire has declaredAIR QUALITYMANAGEMENT AREAS
and approx.of people over 30 in Hertfordshire in 2015 were attributable to particulate air pollution
(Defra 2016 and Public Health Outcome Framework (PHOF) 2015)
31469 deaths
People’s health can be harmed by poor air quality and noise, and lives can be lost and irreversibly changed by road collisions. Modelled estimates suggest 4.9% of all Hertfordshire deaths in 2015 in people aged over 30 were attributable to particulate air pollution (PM2.5). This would mean that an estimated 469 deaths were attributable to particulate air pollution17. Air quality limits are exceeded in a wide range of locations in the county.
Overall statistics suggest that the roads in Hertfordshire are safer than they were compared to the 2005-2009 average, with reductions in casualties and fatalities. However in 2014 there were still 2,634 reported collisions resulting in 3,690 casualties. Of these, 391 were classed as a Killed or Seriously Injured (KSI), with this comprising 34 fatalities including 2 child fatalities18.
road collision casualties with
classed as killed or seriously injured
(DfT Reported Road Casualty Statistics)
In 2016 there were
3,650
458(20 )of these
were fatalities
Improving transport links for the benefit of everyone in Hertfordshire and reducing any negative effects is a key priority for improving quality of life in the county.

42 Hertfordshire’s Local Transport Plan 2018
Objective Key IssuesMake journeys and their impact safer and healthier
• High levels of obesity among population and variable levels of physical activity a factor in health problems, lower life expectancy and quality of life.
• Air quality, noise and harmful emissions from transport a factor in poor health and premature death
• Road safety problems resulting in a high human cost but also economic costs and network disruption.
• Safety and security on the network impacting on accessibility and potentially reducing the propensity to walk, cycle and use passenger transport.
Improve access and enable participation in everyday life through transport
• Passenger transport supply issues (coverage of services, quality of service, frequency, cost).
• Constrained ability of public bodies to fund or support access solutions and services, with some of these having limited access due to eligibility, coverage, and/or times of operation.
• Demand issue relating to services becoming less accessible (centralisation of services in healthcare, more school choice).
• Risk of social exclusion for people who have limited or no access to a car or passenger transport and live in areas remote from services, notably rural areas.
Figure 5.4: “People” Objectives and Issues
PrinciplesIn addition to the themes and objectives, there are four principles which guide the strategy for delivering these objectives.
IMPLEMENTATION
VISION
OBJECTIVES
POLICIES
SUPPORTINGDOCUMENTS&FURTHERSTUDIES
PR
INC
IPLE
S
KEYCORRIDOR&MAJORSCHEMES
Figure 5.5: The principles guide how the objectives will be delivered and apply to the policies and schemes in this LTP strategy and its supporting documents.

43Hertfordshire’s Local Transport Plan 2018
In delivering the LTP objectives it is important that our plans and strategies can demonstrate application of the following principles:
Application and adoption of technology
Technology already plays an important role in how we travel and how the transport system is managed and maintained. The scale of technological change could be substantial in future years, and it is vital transport planning embraces the potential and can adapt to new forms of mobility.
Cost effective delivery and maintenance
We remain in a period of reduced public service spending, where levels of future spending on transport services is uncertain. It is therefore imperative that improvements are delivered cost effectively, mindful of future maintenance costs and liabilities.
Integration of land use and transport planning
Changes in land use (such as new homes and employment areas) impacts greatly on the transport system, but improvements in transport provision can also support and facilitate new land use opportunities. Closer and more integrated planning of transport and land uses, whilst a challenge because of the various agencies involved in land use planning and transport service provision, is key to creating efficient, effective and sustainable transport systems.
Modal shift and encouraging active travel
Achieving a modal shift in future years away from car use to more sustainable modes such as passenger transport, walking and cycling will greatly support delivery of the LTP objectives. The potential public health benefits of increased levels of active travel indicate this should be a high priority, and a key feature of the future transport system we are planning for.
Figure 5.6: The Four Principles for LTP plans and strategies

44 Hertfordshire’s Local Transport Plan 2018
6. Policies and Activities• Alltransportmeasuresdeliveredbythe
countycouncilmustbeinaccordancewiththeLTPpolicies.
• ThesepoliciessupportdeliveryoftheLTPobjectives.
Figure 6.8 at the end of this chapter summarises how the policies detailed in the following sections align with the LTP4 Objectives and Principles. The figure also includes section and page number information to assist readers in locating specific policies.
A) Achieving travel demand reduction and modal shift: A Transport User Hierarchy
Context The Transport User Hierarchy is a new LTP policy and sets the scene for the rest of the policy framework that follows. It represents a shift in emphasis to increase rates of travel by more sustainable modes than previous LTPs. The policy applies to both the scheme design process and the formulation of transport strategy. The policy is not anti-car and car use is recognised as being an essential part of the county’s future transport system. Instead it seeks to increase the attractiveness of alternative forms of travel, so that those trips that can only feasibly be made by the car can be undertaken without suffering the effects of a significant worsening of congestion.
Nationally roads and streets over the past 60 years have largely been designed, maintained and improved around the needs of the motor car. The needs of other transport modes have tended to be been a secondary consideration. This has often served to marginalise provision for active and passenger transport modes, reducing their attractiveness and usage. It has also been to the detriment of the local environment, public realm and public health.
As travel demand has increased, towns designed to accommodate high levels of accessibility by private cars have experienced increased levels of urban traffic and congestion. Further highway capacity increases, via new link roads and junction improvements, may address congestion in the short term but often either shift the problem to other pinch points further along the network or just fuel traffic growth and further congestion in the longer term.
Manual for Streets (2007) is a government design guide for residential streets, and one of its key principles is the application of a user hierarchy in the street design process which places sustainable mode considerations above those of general traffic. Manual for Streets 2 (2010) clarified how Manual for Streets guidance had wider application in urban and rural situations. Much of the guidance, including application of the user hierarchy, can be applied to all non-trunk roads regardless of the speed limit.
Within the adopted and emerging district and borough council Local Plans in Hertfordshire there is emphasis on good passenger transport provision, improved walking and cycling environments and attractive public realm. The user hierarchy policy will support the delivery of local plan objectives and visions for their areas.

45Hertfordshire’s Local Transport Plan 2018
Policy 1: Transport User HierarchyTo support the creation of built environments that encourage greater and safer use of sustainable transport modes, the county council will in the design of any scheme and development of any transport strategy consider in the following order:
• Opportunities to reduce travel demand and the need to travel
• Vulnerable road user needs (such as pedestrians and cyclists)
• Passenger transport user needs• Powered two wheeler (mopeds and
motorbikes) user needs• Other motor vehicle user needs
ApplicationThe policy applies to three areas of transport service delivery. Firstly, it applies to the development of transport strategies such as this and other LTP4 supporting documents and local transport studies. It should be a feature of transport strategies to support the growth outlined in district and borough Local Plans. By considering the opportunities to reduce travel demand and the needs of more sustainable forms of transport first they are not overlooked and are fully considered at an early stage in the strategy development. The needs of the motor vehicle are not ignored, but the policy ensures they do not take precedence over considerations higher up the hierarchy. Where there is a good opportunity to reduce the demand for travel, or to better serve the needs of walkers or cyclists, there needs to be good justification for it not being taken.
Secondly in the design of a transport scheme, the application of the hierarchy should be a feature of the design process, and the final scheme should be able to demonstrate how the hierarchy is reflected in it. Clearly where the needs of certain groups in the hierarchy are low, or the opportunities to reduce travel demand are limited, the design would be primarily driven by the needs of motor vehicles. This could be the case in non-urban areas, not served by passenger transport and with potential for vulnerable user demand. Vulnerable road users primarily include pedestrians and cyclists (including those on electric bikes), but also equestrians. The policy does not mean every road scheme will include a cycle path, or that pedestrians and cyclists will have priority at every location, but where there is considered to be a valid and practical need for this it should be included in the design, and evident in the final scheme.
In this policy context, passenger transport refers to transport available for use by the general public including bus, coach, rail and taxi.
Thirdly the hierarchy should apply to the planning and design of new developments, as recommended in the guidance in Manual for Streets, see Policy 5 (Development Management) for more coverage.
Depending on the location, and in certain circumstances, there may be an additional subset of considerations for classes of motor vehicles, such as drivers with impaired mobility, emergency service and refuse vehicles, taxis, freight and deliveries. Other LTP policies (e.g. concerning Network Management) would also apply in the consideration of the needs of this group.
Opportunities to reduce the need to travel could include opportunities to support home working and virtual access to services, broadband coverage and digital connectivity, proximity and access to key services, parking provision and cost. The potential and relevance of each would depend on the scheme or strategy coverage, and the location.

46 Hertfordshire’s Local Transport Plan 2018
OutcomesThe intention of this policy is to mainstream the modal shift aspirations of the LTP strategy into every area of transport operation and improvement in the county, and guide investment priorities. The built environment will then gradually evolve to become more favourable to travel by sustainable modes, with roads and streets serving all users in a more balanced way. This will result in a more efficient transport system, reduced environmental impact, increased active travel and improved public health.
Relevant Supporting Documents• Active Travel Strategy
• Growth and Transport Plans
• Highways Infrastructure Asset Management Plan
• Intalink Bus Strategy
• Network Management Strategy
• Roads in Hertfordshire
• Road Safety Strategy
• Rights of Way Improvement Plan
• Air Quality Strategy
• Rural Transport Strategy
Monitoring PerformanceMonitoring of this policy will be focussed on ensuring it is embedded in county council activity, and is evident in schemes and strategies. The policy will support numerous other LTP4 policies and monitoring of these will be detailed in subsequent sections within this chapter.
B) Influencing Travel BehaviourBehaviour change in the way people travel is necessary to reduce future levels of traffic growth, congestion and the need for excessive road building. It will encourage a shift to more sustainable modes of transport and supports most of the LTP objectives across all three themes. Modal shift and supporting active travel is an LTP4 principle, and other LTP policies will also support activity to encourage
the adoption of more sustainable travel behaviour.
This section outlines specific policies in support of behaviour change. These being:• Influencing strategic land use planning
(such as encouraging highly accessible developments and mixed land use)
• Travel plans and behaviour change
• Demand management
The county council’s role in supporting improvements in virtual connectivity such as broadband coverage is also discussed, recognising this as an enabler of behaviour change.
The application of behaviour change activity is not limited to this section of the strategy. Promotions, marketing, information and journey planning tools will also play an important role in encouraging and supporting people to reconsider their travel behaviour. Such activity is a feature of subsequent sections and policies, such as active travel, buses, accessibility and rail.
Influencing Land Use Planning
ContextAn LTP4 principle is the need to integrate land use and transport planning, with the reasons for this given in earlier sections. Land use planning policies and decisions can have a significant bearing on the potential for a more sustainable transport system, by increasing the potential for walking and cycling, and the viability of passenger transport provision. As outlined in earlier sections the pattern of land use development to 2031 is now largely set, but the pattern of land use development beyond 2031 will have significant transport implications (see chapter 4 Drivers of Change and Hertfordshire Futures). It is essential that at the very earliest stages of land use development options consideration, the implications and potential transport opportunities are fully appreciated, and serve to guide decision making.

47Hertfordshire’s Local Transport Plan 2018
The Government’s National Planning Policy Framework (NPPF) recognises that transport policies have an important role to play in facilitating sustainable development and places emphasis on developments being encouraged in areas served by high quality passenger transport. Patterns of growth should be managed to make the fullest possible use of passenger transport, walking and cycling, and focus significant development in locations which are or can be made sustainable. Higher development densities and a mix of land uses can encourage more local travel patterns and reduce journey lengths.
Some large employment sites in the county are remote from transport interchanges and so do not optimise access by high quality passenger transport. This increases reliance on the car, and reduces the labour market catchment. Some of the county’s largest employment centres can be found at Maylands Business Park in Hemel Hempstead, Hatfield Business Park and Watford town centre. Within a 60 minute travel time by passenger transport the labour market catchments of these sites are 488,000, 650,000 and 1.12million people respectively19. Proximity to London is a factor in this significant variation, but so is the proximity of the employment area to passenger transport hubs, especially rail stations (Maylands in particular and Hatfield Business Park to a lesser extent are remote from the nearest rail stations).
Policy 2: Influencing land use planningThe county council will encourage the location of new development in areas served by, or with the potential to be served by, high quality passenger transport facilities so they can form a real alternative to the car, and where key services can be accessed by walking and cycling.
ApplicationLater sections in this chapter on Managing New Development (section C) will cover the transport considerations regarding the layout and design of new development.
This policy applies much earlier in the process to influence the location of the development. In recent years changes to the planning system have tended to separate land use planning and transportation planning even further. As a result in Hertfordshire the spatial patterns of allocated development sites, although potentially suitable in other respects, do not easily support the delivery of sustainable transport solutions.
The next round of Local Plans for the period beyond 2031 will need to adopt a different approach, incorporating sustainable transport solutions from the beginning. To facilitate such a change in approach, this LTP has outlined a limited number of strategic spatial options for development post 2031 (see page 16), and outlined the transport implications and requirements of each pattern of development.
It is intended that this high level work will be incorporated into whatever strategic spatial planning is undertaken for the period post 2031. At present planning authorities in Hertfordshire are examining a range of options for how strategic planning and infrastructure delivery might be better delivered going forward and it is hoped this will better integrate land use and transport planning.
As demonstrated by analysis of the labour market catchment of some of the county’s key employment sites by passenger transport, the proximity to rail stations and other high quality passenger transport such as bus rapid transit makes a significant difference to the accessibility of land. Accessibility analysis looking at labour market catchment and range of destinations and employment centres within certain travel times should inform land use planning decisions.
In addition, the major schemes outlined in chapter 7 present opportunities for additional land use development to be supported, in excess of current Local Plan allocations. This should be a consideration in their design and implementation, enhancing their benefit and deliverability.

48 Hertfordshire’s Local Transport Plan 2018
Travel Plans and Behaviour Change
ContextNationally there is evidence that a combination of hard (infrastructure such as improved footways, cycleways and crossing facilities) and soft interventions (travel planning, promotions and marketing) are more effective in achieving changes in travel behaviour than if a hard or soft intervention was delivered in isolation20.
People are most susceptible to changing travel behaviour during particular transitions in their lives. This includes changing schools, moving house and changing jobs. Travel planning activity is a proven technique which can support people to reconsider their travel behaviour particularly at these life stages. They can also assist with better understanding travel needs and barriers, and facilitate the identification of any improvements in provision. The NPPF requires travel plans for all development generating significant movement.
Commuter and school travel make the largest contribution to peak travel, when traffic levels and congestion are greatest. This travel behaviour should therefore be a focus to tackle traffic growth and congestion. Encouraging travel behaviour change remains a challenge in Hertfordshire, in particular for work journeys as car travel is still perceived as superior in terms of reliability and quality compared with passenger transport alternatives. However where alternative travel options exist, or where these will be enhanced in future years, there is a need to support activity that encourages people to reconsider their travel habits and improve and increase awareness of alternative travel options.
Traditionally, despite the benefits offered by travel planning there has been a low level of engagement with the county council from businesses and developers, and the coverage and quality of travel plans inconsistent. Travel plans have been secured by planning condition, with reliance on the district and borough councils to manage enforcement. The enforcement of travel plans competes with other priority areas for enforcement team
resources, and has therefore generally been weak or ineffective.
Travel plans can be cost effective for businesses and improve access by solving car parking issues. Effectively managing a business’s journeys will reduce costs associated with business travel such as staff expenses, car park charges and fleet management costs, saving the organisation money and time. Travel plans can help to improve staff retention and recruitment by offering better access to workplaces, enabling Hertfordshire to attract employees and aid the local economy.
School travel plans are a proven method to achieve reduced car use and increase active travel among young people. They can be voluntary or secured through the planning process. However, increases in journey length for education trips and increases in ‘trip-chaining’ where people combine trips for two or more journey purposes, such as dropping off children to school, commuting and shopping, is making it harder to achieve modal shift away from cars.
Residential travel plans are secured through the planning application process and offer a package of measures designed to reduce the number of car trips made from new residential developments and support sustainable modes to improve accessibility and reduce congestion. Residential plans are tailored to a particular residential development to include measures such as better walking and cycle provision and enhanced passenger transport. These should be supported by measures such as travel guidance, incentives, marketing and promotional events.
The County Council will work with hospital and to develop suitable travel plans.

49Hertfordshire’s Local Transport Plan 2018
Policy 3: Travel Plans and Behaviour ChangeThe county council will encourage the widespread adoption of travel plans through:a) Working in partnership with large
employers, businesses and other organisations to develop travel plans and implement Smarter Choices measures.
b) Seeking the development, implementation and monitoring of travel plans as part of the planning process for new developments.
c) Supporting school travel plans, and working closely with parents, pupils, teachers and local residents to deliver a network of more sustainable transport links to school.
The application of personalised travel planning techniques, marketing and other behavioural change initiatives will be considered when delivering physical transport improvements to maximise the potential to achieve modal shift.
ApplicationThe county council will support and encourage travel plans for existing employment sites where organisations voluntarily write and submit travel plans. By working in partnership and engaging with large employers and businesses, the council will play a positive role in promoting and offering guidance for sustainable travel in the development of travel plans and encourage the implementation of Smarter Choices measures. Smarter Choices is a collective title for a range of measures that can encourage reduced car use. They include all forms of travel planning, but also information provision, marketing, car sharing, tele conferencing and home working. An example of this has been the council’s support for a large locally based pharmaceutical company in implementing a voluntary travel plan which included stronger management of car parking, strong promotions and uptake of their own lift sharing scheme and shared parking bays. Discounts and subsidies were made available
for staff on train and shuttle bus services, and staff engagement was offered by positive promotions, training and induction for active travel measures as part of employee wellbeing and health.
The county council has adopted travel plan guidance (www.hertfordshire.gov.uk/travelplans) with clear criteria for businesses and developers to meet, and outlined a more effective approach for securing plans. Travel plans can be secured through a Section 106 planning obligation, and include a financial contribution to meet the resource requirements of the county council providing support to the developer over an extended period. The county council will seek to work more closely with district and borough councils to build a greater awareness of effective travel planning. This will enable the county council to enhance its involvement in the development, implementation and monitoring of travel plans to high quality and consistent standards
Case Study: The Warner Brothers Studios in Leavesden is the single largest tourism draw in Hertfordshire, attracting as many as 6,000 home and international visitors per day. Secured through the planning process, a travel plan for the site was developed with support and advice from the county council. The plan featured a number of effective measures which have been important in addressing visitor and staff travel behaviour.
From 2012 to 2015, mode share of visitor arrivals fell from 80% by private car to 50% (surpassing a target of 70%), and staff arrivals by single occupancy car fell from 88% to 61% (target 78%). A subsidised shuttle bus service 311, operating regularly between Watford Junction rail station and the site, and free staff travel on local bus 318 have made a substantial contribution to the travel plan’s success. The site also seeks to recruit locally where possible, and in 2015 60% of employees lived within 10 miles of the site; up from 15% in 2012.

50 Hertfordshire’s Local Transport Plan 2018
Travel plans should consider the role that shared mobility initiatives could play in meeting travel needs. This is of particular relevance to work place and residential plans, where the employer or developer may make provision for a car club, lift share or bike club scheme as part of their travel plan.
The county council supports school travel planning by encouraging schools to adopt the Modeshift STARS scheme. This is an award scheme established to recognise schools that have demonstrated excellence in supporting active and sustainable travel. The council has a dedicated team in place to work on the development of travel plans across the county. The team works directly with schools to provide direction and support, resulting in a tailored travel plan suited to the individual needs and circumstances of the school. A considerable amount of work has been carried out to determine accessibility to schools and further work to obtain baseline school travel data is being undertaken.
The Sustainable Travel Town major schemes detailed in chapter 7 will exhibit what can be achieved by a comprehensive package of ‘hard’ and ‘soft’ measures to encourage behaviour change. This could include measures such as personalised travel planning where people are given advice and provided with information to help them reconsider their travel choices. The council will also seek to deliver such ‘soft’ behaviour change measures where there are opportunities, and subject to funding, when delivering sustainable transport improvements in other locations. This will be a feature of future capital bids for schemes, but should also be a feature of schemes that may come forward from developer funding.
Demand Management
ContextThere is currently great potential for mode shift in the county and existing travel behaviour represents an inefficient use of road space. Around half of the commuters in local towns including Watford, Hemel Hempstead, Welwyn Garden City, St Albans, Cheshunt, Letchworth Garden City and Bishop’s Stortford
who live in the same town in which they work, travel by car. Additionally there is a lot of short distance interurban commuter travel in Hertfordshire, that could readily transfer to rail, bus or car share.
Local policies and approaches to date, which have largely focussed on trying to improve sustainable mode provision and encourage people to use them, have not been sufficient to generate any notable change in travel behaviour. Evidence nationally, as exhibited in London and towns such as Oxford and Cambridge illustrate that higher levels of sustainable mode use can be achieved by deterring car use through car park and access charges, and lower levels of parking provision in urban centres. It can also include the reallocation of road space from general traffic to sustainable modes, or restricting vehicles and through traffic (this includes filtered permeability, a technique that maintains walking and cycling access, but restricts vehicles flows). This should be in conjunction with improved provision for sustainable modes, such as better walking, cycling and passenger transport provision. The lesson learnt from comparing modal shift results from the Local Sustainable Transport Fund projects in Hertfordshire, West of England and Slough (see page 30), was that reductions in single occupancy car use were more likely to be delivered when accompanied by reductions in parking spaces alongside sustainable transport promotion.
Demand management interventions such as congestion charging and parking charges can also provide a revenue stream that can facilitate investment in sustainable transport. Nottingham City Council have used a workplace parking levy to fund improvements in their tram and bus system, and similar schemes are being investigated by Oxford and Cambridge to fund sustainable transport investment. Additional sources of revenue funding such as these could be vital in Hertfordshire to bring forward transport improvements and fund behaviour change interventions.

51Hertfordshire’s Local Transport Plan 2018
Currently in Hertfordshire car users are well catered for with typically generous car parking supply at relatively low cost. Stevenage illustrates that despite having a good sustainable travel infrastructure (comprehensive bus network and high quality segregated cycle network), and a large proportion of local residents working in the town, rates of car use for urban journeys are very high (63%) and worse than other similar sized towns21. A major reason for this is ample and cheap car parking that makes car use the easy option, even for people with good alternatives. Here and elsewhere many employers provide free car parking to staff on their land which usually comes at a cost to the employer but represents a subsidy to car users.
The LTP future scenarios testing exercise identified demand management as a policy intervention which aligned well to all the future scenarios considered, given its role in managing congestion and supporting improvements to both urban accessibility and environment. It would play a role both today and in a world of widespread autonomous vehicle use.
Policy 4: Demand ManagementThe county council considers greater traffic demand management to be essential in the county’s urban areas in the next five years to achieve modal shift and improve sustainable travel provision. This can only currently be achieved efficiently and effectively through parking restrictions and charging applied to on-street, off-street and potentially at workplace parking. The county council will work with the district and borough councils and other key stakeholders to develop locally appropriate strategies.
ApplicationProgress on implementing demand management approaches is needed in the next few years to start encouraging a change in travel behaviour in the county in advance of the bulk of new housing development being delivered and prevailing travel behaviour
becoming entrenched. Parking provision, charges and controls offer the only viable method of achieving demand management and potentially generating funding for sustainable travel improvements in the medium term. There is currently no prospect of a national road user charging scheme coming forward anytime soon, and a local scheme would be too costly and inefficient to operate. In conjunction with parking demand management interventions, other forms of demand management could be considered such as the reallocation of road space or restrictions on traffic flows where this could enhance walking, cycling or passenger transport provision.
Any proposals need to come forward in partnership with the other local planning authorities and local stakeholders, and would need to be tailored to specific locations where sustainable travel options exist or can be improved so there are real alternatives to car travel available. Proposals should align or be part of local parking policies so that decisions on parking standards and provision complement efforts to reduce demand for car use. Given significant investment in sustainable modes would represent less value for money without a demand management approach in place, those areas that progress demand management schemes should be prioritised for sustainable travel investment. Additional revenue streams generated can then be used to match fund or borrow against, as well as sustain modal shift efforts.
Not everyone subject to demand management policies will have viable alternatives to the car but they would benefit from reduced congestion and more reliable journeys. Other options available to them could include working from home or lift sharing, which would lessen any negative impacts from the demand management policy. Only by providing this nudge are people likely to reconsider their habitual travel behaviour.

52 Hertfordshire’s Local Transport Plan 2018
Digital ConnectivityReducing the need to travel by people working at home, accessing services via the internet and teleconferencing at work will be dependent on sufficient broadband or mobile phone connectivity. Other areas of transport provision covered in this LTP such as the dissemination of travel information and gathering of data to better plan and manage the transport system will also be dependent on this virtual connectivity. In future years we are likely to become even more heavily dependent on digital infrastructure, and could be frustrated in the adoption of new technology and transport systems if this infrastructure s inadequate in terms of coverage, speed and capacity.
The county council is part of the Connected Counties Programme which in partnership with BT, aims to ensure universal access to superfast broadband. This has seen the council successfully extend its superfast broadband access to 90% of homes and businesses by early 2016. By September 2017 it is planned to have 95% coverage and by 2019 beyond 97% coverage. The council is currently investigating options to extend access to superfast broadband to the final percentage of Hertfordshire premises.
The Government has worked with Openreach and the Home Builders Federation (HBF) on an agreement which aims to deliver superfast broadband connectivity to new build properties in the UK. The new arrangement will see fibre based broadband offered to all new developments either for free or as part of a co-funded initiative. This is dependent on developers engaging with Openreach at an early stage in their development planning, and the county council will work with local planning authority partners to ensure this is happening.
Mobile phone coverage is currently being market driven in the county and although coverage is generally good, there are still some black spots which will require new masts to improve mobile phone coverage and reliability.
OutcomesThe policies in this section seek to ensure that where there is potential to reduce the need to travel and encourage more travel by sustainable modes, it is supported by land use planning. Travel plans seek to encourage people and organisations to consider their travel options and behaviours and support ways of overcoming any barriers. Demand management provides the nudge for behaviour change and provides funding to support improved provision for alternative modes of travel to the car. The overall outcome being modal shift, reduced car use and increased walking, cycling and passenger transport.
Relevant Supporting Documents• Accessibility Strategy
• Growth and Transport Plans
• Hertfordshire’s Sustainable Modes of Travel Strategy (SMoTS)
• Intalink Bus Strategy
• Rail Strategy
Monitoring PerformancePercentage of sustainable mode share for Hertfordshire residents.
C) Managing New Development
Context The county council, as Highway Authority, is a key stakeholder in the planning process for planning applications of all sizes and has a key role in influencing and shaping future development to ensure it is safe, sustainable and viable from a transport perspective. This policy pays regard to the NPPF and its presumption in favour of sustainable development.

53Hertfordshire’s Local Transport Plan 2018
Policy 5: Development ManagementThe county council will to work with development promoters and the district and borough councils to:a) Ensure the location and design of
proposals reflect the LTP Transport User Hierarchy and encourage movement by sustainable transport modes and reduced travel demand.
b) Ensure access arrangements are safe, suitable for all people, built to an adequate standard and adhere to the county council’s Highway Design Standards.
c) Consider the adoption of access roads and internal road layouts where they comply with the appropriate adoption requirements and will offer demonstrable utility to the wider public. Where internal roads are not adopted the county council will expect suitable private management arrangements to be in place.
d) Secure developer mitigation measures to limit the impacts of development on the transport network, and resist development where the residual cumulative impact of development is considered to be severe.
e) Require a travel plan for developments according to the requirements of ‘Hertfordshire’s Travel Plan Guidance’.
f) Only consider new accesses onto primary and main distributor roads where special circumstances can be demonstrated in favour of the proposals.
g) Resist development that would either severely affect the rural or residential character of a road or other right of way, or which would severely affect safety on rural roads, local roads and rights of way especially for vulnerable road users. This should include other routes which are important for sustainable transport or leisure.
h) Ensure that any new parking provision in new developments provides facilities for electric charging of vehicles, as well as shared mobility solutions such as car clubs and thought should be made for autonomous vehicles in the future.
ApplicationThe county council will work in partnership with the district and borough councils, Highways England, developers and other key stakeholders to influence the shape of development in Hertfordshire. New development proposals are expected to support delivery of the LTP objectives and align with its policies, including those contained within any of its supporting documents. New developments should also adhere to guidance documents such as the county council’s Highway Design Standards (as outlined in Roads in Hertfordshire or any successor document to this), and any national design guidance this recommends such as Manual for Streets. In addition the county council has produced a Planning, Health and Wellbeing Guidance document developers are recommended to follow which aligns with the above policy.
As per NPPF guidance, and as detailed in the Roads in Hertfordshire guidance document, a Transport Assessment (TA) or Transport Statement (TS) will need to be submitted as part of the planning application for specified developments, so the effects of the development can be assessed by the county council. Full details, explanatory notes and guidance on TAs and TSs, including thresholds and development scenarios, are set out in Roads in Hertfordshire.
As stated in Policy 3 on page 49, travel plans are also an important tool in promoting and facilitating sustainable travel from new and existing developments. The NPPF requires that all new developments which generate significant amounts of movement have a travel plan. The county council has its own Travel Plan Guidance, which contains the details and thresholds for developments which require a travel plan and this should be followed.

54 Hertfordshire’s Local Transport Plan 2018
Primary and main distributor roads play a key role in the function of the road network and any new development proposing to have direct access onto these types of roads will only be considered in special circumstances. The Road Hierarchy for Hertfordshire and further detail on its implications are contained within the Network Management Strategy.
Hertfordshire is a largely rural county interspersed with a number of large towns and villages, including some areas with significant historic, natural and cultural importance. Where new development occurs, the related transport infrastructure should be designed and implemented with the aim of maintaining the existing character of an area, avoiding instances of community severance and maintaining residential and rural characters. Details for design of infrastructure are found in the Hertfordshire design guidance Roads in Hertfordshire with general network management principles and plans in the Network Management Strategy.
The transport impact from any new development should be mitigated as far as possible, so as not to severely impact upon the existing transport network. Therefore via the Community Infrastructure Levy (CIL), Section 106 planning obligations or planning conditions, the appropriate levels of financial contributions or mitigation measures will be sought from developers towards any interventions required to offset transport impacts.
Introduced by the Planning Act 2008 CIL is a planning charge designed to help deliver infrastructure to support the development of an area. The Levy came into force in April 2010 through the Community Infrastructure Levy Regulations 2010 (as amended) and changes the way developers pay contributions towards the development of infrastructure where the charge is implemented. County councils are not levy charging authorities but the local planning authorities (district and borough councils in Hertfordshire) are able to transfer CIL funds to service providers, such as the county council, to deliver infrastructure which supports the growth of their area. The adoption of a CIL charging schedule is
not mandatory and an up to date position is available by contacting the relevant charging authority. Planning obligations (as set out in section 106 of the Town and Country Planning Act 1990) are agreements made between local authorities and developers and can be attached to a planning permission to make acceptable development which would otherwise be unacceptable in planning terms. The CIL Regulations 2010 (as amended) introduced restrictions on the use of Section 106 planning obligations.
In line with the NPPF new developments should encourage sustainable modes of travel by incorporating facilities for charging plug-in and other ultra-low emission vehicles. Likewise new developments should promote shared mobility initiatives such as by providing for and supporting car club, car sharing and bike sharing initiatives. More details on these shared mobility activities can be found in Policy 6 on page 56.
OutcomesThe policy seeks to support delivery of development in the county, but in a way that is sustainable and contributes to other LTP4 objectives. Policy delivery as measured by the achievement of high level outcomes will therefore be reflected in the monitoring information associated with other policies (i.e. levels of congestion, walking and cycling levels etc) and is not repeated below.
Relevant Supporting Documents• Growth and Transport Plans
• Network Management Strategy.
• Roads in Hertfordshire
• Speed Management Strategy
• Rights of Way Improvement Plan
• Air Quality Strategy
• Rural Transport Strategy

55Hertfordshire’s Local Transport Plan 2018
D) Accessibility
ContextAccessibility is defined as people being able to access key services at a reasonable cost, in reasonable time and with reasonable ease. Typically key services include employment, education, health and food shopping. Users may be unable to access the key services because of a lack of passenger transport, or because they have mobility problems, a lack of private transport or are unable to afford the costs of travel. People living in rural areas are particularly disadvantaged as commercial bus services tend not to operate where passenger numbers are low and a bus service is financially unviable.
Figure 6.1 is a map of passenger transport access to key centres in the morning peak (7am-10am) and illustrates some of those areas likely to experience accessibility issues (no colour indicates those areas where travel time is in excess of one hour).
There are various forms of demand responsive transport that can assist in providing access to
areas without regular commercial passenger transport – i.e. transport that can be requested by clients often on demand for a fee. Taxis can be expensive if not shared between paying customers, but they can play their part in solving accessibility issues. There are also a few successful community transport schemes in districts, which in some cases operate in place of former bus services (see Sawbobus case study). The county council and Clinical Commissioning Groups support a range of door to door transport services, including:• Dial a Ride, a pre booked, accessible
transport service enabling elderly and disabled residents to retain their independence and access local services.
• Community and voluntary car schemes which link volunteers using their own vehicles, with residents who require some assistance, are less mobile and who cannot get to or onto a bus.
• Enabling disabled residents to retain their independence and access local services via private car ownership.
AM Peak Bus & Rail Access to Hertfordshire Key Centre Key Centres have been determined based on population size and employment opportunities.
Figure 6.1: Access to key centres by passenger transport in the morning peak period.
© Crown copyright and database rights 2018 OS EUL 100019606. You are permitted to use this data solely to enable you to respond to, or interact with, the organisation that provided you with the data. You are not permitted to copy, sub-licence, distribute or sell any of this data to third parties in any form.

56 Hertfordshire’s Local Transport Plan 2018
• Minibus schemes which operate minibuses that can be hired by community groups for group trips.
• Health transport which is provided by non-emergency patient transport to patients who have a medical need for transport to their hospital appointments.
Case Study: SawbobusSawbridgeworth Town Council launched Sawbobus in November 2009 to replace 3 bus services. This vital community service has proved popular with the town’s residents and in 2015 provided over 22,000 passenger journeys. Sawbridgeworth Town Council set up this service and receives grants from East Hertfordshire District Council, some councils in Essex and some commercial sponsors which help fund the service.
Accessibility is more than about transport provision. The delivery and location of services is also a factor, so too is the potential for technology to enable services to be accessed without the need to travel. The Internet and advances in mobile communication have meant that more people are accessing and receiving services in new ways minimising the need to travel. However this potentially creates new issues and a divide between those who have access to and can use new technology, and those that do not have access or cannot use the technology. Technology opens up many opportunities such as online shopping and possibly virtual health appointments. Other opportunities will no doubt follow as broadband becomes more widely available, technology becomes more sophisticated and people become more familiar with how to use it.
Transport disadvantaged groups considered a priority in previous plans for Hertfordshire are:• Elderly and physically disabled.
• People with learning disabilities.
• People, including young people, on low incomes.
• Residents living in rural parts of Hertfordshire without access to a car.
This is a sizeable proportion of the local population, with the number of over 65s and under 19s in the county’s rural areas alone totalling over 50,000 people. Resident survey data suggests some 7% of the county’s population do not find it easy to access key services, with 33% finding it difficult to access a local hospital22.
Since the last LTP accessibility assessment was conducted in 2004, a number of factors will have affected accessibility levels in the county. The county’s demographics have changed with an increase in older people. Government benefits have changed and some groups are no longer eligible for free transport. County council spending on bus subsidies has been reduced in recent years, resulting in service reductions. There has been a push to centralise acute health care services meaning people may have to travel further to reach them, there has also been a government agenda to increase school choice, impacting on travel distances and transport requirements.
Policy 6: AccessibilityThe county council will seek to increase the ease with which people, particularly disadvantaged groups, can access key services, by:a) Working in partnership with key
stakeholders such as bus and rail operators, community transport operators, the voluntary sector and public service providers.
b) Supporting transport services which could include providing resource for bus and other transport services.
c) Addressing the barriers to accessibility particularly regarding active modes and for people with impaired mobility.
d) Promoting travel options and facilitating accessible travel information provision, including open data initiatives.
e) Improving travel choices and options, including support for the provision of shared mobility initiatives.

57Hertfordshire’s Local Transport Plan 2018
ApplicationAn updated understanding of accessibility need in the county is required in light of changes in transport and service provision in the last decade. The LTP4 Accessibility Strategy will provide this improved understanding and inform work in areas such as:
• Utilisation of powers under the Bus Services Act
• Support for shared mobility, walking and cycling
• Rail strategy
• Support for buses and community transport
• Support for school and social care transport
It will seek to update our understanding of transport disadvantaged groups in the county, their access needs and barriers. Opportunities to better meet access needs will be identified to guide service planning and decision making. Engagement as part of this with service providers, transport operators, transport users and user groups will be essential.
The Total Transport concept (see case study) offers the potential to meet accessibility need in a more efficient manner by working in partnership with other stakeholders. In Hertfordshire around £28m per year of public money is spent on providing transport services for people to access services (subject to any eligibility criteria) such as schools, health and social care. Some of this is discretionary but the vast majority is a statutory requirement. Better integration and coordination of this spend, and the services it provides, potentially offers efficiencies. The county council is seeking to apply the Total Transport concept to Hertfordshire, but it is important it is guided by the new Accessibility Strategy.
Total Transport Total Transport is the integration of publicly supported transport services allowing existing resources to be allocated and coordinated more efficiently. In addition to better integrating county council operated services, it also aims to integrate services provided by other public agencies such as NHS patient transport services.
A Total Transport pilot fund was recently made available for local authorities to bid for resources to implement a cross-sector approach to the delivery of supported passenger transport services. Northamptonshire County Council received the largest award of £750,000, with the ambitious aim of bringing all transport together under the umbrella of a social enterprise, partnering with Northamptonshire University. Northamptonshire seek to draw in support from all interested parties, but on the basis that all must contribute something.
As well as potential efficiencies, the concept also results in the compilation of a large amount of travel data, enhancing understanding of local travel need and demand. It can also facilitate engagement and partnership working with other public agencies so accessibility becomes a more prominent consideration in their service design, planning and delivery.

58 Hertfordshire’s Local Transport Plan 2018
Meeting accessibility need in the county will require a mix of solutions. The accessibility strategy will consider how technology is meeting need without the need for physical travel. Community transport solutions are part of this mix and the county council will continue to support these. Shared mobility options such as lift share and car clubs will also be supported given the role these can play in meeting the needs of some groups. Policies 7 and 8 seek to improve walking and cycling provision and this can improve accessibility for those with impaired mobility. Other policies on demand management (Policy 4) and buses (Policy 9) can improve the viability, coverage and service level of passenger transport options and hence support improved accessibility.
The LTP future scenarios testing exercise identified a number of activities the county council could investigate to support shared mobility, which was recognised as likely to feature in all future scenarios considered. These are outlined on page 36. The Accessibility Strategy and other LTP supporting documents will consider these given their potential to support delivery of a number of LTP policy areas.
In the future, technology may support demand responsive transport to play a greater role in delivering more flexible services in areas where there are few or no traditional bus routes. Examples of this already exist such as some patient transport services, dial a ride and taxis. Technology will enhance the efficiency and customer interface of demand responsive services, reducing their cost and making them much more user friendly and responsive. Demand responsive bus demonstration projects are being piloted by operators in the country, and we will work with partners to develop such initiatives where relevant.
Accessible and easy to understand information on the full range of services available will be vital in supporting people to access services more easily. The county council will keep this under review and seek to facilitate improvements in this area, recognising the role smartphone application developers will play in devising solutions that best meet customer need.
There is a risk that accessibility solutions focussed on technology and access via websites and smartphones, will exclude those without access to this technology. The Accessibility Strategy will need to consider the ‘digitally excluded’ and identify recommendations to ensure they are not ignored.
OutcomesThe desired outcome from these policies is a more informed, targeted and efficient approach to meeting accessibility need in the county. This will support people to play an active part in society and live healthy and fulfilling lives.
Relevant Supporting Documents• Accessibility Strategy
• Growth and Transport Plans
• Intalink Bus Strategy
• Rural Transport Strategy
Monitoring Performance• Accessibility of new developments -
Percentage of new developments within 30 minutes by public transport of key services.
As part of the LTP4 Accessibility Strategy additional accessibility indicators will be developed.

59Hertfordshire’s Local Transport Plan 2018
E) Active Travel – Walking and Cycling
ContextActive travel helps to improve physical and mental health and reduce obesity. Obesity causes a range of chronic health conditions ranging from cardiovascular disease to dementia. Promoting and supporting active travel can also help address accessibility issues, reduce traffic congestion and improve the public realm. Urban realms that are conducive to cycling and walking can also benefit local economies, with higher footfall and retail spending. Physical activity can also help increase staff productivity and reduce absenteeism.
Statistics show that within the deprived areas in the county fewer people are physically active; increasing levels of walking and cycling in these areas, many of which are in larger towns, could play a role in addressing health inequalities. People who have some level of mobility impairment can also benefit from improvements in active travel infrastructure.
The Government’s 2017 Cycling and Walking Investment Strategy (CWIS) seeks to make cycling and walking the natural choices for both short and longer journeys, with more people having access to safe, attractive routes for cycling and walking by 2040. The Government recognises that achieving this ambition will take sustained investment in cycling and walking infrastructure, and requires long-term transport planning and a change in attitudes. “Walking and cycling should be seen as transport modes in their own right and an integral part of the transport network, where cycling and walking are the norm, rather than as niche interests or town-planning afterthought” (CWIS 2017).
The CWIS sets the following objectives for 2020:• increase cycling activity
• increase walking activity
• reduce the rate of cyclists killed or seriously injured on England’s roads
• increase the percentage of children aged 5 to 10 that usually walk to school
And these targets for 2025:• Double cycling from 0.8 billion stages (the
basic unit of travel in the National Travel Survey is a trip, and each change in the form of transport during a trip forms a new stage) in 2013 to 1.6 billion stages in 2025
• Increase walking activity to 300 stages per person per year in 2025
• Increase the percentage of children aged 5 to 10 that usually walk to school from 49% in 2014 to 55% in 2025.
Evidence accompanying the CWIS highlights that the most effective approaches at increasing walking and cycling activity comprise packages of hard (infrastructure) and soft measures (promotions, training and behaviour change activity). In isolation an infrastructure improvement or a promotional campaign is unlikely to be effective.

60 Hertfordshire’s Local Transport Plan 2018
Figure 6.2: Opportunities for Walking and Cycling in England identified in the 2017 CWIS
In Hertfordshire for trips less than 1 mile the mode share for walking is already quite high at 76.5% (County Travel Survey 2015). The potential to significantly increase walking activity by increasing this mode share, or the mode share for trips of greater distance may be limited. In contrast cycling has a much lower mode share (1.7% for trips less than 1 mile, 4.8% for trips of 1-3 miles, 3.1% for trips of 3-5miles) at distances that can be readily cycled. Given this current low mode share, and the greater realistic range of cycling, there is significant potential in the county to increase cycling activity.
Barriers to walking and cycling are similar – they come under the broad categories of safety and security factors, lack of physical infrastructure, social and cultural attitudes, weather conditions, purpose of the journey (e.g. carrying shopping), topography, health and a lack of knowledge, awareness, training or education.
Currently provision of cycling infrastructure in the county is variable. Stevenage generally has a very good cycleway network. However, the provision of cycling infrastructure in many other areas is patchy, with short broken linkages. Much of the current cycling network is not conducive to use by less confident cyclists. By embracing opportunities to improve cycling infrastructure as endorsed by the Government’s CWIS, cycling can become a much more attractive travel option in more areas and for a wider range of people.

61Hertfordshire’s Local Transport Plan 2018
Policy 7: Active Travel - WalkingThe county council will seek to encourage and promote walking by:a) Implementing measures to increase the
priority of pedestrians relative to motor vehicles, especially in town centres, and creating walking friendly town and neighbourhood centres.
b) Delivering infrastructure to provide safer access to key services, and pedestrian facilities to enable and encourage walking.
c) Identifying and promoting networks of pedestrian priority routes.
d) Promoting walking as a mode of travel and for recreational enjoyment.
e) Supporting the implementation of the Rights of Way Improvement Plan.
Policy 8. Active Travel - Cycling The county council aims to deliver a step change in cycling, through:a) Infrastructure improvements, especially
within major urban areas to enable and encourage more cycling.
b) Implementing measures to increase the priority of cyclists relative to motor vehicles.
c) Improved safety for users including delivery of formal and informal cycle training schemes.
d) Supporting promotion campaigns to inform, educate, reassure and encourage cycling provision and education, such as Bikeability.
e) Facilitating provision of secure cycle parking.
ApplicationGrowth and Transport Plans (Policy 23) and the Active Travel Strategy will consider what improvements are required to local walking and cycling networks. This exercise will utilise guidance and tools that have been published as part of the CWIS, such as on
the development of Cycling and Walking Infrastructure Plans. In some cases, particularly town centres, this could include greater pedestrian priority and reduced provision for motor vehicles. These networks will take advantage of existing green spaces where appropriate.
The Transport User Hierarchy Policy (Policy 1) will ensure the needs of pedestrians and cyclists are a prominent consideration of any transport scheme or strategy. High quality pedestrian and cycle environments will be a feature of new developments (Policy 5) in accordance with the Transport User Hierarchy Policy and local and national design guidance.
Given the Government CWIS targets and the significant potential to increase cycling activity in Hertfordshire, the county council is seeking to achieve a large increase in cycling activity over the next 10 years. This will require an increase in cycling infrastructure investment to create routes and networks which can attract a broader demographic to cycle. Achieving the necessary improvements in infrastructure and step change in cycling will require a targeting of resources.
The Propensity to Cycle Tool (PCT) developed as part of CWIS can indicate those areas where there is the greatest potential to facilitate increases in cycling activity. It does this by analysing data on commuting trips patterns and trip lengths from the census, and the local topography. This indicates where there is the greatest potential to switch trips from other modes to cycling. Figure 6.3 shows where the most popular cycling routes would be under a scenario where the government target to double cycling was achieved.
As a general principle it would be appropriate to provide enhanced infrastructure to encourage walking and cycling for journeys up to 3 miles within towns and up to 10 miles between towns but the local requirement will be determined by the tools referred to above.

62 Hertfordshire’s Local Transport Plan 2018
Figure 6.3: Propensity to Cycle Tool Output showing the 150 most popular cycling routes under a Government target scenario.
The greatest potential is clearly in the larger towns and urban areas in close proximity to each other. A conclusion of the LTP future scenarios testing exercise was that urban cycling infrastructure aligned to more future scenarios than inter-urban, and so there is greater confidence such investment will be of lasting relevance. It is these urban areas where investment in cycling infrastructure and promotion should be targeted, to make best use of resources and achieve a countywide step change in cycling activity. Evidence gathered as part of the CWIS indicates cycle routes must be of high quality and direct if they are to attract a broader range of people to cycle, of any age, fitness or gender. The Growth and Transport Plans and Active Travel Strategy will consider the evidence and options in greater detail to develop local schemes and initiatives. Whilst the PCT may not support investment in longer distance interurban cycle routes, there may be other benefits from these such as in support for recreational cycling and tourism, so where opportunities arise to implement
improvements, such as to serve new land use development, such schemes could be justified.Improved cycle network mapping and information on mobile phone applications will also make a difference to the take up of cycling as a mode of transport. The Active Travel Strategy will consider current provision and identify any improvements required.
Cycling needs to be seen as part of the door-to-door journey and should be linked to the interchange/mode integration aims of bus & rail strategies (see Policies 9 and 10). Station and town centre redevelopment projects will provide opportunities to deliver improved modal integration.
Segregation from traffic is likely to be required where cycle routes are identified along busier and faster moving roads to reduce road casualties and to make cyclists feel safer. The Active Travel and Road Safety Strategies will set more specific policies and guidance on infrastructure required. The county council will keep under review the role 20mph limits
© Crown copyright and database rights 2018 OS EUL 100019606You are permitted to use this data solely to enable you to respond to, or interact with, the organisation that provided you with the data. You are not permitted to copy, sub-licence, distribute or sell any of this data to third parties in any form.

63Hertfordshire’s Local Transport Plan 2018
can play in this, given these are being used elsewhere in the country to improve road safety and encourage more cycling.
Electric bikes offer significant potential to attract more people to cycle, and address barriers to cycling such as challenging topography. These bikes are currently quite expensive but could play a greater role in local transport provision if they were a feature of cycle hire/bike club schemes. This form of shared mobility could be a feature of local transport strategies and will be considered in greater detail by Growth and Transport Plans and the Active Travel Strategy
The Active Travel Strategy will inform future promotions, education, training and marketing campaigns for walking and cycling. This will include continued support for Bikeability courses which have already provided cycle training to 50,000 children and adults since 2006, and events such as the Tour of Hertfordshire Series. The strategy will consider the role new technology can play, this could include information provision on walking and cycling routes, and monitoring devices that track and reward physical activity. Other LTP4 policies on travel plans and demand management will also support behaviour change efforts and the promotion and encouragement of walking and cycling.
Under the Countryside and Rights of Way (CRoW) Act (2000) the county council is required to publish a Rights of Way Improvement Plan (RoWIP) explaining how it will maintain and keep the ‘Definitive Map & Statement of Public Rights of Way’, and ensure that routes are adequately signposted, maintained and free from obstruction. RoWIPs are the prime means by which Highway Authorities identify the changes and improvements to local rights of way networks, in order to meet the Government’s aim of better provision for walkers, cyclists, equestrians and people with disabilities. The existence of public rights of way encourages recreational walking as well as
providing access to key services in and around urban areas.
Often using Hertfordshire’s Rights of Way network, the Countryside Management Service (CMS) administers a growing number of Health Walks in the county, as well as planned activities including walks, cycle rides and family events led by someone familiar with the area; it also produces a range of online maps to encourage people to walk and cycle. Thus CMS encourages people to walk with others as a leisure activity, which frequently leads to utility walking.
The county council, in liaison with Hertfordshire Planning Group which brings together the county’s local planning authorities, is developing an approach to facilitate delivery of green infrastructure in Hertfordshire. This will highlight the key issues with managing green infrastructure in the county in the future, including its role in supporting and improving sustainable active travel, rights of way, health and wellbeing.
OutcomesBy facilitating increases in walking and significantly increasing cycling activity these policies will deliver improvements in public health, air quality, road safety, the local economy, public realm, accessibility and the environment. They will also support traffic and congestion reduction.
Relevant Supporting Documents• Active Travel Strategy
• Growth and Transport Plans
• Rights of Way Improvement Plan
• Road Safety Strategy
• Speed Management Strategy
• Sustainable Modes of Travel Strategy
• Rural Transport Strategy

64 Hertfordshire’s Local Transport Plan 2018
Monitoring PerformancePercentage of sustainable mode share for Hertfordshire residents.
F) Buses
ContextBuses make a substantial contribution to the UK and Hertfordshire economy, accounting for 37 million passenger journeys in the county in 2015/16, and around 5 billion journeys nationally23. They make more efficient use of road space to transport people than the private car, reducing volumes of congestion and improving traffic flows for all.
More than 17,000 Hertfordshire residents rely on buses as their main mode of travel to work, and in addition to those on private school coach services, around 15,000 pupils use the local bus network to get to their place of education24. Major employers across the county value bus access to their sites, contributing directly to the provision of some public and private routes. Although the overall mode share for buses in Hertfordshire is less than the national average, bus journeys account for approximately 7% of all trips in the county between 3 and 10 miles25.
Buses provide an important social function, increasing access to vital services including education, healthcare and shopping. In a county with levels of car ownership well above the national average, there remain 17% of households where no car is available, and therefore to whom the bus is a vital lifeline26. A further 42% of Hertfordshire households have access to a single car27, often leaving others in the household reliant on other transport modes.
The bus also has a central role to play in contributing to environmental outcomes, through more efficient movement of people and in reducing emissions. The Euro 6 emissions standard for new vehicles provides an estimated 95% reduction in emissions of particulate matter and 75% reduction in nitrogen oxides from previous standards.
Hertfordshire’s bus network is dominated by services operated commercially, with a primary role played by Arriva, Uno and Centrebus. Transport for London provides a number of cross-boundary routes to and from Borehamwood, Potters Bar, Waltham Cross and Watford. The operation of commercial bus routes relies on passenger demand, and extensive urban bus networks require populations which are sufficiently high, densely distributed, and willing to use public bus services. The county’s polycentric population distribution and socio-economic characteristics result in a network with a number of inter-urban corridors and town services. Some of these offer high frequency and attract operator fleet investment; in other areas demand is lower and these less profitable routes are catered for by less frequent services, which may be perceived as less attractive.
Recent investment by Arriva in the Lea Valley between Hertford and Waltham Cross, illustrates providers are prepared to invest in better services. The county council must therefore adopt policies which protect, maintain and improve Hertfordshire’s attractiveness as a place for operation and investment, particularly where large companies may opt to invest elsewhere in the country or in other markets.
In 2016/17 86% of bus services in Hertfordshire ran on time, compared to a national average of 82% in 2015/16. In the years 2010 to 2016, bus punctuality in Hertfordshire remained above 90%28. Passenger research indicates that improved punctuality is a priority for bus users, and with increasing traffic congestion it is likely that bus priority infrastructure will be necessary to maintain standards29.

65Hertfordshire’s Local Transport Plan 2018
As with all areas in England outside London, Hertfordshire’s bus market is deregulated and influenced primarily by passenger demand. However, a minority of bus services (around 6% by patronage) are contracted to the county council, to support socially necessary journeys. These typically run through rural areas but also provide some important links within towns where they cannot be accommodated commercially. The county council, national government (through the Bus Service Operators Grant) and a number of other Hertfordshire local authorities contribute to the funding available to support such routes. The bulk of the local bus budget is allocated to support services on the basis of their calculated value for money, the criteria for which were reviewed in September 2015 in light of financial pressures on the public sector. Other sources of funding for contracted bus services in the county include developer contributions and bids to specific national government grants.
The county council also supports the development of the county’s bus network through investment in transport-related infrastructure and technology, and promotes bus travel and concessionary fares schemes. Hertfordshire has invested in the provision of electronic departure displays at all key bus interchanges and at many other points on main corridors. With the introduction of automatic vehicle location on most fleets we are able to show real-time information for the majority of bus departures, a major benefit for passengers.
The county council works in collaboration with other stakeholders (district and borough councils, bus operators and train operating companies) to enhance facilities at key bus interchanges including those at railway stations. These may include upgraded bus shelters, new and improved electronic departure displays, and comprehensive timetable information. The council also provides “onward travel by bus” information at rail interchanges under local agreement with the train operating companies which fulfils their rail franchise obligations to the Department for Transport and supports multi-modal travel.
The county council is responsible for the English National Concessionary Travel Scheme which has 180,000 pass holders and a value of over £12 million30. Hertfordshire SaverCard is a 50% discount card for children 11-18 years old, with over 15,000 children registered for this discount card and take up increasing every year31.
Recent national research has demonstrated the value for money of supporting local bus markets, with a benefit cost ratio of £3.80 for every £1 invested in concessionary travel for older and disabled people, £2.50 for every £1 invested in supported bus services, and as much as £5.00-£8.00 for every £1 invested in bus priority and infrastructure measures32.

66 Hertfordshire’s Local Transport Plan 2018
Policy 9: BusesThe county council will promote and support bus services to encourage reduced car use by:
a) Supporting the delivery of infrastructure including bus priority measures, focussed on a core bus network, and by minimising bus service disruption from road congestion and the effects of road works.
b) Providing and maintaining all bus stops, and other bus related highway infrastructure, to a consistent quality and standard across the county.
c) Utilising new powers afforded to local authorities through the Bus Services Act 2017 as appropriate.
d) Reviewing, procuring and supporting cost effective and efficient bus services to improve accessibility and respond to existing and potential passenger needs. Review existing services and take account of enhanced security provision.
e) Working with a wide range of partners through the Intalink Quality Partnership to achieve improvements in facilities and services to improve the end to end journey by multi-modal interchange, accessibility, security and the journey experience.
f) Working with partners to develop appropriate passenger fares, encourage the development of smart ticketing and to improve the provision and accuracy of passenger information.
g) Working with partners to promote bus services as an option for work and school journeys, and promote and publicise the passenger transport network through a variety of media.
ApplicationHertfordshire has a long-standing form of collaboration between local authorities and bus and rail companies which started as the Intalink Partnership in 1999. Now the Intalink Quality Partnership, having subsumed the roles of individual Quality Network Partnerships, provides a forum for councils and operators to work together in a proactive, structured and co-ordinated fashion to enhance the network and improve the service to passengers. In addition the partnership enables the facilitation and marketing of multi-operator ticketing which can be used across the network. The Intalink branding enables an integrated and consistent approach to the provision of publicity and information for the whole bus network.
The Intalink Explorer ticket allows individual or group travel across the whole county and on many cross-border services into neighbouring counties. BUSnet tickets are another form of multi-operator product available for specific areas, and will be considered for other areas of the county where there is a benefit to passengers. Hertfordshire also participates in the national “Plusbus” combined rail and bus ticketing schemes, with the facility available from most railway stations in the county.
M-ticketing is available and enables passengers on some services to purchase bus tickets in advance of travel through the Intalink mobile app. This is a step towards paperless ticketing and helps to reduce boarding times on buses and assists with reliability. Smart ticketing is being introduced, with the Hertfordshire SaverCard now issued on smart cards, and tickets for home to school transport will be smart from September 2017. Future opportunities exist to expand smart ticketing for bus and multi-modal travel, and may support the emergence of Mobility as a Service.

67Hertfordshire’s Local Transport Plan 2018
The county council will work with Intalink Partnerships and other bus and rail operators to improve multi-modal interchange and coordinate scheduling bus services with rail services and also integrate with partners such as TfL to support current and new bus services.
If traffic volumes continue to grow as forecast, it is likely that increased bus priority will be required to maintain bus service viability, punctuality and encourage modal shift. It plays the role of managing travel demand by private car and supporting passenger transport, and is adaptable to future transport uncertainties.
Bus priority measures may include for example bus only links, signal prioritisation and bus lanes, and would be brought forward in partnership with operators and through Growth and Transport Plans. Investment should be focussed primarily around a core network (Figure 6.4) to improve strategic connectivity and provide greater certainty for passengers and operators about future service provision. By supporting buses this way and through continued partnership working with operators, service levels and standards can be enhanced to make buses a more attractive mode of travel.
Figure 6.4: Indicative core bus network. This will be subject to further investigation and refinement as part of the Intalink Bus Strategy.
The Core Bus Network is where HCC will focus infrastructure investment to aid bus services. The delivery of bus services is predominantly by commercial operators and over a much wider network in Hertfordshire.
© Crown copyright and database rights 2018 OS EUL 100019606You are permitted to use this data solely to enable you to respond to, or interact with, the organisation that provided you with the data. You are not permitted to copy, sub-licence, distribute or sell any of this data to third parties in any form.
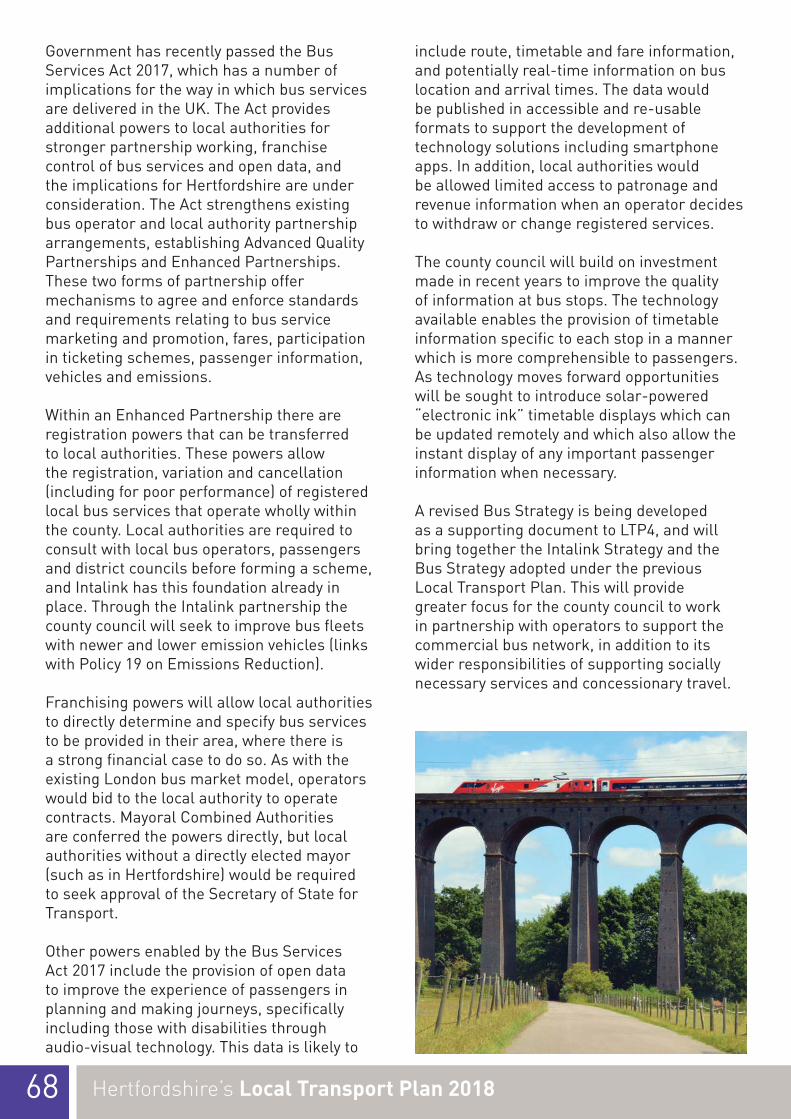
68 Hertfordshire’s Local Transport Plan 2018
Government has recently passed the Bus Services Act 2017, which has a number of implications for the way in which bus services are delivered in the UK. The Act provides additional powers to local authorities for stronger partnership working, franchise control of bus services and open data, and the implications for Hertfordshire are under consideration. The Act strengthens existing bus operator and local authority partnership arrangements, establishing Advanced Quality Partnerships and Enhanced Partnerships. These two forms of partnership offer mechanisms to agree and enforce standards and requirements relating to bus service marketing and promotion, fares, participation in ticketing schemes, passenger information, vehicles and emissions.
Within an Enhanced Partnership there are registration powers that can be transferred to local authorities. These powers allow the registration, variation and cancellation (including for poor performance) of registered local bus services that operate wholly within the county. Local authorities are required to consult with local bus operators, passengers and district councils before forming a scheme, and Intalink has this foundation already in place. Through the Intalink partnership the county council will seek to improve bus fleets with newer and lower emission vehicles (links with Policy 19 on Emissions Reduction).
Franchising powers will allow local authorities to directly determine and specify bus services to be provided in their area, where there is a strong financial case to do so. As with the existing London bus market model, operators would bid to the local authority to operate contracts. Mayoral Combined Authorities are conferred the powers directly, but local authorities without a directly elected mayor (such as in Hertfordshire) would be required to seek approval of the Secretary of State for Transport.
Other powers enabled by the Bus Services Act 2017 include the provision of open data to improve the experience of passengers in planning and making journeys, specifically including those with disabilities through audio-visual technology. This data is likely to
include route, timetable and fare information, and potentially real-time information on bus location and arrival times. The data would be published in accessible and re-usable formats to support the development of technology solutions including smartphone apps. In addition, local authorities would be allowed limited access to patronage and revenue information when an operator decides to withdraw or change registered services.
The county council will build on investment made in recent years to improve the quality of information at bus stops. The technology available enables the provision of timetable information specific to each stop in a manner which is more comprehensible to passengers. As technology moves forward opportunities will be sought to introduce solar-powered “electronic ink” timetable displays which can be updated remotely and which also allow the instant display of any important passenger information when necessary.
A revised Bus Strategy is being developed as a supporting document to LTP4, and will bring together the Intalink Strategy and the Bus Strategy adopted under the previous Local Transport Plan. This will provide greater focus for the county council to work in partnership with operators to support the commercial bus network, in addition to its wider responsibilities of supporting socially necessary services and concessionary travel.

69Hertfordshire’s Local Transport Plan 2018
OutcomesThe desired outcomes from this policy are an improved bus offer focussed on a core network, resulting in increased patronage, modal shift from cars, and improved bus user satisfaction.
Relevant Supporting Documents• Accessibility Strategy
• Growth and Transport Plans
• Intalink Bus Strategy
• Network Management Strategy
• Air Quality Strategy
• Rural Transport Strategy
Monitoring PerformancePercentage of sustainable mode share for Hertfordshire residents.
G) Rail
ContextThe rail network in Hertfordshire comprises a number of independent corridors generally running south-north through the county. There are different franchised operators for each of these routes and Network Rail has the overall power of authority on each line. Whilst the county council is a key stakeholder for the railways in county, it has no decision making power.
The main rail lines, which generally link areas in the county (and beyond) with London in the south, shown in Figure 3.5 on page 22 are:• The West Anglia Mainline;
• The Midland Mainline;
• The London to Aylesbury Line;
• The East Coast Mainline; and
• The West Coast Mainline.
This strong existing north-south connection between large urban areas within the county and London has led to very strong rail commuting patterns into London from Hertfordshire. In fact, rail is by far the most popular mode of travel for those commuting into ‘inner London’ from the county. As a consequence of this, overcrowding on peak time London bound trains is a common occurrence across each of the main rail lines, meaning many travelling are forced to stand on their journey.
Overcrowding is an issue for the individual railway lines themselves too, with numerous operators and many services vying for limited capacity on the line. Most of the lines in Hertfordshire are already at or approaching their capacity for numbers of services. This lack of capacity limits options for solving existing issues on the railways.
Whilst there is a good level of north-south connectivity by rail in Hertfordshire, there is a lack of east-west connection. Those wanting to travel in an east-west direction by rail in the county are required to interchange in London and this often entails further interchange between mainline London stations. Alternatively people without access to a car must rely on bus, taxi or cycle for part of their journey if they wish to travel east west using rail. The potential journey time and cost dis-benefits of this are clear and this makes rail a much less attractive option. Therefore, to counteract this, along with enhanced rail connections, improving access to stations within Hertfordshire and the quality of interchange at these stations, including access by non-car modes and car parking, is vital to enhancing the attractiveness of rail travel.

70 Hertfordshire’s Local Transport Plan 2018
Policy 10: Rail The county council will support and promote rail use in the county, especially in order to reduce car use. To do this it will:a) Work with the rail industry and other
partners to seek improvements to train services in regards to capacity, journey times, frequency and range of destinations served.
b) Work with the rail industry and other stakeholders to make rail travel more attractive through improved fares and ticketing, upgraded station facilities and better access and interchange by sustainable modes of transport.
c) Support Community Rail Partnerships in the county.
d) Publish a Rail Strategy setting out how the county council’s objectives can be achieved.
ApplicationThe county council produces a Rail Strategy, which includes a set of specific aims and objectives for enhancing rail in the county. It takes the overarching policy in this LTP, and applies more focussed measures and proposals that help to achieve this. As a consequence, this policy should be read alongside the Rail Strategy.
The county council will work closely with the rail industry and other key partners/stakeholders to seek improvements to the county’s rail network. This includes close partnership working with Network Rail, the various train operating companies (including Transport for London), the Department for Transport and neighbouring local authorities. The council will lobby the rail industry for additional capacity on the lines, better journey times, and higher frequencies of trains serving areas within Hertfordshire, along with creating additional destinations where feasible. The county council will push for greater support for the roles of both Stevenage and Watford Junction as mainline, intercity stations on the East Coast and West Coast Mainlines respectively. It will also lobby partners within
the rail industry to improve and enhance rail journeys within and between areas in Hertfordshire to make interurban rail travel more attractive in the county.
There are a number of national and regional rail proposals planned which will influence rail travel in and around Hertfordshire. These include Crossrail 2 and High Speed Rail 2 (HS2). The council will seek to maximise opportunities arising from these schemes, the Rail Strategy will contain further detail. In addition, the council will support working with rail companies in accordance with the Rail Industry’s Capital Investment Programme.
The county council will also work alongside partners to help make rail travel more attractive for users, focussing on improved, easier ticketing arrangements and appropriate fares – especially for those trips within the county that can support mode shift away from cars. Improving interchange and station facilities are also key goals for the county council and its partners in the rail industry. This includes greater links with the bus operators and other passenger transport providers, improved pedestrian and cycling facilities at stations and good access for taxis, all of which play a key role for those travelling by train as part of end-to-end journeys. The Rail Strategy contains specific station access and interchange plans.
The county council will also continue to support Community Rail Partnerships by providing and facilitating contact between the rail industry and interested community groups.
The council will support improvement proposals to the experience of using Stevenage railway station as well as a fifth platform. In addition, it will support the proposals for Broxbourne’s new stations at Turnford and Park Plaza.
The council identifies the movement by rail on the Chiltern line from Aylesbury to London as a main link to London and supports improvement proposals to the line speeds and capacity.

71Hertfordshire’s Local Transport Plan 2018
OutcomesOverall the policy seeks to improve rail service levels and enhance intermodal interchange at stations. This would be expected to result in high levels of satisfaction and increased patronage, particularly for local interurban travel.
Relevant Supporting Documents• Growth and Transport Plans
• Intalink Bus Strategy
• Rail Strategy
Monitoring PerformancePercentage of sustainable mode share for Hertfordshire residents.
H) Airports
ContextHertfordshire has two major civil airports adjacent to its borders, London Stansted to the east and London Luton to the west, plus Heathrow a relatively short distance of under 20 miles from the south-west of the county. London Gatwick, London City and Birmingham International are also notable destinations for Hertfordshire residents given their accessibility by both rail and road from the county.
The passenger flows to the two closer airports, London Stansted and London Luton, are particularly heavy on the related radial routes, the M11 and the West Anglia Mainline for Stansted Airport, and the M1 and Midland Mainline for Luton. Other key routes to these airports, which include flows of airport employees, are the A120, A1184 and B1004 for Stansted and the A1081, A505, A602 and B653 for Luton. In terms of modal share for passengers, Stansted is already successful in attracting trips by sustainable modes. Stansted has the highest proportion of passenger transport trips of any airport in the UK with 51% using alternatives to the car, in contrast Luton has around 30% using non-car modes and increasing this level is a key priority for them33. Increasing passenger trips
by non-car modes will be vital for both airports as more passengers use them in the coming years, and both airports have strategies to help achieve this – The Stansted Sustainable Development Strategy and the Luton Surface Access Strategy.
The government has outlined the importance of airport growth in terms of the economy in its Aviation Policy Framework (2013). As a consequence, airport expansion proposals are widespread across the region’s main airports, with plans underway for both Luton and Stansted to add to their passenger capacity and a new third runway planned for Heathrow as outlined in the Draft Airports National Policy Statement (2017). Stansted has proposals to increase its annual passenger numbers from 24.5million to 35million by 2025, upgrading its terminal building and flight carrying capacity, as well as creating more jobs in the process. Luton Airport’s vision to 2050 is to make the best use of the existing runway to provide maximum benefit to the local and sub-regional economy, to deliver good levels of service, and to actively manage environmental impacts at the local and wider levels, committing to responsible and sustainable development. The capacity of the existing runway is 36-38 mppa, or in the region of 240,000 aircraft movements per year34.
Land use planning processes will examine the transport and environmental impacts of local airport expansion, and ensure any negative impacts are sufficiently mitigated.
The council recognises the importance of smaller, local privately owned airfields to the economy, leisure, training and emergency needs. These provide much needed connectivity for business travellers and locations in and outside of Hertfordshire.

72 Hertfordshire’s Local Transport Plan 2018
Policy 11: Airports The county council, working in partnership with neighbouring local authorities and airport operators, will seek improvements to surface access to Luton and Stansted Airports, and promote and where possible facilitate a modal shift of both airport passengers and employees towards sustainable modes of transport.
The county council is opposed to new runway development at Luton and Stansted Airports.
ApplicationThe county council will seek to implement this policy through working closely with the airports and the relevant neighbouring local authorities to ensure access to and from Hertfordshire for the region’s airports, particularly London Luton and London Stansted, is improved and focussed primarily on sustainable modes of travel. The council will seek to ensure it exerts its influence on the aims, objectives, proposals and targets contained within the Luton Surface Access Strategy and the Stansted Sustainable Development Strategy and closely link these to the relevant Growth and Transport Plans (see page 91).
The county council will be working with relevant stakeholders to improve rail access to
Stansted, without causing a detriment to other existing services on the West Anglia Mainline. The county council will also lobby train operating companies for improved facilities on these trains. It will work in partnership in seeking to tackle traffic congestion on the key radial routes to the airport and reduce the amount of vehicle trips, with an emphasis on promoting more sustainable modes of travel.
The county council, local authority partners, bus operators and the airport operators will look for opportunities to maximise the levels of passenger transport (bus and coach), especially from areas without direct rail access to Stansted and Luton Airports.
The county council will work with relevant stakeholders as part of the Thameslink programme. This is a key element of plans to increase rail travel to London Luton Airport from Hertfordshire and beyond, in conjunction with the airport light rail link proposal (see page 95). This includes lobbying for longer trains on the Midland Main Line and more frequent, faster services to Luton Airport Parkway, as well as improved and easier ticketing arrangements.
The county council will also seek to work with the relevant authorities to help minimise any environmental impacts, such as noise, arising from aviation (see Environment Policy 21).
OutcomesOverall the policy seeks the delivery of sustainable airport growth at both Luton and Stansted with negative impacts on the local road network, environment and quality of life minimised. According an increase in sustainable mode share by airport passengers and employees at both airports should be sought.
Relevant Supporting Documents• Growth and Transport Plans
• Intalink Bus Strategy
• Rail Strategy
• Air Quality Strategy

73Hertfordshire’s Local Transport Plan 2018
Monitoring Performance• Percentage of passengers travelling to
airports by non-car modes (Luton and Stansted)
• Percentage of employees travelling to airports by non-car modes (Luton and Stansted)
I) Managing the movement of vehicle traffic and freight on the Highway Network
ContextThe Traffic Management Act (2004) places a Network Management Duty on Local Transport Authorities such as the county council. This requires the council where practicable to secure expeditious movement of traffic, by securing more efficient use of the network and reducing congestion. Congestion is already one of the biggest issues facing the county today, as demonstrated by the average traffic speeds in Hertfordshire being the lowest of any county authority in the East of England region.
As previously outlined (see challenges page 15) current rates of car use, population growth and the distribution of new housing are going to result in traffic increases. Addressing these issues with significant additional highway capacity will only perpetuate the already high levels of car use and relatively low levels of passenger transport and active mode use in the county. It will also be very expensive, environmentally damaging and impact on the character and place qualities of Hertfordshire. There is much uncertainty over whether in the long term with the advent of autonomous vehicles, other technological advances and changes in behaviour, there will be a need for as much highway space. As a result the approach to managing traffic flows on the network is focussed primarily on making the best use of existing road space and improving the efficiency of the network.
Policy 12: Network ManagementAs part of its Network Management Duty the county council will seek to manage, and where feasible reduce traffic congestion, prioritising strategic routes. Activity will focus on making more efficient use of highway network capacity via:
a) Use of Intelligent Transport Systems and small scale traffic management interventions.
b) Maintaining a Network Management Strategy which will include the county council’s road network hierarchy and associated policies.
c) Reducing levels of single occupancy car use and encouraging travel by walking, cycling and passenger transport.
d) Sharing data (open data) and supporting the use of technology to provide up to date and accessible information for all network users.
e) Control of on-street vehicle parking in line with the Network Management Strategy.
f) Managing street works and minimising network disruption.
ApplicationSingle occupancy car use represents a very inefficient use of the transport network. Buses and active modes take up much less highway space per traveller than cars and hence represent more efficient use of the network. Efforts to reduce single occupancy car use and congestion will be supported by other LTP policies such as those concerning Influencing Travel Behaviour, Active Travel, Bus and Rail (Policies 2, 3, 4, 7, 8, 9 and 10).
The LTP4 Network Management Strategy will include more detail on the delivery of this policy, including the defined Road Hierarchy, the identification of the strategic routes on which interventions will be prioritised, and details on the operational traffic management policies.

74 Hertfordshire’s Local Transport Plan 2018
During previous LTP periods the county council has already invested heavily in its traffic management capabilities. This and other technology is enhancing our ability to manage traffic flows on the network and adapt to events and unplanned incidents. The county council will continue to invest in and develop its traffic management capabilities, with a focus on the strategic routes defined by the Network Management Strategy. The strategic routes will be informed by the key multimodal corridors identified earlier in this strategy, which differ from the currently defined Primary Route Network. It is the operation of these strategic routes which is of most economic importance, and effective operation can reduce problems associated with traffic diverting from these onto less appropriate or lower classified routes. The Intelligent Transport Systems (ITS) subsection of the Network Management Strategy will include detail on the ITS operation, including future proposals.
Traffic management technology and smart phone data is also increasing the amount of data and understanding of traffic flows. The county council will maximise the use of this, and make it available to users of the network. Instead of a focus on faster routes and improved journey times, the focus will be on reliable networks and predictable travel times, with users provided with sufficient information so they can plan and where necessary adapt their journeys. The county council will promote and encourage the sharing of data – so called
‘Open Data’ – to allow innovation in the field of transport user information, such as travel and journey planning ‘Apps’ which are now widely accessible with the growth of ‘on the go’ mobile and smartphone technology.
Use of Data “OneTRANSPORT”The county council is part of a number of stakeholders in a group including neighbouring authorities, who have been taking part of a project which aims to help integrate transport information across a series of networks to help lead the way in which we receive and use travel information.
The project aim was to enable multimodal transport information, such as live information, traffic jams, or disruption to be easily published and shared by data owners (e.g. transport authorities and third parties).
Once published the data can be accessed by transport authorities, to create better journeys for passengers.
This has demonstrated improved travel experiences for customers. Following the successful user case studies across three Counties which demonstrated interoperability, financial viability and operational and customer benefits. Looking forward further benefits will include reduced vehicle emissions, fuel usage and traveller frustration through decreased congestion and avoidance of unnecessary journeys. Network Managers are be able to obtain improved information on journey times and disruption, enhancing their ability to provide real time interventions, plan journeys and improve the journey experience with predictable and reliable journey times and improved communications therefore achieving a better transport experience for users and a more intelligent transport system.
Going forward HCC will continue to explore how data can be shared and used to benefit the road user in Hertfordshire.

75Hertfordshire’s Local Transport Plan 2018
Poorly planned and managed street works activity can cause significant network disruption and can frustrate travellers. Similarly inconsiderate, inappropriate or illegal parking can also cause unnecessary congestion and safety issues. In order to prevent this and reduce the impact of anything that decreases the efficiency of the network, the county council will work in partnership with Highways England, utility companies, neighbouring authorities, the police and district/borough councils to maintain a safe and reliable highway network. LTP4 Asset Management Policies (Policy 22) will also support the provision of a reliable network which minimises disruption experienced by transport users.
New roads and junctions
Context Over the next 15 years the scale of housing and traffic growth will mean there are limits to the approach outlined so far in terms of managing the highway network, and some newroads and upgraded junctions on existing roads may be required. It is important that increasing road network capacity is not the default option. Given the uncertainties of future demand for road space, it is important any schemes have the potential to cater for increased demand beyond what is predicted. However, any increase in road capacity should not be released before it is absolutely necessary as this will only perpetuate greater traffic growth. Furthermore, from the future scenario testing of the LTP4, significant road capacity solutions will have a stronger justification and alignment with a greater range of future scenarios, if they contribute to more objectives than just the facilitation of traffic flow. The LTP4 bypass proposal for Hertford should be seen in this context (page 106). Additional objectives include unlocking land for new housing development particularly where it can be served by established urban centres and rail hubs, and where it facilitates improvements in active travel and passenger transport provision in areas traffic is diverted from. There could be opportunities to reallocate the released road
space as discussed previously in relation to Policy 4 on Demand Management, to ensure the spare highway capacity created is not filled by future traffic growth.
Policy 13: New Roads and JunctionsThe county council will work closely with partners including Highways England, districts and major scheme developers to design new transport infrastructure, following application of the Transport User Hierarchy, to manage existing demand and that of planned development. Future capacity that may be required beyond this could be safeguarded but should not be released until necessary to avoid inducing demand.
ApplicationNew roads or upgraded junctions will typically only be considered where the impacts of new development and traffic growth would exacerbate or result in unacceptable levels of journey time unreliability, particularly on the strategic routes identified by the Network Management Strategy, or result in other significant local environmental impacts. In keeping with the Transport User Hierarchy other options, including reducing travel demand and support for more sustainable modes of travel should be considered before concluding additional highway capacity is necessary.
In accordance with the Transport User Hierarchy policy the design of any road scheme or junction should consider the needs of transport modes in the prescribed order. As part of this where highway improvements relieve highway demand elsewhere on the network, opportunities to improve provision for sustainable modes of transport and encourage modal shift should be taken as a priority. Any new roads will also need to have the appropriate safety audit and accord with the Roads in Hertfordshire Design Guide, Network Management Strategy and Speed Management Strategy.

76 Hertfordshire’s Local Transport Plan 2018
Some major road proposals are identified in chapter 7. Further development of these and potentially the identification of other improvements will be included in the LTP4 Growth and Transport Plans, as well as other studies conducted on specific locations or corridors (see section N: Growth and Transport Plans).
Climate Change Network Resilience
ContextIt is apparent that what might be termed extreme weather phenomena, such as heavy rain, snow, floods, heat waves and drought, are likely to increase both in terms of frequency and magnitude over the coming decades. Meanwhile we are already experiencing the effects of more gradual changes in temperatures and rainfall, such as a lengthening of the growing season and the implications of this for open/green space maintenance regimes.
The potential impact of these changes in coming years is known as climate risk and must be factored into the design and operation of new and maintained infrastructure, as well as policies and decision-making to ensure the transport network in Hertfordshire is fit for purpose in the future.
The risk from the impacts of climate change will increase over time and must be factored into all long term decisions and planning. The transport network needs to be resilient to changing weather patterns and extreme events.
Policy 14: Climate Change Network ResilienceThe county council, as part of its response to climate change adaptation, will design, construct, maintain and operate all infrastructure in the light of the risk from a changing climate. The same principles will be applied to infrastructure provided by other organisations including developers.
ApplicationThe county council will work with the Environment Agency and local planning authorities to ensure new highway infrastructure is designed and built to take account of the likely future impacts of climate change. The requirements for new transport infrastructure in this regard are set out in the Roads in Hertfordshire design guide, and the council’s maintenance policies (see Policy 22 on Asset Management).
Under the Flood and Water Management Act 2010, the county council as Lead Local Flood Authority (LLFA) is required to develop, maintain and monitor strategies for managing local flood risk. The relationship between the highways and flood risk is set out in the council’s Flood Risk Management Strategy.
Speed Management
Context The responsibility for setting speed limits on roads lies jointly between the Highway Authority (the county council), Highways England (for Motorways and Trunk Roads) and the Police. The role of enforcement falls to the Police, and this is supported by Hertfordshire Road Safety Camera Partnership which seeks to reduce casualties at sites where there is an identified speeding related casualty issue.
It is important that each road adopts the appropriate speed limit for reasons of safety. Inappropriate traffic speeds can generate excess noise and impact on the quality of the local environment. Furthermore it can also deter walking, horse riding and cycling by making the environment feel less safe.
Policy 15: Speed ManagementThe county council through its Speed Management Strategy, a joint working strategy with the Police, will seek to manage the network to achieve appropriate speeds in the interests of safety, other road users, and the environment.

77Hertfordshire’s Local Transport Plan 2018
ApplicationThe county council will adopt and maintain a Speed Management Strategy to help set the speed limits on the county’s roads. This strategy is where the policies on speed limits and speed limiting infrastructure, such as traffic calming measures, will be held. Safety and the impacts on the local environment and other road users will be primary considerations. The Speed Management Strategy takes into account national guidance and regulations on speed limits as well as the required speed limit review procedures. It will also contain information on enforcement procedures available, and the role of the Police. The Speed Management Strategy will link to the Roads in Hertfordshire Design Guide given the influence of highway design on vehicle speeds, as well as the LTP4 Network Management Strategy and the LTP4 Asset Management Policies.
Freight and Logistics
ContextA key aspect of managing traffic on the network is managing the movement of freight and logistics vehicles. Effective freight and logistics operations are important to local and national economy, we therefore aim to support these operations but in a way that does not compromise the natural environment and quality of life for residents.
The movement of goods within Hertfordshire is primarily by road using both Heavy Goods Vehicles (HGVs) and Light Goods Vehicles (LGVs). Whilst the Primary Route Network is designed to cater for high flows of HGVs, access to the final destination via local roads can have major impacts on the environment and on congestion in both town centres and rural areas. The alternatives of rail and water freight are limited. Navigable waterways are limited to two routes (Grand Union Canal and the River Lee/Stort navigation). The rail network is more extensive but already has severe daytime capacity problems from the expanding passenger services. The county council’s aims for sustainable distribution therefore concentrate on minimising the
impact of road traffic, whilst ensuring that any opportunities which may arise for rail and water freight can be taken up.
Recent years have seen a rise in LGV movements in the UK, and although the rise locally in Hertfordshire is less marked than elsewhere, there has been an increase. There are also more deliveries being made by small vehicles and cars, particularly to people’s homes. These are trends that are likely to continue with the growth of internet shopping and increased demand for fast and efficient delivery of goods.
Policy 16: Freight and LogisticsThe county council will seek to manage freight and logistics traffic, by:
a) Encouraging HGV’s to use the primary route network.
b) Providing clear advice to local planning authorities in respect of highways and freight implications of new development proposals.
c) Encouraging a shift from road-borne freight to less environmentally damaging modes, including rail, water and pipelines.
d) Supporting the formation of Quality Partnerships between interested parties.
e) Monitoring changes in HGV and LGV activity to inform possible solutions which reconcile the need of access for goods and services with local environment and social concerns.
f) Supporting improvements in HGV provision in the county, including overnight parking, in appropriate locations.
g) Utilising traffic management powers, where appropriate to do so, to manage access and egress from specific locations.

78 Hertfordshire’s Local Transport Plan 2018
ApplicationThe network will be managed to direct HGVs along primary routes, using effective signing and expanded use of Intelligent Transport Systems. Details of the primary routes and how the network will be managed can be found in the Network Management Strategy. Close working with local planning authorities regarding freight and logistics movements from developments will also play a key role in managing the movement of goods.
In order to address the issues associated with HGV and LGV trips, the council will carry out monitoring and data collection of freight movements within the county in order to gauge an accurate understanding of logistics travel and to better inform potential interventions in the future. Where there is an identified need, the council will support the establishment and formation of Freight Quality Partnerships as well as investigate solutions such as freight aggregation, ‘quiet technology’ initiatives, time limited deliveries and delivery collection ‘hubs’. These have a role in reducing the impacts on first /last mile of journeys and could become increasingly necessary with further growth in online shopping.
LGV movements, as well as their requirements for loading and unloading, cause particular issues within urban areas where they can cause roads and pathways to be blocked. Knock on effects from this include congestion and a negative impact on those wishing to walk and cycle. The county council will consider using its powers as Highway Authority to restrict certain movements into urban areas where congestion is an issue and it is deemed appropriate to do so.
There is some evidence to suggest there is a deficiency in provision for HGVs in Hertfordshire with regards to laybys, overnight parking and other facilities for drivers. The county council will look to support improved provision by working with key partners such as Highways England and the haulage industry to better understand needs and solutions.
OutcomesThe above policies in combination seek to achieve more reliable and predictable travel times on the highway network, and improved availability of information to plan and adapt travel behaviour. In addition they also seek to achieve a transport network resilient to the impacts of climate change, with traffic flows managed in the interests of safety, the economy, environment, quality of life and to encourage travel by active modes.
Relevant Supporting Documents• Highways Infrastructure Asset
Management Plan
• Network Management Strategy
• Rail Strategy
• Roads in Hertfordshire
• Speed Management
• Air Quality Strategy
• Rural Transport Strategy

79Hertfordshire’s Local Transport Plan 2018
J) Road Safety and Security
Context Safety and casualty reduction on our roads is both an emotive and important area, and one which has been a key focus for the county council and its partners over a number of years. Whilst roads in Hertfordshire are safer now than they once were, every serious collision is considered preventable and any death or serious injury is one too many.
The total number of road deaths and injuries in the county has declined greatly since the 1990s but in the last few years this progress has slowed with annual totals now remaining similar to the 2010 – 14 average35. In fact from 2014 the total numbers killed or seriously injured (KSI) in Hertfordshire has been slowly increasing across several user groups; trends that are also being reflected nationally36. Pedestrians, cyclists and powered two wheelers (mopeds and motorcycles) make up approximately half of the county’s KSI casualties and one third of all casualty totals despite accounting for only a small percentage of the total miles travelled. Young car users (aged 17 – 24) make up nearly one quarter of car occupant casualties and are significantly over represented compared with any other age groups37.
The economic cost of road casualties and incidents to society is also considerable. The burden of these costs falls across a range of public agencies such as the Police, other emergency services, the county council, Highways England and National Health Service in particular. In 2015 the total value of prevention of reported road accidents for Great Britain was estimated to be £15.3billion38. This sum encompasses all aspects of the valuation of casualties, including the human costs which reflect pain, grief and suffering; the direct economic costs of lost output and the medical costs associated with road accident injuries. The figure includes an estimate of the cost of damage only accidents. It is also estimated that the total value of prevention of unreported casualties is around a further £20billion a year. This raises the total estimate for all reported and unreported accidents to
around £35.5billion per year equating to 3% of Gross Domestic Product39. In Hertfordshire road casualties are estimated to cost nearly £0.5 billion annually, primarily in terms of lost output and human costs40. A wide range of factors contribute to road traffic collisions and the severity of injury including; driver impairment or behaviour, distraction, vehicle type and age, speed, weather conditions, layout of the road including road side furniture and safety features. Human error is thought to cause 90% of road collisions. The most commonly cited contributory factors in Hertfordshire are ‘failing to look properly’, ‘misjudging other person’s speed or position’ and ‘loss of control’41. Speed continues to be a factor, especially in higher severity collisions. Local data indicates that over one third of vehicles travel above the speed limit on the existing network of 30 mph roads42 (see related Policy 15 on Speed Management).
All of this information, along with driver and vehicle data is analysed and used to formulate strategies and direct interventions for both the county council and road safety partners.
Changes in traffic levels, travel mode choice, and the county’s demographic profile will affect the total numbers of collisions and casualties in the future. It is important that road safety performance measures consider not only total numbers but also the risk of being involved in a collision on the network by particular travel modes. Furthermore to successfully accelerate the transition from delivering car-based capacity to a balanced approach which caters for all forms of transport, and seeks to encourage a switch from the private car to sustainable transport (e.g. walking, cycling and passenger transport), we will continue to address the perception held by some that Hertfordshire’s roads are too dangerous and uncomfortable for such alternative modes.
Modern vehicles are increasingly able to undertake more of the driving tasks and over time the development of driverless, connected autonomous and semi-autonomous vehicles will undoubtedly improve safety. However it will still be some time before these begin to

80 Hertfordshire’s Local Transport Plan 2018
significantly influence overall casualty rates.Older people will likely make up a higher percentage of total drivers and road users in future and, while statistically they are relatively low risk, when collisions do occur they have the potential to be more serious due to older people being less physically resilient and often driving smaller and lighter vehicles.The Government’s Road Safety Statement (2015) Working Together to Build a Safer Road System outlined a number of proposals, including the removal of centralised national targets for the whole UK, and the adoption of the Safe Systems approach. The Vision Zero and Safe Systems policy approaches (see case study) pioneered in Europe have emphasised the role of engineering solutions as well as targeted and effective education programmes to provide safer transport networks.
Vision Zero and Safe System Approach Safe Systems and Vision Zero is a radical policy adopted in Sweden in 1997 and is now widely used in the UK and around the world. The policy aims for a future where no-one is killed or seriously injured on the roads, and has led to a gradual yet radical change in how safety is approached and managed. The approach places greater emphasis on the role of highway designers and vehicle manufacturers to engineer and maintain a safe transport network, and take corrective action when transport users compliant with the rules of the road are injured. This way, routine and predictable events are engineered out, and the network is more forgiving when collisions occur.
Coupled with this, over the past 15 years European governments and motoring organisations including Highways England developed the European Road Assessment Programme Star Rating Scale. This is a high level assessment of infrastructure safety based upon the inspection and scoring of physical road features and the prevailing speed limit, which together impact on the likelihood of a collision and its severity.

81Hertfordshire’s Local Transport Plan 2018
Policy 17: Road SafetyThe county council will seek to continually improve safety on the county’s roads, working towards an ultimate vision of zero fatalities and serious injuries, by:
a) Working with partners, in particular through the Hertfordshire Road Safety Partnership to deliver targeted, effective and appropriate road safety measures.
b) The development of a ‘Safe Systems’ approach that seeks to co-ordinate a mix of safer roads, safer speeds, safer vehicles, safer road users and post-collision response with a focus on casualty reduction.
c) Using latest data analysis and intelligence led techniques to target and evaluate measures.
ApplicationNo one agency has overall responsibility for road safety but as Highway Authority, the county council is a major stakeholder in improving and maintaining safety standards on the local road network including a number of statutory duties. As such it will work closely with other key stakeholders, particularly through the Hertfordshire Road Safety Partnership, to set strategy, coordinate resource, target activity, and measure effectiveness of interventions. The partnership includes Hertfordshire Constabulary, the Office of the Police & Crime Commissioner, Highways England, the Hertfordshire and Essex Air Ambulance, the Road Victims Trust Charity and several county council departments including Highways, the Fire & Rescue Service, Trading Standards, Public Health, and Corporate Communications. The partnership will continue to support national initiatives and develop local intelligence led enforcement and education campaigns such as those tackling drink and drug driving, the use of hand held mobile phones at the wheel, ensuring the use of seatbelts and reducing incidence of speeding.
The methodical and proactive Safe Systems Approach to identifying safety issues and improvements on the network, has the potential to be applied locally to guide road infrastructure design. The county council and the partnership will explore the use of the Safe Systems Approach for Hertfordshire, subject to the availability of resources.
The county council will ensure any measures implemented will be evidence led by working with partners to use the latest and most efficient techniques to collect data on road safety and collisions. In addition, the county council and its partners will monitor and evaluate the measures implemented to ensure continued efficiency both in terms of success and value for money.
Transport Safety and Security
ContextHertfordshire has a relatively low incidence of crime and collision statistics suggest a low likelihood of being involved in a collision, yet perceptions of insecurity and safety can impact travel behaviour and deter travelling altogether by certain modes or at certain times of day. Furthermore, for many people their perception of crime and Anti-Social Behaviour (ASB) can greatly impact their travel habits, just as much as any actual experience of crime or ASB. Indeed, for more vulnerable members of society, it can dissuade them from travelling altogether.
Policy 18: Transport Safety and SecurityThe county council will seek to improve the perception of safety and security on Hertfordshire’s transport system where this could deter people from travelling, particularly by active modes and passenger transport. This includes ensuring the county’s transport system is resilient and prepared for instances of major alert.

82 Hertfordshire’s Local Transport Plan 2018
ApplicationEfforts to increase walking and cycling could be hampered if key links in the network are perceived unsafe including cycle parking areas. The county council will work with partners such as the Police, Office of the Police and Crime Commissioner and local planning authorities to address any issues. Maintenance of lighting and vegetation will also play a role and will be a consideration in asset management policies (Policy 22). Urban design can also support the creation of safer and secure environments and will be a consideration in development management policies and guidance such as Roads in Hertfordshire.
Passenger safety and feelings of security could be a factor in efforts to increase passenger transport patronage. The county council will continue to work with organisations including transport operators to address the design of infrastructure, including interchanges, visible staffing and other measures such as improved lighting and CCTV. Crime on the network contributes to a negative perception of passenger transport and the council will work with partners, including the Police and the British Transport Police, to reduce both crimes committed against passengers and criminal damage and theft of transport assets, including cycles parked at stations. To reduce incidents of hate crime on the transport network the county council will work with partners to support the delivery of the Hertfordshire Hate Crime Strategy.
The county council will continue to ensure that it supports multi agency preparedness plans and exercises designed to combat the threat of terrorism and other incidents.
OutcomesThe above policies aim to deliver safer roads in the county, and a transport system which is perceived to be safe and secure. The transport network will also be resilient and prepared in the event of serious incidents.
Relevant Supporting Documents• Growth and Transport Plans
• Road Safety Strategy
• Speed Management Strategy
• Air Quality Strategy
K) Emissions Reduction
ContextEmissions from traffic are a major contributor to air quality problems which impact on human health as well as the natural environment. They also make a significant contribution to greenhouse gas emissions, particularly carbon dioxide (CO2), which is associated with climate change. Road emissions are mainly produced from internal combustion engines; however a number of other factors impact on the levels of the emissions, notably driving style, speed, vehicle age/model, and fuel type. Congestion and stop start driving conditions also result in increased emissions and more local concentrations. The local environment and climatic conditions can also affect whether emissions disperse or are trapped resulting in higher concentrations.
Emissions from vehicle tailpipes that impact on human health are specifically nitrogen dioxide (NO2) and particulates (PM10 and PM2.5), however, wear of tyres and brake linings also contribute significantly to the levels of airborne particulates. The largest source of NO2 and particulates is diesel powered vehicles and although the average emissions per vehicle is much higher for heavy goods vehicles, light goods vehicles and buses, the high number of cars on the road means that the biggest contributor to overall pollution is the diesel car.

83Hertfordshire’s Local Transport Plan 2018
The Environment Act 1995 enacted by The Air Quality Standards Regulations 2010, requires local planning authorities to review and assess local air quality in accordance with the Local Air Quality Management Guidance. If levels exceed the national air quality objective then Air Quality Management Areas (AQMAs) are declared. In two tier authorities this responsibility falls on the district and borough councils. The county council, as Highway Authority, has a statutory duty to respond where pollution levels exceed statutory limits due to traffic emissions, and work with district/borough councils to produce a joint action plan.
In 2009 the Committee on the Medical Effects of Air Pollutants (COMEAP) estimated that nearly 29,000 deaths are caused by air pollution with life expectancy of every person in the UK reduced by an average of 7-8 months43. Despite the fact that there are currently 31 declared AQMAs in the county, there are also many other areas where road emissions are likely to be a health problem; for example, where there are no air quality monitors or no dwellings but where people are exposed to the emissions nonetheless. Evidence from a study by King’s College London and Camden Council suggests that car occupants can be exposed to the build-up of higher levels of air pollution within the car than outside the vehicle, depending on the congestion around them and the specification of the vehicles44.
The Government’s draft Air Quality Action Plan (May 2017) proposed a number of additional activities to tackle transport emission levels, including:• The designation (in some cases mandatory)
of Clean Air Zones (CAZ’s)
• New real driving emissions requirements
• Further support to accelerate the take-up of Ultra Low Emission Vehicles (ULEVs)
• Exploring the tax treatment of diesel vehicles and the HGV Road User Levy
• Review information provided to consumers on environmental performance of vehicles
CAZs’ can be implemented by any local authority and define an area where targeted action is undertaken to improve air quality. There are two types of zone, charging and non-charging. Both involve the definition of a geographic area, with various actions adopted such as exploring new technologies, targeting engine idling behaviour, increasing the uptake of Ultra Low Emission Vehicles (ULEVs) and encouraging active travel. In addition, charging zones designate certain vehicles to pay a charge to enter or move within the zone if their vehicle does not meet the particular standard for their vehicle type in that zone. Any revenue would be reinvested to support local transport policies.
ULEVs are slowly growing in number across the county. Statistics from DfT (Figure 6.5) show that Watford has by far the highest number of registered plug in vehicles as of the last quarter of 2017. Buses, which can be high polluters, are slowly being replaced with cleaner Euro 6 standard buses, but it will take time for all the older vehicles to be replaced by clean technology or retrofitted. Some borough and district councils are actively promoting electric taxis to reduce road emissions.
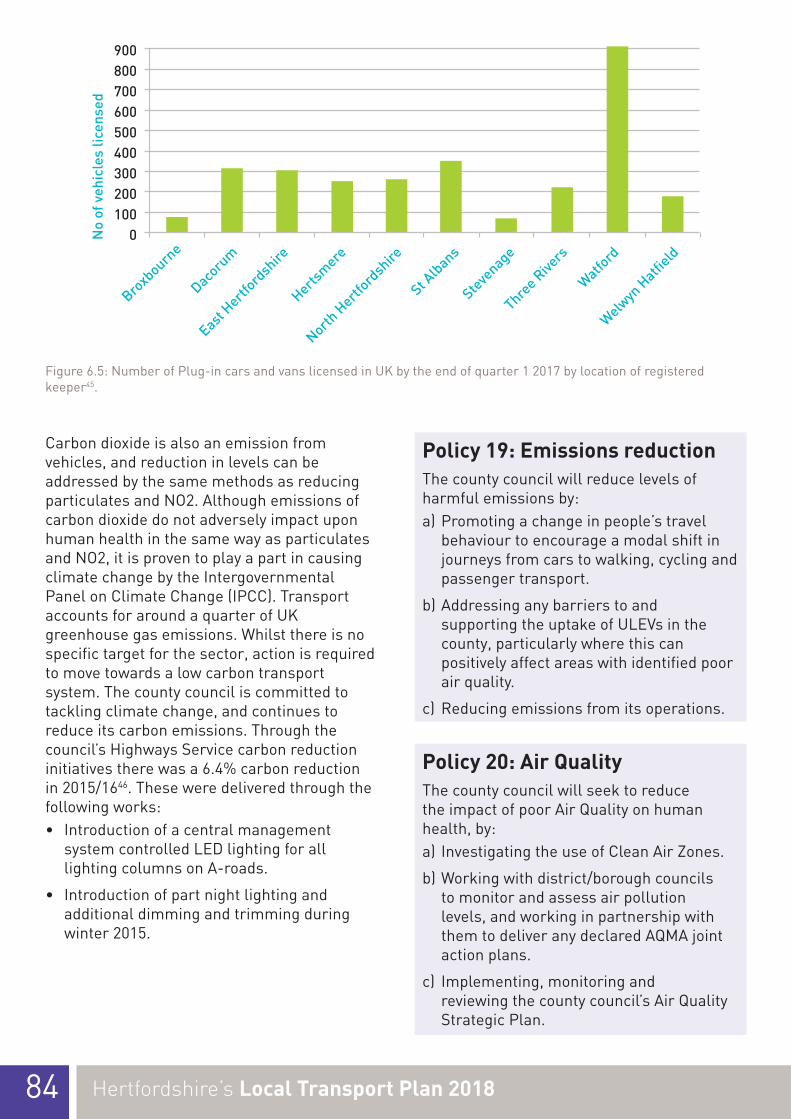
84 Hertfordshire’s Local Transport Plan 2018
900800700600500400300200100
0No
ofv
ehic
les
licen
sed
Broxbourn
e
Dacoru
m
EastHertf
ordsh
ire
Hertsm
ere
NorthH
ertford
shire
StAlb
ans
ThreeR
ivers
Steve
nage
Watford
Welwyn
Hatfi
eld
Figure 6.5: Number of Plug-in cars and vans licensed in UK by the end of quarter 1 2017 by location of registered keeper45.
Carbon dioxide is also an emission from vehicles, and reduction in levels can be addressed by the same methods as reducing particulates and NO2. Although emissions of carbon dioxide do not adversely impact upon human health in the same way as particulates and NO2, it is proven to play a part in causing climate change by the Intergovernmental Panel on Climate Change (IPCC). Transport accounts for around a quarter of UK greenhouse gas emissions. Whilst there is no specific target for the sector, action is required to move towards a low carbon transport system. The county council is committed to tackling climate change, and continues to reduce its carbon emissions. Through the council’s Highways Service carbon reduction initiatives there was a 6.4% carbon reduction in 2015/1646. These were delivered through the following works:• Introduction of a central management
system controlled LED lighting for all lighting columns on A-roads.
• Introduction of part night lighting and additional dimming and trimming during winter 2015.
Policy 19: Emissions reductionThe county council will reduce levels of harmful emissions by:a) Promoting a change in people’s travel
behaviour to encourage a modal shift in journeys from cars to walking, cycling and passenger transport.
b) Addressing any barriers to and supporting the uptake of ULEVs in the county, particularly where this can positively affect areas with identified poor air quality.
c) Reducing emissions from its operations.
Policy 20: Air QualityThe county council will seek to reduce the impact of poor Air Quality on human health, by:a) Investigating the use of Clean Air Zones.
b) Working with district/borough councils to monitor and assess air pollution levels, and working in partnership with them to deliver any declared AQMA joint action plans.
c) Implementing, monitoring and reviewing the county council’s Air Quality Strategic Plan.

85Hertfordshire’s Local Transport Plan 2018
ApplicationThe LTP4 approach to reducing vehicle emissions can be summarised as:• Managing the flow of traffic to reduce
congestion.
• Encouraging behaviour change and reducing car use.
• Supporting government and private sector led efforts to increase adoption of ULEV technology.
The Network Management Policy (section I, Policy 12) covers activity to reduce congestion and improve the flow of traffic. This on its own however is unlikely to address emission levels given it can serve to facilitate further traffic growth and emissions production. Changing people’s travel behaviour to encourage reduced amounts of travel and a shift in journeys from cars to passenger transport, cycling, walking, and car sharing will lead to a reduction in emissions. See Active Travel (section E), Influencing Travel Behaviour (section B) and Buses (section F) for more information.
The county council is supporting the take-up of ULEV throughout the county and will work closely with the districts and borough councils to facilitate the installation of charging infrastructure on a cost neutral basis. Initiatives that will be considered include working with stakeholders to facilitate Electric Vehicle (EV) car club provision and procuring EV’s within the county council fleet. The LTP future scenario testing exercise (see page 36) identified a number of these activities as approaches the county council could consider to facilitate alternative fuel take-up. Development and expansion of these and other recommended activities will be considered as part of the implementation of this strategy. The council will also work with bus operators, particularly for the passenger transport contracts on which the council has influence, to accelerate adoption of low emission technology.
The county’s local planning authorities should also support the take up of ULEVs, for example by requiring developers to include charging infrastructure in new developments (see Development Management Policy). The Automated and Electric Vehicles Bill will address common standards and interoperability for ULEVs in the UK and will help the transition towards installing ULEV infrastructure across Hertfordshire and the rest of the country.
With regards to lowering carbon emissions, the county council will continue to monitor and reduce carbon emissions from its own activity. This includes reducing energy consumption and hence emissions from its property estate and street lighting, as well as emissions from its own highway operations and fleet. With respect to air quality the county council has an agreed protocol with the districts on how it responds to transport-related air quality issues, and is an active member of the Hertfordshire and Bedfordshire Air Quality Network. The county council will support the district and borough councils with writing their statutory air quality actions plans and assist where appropriate when funding opportunities arise for mitigating air quality issues in the county.
Currently there is no economic case for setting up charging CAZ in Hertfordshire similar to the scheme in central London and the Government’s draft air quality plan recognises that this measure is only to be used as a last resort. The county council will consider the adoption of non-charging CAZ’s where evidence suggests this is required and that it will be effective.
The county council’s transport and public health teams will continue to work with district and borough council partners to understand how best to address areas that suffer from particularly high levels of emissions which put human health at risk. Detailed plans will be developed as part of the AQMA process and through the update to the county council’s Air Quality Strategic Plan. This will be informed by the content and guidance included in the Government’s new UK Air Quality Plan.

86 Hertfordshire’s Local Transport Plan 2018
OutcomesThese policies in conjunction with other LTP4 policies seek to reduce Hertfordshire’s contribution to greenhouse gas emissions and global climate change, and also reduce the contribution of transport to poor air quality which impacts human health, flora and fauna.
Relevant Supporting Documents• Active Travel Strategy
• Intalink Bus Strategy
• Network Management Strategy
• Growth and Transport Plans
• Air Quality Strategy
L) Environment
ContextHertfordshire is a county with a variety of different and unique environmental characteristics, all of which are vital in making residents want to live here and attracting visitors to the area. It is a largely rural county which also contains a lot of green belt land, has a number of internationally important sites and is home to some important historical settlements. The expansion of the transport network over the previous century combined with a growing population and further housing and jobs growth in the future, mean it is crucial that due consideration is given to the protection and preservation of the environment.
Common transport related impacts on the environment include:• Noise disturbance
• Landscape and townscape change
• Emissions – chemical and particulate
• Water pollution
• Habitat fragmentation and barriers to movement
• Loss of habitat
• Loss of fauna through road kill
• Damage/disturbances to areas of important historic environment
• Light pollution
Many of Hertfordshire’s most environmentally important sites are afforded legal protection. The following European sites lie, wholly or partially, within Hertfordshire: • Lee Valley Special Protection Area (SPA) and
Ramsar site;
• Wormley Hoddesdonpark Woods Special Areas of Conservation (SAC); and
• Chiltern Beechwoods SAC.
The following European site lies close to the borders of Hertfordshire: • Epping Forest SAC.
Some of the above sites also include Sites of Special Scientific Interest (SSSI’s) of which Hertfordshire has 43. The Chilterns Area of Outstanding Natural Beauty (AONB) extends into the west and north west of the county. There is also a widespread number of Key Biodiversity Areas (KBA) in the county and a number of rivers and waterways that need to be protected from the impacts of transport.
In addition to this, there are a number of historic towns and buildings which also need substantial protection from the impacts of transport. Hertfordshire has 180 Scheduled Monuments, 46 Registered Parks and Gardens and 8,172 Listed Buildings. As well as known areas of historic environmental importance, there are also the unknown and undiscovered areas which inevitably exist, which need consideration when it comes to mitigating transport impacts, especially from new infrastructure.

87Hertfordshire’s Local Transport Plan 2018
Policy 21: EnvironmentThe county council will seek to:a) Ensure the impacts of traffic and
transport infrastructure on the natural, built and historic environment are minimised.
b) Protect and enhance the quality of public spaces both in urban and rural areas.
c) Minimise the visual intrusion of highways infrastructure in order to reduce street clutter.
d) Minimise light pollution and conserve energy from street lighting and signage illumination.
e) Minimise noise issues arising from transport where practical to do so.
Where highway improvements are being undertaken the county council will:f) Minimise and or mitigate the adverse
physical impact on the landscape and environment and will try to secure significant and demonstrable environmental gains.
ApplicationThe county council will seek to implement this policy through working with the relevant stakeholders both inside and outside the organisation. Given the close ties between maintaining the environment and the planning process; close working with the various local planning authorities as well as the Environmental and Highways teams/specialists within the county council and nationally are vital to the success of this policy. Other key partners in this policy include: Highways England, Network Rail, Train Operating Companies, Bus Operating Companies and Luton, Stansted & Heathrow Airports. Traffic, air travel and passenger transport can all cause noise disturbances, which can impact upon quality of life and tranquillity. The council will seek to minimise the impacts of traffic and transport noise in Hertfordshire,
both when maintaining the existing transport infrastructure and when new infrastructure is installed. This will be achieved by working with key partners and stakeholders and through use of appropriate materials. The county council will also work with the local airports to seek to reduce disturbances from aircraft noise in Hertfordshire.
As mentioned in the EU Water Framework Directive, the highway is a significant contributor to diffuse pollution, where water run-off from the highway and pavement runs into rivers and water bodies, causing a reduction in water quality and biodiversity47. In order to help reduce this and prevent it in future, the county council will seek to find opportunities to minimise diffuse pollution from new transport infrastructure.
Highways infrastructure can also impact upon the aesthetics of the local environment and whilst this can be a negative impact, it must be recognised that it can also enhance an area and its environment. Whilst the county council will seek to ensure there are clear and effective signs on the network, which are vital for users both in terms of way finding and safety, it will also strive to ensure these signs are kept in character with the local area and environment. Signage will be implemented and monitored in accordance with national and local guidance, specifically the Network Management Strategy and Roads in Hertfordshire.
The impact of illumination from street lighting and traffic signing can harm the environment in terms of visual intrusion and light pollution. The county council will therefore seek to reduce the impacts where feasible, taking into account local considerations and the character of an area by following local and national guidance. New road infrastructure schemes (if the area exceeds one hectare) will be subject to Environmental Impact Assessment Screening under the Town and Country Planning (Environmental Impact Assessment) Regulations 2017.

88 Hertfordshire’s Local Transport Plan 2018
OutcomesThe policy aims to minimise the impact of transport on the natural environment and quality of the local environment, with opportunities taken to enhance the local environment in a number of ways for the benefit of the quality of place and the natural environment.
Relevant Supporting Documents• Highways Infrastructure Asset
Management Plan
• Network Management Strategy
• Roads in Hertfordshire
• Aircraft related noise complaints
• Percentage of county council street lights/signage changed to LED
• Greenhouse gas emissions (per tonne of CO2) from county council transport related lighting & infrastructure
• Local flora and fauna condition indicators
• Air Quality Strategy
• Rural Transport Strategy
M) Asset ManagementContextThe county council as the Highway Authority is responsible for the maintenance of highway infrastructure that would collectively cost in excess of £21 billion to replace (Gross Replacement Cost at 2016/17). These assets include all non-Highways England highway carriageways, footways, cycleways, drainage gullies, street lights, traffic signals and signs. Highway condition in particular is a high public priority.
175,000NON ILLUMINATEDSIGNS(HCC Asset Performance Report 2016/17)
5,110km 5,456kmcarriageway (A,B,C & unclassified roads)
footways & cycleways
COUNTY COUNCIL
inventory includes: INFRASTRUCTURE
115,500LAMP COLUMNS
1,600STRUCTURES
&
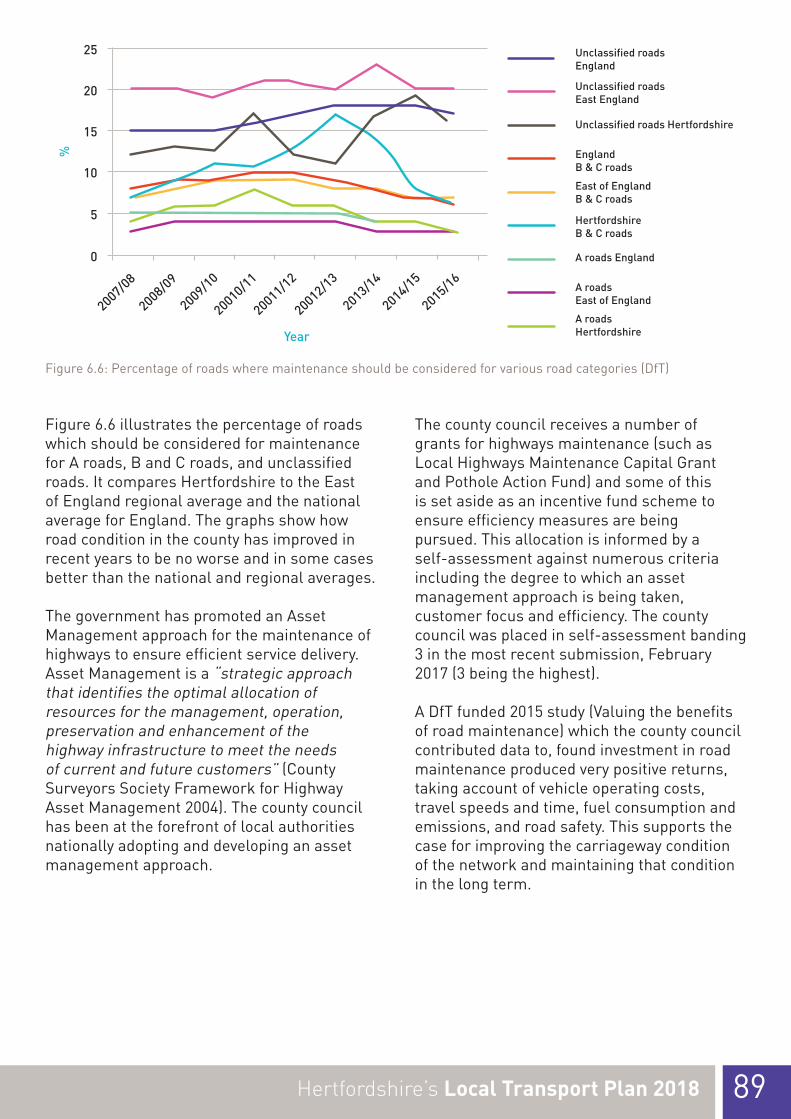
89Hertfordshire’s Local Transport Plan 2018
25
20
15
10
5
0
%
Year
2007/08
2008/09
2009/10
20010/11
20011/12
20012/13
2013/14
2014/15
2015/16
UnclassifiedroadsEngland
UnclassifiedroadsEastEngland
UnclassifiedroadsHertfordshire
EnglandB&Croads
EastofEnglandB&Croads
HertfordshireB&Croads
AroadsEngland
AroadsEastofEngland
AroadsHertfordshire
Figure 6.6: Percentage of roads where maintenance should be considered for various road categories (DfT)
Figure 6.6 illustrates the percentage of roads which should be considered for maintenance for A roads, B and C roads, and unclassified roads. It compares Hertfordshire to the East of England regional average and the national average for England. The graphs show how road condition in the county has improved in recent years to be no worse and in some cases better than the national and regional averages.
The government has promoted an Asset Management approach for the maintenance of highways to ensure efficient service delivery. Asset Management is a “strategic approach that identifies the optimal allocation of resources for the management, operation, preservation and enhancement of the highway infrastructure to meet the needs of current and future customers” (County Surveyors Society Framework for Highway Asset Management 2004). The county council has been at the forefront of local authorities nationally adopting and developing an asset management approach.
The county council receives a number of grants for highways maintenance (such as Local Highways Maintenance Capital Grant and Pothole Action Fund) and some of this is set aside as an incentive fund scheme to ensure efficiency measures are being pursued. This allocation is informed by a self-assessment against numerous criteria including the degree to which an asset management approach is being taken, customer focus and efficiency. The county council was placed in self-assessment banding 3 in the most recent submission, February 2017 (3 being the highest).
A DfT funded 2015 study (Valuing the benefits of road maintenance) which the county council contributed data to, found investment in road maintenance produced very positive returns, taking account of vehicle operating costs, travel speeds and time, fuel consumption and emissions, and road safety. This supports the case for improving the carriageway condition of the network and maintaining that condition in the long term.

90 Hertfordshire’s Local Transport Plan 2018
Nationally there is an acknowledged backlog in preventative maintenance and a legacy of underinvestment in the country’s highway infrastructure. Whilst asset management is primarily concerned with ensuring good asset condition, long term efficiency and value for money, it is important to recognise the contribution asset condition can make to a number of transport objectives. Safety is an obvious example, particularly with respect to cyclists, motorcyclists and pedestrians. Poor asset condition can deter people from choosing active modes of travel and, alongside inappropriate choice of materials, be to the detriment of the quality of place. Maintenance can also be a factor in poor network resilience, with respect to the need for road works or closures, and flooding. Asset management operations can also contribute to environmental objectives, particularly with regard to carbon emissions, energy consumption, raw material consumption and waste production.
Policy 22: Asset ManagementThe county council will:a) Ensure the Highway Infrastructure
Asset Management Plan fully considers how it can support delivery of the LTP objectives & policies, such as with regard to safety, accessibility, active travel and environmental impact.
b) Identify and apply industry-leading good practice to the management of all transport assets.
c) Maximise the opportunity for investment to maintain and improve the condition of the transport network.
d) Seek value for money for all transport assets and minimise future maintenance liabilities as far as possible.
ApplicationThe Asset Management Plan links strategic objectives to operational policies and procedures, its role is to support good decision making. A review of the previous county council Transport Asset Management Plan is informing a new LTP4
Highway Infrastructure Asset Management Plan (HIAMP) which will replace it. This includes an improvement plan to incorporate the requirements of the local highway maintenance fund self-assessment. A continued focus on asset management and planned maintenance will reduce future spend on more inefficient reactive approaches to maintaining the transport assets. As with other LTP4 supporting documents it is important that the new HIAMP fully considers the contribution it can make to LTP4 objectives, to ensure activity by the council and its partners aligns.
An important feature of the approach will be to engage the public and promote an understanding of the service to help manage expectations, and ensure as far as possible local needs are met. The role of elected members will be important in this, as will communications activity.
The county council will continue to work with its partners to reduce costs and identify efficiencies. Key to this will be staying up to date with industry good practice and applying it in the county. Advances in maintenance approaches, techniques, materials and in the application of technology, offer the potential to improve asset management service levels and efficiencies.
OutcomesThe policy seeks to ensure highway infrastructure is maintained efficiently with available investment optimised to deliver the desired level of service and condition which contributes positively to a wide range of LTP4 objectives.
Relevant Supporting Documents• Highways Infrastructure Asset
Management Plan
• Road Safety Strategy
Monitoring PerformanceOverall roads condition index for Hertfordshire’s roads

91Hertfordshire’s Local Transport Plan 2018
N) Growth and Transport PlansContextThe LTP4 suite of supporting documents (see Figure 2.1) will develop more detailed approaches to deliver the policies and objectives set out in LTP4 Strategy. Some of these strategies will focus on particular modes or issues but there is also a need for localised strategies to cover more specific areas or corridors.
Policy 23: Growth and Transport PlansThe county council will produce and maintain a series of Growth and Transport Plans (GTPs) covering different sub areas of Hertfordshire. Each plan will consider current and future challenges and identify interventions aligned to LTP objectives. The GTPs will also be informed by and in turn help to inform Local Plans and Infrastructure Delivery Plans which are prepared by the district/borough authorities in Hertfordshire.
ApplicationGrowth and Transport Plans (GTPs) will cover larger geographical areas than individual towns, cover multiple settlements and the corridors between them. GTP geography is informed by existing movement patterns and interurban relationships between towns.
GTPs will have a substantial evidence base and take into account Local Plan development proposals. They will consider intervention deliverability and understand the sequence of improvements and synergies between interventions. The scale of interventions involved in GTPs will vary and potentially include major proposals. Interventions will cover short, medium and long term (+10 years) time horizons, and may consider challenges and opportunities beyond the end of the existing Local Plan periods.
Figure 6.7 displays the indicative areas which GTPs will cover and also the expected year of production. Some areas in the county are not covered due to insufficient scales of planned growth and/or the level of transport planning complexity is insufficient to warrant the development of a more comprehensive local transport strategy. Improvements for the areas not covered will be identified through the other LTP supporting documents (Bus, Accessibility, Active Travel, Network Management etc.) and via planning applications and improvements required to mitigate new development.
The process of GTPs is delivered in five stages;1) Evidence Analysis to gain a strategic
impression of growth and transport related issues and exploring more specific issues at a local level.
2) Strategy Development which will involve using the evidence to develop a strategy which will guide the development of schemes and actions including identifying key outcomes.
3) Intervention Development using the evidence and strategy to develop packages of transport led multi-modal interventions and actions which address key challenges.
4) Consultation on the Growth and Transport Plans documentation with the public and taking the opportunity for focussed discussions with other stakeholders.
5) Finalisation and Adoption by collating feedback from the consultation, making updates to the GTP, finalising documentation and seeking approval prior to adoption.

92 Hertfordshire’s Local Transport Plan 2018
© Crown copyright and database rights 2018 OS EUL 100019606
You are permitted to use this data solely to enable you to respond to, or interact with, the organisation that provided you with the data. You are not permitted to copy, sub-licence, distribute or sell any of this data to third parties in any form.
Figure 6.7: Growth and Transport Plans coverage and timetable
Officer and councillor steering groups will oversee GTP development and include representatives from across the county council, the LEP and the relevant districts/borough councils.
In addition to GTPs, LTP4 Implementation Plans will be informed by additional local studies and corridor studies. For example, the A414 Corridor Strategy being undertaken during 2017/18 to better understand infrastructure requirements along this corridor linked to the scale of planned growth surrounding it. It will recognise the links between transport challenges, economic development and housing agenda on the corridor and identify future priorities in terms of infrastructure investment and delivery.
OutcomesThe desired outcomes from the GTP policy are the formulation of more robust and deliverable local transport improvement plans, which facilitate transport investment, make the best use of resources and fully support new development and the delivery of the LTP4 objectives. The GTPs will also provide clarity to the public and other partners on planned transport improvements.

93Hertfordshire’s Local Transport Plan 2018
LTP
4 P
olic
y A
lignm
ent t
o St
rate
gic
Obj
ecti
ves
and
Pri
ncip
les
The
tabl
e be
low
illu
stra
tes
how
the
prec
edin
g po
licy
stat
emen
ts s
uppo
rt th
e de
liver
y of
the
LTP
obj
ectiv
es. I
t als
o in
dica
tes
how
they
de
mon
stra
te th
e LT
P p
rinc
iple
s.
Page
1.ImproveaccesstointernationalgatewaysandregionalcentresoutsideHertfordshire.
2.EnhanceconnectivitybetweenurbancentresinHertfordshire.
3.Improveaccessibilitybetweenemployersandtheirlabourmarkets.
4.EnhancejourneytimereliabilityandnetworkresilienceacrossHertfordshire.
5.Enhancethequalityandvitalityofourtowncentres
6.PreservethecharacterandqualityoftheHertfordshireenvironment.
7.Reducecarbonemissions
8.Makejourneysandtheirimpactsaferandhealthier
9.Improveaccessandenableparticipationineverydaylifethroughtransport
Intergrationoflanduse&transportplanning
Application&adoptionoftechnology
Costeffectivedelivery&maintenance
Modalshift&encouragingactivetravel
1.Tran
sportU
serH
ierarchy
1.Tran
sportU
serH
ierarchy
45ü
üü
üü
üü
üü
üü
ü2.
Influ
encing
land
useplann
ing
47ü
üü
üü
üü
üü
üü
3.Trav
elPlans
and
Beh
aviourCha
nge
49ü
üü
üü
üü
üü
ü4.
Deman
dMan
agem
ent
51ü
üü
üü
üü
üü
üü
3.De
velopm
entM
anag
emen
t5.
Deve
lopm
entM
anag
emen
t53
üü
üü
üü
üü
üü
ü4.Ac
cessibility
6.Ac
cessibility
56ü
üü
üü
üü
üü
7.Ac
tiveTrav
elW
alking
61ü
üü
üü
üü
üü
üü
8.Ac
tiveTrav
elCyclin
g61
üü
üü
üü
üü
üü
üü
6.Pa
ssen
gerT
rans
port-Bu
ses
9.Bus
es66
üü
üü
üü
üü
üü
üü
ü7.Pa
ssen
gerT
rans
port-Ra
il10
.Rail
70ü
üü
üü
üü
üü
ü8.Airports
11.A
irports
72ü
üü
üü
üü
12.N
etworkMan
agem
ent
73ü
üü
üü
üü
üü
üü
ü
13.N
ewRoa
dan
dJunc
tions
75ü
üü
üü
üü
üü
üü
ü14
.Clim
ateCh
ange
NetworkRe
silienc
e76
üü
üü
15.S
peed
Man
agem
ent
76ü
üü
üü
ü16
.Freightand
Log
istics
77ü
üü
üü
ü10
.Roa
dSa
fetyand
secu
rity
17.R
oadSa
fety
81ü
üü
üü
üü
ü18
.Trans
portSafetyan
dSe
curit
y81
üü
üü
üü
ü
19.E
miss
ions
redu
ction
84ü
üü
üü
üü
ü
20.A
irQua
lity
84ü
üü
üü
üü
ü12
.Env
ironm
ent(Noise,n
aturaland
historicenv
ironm
ent)
21.E
nviro
nmen
t87
üü
üü
üü
üü
13.Assetm
ange
men
t22
.AssetM
anag
emen
t90
üü
üü
üü
üü
üü
üü
ü14
.Growth&Tran
sportP
lans
and
Urban
Tran
sportP
lans
23.G
rowthand
Trans
portPlans
91ü
üü
üü
üü
üü
üü
üü
11.Emiss
ions
Red
uctio
n-C
arbo
n&Air
Qua
lity
Objectiv
esSup
ported
PrinciplesDem
onstrated
2.Influ
encing
Trave
lBeh
aviour
5.Ac
tiveTrav
el
9.Man
agingthemov
emen
tofv
ehicle
traffic
and
freigh
t
LTP4
Policy
LTP4
PolicySection(Cha
pter6)
Fi
gure
6.8
: LTP
4 po
licy
alig
nmen
t to
Obj
ectiv
es a
nd P
rinc
iple
s

94 Hertfordshire’s Local Transport Plan 2018
7. Major Schemes and Corridor Commentary• TheLTPprovidesahighleveloverview
ofwhatthestrategymeansforkeymultimodalmovementcorridorsinthecounty.
• Thisincludesmajorschemeproposals,transportimprovementsthatwillberequiredtodelivermajordevelopmentsitesandschemesthatwillbedeliveredbyHighwaysEngland,NetworkRailandotheragencies.
This chapter outlines the schemes and interventions that will be needed, or investigated, to support the delivery of the LTP4 Strategy.
The schemes have been informed by consideration of issues and opportunities on the key multimodal movement corridors outlined previously on page 38. The following pages outline the strategic approach and priorities for each of these corridors, followed by a map of scheme proposals and additional detail on these. The emphasis on multimodal is important and as many of the corridors include Network Rail and Highways England infrastructure, the county council will seek to work with these partners and the DfT to ensure joined up strategies for road and rail in the county.
Recognising uncertainties over future transport demands but also scheme funding and deliverability, many of the county council proposals are scalable. This means their implementation, design, cost and complexity can be flexible. More detail on specific schemes is provided later in this chapter.
This document provides only an outline of transport improvements which will be considered further in the Growth and Transport Plans and other LTP4 supporting documents and studies (see chapter 8 on the implementation plan for more detail on this process). The schemes on their own will not be sufficient to deliver the LTP objectives and will require packages of supporting initiatives. Again these will be developed as part of the LTP supporting documents. It should be noted that some of the Growth and Transport Plans and supporting documents will not be published until sometime after the adoption of the Local Transport Plan Strategy.
The transport improvements outlined also include some improvements being promoted outside Hertfordshire which will impact on the local transport system, and some transport improvements likely to come forward as part of planned major new development sites. The information included in the proposals map and accompanying table reflects the understanding up to August 2017, and future LTP4 Implementation Plans will provide updates.
Corridor 1: Aylesbury – Watford – London
The primary connections within this movement corridor are the A41, M25, the West Coast Main Line and Chilterns Line, with connectivity to London beyond Watford also provided by the M1 and London Overground rail services. The A41 and rail routes provide good interurban links, as well as carrying longer distance traffic. As with other corridors there is a strong commuter flow into London by road and rail. Other notable commuter flows include those between Hemel Hempstead and
© Crown copyright and database rights 2018 OS EUL 100019606. You are permitted to use this data solely to enable you to respond to, or interact with, the organisation that provided you with the data. You are not permitted to copy, sub-licence, distribute or sell any of this data to third parties in any form.

95Hertfordshire’s Local Transport Plan 2018
Watford, and from Harrow and Three Rivers district into Watford.
The main scheme priorities for the Aylesbury – Watford – London corridor are improvements to passenger transport connections between urban centres. The latter being achieved by improved rail and bus services and connectivitysuch as with the Metropolitan Line Extension and Watford North Curve rail scheme, in addition to improved rail station access and interchange including Watford Junction and Hemel Hempstead stations. The major commuter flows into London and the role of Watford Junction station as a key interchange point for local and long-distance rail servicesare also recognised.
Features of our strategic approach within this corridor include:• Supporting the development of the major
economic growth locations at Hemel Hempstead and Watford.
• Supporting the sustainable delivery of housing growth, particularly at Hemel Hempstead (West and East), Watford and Berkhamsted.
• Supporting initiatives to regenerate Hemel Hempstead town centre, enhance it as a destination and make it highly accessible.
• Working with Highways England to ensure the safe and effective operation of their network within the corridor (M25), and its interchanges with the local network.
• Seeking increased local and intercity train services on the West Coast Main Line.
Corridor 2: London-Watford-Luton-Milton Keynes
The primary connections within this movement corridor are the M1, M25, A405, the Midland Main Line and West Coast Main Line. These carry strategic long distance movements, but also cater for more local inter-urban movements. The M1 and M25 are routes of national strategic importance and carry large quantities of freight. A number of other A roads in the corridor cater predominantly for local movements, but are impacted when there are problems on the more strategic routes. There is significant travel demand by road and rail into London. The Abbey Line branch railway provides a connection between St Albans and Watford with significant onward commuter travel to London. Luton Airport generates significant travel demand. Notable commuter patterns are from Luton and Dunstable to St Albans and Hemel Hempstead, and between Hemel Hempstead and Watford.
The main scheme priorities for the corridor are to improve interurban passenger transport connectivity, rail enhancements to provide sufficient capacity and service levels to London and beyond: and improvements to rail station accessibility. We will work with Luton Borough Council and airport operators on improving surface access to Luton Airport, and work with Highways England to ensure effective operation of M1 with improved connections to enable economic development in north-east Hemel Hempstead.
© Crown copyright and database rights 2018 OS EUL 100019606. You are permitted to use this data solely to enable you to respond to, or interact with, the organisation that provided you with the data. You are not permitted to copy, sub-licence, distribute or sell any of this data to third parties in any form.

96 Hertfordshire’s Local Transport Plan 2018
Features of our strategic approach within this corridor include:• Supporting the development of the major
economic growth locations at Watford, the Envirotech Enterprise Zone incorporating Maylands Business Park, as well as at Luton Airport Enterprise Zone via working in cooperation with Luton Borough Council.
• Supporting the sustainable delivery of housing growth, particularly at Hemel Hempstead (West and East), Watford, St Albans and east of Bricket Wood.
• Working in partnership with Luton Borough Council and airport operators to improve surface access to the airport to support its growth.
• Support delivery of works to mitigate the impact of development at the Radlett Aerodrome site.
• Working with Highways England to ensure the safe and effective operation of their network within the corridor [M1, M25 and the short sections of the A415 and A404 they manage], and its interchanges with the local network.
• The Thameslink programme which will deliver extra train capacity and increased frequencies by 2018 plus increased range of destinations (Kent, Surrey and Sussex stations). Extension of Thameslink services (possible post 2024) with electrification will provide additional long distance capacity north of Hertfordshire and improved connections to East Midlands and the north.
Corridor 3: London – Stevenage – Peterborough
The primary connections within this movement corridor are the A1(M), M25 and East Coast Main Line. Both the A1(M) and M25 serve longer distance strategic movements, but also a significant amount of local interurban movements. Other important connections running parallel to the A1(M) include the A1000 and B197 which serve more local interurban movements. London attracts significant commuter flows by road and rail in the corridor. There are also notable commuter flows between the towns in the north of the corridor (Hitchin, Letchworth Garden City and Baldock) and Stevenage, from Stevenage to Welwyn Garden City, and between Welwyn Garden City and Hatfield.
The main scheme priorities for the corridor are improved walking and cycling links between the towns of Hitchin, Letchworth Garden City and Baldock, and improved interurban bus connectivity between towns in the corridor. Other priorities include Stevenage Station improvement and its role as a passenger transport hub strengthened, rail capacity and service levels into London, and the delivery of the A1(M) Junction 6-8 Smart Motorway scheme. As part of the Smart Motorway scheme we will seek to capture the benefits this presents for parallel routes to the A1(M) where traffic reductions will enable improvements in provision for other modes. Linked with this we will also seek to ensure any further A1(M) plans in the county consider the potential role of all modes in the corridor and focus on making best use of existing capacity.
© Crown copyright and database rights 2018 OS EUL 100019606. You are permitted to use this data solely to enable you to respond to, or interact with, the organisation that provided you with the data. You are not permitted to copy, sub-licence, distribute or sell any of this data to third parties in any form.

97Hertfordshire’s Local Transport Plan 2018
Features of our strategic approach within this corridor include:• Supporting the development of economic
growth locations notably at Welwyn Garden City and Hatfield including its regeneration plans, as well as at Stevenage as part of support for the overall regeneration of its town centre.
• Supporting the sustainable delivery of housing growth, particularly at Baldock, Letchworth Garden City, Hitchin, Stevenage, Knebworth, Welwyn Garden City and Hatfield.
• Working with Highways England to ensure the safe and effective operation of their network within the corridor [A1(M), M25], and its interchanges with the local network.
• Working with Highways England on the effective delivery of the A1(M) Smart Motorway Scheme Junction 6-8 by 2020.
• Seeking East Coast Main Line service improvements enabled by the implementation of High Speed 2 Phase 2 (which could include additional long-distance stopping services at Stevenage and increased frequency and capacity for services from Welwyn Garden City and Hatfield).
Corridor 4: London – Harlow - Stansted – Cambridge
The primary connections within this strategic movement corridor include the West Anglia Main Line railway and the M11 motorway. Other routes that serve the corridor include the southern section of the A10, eastern end of the A414 in Hertfordshire and the A1184. The M11 caters for longer distance strategic movements and freight. The West Anglia Main Line is a popular commuter route and includes the Hertford East branch line. Travel demand by road and rail is high into London, and Stansted Airport also generates significant demand in the corridor. The A10 accommodates some longer distance flows but predominantly serves flows between
Broxbourne, Harlow, Hertford/Ware and Stevenage via the A602. Notable travel patterns are along the A10 (between the towns of Hertford/Ware to Cheshunt/Broxbourne and Enfield), from adjacent areas of East Hertfordshire into Harlow, between Bishop’s Stortford and Harlow, and between Bishop’s Stortford and areas east of it including Stansted Airport.
The main scheme priorities for the corridor are the enhancement in rail capacity and service from delivery of West Anglia Main Line four tracking and Crossrail 2 schemes.This includes developing plans for new station proposals as part of these projects and maximising station accessibility and the opportunities these projects bring to the area. Other priorities include supporting growth and access to town centres, employment sites and rail stations. A further priority is ensuring transport improvements required to serve growth north of Harlow are sustainable and do not negatively impact the wider highway network.
Features of our strategic approach within this corridor include:• Supporting the development of economic
growth locations notably at Broxbourne (Park Plaza) and Harlow including its enterprise zone.
• Supporting the sustainable delivery of housing growth, particularly the new Garden Town at Gilston north of Harlow, Bishop’s Stortford, Ware and Broxbourne.
• Working with Highways England to ensure the safe and effective operation of their network within the corridor [M11, M25] and its interchanges with the local network.
• Working with neighbouring authorities and the airport operator to secure improvements to surface access to Stansted Airport to support its growth.
© Crown copyright and database rights 2018 OS EUL 100019606. You are permitted to use this data solely to enable you to respond to, or interact with, the organisation that provided you with the data. You are not permitted to copy, sub-licence, distribute or sell any of this data to third parties in any form.

98 Hertfordshire’s Local Transport Plan 2018
• Working in partnership with Broxbourne Borough Council and Network Rail on proposals for new rail stations at Park Plaza and Turnford. Also, work with the train operating company to provide stops at Broxbourne and/or Cheshunt stations for Stansted fast services, or alternatively deliver better connectivity between trains at interchanges with reduced waiting times.
• Supporting work to develop and bring forward West Anglia Main Line four tracking and Crossrail 2 schemes.
Corridor 5: Hemel Hempstead & Watford – St Albans – Harlow
This corridor forms one of the primary east west transport links in the county and is centred on the A414 and A405. There is only partial rail connectivity in the corridor provided by the Abbey Line branch of the West Coast Main Line and Hertford East branch of the West Anglia Main Line. Green Line Bus 724 serves the corridor between Harlow and Watford (continuing onto Heathrow via Rickmansworth). The A414 intersects all of the key north south highway routes in the county, and with the A405 connects a number of the county’s larger towns. Both the A414 and A405 serve local interurban traffic movements as well as longer distance flows, and provide diversion routes for the M25. The western section of the A414 between the A405 and A1(M) in particular serves a significant proportion of strategic traffic flows between the M25 and A1(M).
In addition to the larger towns on the corridor there are notable large employment sites at Maylands to the east of Hemel Hempstead, and Hatfield Business Park which generate travel demand. Notable travel flows in the corridor are between Hemel Hempstead, Watford and St Albans, between St Albans and Welwyn Hatfield, Hertford to Welwyn Garden City, between Hertford and Ware and between these two towns and Broxbourne borough. The main scheme priorities for the corridor
are a significant improvement in interurban passenger transport connectivity in the corridor notably through delivery of an east-west bus rapid transit scheme, with park and ride provision implemented alongside this where possible. Highway improvements to support growth will be needed in East Hemel Hempstead, at multiple junctions along the A414, at Hertford and north of Harlow.
Features of our strategic approach within this corridor include:• Supporting the development of economic
growth locations notably at Maylands Hemel Hempstead, St Albans, Hatfield, Welwyn Garden City and Harlow.
• Supporting the sustainable delivery of housing growth, particularly at Hemel Hempstead, Watford, St Albans, Welwyn Hatfield district, Hertford, Ware and the new Harlow and Gilston Garden Town.
• Working with Highways England to ensure the safe and effective operation of their network within the corridor [M1, A1(M), M11, M25 and A405] and its interchanges with the local network, but also the whole stretch of the M25 from Junctions 20 to 27 given the parallel A414 provides a diversion route for this.
• Supporting delivery of works to mitigate the impact of development on the Radlett Aerodrome site.
• Developing an A414 Corridor Strategy to more fully consider the function, issues and options for improving this corridor to support growth and the delivery of LTP objectives. This includes considering whether a Harlow northern bypass is required linking the A414 with the new M11 junction 7A.
• Working in partnership with Network Rail and Train Operating Companies to bring forward improvements to capacity on the Hertford East branch line, and short to medium term service improvements on the Abbey Line as detailed in the LTP4 Rail Strategy. Further consideration will be given to long term passenger transport options on the Watford to St Albans corridor, which could enhance town centre and station
© Crown copyright and database rights 2018 OS EUL 100019606. You are permitted to use this data solely to enable you to respond to, or interact with, the organisation that provided you with the data. You are not permitted to copy, sub-licence, distribute or sell any of this data to third parties in any form.

99Hertfordshire’s Local Transport Plan 2018
connectivity and complement other LTP4 scheme proposals in the area.
Corridor 6: Luton – Stevenage
The primary connections within this strategic movement corridor are the A505 and A602. These routes provide the strategic link between Luton, Luton Airport, the A1(M) and Stevenage, as well as serving the towns of Hitchin, Letchworth Garden City and Baldock. In addition to these towns, Luton Airport generates a significant amount of traffic on the corridor. Traffic flows are generally localised between the towns along the corridor, although there are some longer distance movements between the A10/A602 in the east and A6 in the west. A number of lower category parallel routes also serve the corridor with some traffic using these to avoid congestion at Luton or Hitchin. Notable travel flows in this corridor are between Luton/Dunstable and Hitchin and Stevenage, as well as Letchworth Garden City to Stevenage.
The main scheme priorities in the corridor are to improve interurban passenger transport connectivity from Luton to Stevenage, and improve sustainable travel links between the towns of Hitchin, Letchworth Garden City and Baldock. We will work in partnership with local and neighbouring planning authorities and Highways England on long term growth plans and transport improvements, to understand the need for more significant highway improvements along the corridor.
Features of our strategic approach within this corridor include:• Supporting the development of economic
growth locations notably at Stevenage.
• Supporting the sustainable delivery of housing growth, particularly east of Luton, northwest Hitchin, north Letchworth Garden City, Baldock and Stevenage.
• Working with Highways England to ensure the safe and effective operation of their network within the corridor [A1(M)] and its interchanges with the local network.
• Conducting a study with other local authority partners, informed by long term growth and transport improvement plans, to identify passenger transport and highway improvements to better connect Luton and Stevenage. This will be delivered either as part of or complementary to the North Central Hertfordshire Growth and Transport Plan covering this corridor.
• Working in partnership with Luton Borough Council and airport operators to improve surface access to the airport to support its growth.
Corridor 7: Stevenage – Cambridge
The primary connections in this movement corridor are the A505 and Cambridge branch of the East Coast Main Line. The corridor links the A1(M) and its adjacent towns, with Cambridge and the M11 corridor. The A505 caters for both local movements and also longer distance traffic flows between the M25 and A1(M) in the south, and Cambridge and the East of England via the A14. Notable travel flows in the corridor are between Stevenage and the north Hertfordshire towns of Hitchin, Letchworth Garden City and Baldock, and from Royston into south Cambridgeshire and Cambridge. Relative to other corridors, travel flows along the corridor by rail or bus are low.
The main scheme priorities for the corridor are improving rail service levels and station access in the A1(M) corridor towns in Hertfordshire to increase rail mode share in this corridor to Cambridge, and working with adjacent authorities to improve sustainable travel access from Royston into Cambridgeshire.
© Crown copyright and database rights 2018 OS EUL 100019606. You are permitted to use this data solely to enable you to respond to, or interact with, the organisation that provided you with the data. You are not permitted to copy, sub-licence, distribute or sell any of this data to third parties in any form.
© Crown copyright and database rights 2018 OS EUL 100019606. You are permitted to use this data solely to enable you to respond to, or interact with, the organisation that provided you with the data. You are not permitted to copy, sub-licence, distribute or sell any of this data to third parties in any form.

100 Hertfordshire’s Local Transport Plan 2018
Features of our strategic approach within this corridor include:• Supporting the development of economic
growth locations notably at Stevenage
• Supporting the sustainable delivery of housing growth, particularly at Stevenage, Letchworth Garden City, Baldock and Royston.
• Working with Highways England to ensure the safe and effective operation of their network within the corridor [A1(M) and M11] and its interchanges with the local network
• Working with Network Rail and Train Operating Companies on improved station access and rail service levels.
Corridor 8: Stevenage - Stansted
This corridor connects Stevenage and other towns on the A1(M) with Stansted Airport and the M11 corridor. The highway route is not particularly direct with the primary connections within this movement corridor being the A602, A10 and A120. Partial rail connectivity is provided by the Hertford Loop of the East Coast Main Line between Stevenage and Hertford North station. Owing to the indirect nature of the highway route a number of parallel routes, including the A507 and lower category routes, also cater for movements between the A1(M) and A120. National Express service 777 operates along the corridor length. Travel patterns along the corridor are not as pronounced as other key corridors in the county, with the most notable flows between Stevenage and Hertford, and between Bishop’s Stortford and areas east of it including Stansted Airport. Stevenage in the west and Stansted Airport in the east are the main drivers of travel demand in the corridor, but there is little demand for travel along its full length between these two nodes.
The main scheme priorities for the corridor are improved rail connectivity between Stevenage and Hertford, potentially in conjunction with park and ride provision. Highway and traffic management works to ensure reliable journeys on the A602, A120 and A10 may be necessary to reduce levels of rat running on other lower category routes.
In the absence of significant additional housing growth within the corridor area there does not appear a strong case for significant investment and improvements in connectivity along the corridor in the medium term. The economic case for additional improved connectivity between the A1(M) and A10/M11 corridors is unclear, given the improvements to the A414 outlined in this LTP, and the existing function of the M25, A428 (part of planned Oxford-Cambridge Expressway) and A505. The benefit of better connectivity by road or passenger transport between Luton and Stansted airports is also unclear. However, the current indirect nature of the route by major road and passenger transport, and the risk of increased east-west travel demand on less appropriate routes, are issues any significant growth/new settlement proposals for the post 2031 period should consider addressing in the long term.
Features of our strategic approach within this corridor include:• Supporting the development of economic
growth locations notably at Stevenage.
• Supporting the sustainable delivery of housing growth, particularly at Stevenage, North of Ware and Bishop’s Stortford.
• Working with Highways England to ensure the safe and effective operation of their network within the corridor [A1(M) and M11] and its interchanges with the local network.
• Working with neighbouring authorities and the airport operator to improve surface access to Stansted Airport.
© Crown copyright and database rights 2018 OS EUL 100019606. You are permitted to use this data solely to enable you to respond to, or interact with, the organisation that provided you with the data. You are not permitted to copy, sub-licence, distribute or sell any of this data to third parties in any form.

101Hertfordshire’s Local Transport Plan 2018
• Working with Network Rail and train operating companies to deliver a Hertford Loop metro to provide enhanced connectivity between Stevenage and Hertford, supported by improved accessibility and interchange at Stevenage and Hertford stations with bus and active travel modes. A new rail station south of Stevenage on the Hertford Loop should be investigated. See LTP4 Rail Strategy for details.
To Note:The transport proposals map and details which follow do not include all future significant transport improvement schemes as additional interventions may be identified by other LTP supporting documents, notably the Growth and Transport Plans, but also others such as the Intalink Bus Strategy which may identify bus service improvement schemes on the core bus network featured as part of Policy 9 (Buses).
Figure 7.1 Transport Proposals Map
Further details of the transport proposals displayed in the ‘Transport Proposals Map’ (fig. 7.1) are provided in the following scheme table on page 102 and 103.
© Crown copyright and database rights 2018 OS EUL 100019606You are permitted to use this data solely to enable you to respond to, or interact with, the organisation that provided you with the data. You are not permitted to copy, sub-licence, distribute or sell any of this data to third parties in any form.

102 Hertfordshire’s Local Transport Plan 2018
Scheme Table
CategoriesLead Authority/ Promoter
Status Time Frame Information
Transport Improvements to support new development
(Specific junctions known to be affected)
1) Radlett Aerodrome Site
DeveloperPlanning Consent Granted
Short - Medium
New site access and junction upgrades including on the A414, A5183 and at M25 J21A. Also potential new highway link through the site.
2) Gilston North of Harlow
DeveloperSubject to Planning Consent
Medium-Long
New and improved access roads and junctions to serve the development, including a second highway crossing of the River Stort. A414 Strategy will consider additional requirements, including need for a full Harlow northern bypass linking the A414 with Junction 7a.
3) Baldock DeveloperSubject to Planning Consent
Medium New site access onto B656/A505 and A507 with highway link through site.
4) Brookfield Development Area / A10 Turnford interchange
DeveloperSubject to Planning Consent
Medium Includes new site accesses onto the A10 at the Turnford Interchange and the B156.
5) Bishop’s Stortford North
DeveloperSubject to Planning Consent
Short-Medium Includes new site accesses onto A120, A1250 and B1004.
6) East Hemel Hempstead Developer
Subject to Planning Consent
MediumIncludes upgraded A414/Green Lanes junction, M1 Junction 8 enhancements and new spine road linking the A414 and B487.
Junction Improvement
(Multiple Junction
Improvements)
A414/A1081 Hertfordshire County Council (HCC)
To be investigated Medium A414 Corridor Strategy to investigate.
A414 Colney Heath/Smallford Lane Longabout
HCC Proposed Short-Medium Road safety scheme
A1(M) J4, A414/A1001, A414/Great North Road.
HCC / Highways England
To be investigated Medium A414 Corridor Strategy to investigate.
M25 J25 Highways England
Funding Secured Short Options consulted on in early 2017
Harlow A414 multiple junctions
Essex County Council
Being implemented Short Various A414 junction upgrades to support
new development in Harlow.
M11 J7 Highways England Committed Short
Junction upgrade scheme included in Highways England Road Investment Strategy 2015-2020.
M11 J8 Essex County Council
Subject to Planning Consent
Short Junction upgrade.
Buntingford A10 HCC Funding
Secured Short Hertfordshire LEP Growth Funding secured for this junction upgrade.
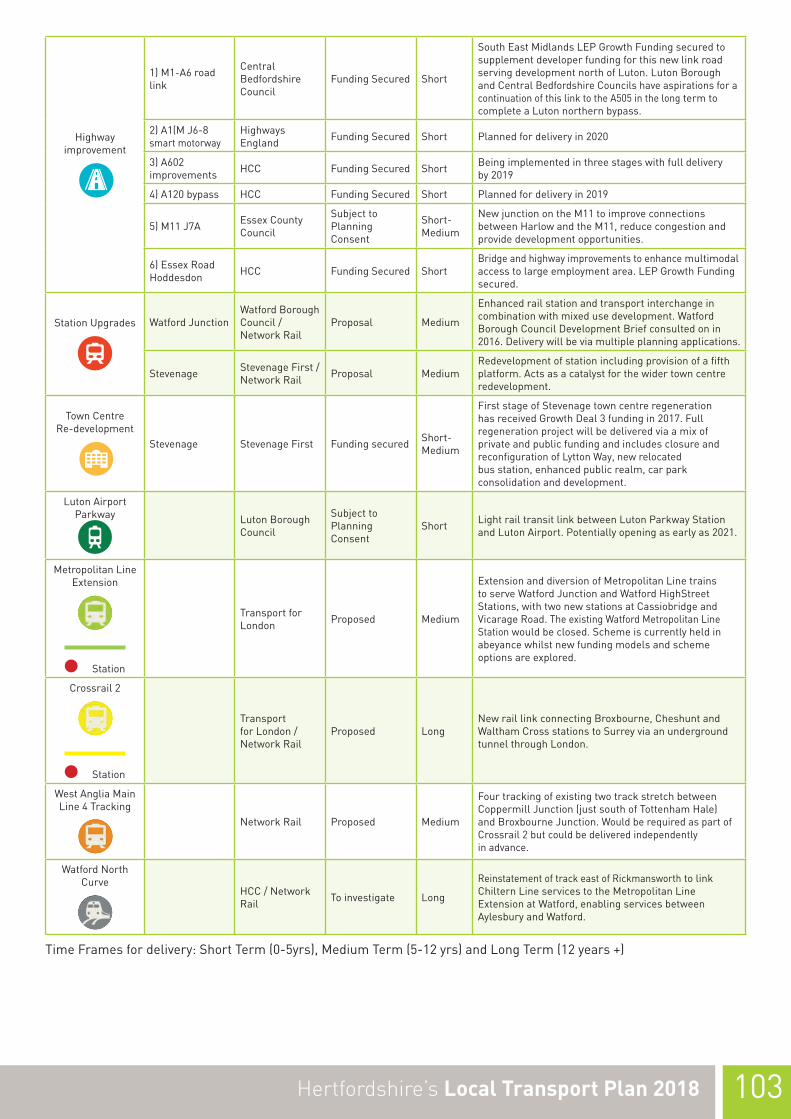
103Hertfordshire’s Local Transport Plan 2018
Highway improvement
1) M1-A6 road link
Central Bedfordshire Council
Funding Secured Short
South East Midlands LEP Growth Funding secured to supplement developer funding for this new link road serving development north of Luton. Luton Borough and Central Bedfordshire Councils have aspirations for a continuation of this link to the A505 in the long term to complete a Luton northern bypass.
2) A1(M J6-8 smart motorway
Highways England Funding Secured Short Planned for delivery in 2020
3) A602 improvements HCC Funding Secured Short Being implemented in three stages with full delivery
by 2019
4) A120 bypass HCC Funding Secured Short Planned for delivery in 2019
5) M11 J7A Essex County Council
Subject to Planning Consent
Short-Medium
New junction on the M11 to improve connections between Harlow and the M11, reduce congestion and provide development opportunities.
6) Essex Road Hoddesdon HCC Funding Secured Short
Bridge and highway improvements to enhance multimodal access to large employment area. LEP Growth Funding secured.
Station Upgrades Watford JunctionWatford Borough Council / Network Rail
Proposal Medium
Enhanced rail station and transport interchange in combination with mixed use development. Watford Borough Council Development Brief consulted on in 2016. Delivery will be via multiple planning applications.
Stevenage Stevenage First / Network Rail Proposal Medium
Redevelopment of station including provision of a fifth platform. Acts as a catalyst for the wider town centre redevelopment.
Town Centre Re-development
Stevenage Stevenage First Funding secured Short-Medium
First stage of Stevenage town centre regeneration has received Growth Deal 3 funding in 2017. Full regeneration project will be delivered via a mix of private and public funding and includes closure and reconfiguration of Lytton Way, new relocated bus station, enhanced public realm, car park consolidation and development.
Luton Airport Parkway Luton Borough
Council
Subject to Planning Consent
Short Light rail transit link between Luton Parkway Station and Luton Airport. Potentially opening as early as 2021.
Metropolitan Line Extension
Station
Transport for London Proposed Medium
Extension and diversion of Metropolitan Line trains to serve Watford Junction and Watford HighStreet Stations, with two new stations at Cassiobridge and Vicarage Road. The existing Watford Metropolitan Line Station would be closed. Scheme is currently held in abeyance whilst new funding models and scheme options are explored.
Crossrail 2
Station
Transport for London / Network Rail
Proposed LongNew rail link connecting Broxbourne, Cheshunt and Waltham Cross stations to Surrey via an underground tunnel through London.
West Anglia Main Line 4 Tracking
Network Rail Proposed Medium
Four tracking of existing two track stretch between Coppermill Junction (just south of Tottenham Hale) and Broxbourne Junction. Would be required as part of Crossrail 2 but could be delivered independently in advance.
Watford North Curve
HCC / Network Rail To investigate Long
Reinstatement of track east of Rickmansworth to link Chiltern Line services to the Metropolitan Line Extension at Watford, enabling services between Aylesbury and Watford.
Time Frames for delivery: Short Term (0-5yrs), Medium Term (5-12 yrs) and Long Term (12 years +)

104 Hertfordshire’s Local Transport Plan 2018
Cycle Infrastructure Improvement TownsBaldock, Berkhamsted, Bishop’s Stortford, Borehamwood, Broxbourne, Harpenden, Hatfield, Hemel Hempstead, Hertford, Hitchin, Hoddesdon, Letchworth Garden City, Potters Bar, Rickmansworth, Royston, St Albans, Stevenage, Tring, Ware, Watford and Welwyn Garden City.
Status: Concept
Lead Authority/ Promoter: HCC
Further to the cycling policy (Policy 8) this identifies those towns where the Propensity to Cycle Tool identifies the most heavily used cycle routes in the future. Some towns have a small number of popular routes, others have many. Implementation of improvements is scalable with flexibility over cycling network coverage, engineering solutions and timescales for implementation. Scheme details to be included in the LTP4 Active Travel Strategy and Growth and Transport Plans.
Sustainable Travel TownsStatus: Concept
Lead Authority/ Promoter: HCC
Comprehensive packages of schemes and behaviour change initiatives aimed at achieving a significant modal shift to non-car modes and reduction in single occupancy car use. Packages could feature improved cycling, walking and passenger transport infrastructure and service levels, in combination with initiatives such as travel planning and marketing. The application of park and ride and other parking demand management approaches should also be considered as these would complement other improvements in passenger transport, and improved provision for sustainable modes in the towns. Implementation is scalable with flexibility over implementation timescales, level of mode shift targeted and package composition. Sustainable Travel Towns provide the potential for greater housing density and car free development, and therefore could support the future delivery and development of local land use plans. The detailed criteria for any settlement being included in the Sustainable Travel Towns programme will be subject to further local discussion to ensure that they have the full support of key stakeholders and the wider community.
Passenger Transport Hub/Coachway to Investigate: M1 J8 and A1(M) J8
Status: Concept
Lead Authority/ Promoter: HCC
In conjunction with other passenger transport improvements, and park and ride proposals that could come forward, these hubs could link local passenger transport services and long distance coach services to improve passenger transport connectivity and achieve modal shift. They should be developed to be adaptable and thereby support or complement a future transport system comprising various levels of autonomous vehicle adoption, as well as potentially offering additional functionality such as online shopping delivery and collection. An alternative A1(M) scheme could be considered in the vicinity of Junction 7 if deemed preferable to one near Junction 8. Concept to be considered in relation to LTP4 Growth and Transport Plans.
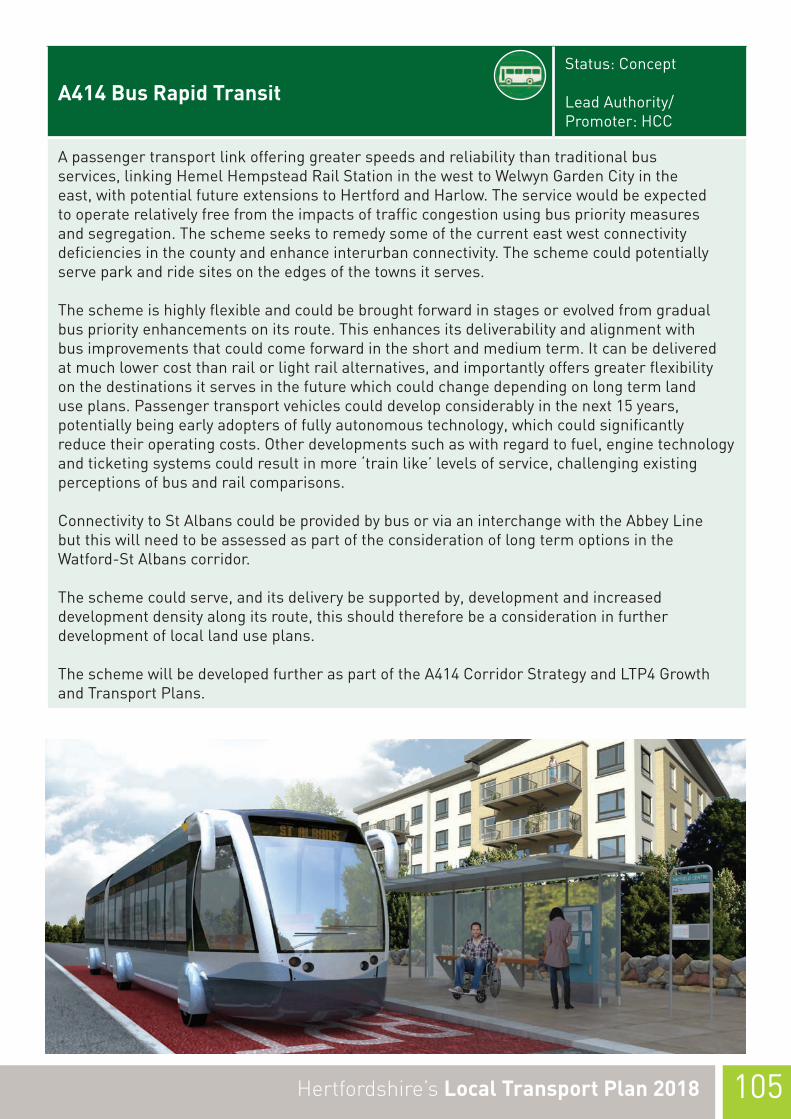
105Hertfordshire’s Local Transport Plan 2018
A414 Bus Rapid TransitStatus: Concept
Lead Authority/ Promoter: HCC
A passenger transport link offering greater speeds and reliability than traditional bus services, linking Hemel Hempstead Rail Station in the west to Welwyn Garden City in the east, with potential future extensions to Hertford and Harlow. The service would be expected to operate relatively free from the impacts of traffic congestion using bus priority measures and segregation. The scheme seeks to remedy some of the current east west connectivity deficiencies in the county and enhance interurban connectivity. The scheme could potentially serve park and ride sites on the edges of the towns it serves.
The scheme is highly flexible and could be brought forward in stages or evolved from gradual bus priority enhancements on its route. This enhances its deliverability and alignment with bus improvements that could come forward in the short and medium term. It can be delivered at much lower cost than rail or light rail alternatives, and importantly offers greater flexibility on the destinations it serves in the future which could change depending on long term land use plans. Passenger transport vehicles could develop considerably in the next 15 years, potentially being early adopters of fully autonomous technology, which could significantly reduce their operating costs. Other developments such as with regard to fuel, engine technology and ticketing systems could result in more ‘train like’ levels of service, challenging existing perceptions of bus and rail comparisons.
Connectivity to St Albans could be provided by bus or via an interchange with the Abbey Line but this will need to be assessed as part of the consideration of long term options in the Watford-St Albans corridor.
The scheme could serve, and its delivery be supported by, development and increased development density along its route, this should therefore be a consideration in further development of local land use plans.
The scheme will be developed further as part of the A414 Corridor Strategy and LTP4 Growth and Transport Plans.

106 Hertfordshire’s Local Transport Plan 2018
Hertford BypassStatus: Concept
Lead Authority/ Promoter: HCC
Highway bypass north or south of Hertford to reroute the A414 and connect with the A10 east of the town. The scheme would be delivered to utilise traffic reductions and road space no longer needed in the town to deliver significant improvements in walking, cycling and passenger transport provision. The scheme is needed because traffic levels and congestion on the A414through the town limits further growth of the town, which would otherwise result in a severe deterioration in journey times and reliability, and the further deterioration in the quality ofthe urban environment. This scheme also provides the potential for greater housing density and car free development in the town, which should also be a consideration in Local Plan development. The scheme will be investigated further as part of the A414 Corridor Strategy.
New M1 Junction 8a (additional junction)Status: Concept
Lead Authority/ Promoter: HCC
The junction improvements planned for the existing M1 Junction 8 and along the A414 to support the development planned for east Hemel Hempstead are unlikely to provide sufficient highway capacity to serve growth that could come forward beyond the current Local Plan period to 2031. The existing A414 and traffic using it through Hemel Hempstead results in severance and local environmental impacts. It also constrains the potential to improve active travel and passenger transit improvements along and around the A414 route, which other scheme concepts detailed here seek to achieve. A new junction can address these issues and provide options for long term growth of the town. The concept will be developed further as part of the LTP4 Growth and Transport Plans and in partnership with Highways England who are responsible for the motorway.
New Rail Stations to Investigate
Status: Concept
Lead Authority/ Promoter: Broxbourne Borough Council, Stevenage Borough Council and HCC
In support of Broxbourne Borough Council Local Plan development proposals, the county council is working with Broxbourne Borough Council and Network Rail to examine the feasibility of a new station at Turnford. A new station would also make rail services more accessible for local residents and Hertford Regional College. At Park Lane in Waltham Cross there is also considered potential for a new station. This would service the major employment developments planned at Park Plaza. Stevenage Borough Council is promoting a new station in south Stevenage on the Hertford Loop. The county council is supportive in principle and will work with Stevenage Borough Council and Network Rail on investigating the concept.

107Hertfordshire’s Local Transport Plan 2018
8. LTP4 Implementation, Funding & Monitoring• Transportinterventionstodeliverthe
LTPobjectivesinalignmentwiththeLTPpoliciesandcorridornarrativeswillbedevelopedfurtherbytheLTPsupportingdocuments,notablytheGrowthandTransportPlans,andfurtherstudies.InterventionswillbedetailedinanannuallyupdatedImplementationPlan.
• SuccessfulLTPdeliverywillrequirethecountycounciltomaximiseexistingandpursueadditionalfundingsourcesinfutureyears.
• Amonitoringreportwillbepublishedannuallytoupdateonprogresswithstrategydeliveryandkeyperformanceindicators.
Implementation PlanThe LTP4 Implementation Plan will outline a programme of interventions which the county council intends to deliver over the short, medium and long term (10 years +) to deliver policies and objectives outlined in this strategy. The major projects can currently be found in the LTP4 in chapter 7 and shorter term projects can be found by visiting the Highways, Roads and Pavements web page on the Hertfordshire County Council website.
Figure 8.1 displays, the majority of interventions will emerge from Growth and Transport Plans (GTPs) explained in section N. Interventions will either be devised as part of the GTPs or developed from the high level schemes and approaches outlined in this strategy. Interventions will also be identified by other LTP supporting documents (e.g. Bus Strategy, Rail Strategy, Active Travel Strategy etc.) and incorporated into the GTPs. Other sources include interventions derived as part of the work on supporting the delivery of district and borough Local Plans or from additional corridor or local studies outside of the GTP process, such as the A414 Corridor Strategy.
LTP4 Strategy
LTP4 Supporting Documents
Local Plans
Growth & Transport Plans
Corridor Local Studies
LTP4 Implementation Plan
Figure 8.1: LTP4 Implementation Plan inputs

108 Hertfordshire’s Local Transport Plan 2018
The LTP4 implementation plan will be a modified version of the current county council Highways Service online forward plan. The implementation timescales of interventions will be subject to change. This will be affected by their prioritisation, funding availability and other programmes of work including those of other agencies such as developers or Highways England for example.
Interventions within the implementation plan may be delivered solely by county council funding, or may be dependent wholly or partly on funding from other agencies such as the Local Enterprise Partnership, central government, developer funding, CIL funding distributed by the local planning authorities, other local authorities, bus and rail operators, Highways England or Network Rail.
FundingTransport interventions can be funded from various sources. Funding for transport activity can either be classed as revenue or capital funding, with government restricting what types of interventions each can be spent on. Capital is any spending to acquire or improve an asset that will have a life of many years and typically relates to spending on infrastructure. Revenue spending is spent on day-to-day items to run services (staff costs, bus subsidy
and marketing activity for example), or carry out routine maintenance.
Previous chapters have discussed the funding constraints for transport, particularly with regards to revenue funding. Many sources are also unpredictable, such as local growth funding and some government funding pots, often requiring some form of bidding exercise in competition with other locations or local priorities. Effective delivery of local transport improvements will require consideration of other funding sources, which can both increase local transport investment and provide greater certainty of delivery.
HCC will seek to obtain significant levels of external funding to deliver the objectives of this plan.
Revenue fundingThe county council’s total non-school revenue budget for 2017/18 is £817 million. Figure 8.2 shows the sources of funding for this, but also how future spending is forecast to exceed available funding. This widening gap will mean efficiencies and changes to services are required, and will mean overall that revenue funding is constrained in future years. See the county council’s Integrated Plan for more details on its budget.
1000.0
817.0 829.8857.2
815.4800.0
600.0
400.0
200.0
0.0
2017/18 2018/19 2018/19
£m
RevenueSupportGrant
BusinessRatesIncome
IncomeCouncilTax
OtherGrantIncome
NHSfunding-BetterCareFund
ExpenditureForecast
808.9
Figure 8.2: County council non-school revenue budget

109Hertfordshire’s Local Transport Plan 2018
County council revenue spending (including staff) on transport will total around £60 million in 2017/18 (including approximately. £41.9million for Highways and £17.5 million for Passenger Transport). This will include spending on structural and routine maintenance, street lighting, winter maintenance, traffic management, safety, passenger transport, sustainable transport, as well as the staffing and overheads for the service. Many of these services are front line and have a high public profile. All of these areas are critical to the delivery of the LTP4 objectives. In future years it will be important that existing sources of funding such as government grants for maintenance are maximised, efficiencies are made and the potential for new or increased funding sources are explored.
Capital fundingAn overview of the county council’s capital programme for 2018/19-21/22 is shown in figure 8.3, taken from the 2018/19 Integrated Plan. The overall programme totals £820 million, with three primary funding sources: government grants, borrowing, and
contributions from other agencies including developers.
Some £431.13 million (m) of this four year programme will be spent on transport related projects. This includes contributions to the Capital Maintenance on Carriageways (£143.7m), A120 Little Hadham Bypass (34.8m), Integrated Transport Schemes to deliver LTP objectives (£14.6m), A602 Improvements (£15.4m), Street Light LED Replacement Programme (£12.3m), Bridge and Highway Structures Maintenance (£20.7m), Highways Locality Budget for county councillor priority schemes (£24m) and the Metropolitan Line Extension (£73m) (subject to new funding models and consideration of scheme options).
As these schemes are dependent on a significant amount of county council funding, with a significant proportion of this raised from borrowing, it is important other funding sources are explored to fund future capital scheme investment. This is because servicing borrowing has implications for the revenue budget, which is already under pressure.
Financing of the Capital Programme 2018/19 to 2021/22
2018/19 £m
2019/20 £m
2020/21 £m
2021/22 £m
Total £m
Borrowing 101.466 99.276 82.811 52.009 335.562
Capital Receipts 10.000 10.000 10.000 10.000 40.000
Grant 81.649 81.040 56.502 60.595 279.786
Contributions 48.148 72.029 36.132 1.890 158.199
Reserves 2.761 2.075 1.125 0.375 6.336
Total 244.024 264.420 186.570 124.869 819.883
Figure 8.3: Capital Programme 2018/19 to 2021/22
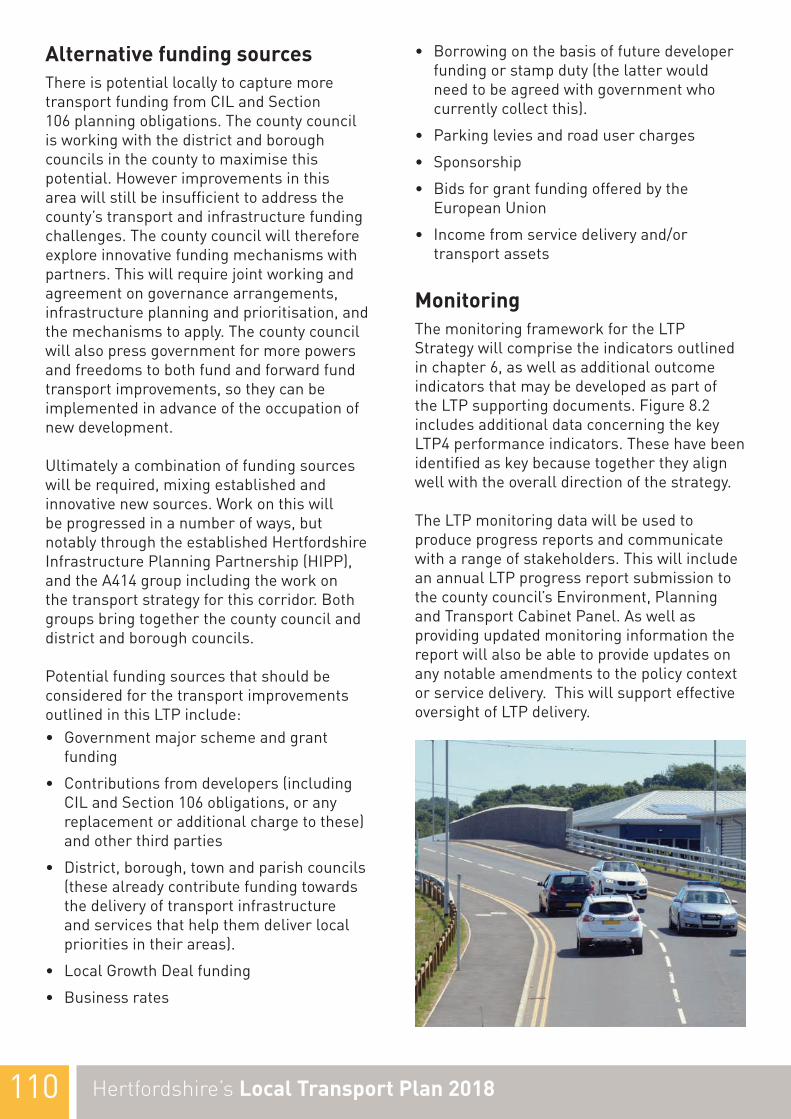
110 Hertfordshire’s Local Transport Plan 2018
Alternative funding sourcesThere is potential locally to capture more transport funding from CIL and Section 106 planning obligations. The county council is working with the district and borough councils in the county to maximise this potential. However improvements in this area will still be insufficient to address the county’s transport and infrastructure funding challenges. The county council will therefore explore innovative funding mechanisms with partners. This will require joint working and agreement on governance arrangements, infrastructure planning and prioritisation, and the mechanisms to apply. The county council will also press government for more powers and freedoms to both fund and forward fund transport improvements, so they can be implemented in advance of the occupation of new development.
Ultimately a combination of funding sources will be required, mixing established and innovative new sources. Work on this will be progressed in a number of ways, but notably through the established Hertfordshire Infrastructure Planning Partnership (HIPP), and the A414 group including the work on the transport strategy for this corridor. Both groups bring together the county council and district and borough councils.
Potential funding sources that should be considered for the transport improvements outlined in this LTP include:• Government major scheme and grant
funding
• Contributions from developers (including CIL and Section 106 obligations, or any replacement or additional charge to these) and other third parties
• District, borough, town and parish councils (these already contribute funding towards the delivery of transport infrastructure and services that help them deliver local priorities in their areas).
• Local Growth Deal funding
• Business rates
• Borrowing on the basis of future developer funding or stamp duty (the latter would need to be agreed with government who currently collect this).
• Parking levies and road user charges
• Sponsorship
• Bids for grant funding offered by the European Union
• Income from service delivery and/or transport assets
MonitoringThe monitoring framework for the LTP Strategy will comprise the indicators outlined in chapter 6, as well as additional outcome indicators that may be developed as part of the LTP supporting documents. Figure 8.2 includes additional data concerning the key LTP4 performance indicators. These have been identified as key because together they align well with the overall direction of the strategy.
The LTP monitoring data will be used to produce progress reports and communicate with a range of stakeholders. This will include an annual LTP progress report submission to the county council’s Environment, Planning and Transport Cabinet Panel. As well as providing updated monitoring information the report will also be able to provide updates on any notable amendments to the policy context or service delivery. This will support effective oversight of LTP delivery.

111Hertfordshire’s Local Transport Plan 2018
Performance Indicator 1 Policy
Percentage of sustainable mode share for Hertfordshire residents
1) Transport User Hierarchy3) Travel Plans and Behaviour Change4) Demand Management7) Active Travel Walking8) Active Travel Cycling9) Buses10) Rail
Performance Indicator 2
Accessibility of new developments -Percentage of new developments within 30 minutes by public transport of key services
2) Influencing Land Use Planning6) Accessibility
Performance Indicator 3
Percentage of passengers travelling to airports by non-car modes (Luton and Stansted)
Percentage of employees travelling to airports by non-car modes (Luton and Stansted)
11) Airports
Performance Indicator 4
Journey time reliability in Hertfordshire 12) Network Management
Performance Indicator 5
Speed limit compliance -Percentage on compliance of speed limits
15) Speed Management
Performance Indicator 6
KSIs – Total number of people killed or seriously injured on Hertfordshire’s roads
17) Road Safety
Performance Indicator 7
Number of ULEV vehicles registered in Hertfordshire
19) Emissions Reductions
Performance Indicator 8
Overall roads condition index for Hertfordshire’s roads
22) Asset management
Figure 8.4: Key Performance Indicators

Hertfordshire’s Local Transport Plan 2018112
9. References1. ONS (2016) 2014 mid-year based
projections
2. ONS (2016) 2014 mid-year based projections
3. MHCLG 2014-based household projections - Projected percentage change in number of households from 2014 to 2039
4. NOMIS Official Labour Market Statistics Apr 2016-Mar 2017
5. House of Commons Environmental Audit Committee (2010) Fifth report on Air Quality
6. DfT Reported Road Casualties 2015
7. Census 2011 Journey to Work Data
8. Census data
9. Census 2011
10. Hertfordshire County Council
11. Hertfordshire County Council COMET Traffic Model, Local Plan 2031 Do Minimum version 2 (Jan 2017)
12. Hertfordshire County Council COMET Traffic Model, Local Plan 2031 Do Minimum version 2 (Jan 2017)
13. London and South East Route Utilisation Strategy (Network Rail 2011), Anglia Route Study (Network Rail March 2016), East Midlands Route Study (Network Rail March 2016).
14. HCTS 2015
15. Journey to work data Census 2011
16. Hertfordshire LTP Future Scenarios & Strategies Report (2017), WSP & Steer Davies Gleave
17. Public Health Outcomes Framework 2015
18. Dft Reported Road Casualties 2015
19. Hertfordshire County Council, TRACC (accessibility software) output 2016
20. Finding the optimum (2014), DfT
21. Census 2011
22. Hertfordshire County Council Environment Survey 2015
23. DfT Annual Bus Statistics 2016
24. Census 2011 and Hertfordshire County Council
25. HCTS 2015
26. Census 2011
27. Census 2011
28. Hertfordshire County Council (16/17 bus punctuality statistics) and DfT 2015/16 Bus Punctuality Statistics (2016)
29. HCTS 2015
30. Hertfordshire County Council
31. Hertfordshire County Council
32. The true value of local bus services (2017), Greener Journeys
33. Civil Aviation Authority Passenger Survey Report 2015
34. DfT 2016
35. DfT Reported Road Casualty Statistics
36. DfT Reported Road Casualties 2015
37. Hertfordshire Road Casualty Facts 2015
38. DfT Reported Road Casualties Great Britain Annual Report (2015)
39. DfT Reported Road Casualties Great Britain Annual Report (2015)
40. Hertfordshire County Council
41. Hertfordshire Road Casualty Facts 2016
42. Hertfordshire County Council
43. COMEAP, 2010
44. Kings College London Environment Research Group, 2013
45. DfT 2017 table: veh0131.
46. Hertfordshire County Council
47. EU Water Framework Directive

113Hertfordshire’s Local Transport Plan 2018
10. Acronyms and Abbreviations AACI Average Condition Index
AONB Area of Outstanding Natural Beauty
AQMA Air Quality Management Area
ASB Anti-social Behaviour
BBC Borough Council
BRE Building Research Establishment
BT British Telecom
CCAZ Clean Air Zone
CC County Council
CCTV Closed-circuit Television
CIL Community Infrastructure Levy
CMS Countryside Management Services
CO2 Carbon Dioxide
COMEAP Committee on the Medical Effects of Air Pollution
COMET County Council Transport Model
CRoW Countryside and Rights of Way
CWIS Cycling and Walking Investment Strategy
DDECC Department of Energy and Climate Change
DEFRA Department for Environment, Food & Rural Affairs
DfT Department for Transport
EEWR East West Rail
EU
European Union
EV Electric Vehicle
GGTPGrowth and Transport Plan
HHBF Home Builders Federation
HCC Hertfordshire County Council
HCTS Hertfordshire County Travel Survey
HGV Heavy Goods Vehicle
HIAMP Highway Infrastructure Asset Management Plan
HIPP Hertfordshire Infrastructure Planning Partnership
HS2 High Speed Rail 2

Hertfordshire’s Local Transport Plan 2018114
IIPCC Intergovernmental Panel on Climate Change
ITS Intelligent Transport Systems
KKBA Key Biodiversity Area
KSI Killed or Seriously Injured
LLED Light-emitting Diode
LEP Local Enterprise Partnership
LGV Light Goods Vehicle
LLFA Lead Local Flood Authority
LNG Liquefied Natural Gas
LSCC London Stansted Cambridge Corridor
LSOA Lower Layer Super Output Area
LSTF Local Sustainable Transport Fund
LTP Local Transport Plan
LTP3 Local Transport Plan 3
LTP4 Local Transport Plan 4
MMAAS Mobility as a Service
MHCLG Ministry of Housing, Communities & Local Government
MPPA Million Passengers Per Annum
NNCN National Cycle Network
NHS National Health Service
NO2 Nitrogen Dioxide
NOMIS National Online Manpower Information System
NPPF National Planning Policy Framework
OONSOffice of National Statistics
PPCT Propensity to Cycle Tool
PM2.5 Particular Matter less than 2.5μm
PM10 Particular Matter less than 10μm
RRoWIPRights of Way Improvement Plan

115Hertfordshire’s Local Transport Plan 2018
SSAC Special Areas of Conservation
SEP Strategic Economic Plan
SMoTS Hertfordshire’s Sustainable Modes of Travel to School
SPA Special Protection Area
SSSI Sites of Specific Scientific Interest
STARS National Schools Awards Scheme (Mode shift STARS)
TTA Transport Assessment
TS Transport Statement
UULEV Ultra-Low Emission Vehicle
UK United Kingdom

116 Hertfordshire’s Local Transport Plan 2018
Glossary A
Accessibility Enabling people being to access key services at a reasonable cost, in reasonable time and with reasonable ease
Active Travel Journeys undertaken by physically active means such as walking or cycling
Air Pollution A substance which has harmful or poisonous effects which has been released into the air
Air Quality Management Area (AQMA) Through the Local Air Quality Management (LAQM) system, local authorities are required to assess air quality and carry out reviews. Local authorities must measure air pollution with the aim of making sure that the national air quality objectives are achieved to protect people’s health and the environment. If a local authority finds any places where the objectives are not likely to be achieved, it must declare an Air Quality Management Area
Annual Monitoring Report An annual assessment which will report on the effectiveness of the Local Transport Plan policies
Area of Outstanding Natural Beauty (AONB)An area of countryside in England, Wales or Northern Ireland which has been recognised for its national importance and is designated for conservation due to its significant landscape value
Asset Management The approach used to prioritise road maintenance work
Autonomous Vehicles A vehicle (including cars, vans, lorries or similar vehicles also known as a driverless cars, self-driving car and robotic cars) that is capable of sensing its environment and navigating without human input
B
Behaviour Change A transformation or modification of human behaviour
Big Data Large data sets that may be analysed to reveal patterns, trends, and associations, especially relating to human behaviour and interactions
Biodiversity The variety of plant and animal life in a particular habitat which is usually considered to be important and desirable
Brownfield Urban sites with the potential for development which has previously been built on or used for development
Bus Priority Various techniques and measures aimed to reduce journey times and improve the reliability of bus services including; lane segregation, traffic management, traffic signal control and bus stop improvements
Bus Rapid Transit A good quality, high capacity passenger transport system
Bus Services Act 2017 Government legislation to strengthen arrangements for partnership working in the bus sector by introducing ‘enhanced partnerships’, introduce new franchising powers with decision-making at a local level and provide for a step change in the information available to bus passengers
Bus Service Operators Grant (BSOG) A grant paid to operators of eligible local bus services and community transport organisations to help them recover some of their fuel costs
BUSnet tickets A multi-operator ticket product available for specific areas, and will be considered for other areas of the county where there is a benefit to passengers

117Hertfordshire’s Local Transport Plan 2018
Bypass A road passing round a town or its centre to provide an alternative route for through traffic
C
Carbon Emissions The release of carbon into the atmosphere which can cause damage to the environment
Clean Air Zone (CAZ) A geographic area where targeted action is undertaken to improve air quality with various actions adopted such as exploring new technologies, targeting engine idling behaviour, increasing the uptake of Ultra Low Emission Vehicles (ULEVs) and encouraging active travel
Climate Change A change in global or regional climate patterns attributed to the increased levels of greenhouse gases produced by the use of fossil fuels
Clinical Commissioning Groups (CCC) Clinically-led statutory NHS bodies responsible for the planning and commissioning of health care services for their local area
Committee on the Medical Effects of Air Pollutants (COMEAP) Provides independent advice to government departments and agencies on how air pollution impacts on health
Community Infrastructure Levy (CIL) A planning charge, introduced by the Planning Act 2008 as a tool for local authorities in England and Wales to help deliver infrastructure to support the development of their area
Community Rail Partnerships The support of railway lines and stations by local organisations comprising railway operators, local councils, and other community organisations, and rail user groups
Concessionary Fares Schemes Enables eligible people to travel on certain public transport at a reduced rate or free of charge
Congestion Road congestion occurs when an additional vehicle on the network impacts on the journey time of all other vehicles using the network at that time
Connected Autonomous Vehicles Autonomous or driverless vehicles are connected through mobile data networks and other dedicated communications protocols that facilitate interactions with other vehicles, other devices or machines or with infrastructure
Crossrail 2 A newly proposed railway linking the national rail networks in Surrey and Hertfordshire via an underground tunnel through London
Cycling and Walking Investment Strategy A strategy which sets out the Government’s ambition for cycling and walking
Cycle Infrastructure Improvement Towns Towns where the Propensity to Cycle Tool has identified the most heavily used cycle routes in the future
D
Demand Management The application of strategies, interventions and policies aimed to reduce travel demand or to redistribute this demand
Demand Responsive Transport An advanced form of shared passenger transport which has flexible routing and scheduling of small to medium sized vehicles operating in according to passengers’ needs and demand

118 Hertfordshire’s Local Transport Plan 2018
Department for Transport The government department works with agencies and partners to support the transport network that helps UK businesses and gets people and goods travelling around the country. The department plans and invest in transport infrastructure to keep the UK on the move
Deprivation The damaging lack of material benefits considered to be basic necessities in a society
Devolution The transfer or delegation of power to a lower level, especially by central government to local or regional administration
Distributed Growth The spatial spreading of growth, population, developments, resources and settlements
E
Economic Growth The increase in the amount of goods and services produced per head of the population
Electronic Ink Timetables The replacement of traditional paper signage at bus stops with solar powered real-time passenger information on electronic displays which can be updated remotely and which also allows instant display of important passenger information
Enterprise Zone Enterprise Zones are part of the Government’s wider Industrial Strategy to support businesses and enable local economic growth by offering businesses incentives such as tax incentives to encourage investment and growth
EU Water Framework Directive An EU Directive which commits European Union member states to achieve good qualitative and quantitative status of all water bodies
Euro 6 Standard The European Union directive to reduce harmful pollutants from vehicle exhausts with the aim of reducing levels of harmful car and van exhaust emissions both in petrol and diesel cars
F
Flora and Fauna A group of indigenous plants in an ecosystem of a geographical region and a group of indigenous animals of any geographical region
Four Tracking The process of expanding a two track railway into a quadruple-track railway consisting of four parallel tracks, with two tracks used in each direction
G
Gig Economy An economy where temporary and flexible jobs are commonplace and companies tend to hire independent contractors and freelancers instead of full-time employees
Greenbelt Green Belts were made possible by the Town and Country Planning Act 1947 referring to an area that is kept in reserve for an open space, most often around larger cities to prevent the urban sprawl and help protect agricultural activities and the unique character of rural communities. The Metropolitan Greenbelt refers to the statutory greenbelt around London which compromises parts of greater London and six surrounding counties including Hertfordshire
Greenfield Greenfield land is undeveloped land in a city or rural area either used for agriculture or landscape design, or left to evolve naturally. These areas of land are usually agricultural or amenity properties being considered for urban development.

119Hertfordshire’s Local Transport Plan 2018
Gross Domestic Product The total value of goods produced and services provided in a country during one year
Growth and Transport Plans Growth and Transport Plans (GTPs) cover different sub areas of Hertfordshire and consider current and future challenges and identify interventions aligned to LTP objectives
H
Habitats Regulation Assessment The Planning Act 2008 local authorities have a legal obligation to consider impacts which might have an adverse effect to protected habitats. The assessment identifies any aspects of the Local Transport Plan that would have the potential to cause a likely significant effect on Natura 2000, European sites (Special Areas of Conservation (SACs), Special Protection Areas (SPAs) and Ramsar sites)
Hertfordshire SaverCard A 50% discount card available for children 11-18 years old who travel on Hertfordshire bus services
Heavy Goods Vehicles (HGVs) A commercial vehicle also known as large goods vehicle (LGV) with a gross vehicle weight of over 3.5 tonnes
High Speed 2 (HS2) A planned high-speed railway in the United Kingdom, directly linking London, Birmingham, the East Midlands, Leeds and Manchester
Highway Under the Highways Act 1980, a local highways authority has a duty of care to maintain the safety and usability of public roads. A highway is a way over which all members of the public have the right to pass and repass. Their use of the way must be as of right, not on sufferance or by licence. Hertfordshire County Council is the Highway Authority for all highways within the County other than trunk roads and motorways, which are the responsibility of the Department for Transport and Highways England.
Highways England Highways England operates, maintains and improves England’s motorways and major A roads
Home Builders Federation (HBF) The representative body of the home building industry in England and Wales
I
Implementation Plan A plan which describes how the strategy and policies will be delivered
Infrastructure Planning Partnership (HIPP) A forum to discuss and, where appropriate, develop a shared view and agree joint work programmes on infrastructure and planning issues of common concern
Intalink Explorer Ticket A bus ticket which allows individuals or groups travel across the whole county and on many cross-border services into neighbouring counties
Intalink Quality Partnership The purpose of the Intalink Quality Partnership is to promote the passenger transport network in Hertfordshire through improved information, publicity, marketing and the creation and promotion of integrated ticketing schemes
Intelligent Transport Systems The use of technology to improve safety, efficiency, environmental performance and the journey experience for transport users
Inter-urban Connecting cities or towns
Intra-urban Within an urban area
K
Key Biodiversity Areas (KBA) Sites contributing significantly to the global persistence of biodiversity, in terrestrial, freshwater and marine ecosystems
120 Hertfordshire’s Local Transport Plan 2018
L
Land Use Planning The future planning of housing and development of land
Lift Share Enables organised car sharing by connecting people travelling in the same direction so they can arrange to travel together and share the costs, whilst reducing congestion and pollution at the same time
Light Goods Vehicles (LGVs) A commercial carrier vehicle with a gross vehicle weight of not more than 3.5 tonnes i.e. commercial van
Light Pollution Brightening of the night sky caused by street lights and other man-made sources, which has a disruptive effect on natural cycles and inhibits the observation of stars and planets
Local Enterprise Partnership (LEP)A voluntary partnership between local authorities and businesses which help determine local economic priorities and lead economic growth and job creation. The Hertfordshire LEP maintains a pipeline of projects which support the delivery of their Strategic Economic Plan (SEP) https://www.hertfordshirelep.com/
Local Governance The system of Local Authorities electing representatives to be responsible for a range of vital public services for people and businesses in defined areas
Local Sustainable Transport Fund Funding made available through the Department of Transport which helped local authorities to deliver sustainable transport projects that support economic growth
Local Transport Plan The Transport Act 2000 introduced a statutory requirement for local transport authorities to produce a Local Transport Plan (LTP) every five years and to keep it under review. The plan sets out the statutory framework and policies on how transport can help deliver a positive future vision by considering safe and efficient
travel while supporting economic growth, meeting housing needs, improving public health and reducing environmental damage. The plan also considers how future planning decisions and emerging technology might affect the way transport needs to be provided in the longer term
M
M-ticketing Tickets which enables passengers on some services to purchase bus tickets in advance of travel through the Intalink mobile app
Manual for Streets The Government design guide for residential streets. Design guidance document can be found by visiting https://www.gov.uk/government/publications/manual-for-streets-2
Modal Shift Replacing a saturated means of transport with another to make the first less congested
Modeshift STARS An award scheme established to recognise schools that have demonstrated excellence in supporting active and sustainable travel
Multi Modal Interchanges Interchange between one mode of any type of transport and another for example between bus and train. It also considers interchange between public transport and the feeder modes used to get to and from the interchange for example walk, cycle or motor vehicle
N
National Planning Policy Framework The National Planning Policy Framework sets out government’s planning policies for England and how these are expected to be applied. The NPPF draft policy paper can be found by visiting https://www.gov.uk/government/publications/national-planning-policy-framework--2
Network Management Enabling the highway to perform its primary function of moving people and goods

121Hertfordshire’s Local Transport Plan 2018
Network Rail Owns and operates the railway infrastructure in England, Wales and Scotland on behalf of the nation
O
OneTRANSPORT Project which aims to integrate transport information across a series of networks to help lead the way in which we receive and use travel information. The project aims to enable multimodal transport information, such as live information about rail delays, traffic jams, or disruption to be easily published by data owners
Open Data The sharing of data by making data freely available, easy to access and, be re-used, built on and redistributed by anyone
Oxford-Cambridge Expressway A proposed grade-separated dual carriageway between the A34 near Oxford and the A14 near Cambridge, via (or near) Milton Keynes
P
Passenger Transport Passenger transport refers to transport available for use by the general public including bus, coach, rail and taxi
Particulate Air Pollution Extremely small particles and liquid droplets that get into the air and once inhaled can affect the heart and lungs and cause serious health effects. These include nitrogen dioxide (NO2) and particulate matter PM10 and PM2.5 which are emitted from vehicle tailpipes
Performance Indicator A type of performance measurement which will be used to monitor the progress and effectiveness of the Local Transport Plan
Plusbus A combined rail and bus ticketing schemes with the facility available from most railway stations in Hertfordshire
Primary Route Network (PRN) The primary route network designates roads between places of traffic importance across the UK, with the aim of providing easily identifiable routes to access the whole of the country
Propensity to Cycle Tool (PCT) A tool designed to provide an evidence base which assists transport planners and policy makers of where to prioritise investment and interventions to promote cycling
Public Realm Space around, between and within buildings that are publicly accessible, including streets, squares, parks and open spaces
Public Rights of Way Public Rights of Way are all minor highways and give people the legal right to pass and re-pass along a specific route through grounds or property (often belonging to another), including;
• Footpaths – a right to pass on foot only, usually encompassing wheelchair users, mobility buggies, and with dogs, pushchairs, etc.;
• Bridleways – a right to pass on foot, horseback or leading a horse and, since 1968, a right for bicycles provided they give way to other users;
• Restricted Byways – a public right of way on foot, on horseback or leading a horse, and for vehicles other than mechanically propelled vehicles (such as horse-drawn carriages and pedal cycles);
• Byways Open to All Traffic – a highway over which the public have a right of way for vehicular and all other kinds of traffic, but which is used by the public mainly for the purpose for which footpaths and bridleways are so used.

122 Hertfordshire’s Local Transport Plan 2018
R
Real Time Information An information system which tracks buses and trains to provide live arrival and departures times and display these on digital information boards or smart devices
S
Safe Systems An approach that seeks to co-ordinate a mix of safer roads, safer speeds, safer vehicles, safer road users and post-collision response with a focus on casualty reduction
Section 106 A legal agreement between an applicant seeking planning permission and the local planning authority used to mitigate the impact of new developments on the local community and infrastructure
Shared Mobility A transport strategy which encourages the shared used of a vehicle, bicycle, or other transportation mode
Sharing Economy A trend which is shifting the conventional ownership model of purchasing vehicles and private transport to sharing transport services for example car clubs, bike sharing, lift sharing and on demand transport
Sites of Special Scientific Interest (SSSI’s)Sites protected by law to conserve their wildlife or geology
Smarter Choices A collective title for a range of measures that can encourage reduced car use which can include all forms of travel planning, information provision, marketing, car sharing, tele conferencing and home working
Socio-economic The interaction of social and economic factors
Social Exclusion Social exclusion is a complex and multi-dimensional process. It involves the lack or denial of resources, rights, goods and services, and the inability to participate in the normal relationships and activities, available to the majority of people in a society, whether in economic, social, cultural or political arenas. It affects both the quality of life of individuals and the equity and cohesion of society as a whole
Strategic Environmental Assessment A report required by the European Union and implemented through the Environmental Assessment of Plans and Programmes Regulations 2004 which explaining the possible environmental impacts of the Local Transport Plan
Supporting Documents Documents covering a particular topic area and supports the Local Transport Plan’s policies and objectives and include packages of smaller schemes and activities. This includes Growth and Transport Plans
Surface Access Strategy Strategies which sets out the context for surface access at airports and determines the impact on the surrounding road network
Sustainable Housing Development Homes designed to reduce the overall environmental impact during and after construction
Sustainable Transport Sustainable transport refers to transport that is socially, environmentally and economically sustainable and supports the source of an indefinite supply of energy (e.g. walking and cycling)
Sustainable Travel Town Sustainable Travel Towns are about making a significant change to travel within an urban area, encouraging intra-urban journeys over inter-urban ones, and increasing the levels of walking and cycling

123Hertfordshire’s Local Transport Plan 2018
T
Thameslink Programme A 10 year programme of extensive infrastructure improvements and delivery of 115 new trains travelling north-south through London.
Total Transport The integration of publicly supported transport services allowing existing resources to be allocated and coordinated more efficiently
Traffic Management Act (2004) Government legislation which gives powers to reduce traffic congestion in towns and cities
Transport User Hierarchy Policy which presents a shift in emphasis to increase rates of travel by more sustainable modes by increasing the attractiveness of alternative forms of travel so that those trips that can only feasibly be made by the car can be undertaken without suffering the effects of a significant worsening of congestion
Travel Plans Travel Plans are a way of assessing and mitigating the negative transport impacts of development in order to promote sustainable development
U
Ultra-Low Emission Vehicles (ULEVs) Vehicle that use low carbon technologies, emits less than 75g of CO2/km from the tailpipe and/or is capable of operating in zero tailpipe emission mode for a range of at least ten miles
W
Workplace Parking Levy (WPL) A type of charging scheme on employers, who provide workplace parking
3D Printing The action or process of making a physical object from a three-dimensional digital model, typically by laying down many thin layers of a material in succession
