heme drives hemolysis-induced susceptibility to...
TRANSCRIPT
nature immunology VOLUME 17 NUMBER 12 DECEMBER 2016 1361
Intravascular hemolysis is a serious complication that accompanies severe inflammatory conditions such as sepsis, is an established com-plication of hemolytic disorders such as sickle cell disease (SCD), malaria infection or beta-thalassemia, and affects millions of peo-ple worldwide1–5. In these disorders, extensive hemolysis leads to the release of the heme moiety from hemoglobin, which can rapidly exhaust the body’s heme-scavenging capacity and results in high amounts of circulating heme5–8. Excess heme is important for driving disease pathology, primarily as a result of its pro-oxidant proper-ties, which sensitize cells to the cytopathic effects of inflammatory mediators such as tumor necrosis factor (TNF)9–11. These effects have been demonstrated in models of polymicrobial sepsis and noncerebral malaria, in which mice lacking the heme-degrading enzyme HO-1 (heme oxygenase-1) have increased disease severity and succumb to organ failure4,12.
However, reduced disease tolerance cannot explain the substantially increased susceptibility to bacterial infections in people with hemo-lytic disorders such as SCD13, beta-thalassemia14 and malaria15,16. Mortality rates of 40% in children with SCD1 reflect the tremendous threat of bacterial infections in these patients and justify the current recommendation of prophylactic antibiotics until individuals reach
adolescence17,18. In spite of the medical importance and apparent link between hemolysis and infection, most studies on heme have either employed sterile stimuli19 or were performed in the presence of bactericidal antibiotics4, effectively precluding the examination of heme effects on antibacterial effector mechanisms. Hemolysis is often considered to be a logical explanation for the increased rate of bacterial infections, as most pathogens depend on environmen-tal iron sources and heme is an iron-containing protoporphyrin20. Recently, impaired neutrophil effector functions following hemolysis were observed in humans with malaria21 or beta-thalassemia14, and in mouse models of malaria22. These studies have suggested that heme has a role in modulating host resistance mechanisms. However, the mechanism of how excess heme precisely affects host immunity to bacteria remains elusive. We found that, contrary to previous inter-pretations, heme did not affect bacterial growth through nutrient availability. Instead, heme strongly suppressed phagocyte functions by inducing extensive actin cytoskeleton changes by interfering with DOCK8-mediated Cdc42 activation, ultimately predisposing mice to bacterial dissemination and sepsis. Notably, using a chemical screen-ing approach, we developed a therapeutic proof-of-concept strategy aimed at restoring endogenous host resistance mechanisms.
1CeMM Research Center for Molecular Medicine of the Austrian Academy of Sciences, Vienna, Austria. 2Department of Medicine I, Laboratory of Infection Biology, Medical University of Vienna, Vienna, Austria. 3Max F. Perutz Laboratories, University of Vienna, Vienna, Austria. 4Department of Pathology, Medical University of Vienna, Vienna, Austria. 5IST Austria (Institute of Science and Technology Austria), Klosterneuburg, Austria. 6Clinical Department of Medical and Chemical Laboratory Diagnostics, Medical University of Vienna, Vienna, Austria. 7Department of Laboratory Medicine and Department of Immunobiology, Yale University School of Medicine, New Haven, Connecticut, USA. 8Center for Physiology and Pharmacology, Medical University of Vienna, Vienna, Austria. 9Present address: Institute of Animal Breeding and Genetics, University of Veterinary Medicine, Vienna, Austria. Correspondence should be addressed to S. Knapp ([email protected]).
Received 11 July; accepted 28 September; published online 31 October 2016; doi:10.1038/ni.3590
Heme drives hemolysis-induced susceptibility to infection via disruption of phagocyte functions Rui Martins1,2, Julia Maier1,2, Anna-Dorothea Gorki1,2, Kilian V M Huber1, Omar Sharif1,2, Philipp Starkl1,2, Simona Saluzzo1,2, Federica Quattrone1,2, Riem Gawish1,2,9, Karin Lakovits2, Michael C Aichinger3, Branka Radic-Sarikas1, Charles-Hugues Lardeau1, Anastasiya Hladik1,2, Ana Korosec1,2, Markus Brown4, Kari Vaahtomeri5, Michelle Duggan5, Dontscho Kerjaschki4, Harald Esterbauer6, Jacques Colinge1, Stephanie C Eisenbarth7, Thomas Decker3, Keiryn L Bennett1, Stefan Kubicek1, Michael Sixt5, Giulio Superti-Furga1,8 & Sylvia Knapp1,2
Hemolysis drives susceptibility to bacterial infections and predicts poor outcome from sepsis. These detrimental effects are commonly considered to be a consequence of heme-iron serving as a nutrient for bacteria. We employed a Gram-negative sepsis model and found that elevated heme levels impaired the control of bacterial proliferation independently of heme-iron acquisition by pathogens. Heme strongly inhibited phagocytosis and the migration of human and mouse phagocytes by disrupting actin cytoskeletal dynamics via activation of the GTP-binding Rho family protein Cdc42 by the guanine nucleotide exchange factor DOCK8. A chemical screening approach revealed that quinine effectively prevented heme effects on the cytoskeleton, restored phagocytosis and improved survival in sepsis. These mechanistic insights provide potential therapeutic targets for patients with sepsis or hemolytic disorders.
A rt i c l e s
© 2016 Macmillan Publishers Limited. All rights reserved.

1362 VOLUME 17 NUMBER 12 DECEMBER 2016 nature immunology
A rt i c l e s
RESULTSHeme impairs bacterial clearance in vivoWe sought to determine whether the extent of hemolysis would affect host resistance mechanisms and, consequently, bacterial burden dur-ing Gram-negative bacteria-induced sepsis. The number of bacte-ria present in the blood of septic mice infected with a pathogenic Escherichia coli strain (E. coli, strain PMV-1 was used throughout this study) directly correlated with heme abundance in the plasma (Fig. 1a). To better understand the link between heme abundance and bacteremia severity, we pretreated mice with heme (25 µmol/kg intraperitoneally (i.p.) for all heme treatments in vivo) to exogenously increase heme in the plasma before infection with E. coli (104 colony-forming units i.p.). E. coli sepsis itself was accompanied by modest hemolysis, whereas exogenous heme administration led to signifi-cantly increased plasma heme levels compared with phosphate-buff-ered saline (PBS)-treated mice, both 6 and 16 h post-infection (Fig. 1b and Supplementary Fig. 1a). This was paralleled by a substan-tial increase in the bacterial burden in heme-treated mice (Fig. 1c and Supplementary Fig. 1b), and translated into strongly impaired survival compared with PBS-treated mice (Fig. 1d).
Macrophages are crucial for the removal of excess heme result-ing from hemolysis via the uptake and degradation of heme by HO-1 (ref. 23), encoded by Hmox1. To address whether an increase in endogenous heme resulting from defective heme degradation in macrophages would negatively affect bacterial clearance dur-ing sepsis in vivo, we examined LysM-Cre+/−Hmox1fl/fl mice, which lack expression of Hmox1 in macrophages and neutrophils24, and LysM-Cre−/−Hmox1fl/fl control littermates. Following i.p. E. coli infection, we observed a significant increase in plasma heme levels in LysM-Cre+/−Hmox1fl/fl mice (Fig. 1e and Supplementary Fig. 1c), which was accompanied by increased bacterial numbers in blood and liver (Fig. 1f and Supplementary Fig. 1d) and impaired sur-vival (Fig. 1g) when compared with LysM-Cre−/−Hmox1fl/fl controls. Similar results were obtained in a separate model of infection with the unrelated Gram-positive pathogen Listeria monocytogenes (L. mono-cytogenes) (Supplementary Fig. 1e,f). To determine the potential pro-inflammatory effects of heme and to control for increased bac-terial numbers in mice with high plasma heme during E. coli-induced sepsis, we challenged mice with lipopolysaccharide (40 mg/kg i.p., 16 h). Mice pretreated with heme had similar amounts of plasma interleukin-6 and TNF and similar amounts of the peritoneal chem-okines KC and MCP-1, as well as similar cell recruitment as mice pretreated with PBS (Supplementary Fig. 1g–i), indicating that high plasma heme did not affect the inflammatory response. Thus, enhanced levels of plasma heme, induced by either exogenous heme administration or a lack of HO-1 expression in macrophages, resulted in an increased susceptibility to E. coli sepsis.
Independence of heme-iron acquisitionFollowing infection, hosts reduce the bioavailability of iron through iron withdrawal, which has led pathogenic bacteria to develop com-pensatory iron acquisition mechanisms25. We tested the importance of heme as an iron source for E. coli under limited iron availabil-ity in vitro. Chelation of growth-medium iron with deferoxamine (DFO, 10 µM) led to a reduction in bacterial growth, as compared with non-chelated controls (Fig. 2a). This defect was not rescued by heme supplementation (Fig. 2a), suggesting that heme could not fully compensate for limited iron availability. Pathogenic E. coli use several outer membrane heme transporters and periplasmic heme-binding proteins to gather heme26. However, E. coli uses a single inner membrane ABC transporter, the dipeptide permease (DppBCDF), to
import heme into the cytoplasm, and deletion of any of its components renders E. coli unable to grow if heme is the only iron source27. To test whether heme-iron provides a growth advantage to bacteria in vivo, we generated an isogenic mutant E. coli lacking the DppBCDF-subunit DppC (∆dppC::KanR) that cannot utilize heme-iron (Supplementary Fig. 1j). We observed a substantial increase in bacterial load in the blood and livers of heme-treated wild-type mice 16 h post-infection with ∆dppC::KanR E. coli compared with PBS-treated mice (Fig. 2b,c), suggesting that heme-iron acquisition does not explain enhanced bac-terial growth following elevations in heme concentrations. Next, we infected wild-type mice that were pretreated with PBS, heme or an equimolar amount of free iron (ferric ammonium citrate, Fe3+) with wild-type E. coli. Plasma heme amounts were comparable in mice pre-treated with Fe3+ or PBS (Fig. 2d), and despite the similarly increased availability of iron in both heme- and Fe3+-treated mice (Fig. 2e), only heme-treated mice presented a significantly higher bacterial
0
10
20
30
40
Pla
sma
hem
e [µ
M]
E. coli
******* LysM-Cre–/–Hmox1fl/fl
WT naive
LysM-Cre+/–Hmox1fl/fl
01234567
LysM-Cre–/–Hmox1fl/fl
LysM-Cre+/–Hmox1fl/fl
Blood Liver
CF
Us
(log 10
)
*** ***
e
f g
Time post-infection (h)0 12 24 36 48 60
0
25
50
75
100
Per
cent
sur
viva
l
**
LysM-Cre–/–Hmox1fl/fl
LysM-Cre+/–Hmox1fl/fl
0
10
20
30
Pla
sma
hem
e [µ
M]
Naive
E. coli
PBSHem
e
*********
3456
789
10
PBSHeme
Blood Liver
CF
Us
(log 10
)
*** ***
a b c
d
0 1 2 3 4 5 60
10
20
30
40
Pla
sma
hem
e [µ
M]
CFU (log10)
Pearson r = 0.5572P = 0.0013
Time post-infection (h)0 12 24 36
0
25
50
75
100
PBSHeme
Sur
viva
l (%
)
****
Figure 1 Heme impairs bacterial clearance in vivo. (a) Pearson’s correlation between heme levels and bacterial burden in wild-type (WT) mice 16 h post-infection with E. coli (n = 30 mice). (b,c) Naive WT mice (n = 8) or WT mice pretreated with PBS (n = 8) or heme (n = 8). Shown are respective heme plasma amounts (b) and bacterial counts (c) 16 h post-infection with E. coli. (d) Survival of WT mice pretreated with PBS (n = 12) or heme (n = 12) and infected with E. coli. (e,f) Plasma heme levels (e) of naive WT (n = 8) or infected LysM-Cre−/−Hmox1fl/fl (n = 7) and LysM-Cre+/−Hmox1fl/fl (n = 8) mice and respective bacterial counts (f) 16 h post-infection with E. coli. (g) Survival of LysM-Cre−/− Hmox1fl/fl (n = 15) and LysM-Cre+/−Hmox1fl/fl (n = 11) mice infected with E. coli. Data in a are pooled from three independent experiments. Data in b–f are representative of two independent experiments. Data in b, c, e and f are presented as mean, and dots represent individual animals. One-way ANOVA with Tukey’s multiple comparison test (b,e), Mann-Whitney test (c,f), Mantel-Cox test (d,g); *P ≤ 0.05, **P ≤ 0.01, ***P ≤ 0.001, ****P ≤ 0.0001.
© 2016 Macmillan Publishers Limited. All rights reserved.

nature immunology VOLUME 17 NUMBER 12 DECEMBER 2016 1363
A rt i c l e s
burden in the blood and liver compared with PBS- or Fe3+-treated mice (Fig. 2f). Similar results were obtained in mice infected with L. monocytogenes (Supplementary Fig. 1k). These results indicate that increased heme concentrations directly lead to increased bacte-rial counts during sepsis and that bacterial iron requirements are met via heme-independent mechanisms.
The secretion of hemolytic toxins by pathogenic bacteria is an important virulence factor, and is currently considered to be a means of enhancing the availability of iron for bacteria25. To understand the contribution of bacterial hemolysins to hemolysis and bacterial infec-tion, and because the E. coli strain (PMV-1) that we used does not secrete hemolysins, we used the mini-Tn7 bacterial transposon system to introduce a single copy of the E. coli alpha-hemolysin operon from strain CFT073 into the genome of PMV-1 E. coli to generate hemolytic E. colihlyABCD::attTn7 (Supplementary Fig. 1l). Infection of wild-type mice with E. colihlyABCD::attTn7 further increased heme plasma con-centrations (Fig. 2g), and resulted in elevated bacterial counts com-pared with infection with wild-type E. coli (Fig. 2h), indicating that pathogen-induced hemolysis is an important virulence mechanism for evading host resistance. Together, these data show that bacteria exploit the inflammation- and/or hemolysin-triggered release of heme independently of iron acquisition.
Heme potently inhibits phagocytosisNext, we investigated how heme influences the host resistance mecha-nisms that are responsible for restricting bacterial growth. We focused on macrophage effector functions and found that heme pretreat-ment (15 min, 3–30 µM unless otherwise indicated) led to a strong, dose-dependent reduction of phagocytosis of E. coli by RAW264.7 macrophages compared with DMSO-treated controls (Fig. 3a,b and Supplementary Fig. 2a). Bacterial phagocytosis by RAW264.7 macrophages was not suppressed by hemoglobin, free iron, or the heme analogs tin-protoporphyrin IX and protoporphyrin IX at heme-equivalent concentrations (Supplementary Fig. 2b–e). Notably, heme did not alter bacterial binding or bacterial killing by macrophages (Supplementary Fig. 3f,g). Incubation of murine primary peritoneal macrophages, bone-marrow-derived macrophages (BMDMs) and neu-trophils with heme led to a similar reduction of phagocytosis of E. coli, Pseudomonas aeruginosa, Streptococcus pneumoniae and L. monocy-togenes (Fig. 3c,d and Supplementary Fig. 2h–k), and heme strongly suppressed bacterial phagocytosis by human monocyte-derived macro-phages (Fig. 3e and Supplementary Fig. 2l) and neutrophils (Fig. 3f), as compared with DMSO controls. In addition, we observed that heme treatment of RAW264.7 macrophages led to a dose-dependent inhibition of apoptotic cell uptake (Supplementary Fig. 2m).
To assess the physiological effect of heme-induced inhibition of phagocytosis in the tissue most relevant for hemolysis, we measured bacterial phagocytosis in human whole blood. Induction of hemo-lysis with phenylhydrazine or addition of heme to whole blood at concentrations mimicking the physiological range of plasma heme in hemolytic patients (5–50 µM)6 led to a dose-dependent impairment of E. coli phagocytosis by neutrophils and monocytes, as compared with DMSO controls (Fig. 3g and Supplementary Fig. 2n,o), indi-cating that our mouse model was reflective of human hemolytic con-ditions. To determine whether heme-related cytotoxicity11 causes the inhibition of phagocytosis, we pre-incubated RAW264.7 macro-phages with heme (15 min) and washed the cells before addition of bacteria. Removal of heme by washing induced a complete recovery of the phagocytic capacity of macrophages compared with those in which heme was not removed (Fig. 3h), indicating that cell viabil-ity was not compromised. In addition, heme only mildly induced
d
fe
2
3
4
5
6
7
8
9
Blood Liver
CF
Us
(log 10
)
**** **** ****n.s. n.s.
PBS
Fe3+Heme
0
20
40
60
80****
n.s.
****
*
Pla
sma
hem
e [µ
M]
NaiveE. coli
PBSHem
eFe
3+
0
50
100
150
200
250
Tot
al li
ver
iron
(µg/
g tis
sue)
***n.s. PBS
Fe3+Heme
g h
0
15
30
45
60
********
Pla
sma
hem
e [µ
M]
E. coliE. colihlyABCD::attTn7
Naive
0
1
2
3
4
5
6
7 **
Blood Liver
E. coliE. colihlyABCD::attTn7
CF
Us
(log 10
)
**
a b
c
0
10
20
30
Pla
sma
hem
e [µ
M]
*****
Naive ∆dppC::kanRE. coli
0123456789 ***
Blood Liver
CF
Us
(log 10
)
***
–1.5
–1.0
–0.5
0.0
0.5
1.0
1.5
Heme (µM) 3 10 30 3 3010
CF
U fo
ld d
iffer
ence
(lo
g 10)
********
********
H2O DFO 10 µM
PBSHem
e
PBSHem
ePBS
Heme
– –
Figure 2 Increased bacterial burden triggered by heme is independent of heme-iron acquisition. (a) Mid-log phase difference in the growth of E. coli in LB medium or in iron-chelated LB medium (deferoxamine, +DFO), supplemented with DMSO (control) or heme (3, 10 and 30 µM). Data are presented as the log10 difference (normalized to control) in viable colony forming units (CFU) 4.5 h (mid-log phase) post-inoculation of media (n = 3 technical replicates per condition). (b,c) Plasma heme levels (b) of naive WT mice (n = 8) or WT mice pretreated with PBS (n = 8) or heme (n = 6) and respective bacterial counts (c) 16 h after infection with ∆dppC::kanRE. coli. (d–f) Plasma heme levels (d) of naive WT mice (n = 8) or WT mice pretreated with PBS (n = 8), heme (n = 7) or an equimolar amount of free ferric iron (n = 8; ferric ammonium citrate), and respective total liver iron levels (e), and bacterial counts (f) 16 h post-infection with E. coli. (g,h) Plasma heme levels (g) of naive WT mice (n = 8) or WT mice infected with isogenic non-hemolytic (n = 8; E. coli) and hemolytic (n = 8; E. colihlyABCD::attTn7) E. coli strains and respective bacterial counts (h) 16 h post-infection. Floating bars in a are presented as the mean ± minimum and maximum values. Data in b–h are presented as mean, and dots represent individual animals. One-way ANOVA with Tukey’s multiple comparison test (a,b,d–g), Mann-Whitney test (c,h); n.s. = not significant, *P ≤ 0.05, **P ≤ 0.01, ***P ≤ 0.001, ****P ≤ 0.0001.
© 2016 Macmillan Publishers Limited. All rights reserved.

1364 VOLUME 17 NUMBER 12 DECEMBER 2016 nature immunology
A rt i c l e s
Time (min)
0 60 120 180
0
20,000
40,000
60,000
80,000 DMSO
Heme 3 µM
Heme 3 µM (washed)
Pha
gocy
tosi
s in
dex
****
*
**
****
Heme (µM) – 3 10 30
********
****
0
2,000
4,000
6,000P
hago
cyto
sis
inde
x
ba dc
ih
FIT
C+ ce
lls (
% o
f tot
al)
0
20
40
60
80
100 PBSHeme
Mac B cells
*** kj
FITC-labeled E. coli
PBS250K
200K
150K
100K
50K
0FS
C-A
103 104 1050
93.6% 9.52%
Heme PBS Heme
DMSO
0
2,000
4,000
6,000
8,000
****
Pha
gocy
tosi
s in
dex
Heme
3 µM
0
5,000
10,000
15,000
Heme (µM) – 3 10 30
Pha
gocy
tosi
s in
dex
***
DMSO
Phalloidin(AF647)
FITCE. coli
Heme 3 µM 4 °CHeme 10 µM
Merge
DAPIPhalloidin FITC-E. coli
0 1 2 3 4
0
25
50
75
100
125
Time (h)
0 1 2 3 4
Time (h)
0
25
50
75
100 DMSO3 µM10 µM Heme30 µM
Cel
l dea
th (
% o
f max
.)
Cel
l via
bilit
y (%
of s
tand
ard)
****
**** **** ****
0
5,000
10,000
15,000
Pha
gocy
tosi
s in
dex
Heme (µM) – 3 10 30
********
****e f g
0
1,000
2,000
3,000
4,000
Heme (µM) – 3 10 30
Pha
gocy
tosi
s in
dex
******
0
5,000
10,000
15,000
20,000
25,000
Pha
gocy
tosi
s in
dex
Heme (µM) – 5 25 50 – 5 25 50
NeutrophilsMonocytes
*****
****
***
Figure 3 Heme potently inhibits phagocytosis of bacteria. (a) Phagocytosis of FITC-E. coli by RAW264.7 macrophages treated with control (DMSO) or heme (n = 4 per condition) and assessed by flow cytometry. (b) Confocal microscopy images of RAW264.7 macrophages treated with control (DMSO) or heme and incubated with FITC-E. coli. (automatic quantification in Supplementary Fig. 2a). Scale bars represent 20 µm. (c–f) Phagocytosis of FITC-E. coli by primary mouse peritoneal macrophages (c), mouse neutrophils (d), human monocyte-derived macrophages (e) and human neutrophils (f), treated with control (DMSO) or heme (n = 4 technical replicates per condition) and quantified by flow cytometry. (g) Phagocytosis of bacteria by human blood neutrophils (CD11b+, SSChigh) and monocytes (CD11b+, SSClow) from control and heme-treated whole blood (n = 4 per condition), as quantified by flow cytometry. (h) Time course of phagocytosis of FITC-E. coli by RAW264.7 macrophages treated with control (DMSO), heme, or heme treatment and subsequent washing to remove heme before incubation with bacteria (n = 4 technical replicates per condition and time point; flow cytometry analysis). (i) Percentage of cell death (measured by lactate dehydrogenase (LDH) release; left) and cell viability (measured by neutral red assay; right) of RAW264.7 macrophages following incubation with control (DMSO) or heme (n = 4 technical replicates per condition and time point). Staurosporine treatment (10 µM) was used as a positive control to determine the maximum cell death and loss of viability for LDH release assays and neutral red assays, respectively. (j) In vivo phagocytosis of FITC-E. coli by peritoneal macrophages (percentage FITC+F4/80+CD11b+Ly6G−) from PBS- or heme-treated mice (n = 5 mice per condition), shown and quantified by flow cytometry. Percentage of FITC+ B cells (CD11b−CD3−B220+Ly6G−F4/80−) shown as control for unspecific binding of bacteria to cells. (k) Giemsa stain of cells from peritoneal exudates of mice treated with PBS or heme 16 h post-infection with E. coli as in Figure 1b,c. Bacteria are stained blue and scale bars represent 5 µm. Data in a are representative of four independent experiments. Data in b, d, e, g and i–k are representative of two independent experiments. Data in a and c–j are presented as mean ± s.e.m. One-way ANOVA with Tukey’s multiple comparison test (a,d–g), two-tailed t test (c,j), two-way ANOVA with Tukey’s multiple comparison test (h,i); *P ≤ 0.05, **P ≤ 0.01, ***P ≤ 0.001, ****P ≤ 0.0001.
© 2016 Macmillan Publishers Limited. All rights reserved.

nature immunology VOLUME 17 NUMBER 12 DECEMBER 2016 1365
A rt i c l e s
cell death at 30 µM (Fig. 3i and Supplementary Fig. 2p), as has been reported for macrophages11.
To test whether heme affects macrophage phagocytosis in vivo, we i.p. injected wild-type mice pretreated with PBS or heme with FITC-labeled heat-killed E. coli (FITC-E. coli). We found a strong reduction in the percentage of phagocytosing (FITC+) F4/80+ CD11b+Ly6G− peritoneal macrophages in heme-treated versus PBS-treated mice (Fig. 3j). Reduced in vivo phagocytosis was also observed in cytospin preparations of peritoneal exudate cells from mice treated with heme, as compared with PBS, and infected with live E. coli to induce sepsis (Fig. 3k). These results indicate that heme inhibition of phagocytosis occurs at sub-toxic levels and requires the intact heme molecule.
Heme disrupts actin cytoskeleton dynamicsPhagocytosis of pathogens relies on a tightly regulated actin cytoskele-ton rearrangement that occurs following recognition of foreign bodies,
and any interference with its regulation negatively affects host resistance against bacteria28. Concordantly, we found that exposure of RAW264.7 and human monocyte-derived macrophages to heme led to changes in cell shape, which were accompanied by cell spreading and a strong induction of filopodia formation (Fig. 4a,b and Supplementary Video 1), which was visible within 3 min of stimulation with heme, but not with DMSO or protoporphyrin IX (Fig. 4c, Supplementary Fig. 3a and Supplementary Videos 2 and 3). We quantified these changes by automatic image analysis and found that heme-induced cytoskeleton rearrangement led to a significant increase in cell area and perimeter, as well as a decrease in circularity (form factor) (Fig. 4d,e and Supplementary Fig. 3b–d), indicating that the heme-induced defective phagocytic response was likely tied to cytoskeleton rearrangements.
During immune responses to bacteria, cytoskeletal rearrangement is required beyond phagocytosis and is crucial for cell recruitment and migration29. To investigate whether heme has additional
a b
DAPIPhalloidin
DMSO Heme 10 µM
DAPIPhalloidin
DMSO Heme 10 µM
c 0 1 3 6 30 15 Time(min)
DMSO
Heme
DAPILifeActin-GFP
d e
Heme3 µM
Heme10 µM
DMSO
0
100
200
300
400
500 ****
****
Cel
l are
a (µ
m2 )
Heme(µM)
– 3 10 Heme(µM)
– 3 100
0.1
0.2
0.3
For
m fa
ctor
(Per
fect
circ
le =
1)
******
0
400
800
1,200
Cel
l are
a (µ
m2 )
****
*
Heme(µM)
– 3 100
0.1
0.2
0.3
0.4
For
m fa
ctor
(Per
fect
circ
le =
1)
********
Heme(µM)
– 3 10
Heme3 µM
Heme10 µM
DMSO
Figure 4 Heme induces cell shape changes via actin cytoskeleton remodeling. (a,b) Cellular morphology of RAW264.7 macrophages (a) and human monocyte-derived macrophages (b) incubated with control (DMSO) or heme for 15 min. Scale bars represent 20 µm. (c) Live cell imaging of RAW264.7 macrophages expressing LifeAct-GFP treated with control (DMSO) or 3 µM heme (see Supplementary Video 2). Scale bars represent 10 µm. (d,e) Cell shape analysis and automatic quantification of cell area and form factor of RAW264.7 macrophages (d) (n = 177–282 cells analyzed per condition) and human monocyte-derived macrophages (e) (n = 6 images per condition) incubated with control (DMSO) or heme for 15 min. Scale bars represent 20 µm. Data in a and d are representative of six independent experiments. Data in c are representative of two independent experiments. Data in d and e are presented as mean ± s.e.m.; one-way ANOVA with Tukey’s multiple comparison test (d,e); *P ≤ 0.05, **P ≤ 0.01, ****P ≤ 0.0001.
© 2016 Macmillan Publishers Limited. All rights reserved.
1366 VOLUME 17 NUMBER 12 DECEMBER 2016 nature immunology
A rt i c l e s
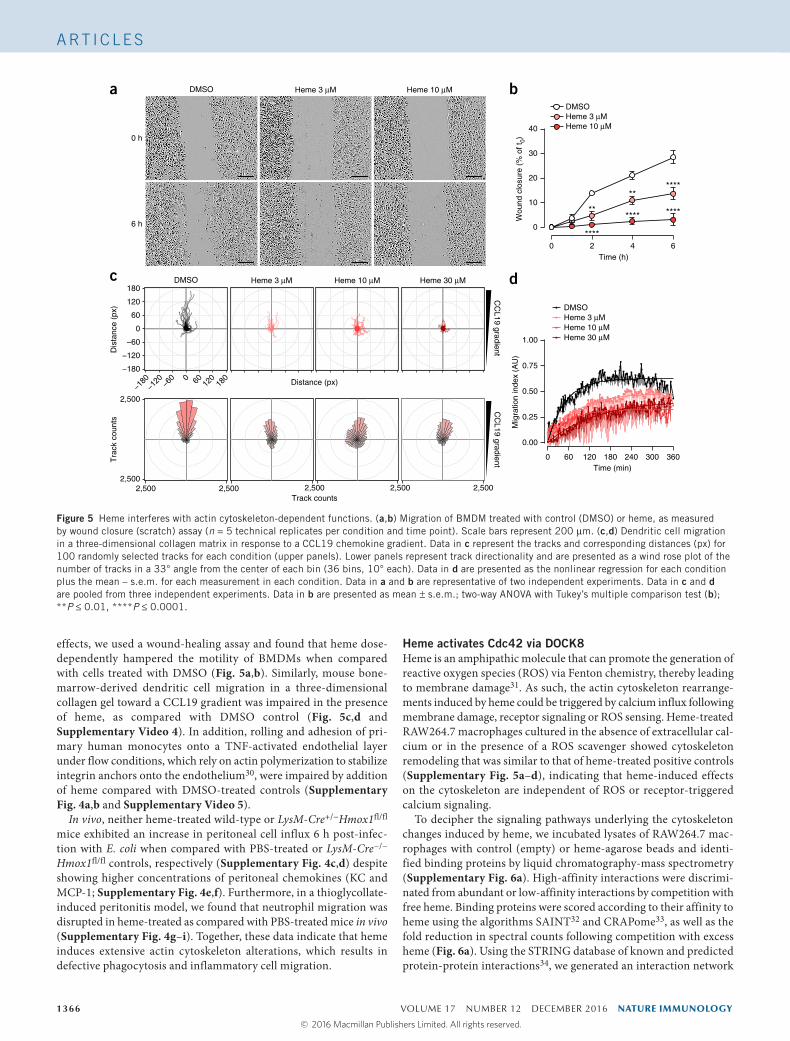
effects, we used a wound-healing assay and found that heme dose-dependently hampered the motility of BMDMs when compared with cells treated with DMSO (Fig. 5a,b). Similarly, mouse bone- marrow-derived dendritic cell migration in a three-dimensional collagen gel toward a CCL19 gradient was impaired in the presence of heme, as compared with DMSO control (Fig. 5c,d and Supplementary Video 4). In addition, rolling and adhesion of pri-mary human monocytes onto a TNF-activated endothelial layer under flow conditions, which rely on actin polymerization to stabilize integrin anchors onto the endothelium30, were impaired by addition of heme compared with DMSO-treated controls (Supplementary Fig. 4a,b and Supplementary Video 5).
In vivo, neither heme-treated wild-type or LysM-Cre+/−Hmox1fl/fl mice exhibited an increase in peritoneal cell influx 6 h post-infec-tion with E. coli when compared with PBS-treated or LysM-Cre−/− Hmox1fl/fl controls, respectively (Supplementary Fig. 4c,d) despite showing higher concentrations of peritoneal chemokines (KC and MCP-1; Supplementary Fig. 4e,f). Furthermore, in a thioglycollate-induced peritonitis model, we found that neutrophil migration was disrupted in heme-treated as compared with PBS-treated mice in vivo (Supplementary Fig. 4g–i). Together, these data indicate that heme induces extensive actin cytoskeleton alterations, which results in defective phagocytosis and inflammatory cell migration.
Heme activates Cdc42 via DOCK8Heme is an amphipathic molecule that can promote the generation of reactive oxygen species (ROS) via Fenton chemistry, thereby leading to membrane damage31. As such, the actin cytoskeleton rearrange-ments induced by heme could be triggered by calcium influx following membrane damage, receptor signaling or ROS sensing. Heme-treated RAW264.7 macrophages cultured in the absence of extracellular cal-cium or in the presence of a ROS scavenger showed cytoskeleton remodeling that was similar to that of heme-treated positive controls (Supplementary Fig. 5a–d), indicating that heme-induced effects on the cytoskeleton are independent of ROS or receptor-triggered calcium signaling.
To decipher the signaling pathways underlying the cytoskeleton changes induced by heme, we incubated lysates of RAW264.7 mac-rophages with control (empty) or heme-agarose beads and identi-fied binding proteins by liquid chromatography-mass spectrometry (Supplementary Fig. 6a). High-affinity interactions were discrimi-nated from abundant or low-affinity interactions by competition with free heme. Binding proteins were scored according to their affinity to heme using the algorithms SAINT32 and CRAPome33, as well as the fold reduction in spectral counts following competition with excess heme (Fig. 6a). Using the STRING database of known and predicted protein-protein interactions34, we generated an interaction network
Track counts2,500 2,500 2,500 2,500 2,500
0 60 120 180 240 300 360
0.00
0.25
0.50
0.75
1.00
Time (min)
DMSOHeme 3 µMHeme 10 µMHeme 30 µM
Mig
ratio
n in
dex
(AU
)
c d
E
DMSO Heme 3 µM Heme 10 µM Heme 30 µM
−180
−120
−60
0
60
120
180
−180
−120 −6
0 0 60 120
180
Dis
tanc
e (p
x)T
rack
cou
nts
Distance (px)
2,500
2,500
CC
L19 gradientC
CL19 gradient
a bDMSO Heme 3 µM Heme 10 µM
0 h
6 h
0 2 4 6
0
10
20
30
40
Time (h)
Wou
nd c
losu
re (
% o
f t0)
DMSOHeme 3 µMHeme 10 µM
****
********
**
****
**
Figure 5 Heme interferes with actin cytoskeleton-dependent functions. (a,b) Migration of BMDM treated with control (DMSO) or heme, as measured by wound closure (scratch) assay (n = 5 technical replicates per condition and time point). Scale bars represent 200 µm. (c,d) Dendritic cell migration in a three-dimensional collagen matrix in response to a CCL19 chemokine gradient. Data in c represent the tracks and corresponding distances (px) for 100 randomly selected tracks for each condition (upper panels). Lower panels represent track directionality and are presented as a wind rose plot of the number of tracks in a 33° angle from the center of each bin (36 bins, 10° each). Data in d are presented as the nonlinear regression for each condition plus the mean – s.e.m. for each measurement in each condition. Data in a and b are representative of two independent experiments. Data in c and d are pooled from three independent experiments. Data in b are presented as mean ± s.e.m.; two-way ANOVA with Tukey’s multiple comparison test (b); **P ≤ 0.01, ****P ≤ 0.0001.
© 2016 Macmillan Publishers Limited. All rights reserved.

nature immunology VOLUME 17 NUMBER 12 DECEMBER 2016 1367
A rt i c l e s
0
0.1
0.2
0.3
0.4
0.5
For
m fa
ctor
(Per
fect
circ
le =
1)
n.s.n.s.
n.s.*
n.s.n.s.
n.s.
ML141 (µM) – 3 10 30 3 10 30– 3 10 30
DMSOHeme 3 µMHeme 3 µM (ML141 washed away)
0
0.1
0.2
0.3
0.4
For
m fa
ctor
(Per
fect
circ
le =
1)
n.s.n.s.
*******
K216-0385 (µM) – 5 20 80 – 5 20 80
DMSOHeme 3 µM
Heme3 µM
DMSO
ML141 (µM)
3 3010DMSO
ML141washed away
Heme3 µM
DMSO
K216-0385 (µM)
5 8020DMSO
DAPIPhalloidin
a c
e
g h
f
b
Heme-binding[–log10(P value)]
>18
6
1
Spectral counts
2 90
ARPC3
ATP6V1H
ARPC5L
ARPC4
ATP6V1A
ARPC2
WASF2 WASF3
ACTR3
ABR
SRGAP2NCKIPSDLRCH4
ARHGEF1
PIK3AP1
ABI1
DOCK8CDC42
GAPVD1
ANLN
Xpo1
DOCK7
LGALS1
FHOD1
G3BP1CSE1LLGALS3 DOK1
MEMO1 RAB3IL1
ARP2/3complex
SPHK2
MPP1
?
LGALS3
ATP6V1A
MPP1
ARPC3
DOCK8
37 kDa
26 kDa
70 kDa
64 kDa49 kDa25 kDa
15 kDa
170 kDa
InputMW
E.B. H.B. H.B.C.
d
LGALS3
ARPC3MPP1
DOK1
DOCK8
NENF
SDHA
ATP6V1A
SPHK2
0
50
100
150
0.00 0.25 0.50 0.75 1.00SAINT score
probability of interaction with heme
Fol
d re
duct
ion
of s
pect
ral c
ount
saf
ter
com
petit
ion
with
free
hem
e
Spectral counts
50010050100
CRAPome scoreinv. prob. of contaminant
0 0.45 0.9 0.95 1
ABR
FHOD1RAB3IL1
EEF1A1TUBB4B
DAPIPhalloidin
0 10 20 30
0.0
0.5
1.0
1.5
OD
490
Time (min)
DMSOHeme 3 µM
**
*
Figure 6 Identification of the mechanism of heme-induced cytoskeletal interference. (a) Competition analysis and results of computational analyses using the SAINT and CRAPome database bioinformatics tools (n = 2 replicates per experiment). (b) STRING database network analysis of heme-associated proteins from a that are involved in actin cytoskeleton remodeling. Edge thickness represents interaction confidence as reported by the STRING database v9.1. Solid edges indicate interactions reported for mouse, dashed edges indicate human ortholog projections. (c) Western blot validation of heme-associated proteins. E.B., empty beads; H.B., heme beads; H.B.C., heme beads, heme-competed sample. (d) Cdc42 G-LISA assay measuring the activation of Cdc42 in RAW264.7 macrophages treated with PBS or heme (n = 3 technical replicates per condition and time point). (e,f) Representative images of cellular morphology (e) of RAW264.7 macrophages pretreated with control (DMSO), ML141 (CDC42 inhibitor), or ML141 treatment and subsequent washing to remove ML141, and treated with control (DMSO) or heme for 15 min, and automatic quantification of form factor (f) (n = 4 random fields per condition; see automatic quantification of cell area in Supplementary Fig. 6d). (g,h) Cellular morphology (g) of RAW264.7 macrophages pretreated with control (DMSO) or K216-0381 (mDIA2 inhibitor), and treated with control (DMSO) or heme for 15 min, and corresponding automatic quantification of form factor (h) (n = 4 random fields per condition). Data in a and b are based on two independent experiments for each condition. Data in c–f are representative of two independent experiments. Data in d, f and h are presented as mean ± s.e.m. Two-way ANOVA with Tukey’s multiple comparison test (d), one-way ANOVA with Tukey’s multiple comparison test (f,g); n.s. = not significant, *P ≤ 0.05, **P ≤ 0.01, ***P ≤ 0.001, ****P ≤ 0.0001. Scale bars represent 20 µm.
© 2016 Macmillan Publishers Limited. All rights reserved.

1368 VOLUME 17 NUMBER 12 DECEMBER 2016 nature immunology
A rt i c l e s
involving various proteins that are known to interact with, or activate, the small GTPase Cdc42, an intracellular signaling regulator, as well as members of the ARP2/3 and WAVE actin cytoskeleton regulator complexes (Fig. 6a,b). The heme-association of several candidate proteins in this network was validated by affinity purification with heme-agarose beads, followed by western blotting (Fig. 6c).
Cdc42 is involved in cell motility and phagocytosis, but is mainly recognized as being a central node in the formation of lamellipodia and filopodia at the leading edge35. Consistent with the observation that heme-treated macrophages rapidly altered their cell shape and concomitantly formed numerous filopodia, we investigated whether heme leads to the activation of Cdc42 and/or ARP2/3 in macrophages. Heme stimulation of RAW264.7 macrophages induced immediate
Cdc42 activation for up to 30 min after stimulation (Fig. 6d), without inducing changes in total Cdc42 protein amounts (Supplementary Fig. 6b). Selective inhibition of Cdc42 with ML141, which allos-terically inhibits nucleotide binding, effectively blocked all heme-induced changes in cell shape, and this effect could be reversed by removal of ML141 by washing before heme treatment (Fig. 6e,f and Supplementary Fig. 6c,d). Consistent with the essential role of ARP2/3 in the formation of lamellipodia35, specific inhibition of the ARP2/3 complex with CK666, which stabilizes ARP2/3 in its inactive conformation, blocked heme-induced lamellipodia, but not filopodia, formation (Supplementary Fig. 6c,e,f). As a control, CRISPR-targeted deletion of the cytoskeleton signaling protein MPP1 or the cell-adhesion mediator galectin 3 (LGALS3) in RAW264.7 macrophages,
f Blood LiverPLF
CF
Us
(log 10
)
1
2
3
4
5
6
7
8
9 **** ****
0
1
2
3
4
5
6
7
8 **** ****
1
2
3
4
5
6
7
8 **** ****WT>WT
Dock8–/–
>WT
PBS Heme PBS Heme PBS Heme
c d e
0.0
0.5
1.0
1.5
2.0
OD
490
Heme –
*
n.s.
+ +–
WTDock8−/−
0
2,000
4,000
6,000
Pha
gocy
tosi
s in
dex
**** n.s.
n.s.
******
Heme (µM) – 103 – 3 10
WTDock8−/−
0
20
40
60
80
100
Pla
sma
hem
e [µ
M]
PBS
****
**n.s.
n.s.
Heme
WT>WT+E. coli
Naive WT
Dock8–/–>WT+E. coli
a b
0.0
0.1
0.2
0.3
0.4
n.s.
********
n.s.n.s.
HoxB8 macrophages
Heme (µM) – 3 10 30 – 3 10 30
WTDock8−/−
For
m fa
ctor
(P
erfe
ct c
ircle
= 1
) n.s.
DMSO 30 µM10 µM3 µM
Heme
WT
Dock8−/−
DAPIPhalloidin
Figure 7 DOCK8 mediates heme-induced actin cytoskeleton changes and suppression of phagocytosis. (a,b) Cellular morphology of WT and Dock8−/− HoxB8 macrophages (a) treated with control (DMSO) or heme for 15 min and corresponding automatic quantification of form factor (b) (n = 4–8 images per condition). Scale bars represent 20 µm. (c) Cdc42 G-LISA assay measuring the activation of Cdc42 in WT and Dock8−/− HoxB8 macrophages treated with PBS or heme (10 µM) for 10min (n = 3 technical replicates per condition). (d) Phagocytosis of FITC-E. coli by WT and Dock8−/− BMDM pretreated with control (DMSO) or heme (n = 4 technical replicates per condition), analyzed by flow cytometry. (e,f) Plasma heme levels (e) of naive WT mice (n = 8) or WT>WT and Dock8−/−>WT bone marrow chimeras pretreated with PBS (n = 7–8) or heme (n = 7) and respective bacterial counts (f) 16 h after infection with E. coli. Data in a, b and d are representative of two independent experiments. Data in b–d are presented as mean ± s.e.m. and data in e and f are presented as mean, and dots represent individual animals. One-way ANOVA with Tukey’s multiple comparison test (b–f), n.s. = not significant, *P ≤ 0.05, **P ≤ 0.01, ****P ≤ 0.0001.
© 2016 Macmillan Publishers Limited. All rights reserved.

nature immunology VOLUME 17 NUMBER 12 DECEMBER 2016 1369
A rt i c l e s
which we identified as heme-associated proteins that are not known to interact with Cdc42 (Fig. 6b), did not prevent heme-induced actin cytoskeleton reorganization compared with wild-type cells (Supplementary Fig. 6g,h). We therefore focused on Cdc42-induced
filopodia formation, which can be elicited via the activation of the actin nucleator mDIA2 (ref. 36). Inhibiting mDIA2 using its specific inhibitor, K216-0385, fully abrogated heme-induced filopodia exten-sion (Fig. 6g,h and Supplementary Fig. 6c).
DMSO
0
20
40
60
80
100
FIT
C+ m
acro
phag
es(%
of t
otal
)
***n.s.
n.s.Heme
35
25
55
180
250
MW(kDa)
Input E.B. H.B. H.B.C.H.B.+Qui.
d e
250k
200k
150k
100k
50k
00 103 104 105
PBS Heme
Quinine
Mock
SS
C-A
FITC-E. coli
98.2%
92.8%
61.9%
91.5%LGALS3
MPP1
DOCK8
Time post-infection (h)
Per
cent
sur
viva
l
0 12 24 36 48 60
0
25
50
75
100
n.s.
*
****
****
PBS
Heme
PBS + quinine
Heme + quinine
Blood Liver
CF
Us
(log 10
)
n.s.
****
n.s.
********
1
2
3
4
5
6
7
8
9
Quinine − + − + − + − +
PBS Heme
0
20
40
60
80
E. coli
Pla
sma
hem
e [µ
M]
n.s.
* n.s.
PBS Heme
Quinine − + − +−
f g h
–1.5
–1.0
–0.5
0.0
0.5
1.0
1.5
–1.5 –1.0 –0.5 0.0 0.5 1.0 1.5
Com
poun
d vs
. hem
e(lo
g 2 fo
ld c
hang
e)
C-score(from median)
1.00
0.60
0.300.15<0
C-score(from mean)
0.0min
max
0.5
1.0
Quinine
0
2,000
4,000
6,000
8,000
10,000
Quinine(µM)
– 10 30 – 10 30
Pha
gocy
tosi
s in
dex
****
****
***
DMSOHeme
0
5,000
10,000
15,000
Quinine(µM)
– 10 30 – 10 30
** ***
**
n.s.
Pha
gocy
tosi
s in
dex
DMSOHeme
b ca
Compound vs. DMSO(log2 fold change)
Figure 8 Quinine restores phagocytosis of bacteria in vitro and in vivo. (a) Effect of compounds on phagocytosis of bacteria by RAW264.7 macrophages. Data are presented as the log2 fold change in phagocytosis induced by each compound versus DMSO control (x axis) or versus heme (y axis). Bubble size and color represent the compound scores derived from the median and mean phagocytosis values, respectively. (b,c) Phagocytosis of FITC-E. coli by RAW264.7 macrophages (b) and human monocyte-derived macrophages (n = 3 technical replicates) (c) pretreated with control (saline) or quinine, and treated with control (DMSO) or heme as assessed by flow cytometry. (d) Western blot assessment of the influence of quinine on the association of DOCK8, LGALS3 or MPP1 to heme. E.B., empty beads; H.B., heme beads; H.B.C., heme beads, heme-competed sample; H.B.Qui., heme beads, quinine-competed sample. (e) In vivo phagocytosis of heat-killed FITC-E. coli by peritoneal macrophages (F4/80+CD11b+Ly6G−) from mice pretreated with mock (PBS) or quinine, and treated with PBS or heme (n = 4 mice per condition), and quantified as the percentage of FITC+ macrophages by flow cytometry (representative plots, left). (f) Plasma heme levels of naive WT mice (n = 8) or WT mice pretreated with mock (PBS) or 60mg/kg quinine, and treated with PBS or heme, and (g) respective bacterial counts 16 h post-infection with E. coli (n = 7 per group of infected mice). (h) Survival of WT mice pretreated with mock (PBS) or quinine, and treated with PBS or heme (n = 11–12 per group, quinine and heme dose as in f and g). Data in b, d, f and g are representative of two independent experiments. Data in b, c and e are presented as mean ± s.e.m. Data in f and g are presented as mean, and dots represent individual animals; C-score analysis (a) (Online Methods), one-way ANOVA with Tukey’s multiple comparison test (b,c,e–g), Mantel-Cox test (h); n.s. = not significant, *P ≤ 0.05, **P ≤ 0.01, ***P ≤ 0.001, ****P ≤ 0.0001.
© 2016 Macmillan Publishers Limited. All rights reserved.

1370 VOLUME 17 NUMBER 12 DECEMBER 2016 nature immunology
A rt i c l e s
DOCK8, a member of the atypical guanine nucleotide exchange factor family that has been reported to specifically activate Cdc42 (ref. 37), was among the proteins with highest affinity for heme (Fig. 6a–c). To test the role of DOCK8 in mediating heme-induced actin cytoskeleton changes, we used BMDMs generated from wild-type and Dock8−/− bone marrow progenitors immortalized via estro-gen-receptor-driven HoxB8 expression (ER-HoxB8 BMDMs). In contrast with wild-type ER-HoxB8 BMDMs, Dock8−/− ER-HoxB8 BMDM did not spread or extend filopodia (Fig. 7a,b), and failed to activate Cdc42 following treatment with heme (Fig. 7c), indicating that DOCK8 was essential for heme-induced activation of Cdc42. Of note, stimulation with the unrelated Cdc42 activator bradykinin led to cell shape changes in both wild-type and Dock8−/− ER-HoxB8 macrophages (Supplementary Fig. 7a), indicating that the lack of heme-induced filopodia extensions in the absence of DOCK8 was not a result of intrinsic cytoskeletal defects. Consequently, Dock8−/− BMDMs were protected from the inhibitory effects of heme on phago-cytosis of E. coli, as compared with their wild-type counterparts (Fig. 7d and Supplementary Fig. 7b,c).
To assess whether DOCK8 deletion provides protection against the detrimental effects of heme on bacterial clearance during sep-sis in vivo, we reconstituted lethally irradiated wild-type mice with wild-type (WT) or Dock8−/− bone marrow to generate WT>WT and Dock8−/−>WT bone marrow chimeras. After successful engraftment, as verified by the percentage of donor (CD45.2+) versus recipient (CD45.1+) leukocytes 6 weeks after reconstitution (Supplementary Fig. 7d), chimeric mice were treated with PBS or heme 30 min before E. coli infection. In spite of similarly elevated plasma heme levels in WT>WT and Dock8−/−>WT chimeras following heme treatment (Fig. 7e), Dock8−/−>WT chimeras were significantly protected against excess heme and showed a tenfold reduction in bacterial numbers in liver, blood and peritoneal cavity (Fig. 7f). These results indi-cate that heme acts via DOCK8 to activate Cdc42, leading to dys-regulated actin polymerization and impaired bacterial clearance (Supplementary Fig. 7e).
Quinine restores phagocytosis in vitro and in vivoBecause inhibition of cytoskeletal effector molecules such as DOCK8 or Cdc42 is not amenable as a therapeutic strategy because of the potential inhibitory effects on cell migration and phagocytosis38, we sought to identify suitable compounds that could prevent the heme-induced inhibition of phagocytosis without affecting baseline phago-cytosis of bacteria. To do so, we employed an automated screening platform and tested 389 compounds, including a library representing the variety of approved drugs with regards to their chemical structures and molecular targets. We used high-throughput automated micro-scopy to measure the phagocytosis efficiency of RAW264.7 macro-phages pretreated with the compound library and incubated with heme or DMSO (Supplementary Fig. 8a), and scored the compounds on the basis of their efficacy at preventing heme-induced inhibition of phagocytosis (Fig. 8a and Supplementary Fig. 8b). The top perform-ing drug identified was the antimalarial compound quinine, which fully restored phagocytosis in the presence of heme, without affecting baseline phagocytosis (Fig. 8a and Supplementary Fig. 8b,c).
Quinine pretreatment protected RAW264.7 macrophages (Fig. 8b and Supplementary Fig. 8c,d) and human macrophages (Fig. 8c) from heme-induced inhibition of phagocytosis and actin cytoskel-eton changes (Supplementary Fig. 8e,f) compared with DMSO-treated cells. Notably, quinine diminished the association of heme with DOCK8 without affecting the association of heme with MPP1 or LGALS3 in RAW264.7 macrophages (Fig. 8d), suggesting that
quinine exerted its protective effect by specifically disrupting the heme-DOCK8 association. To test the effects of quinine in vivo, we pretreated wild-type mice with PBS or heme, followed by mock or qui-nine treatment (60 mg/kg) before FITC-E. coli i.p. injection. Quinine treatment abrogated the inhibitory effects of heme on bacterial phago-cytosis by peritoneal macrophages (Fig. 8e), indicating that quinine could also restore macrophage phagocytosis in vivo. Following induc-tion of E. coli peritonitis in wild-type mice, quinine treatment did not affect plasma heme levels, but did lead to a reduction in bacterial counts in blood and liver (Fig. 8f,g and Supplementary Fig. 8g,h), thereby restoring the bacterial clearance capacity of heme-treated mice. Notably, the dose of quinine that we used did not affect bacterial growth in vitro (Supplementary Fig. 8i,j). Finally, quinine-treatment of heme-treated mice significantly improved survival compared with heme-treated mice that received mock treatment (Fig. 8h), indicating that quinine treatment prevented the detrimental effects of exogenous heme administration. Furthermore, quinine treatment also improved the survival of PBS-treated mice compared with mock treatment of PBS-treated mice (Fig. 8h). These results indicate that quinine pre-vents the harmful effects of endogenously elevated heme in the course of Gram-negative bacteria-induced sepsis.
DISCUSSIONWe found that heme released in the course of hemolysis is a critical fac-tor for driving bacterial outgrowth via the disruption of host resistance mechanisms, as it interferes with phagocyte cytoskeletal dynamics. Earlier observations of increased infection rates in the presence of iron, heme, hemoglobin and related compounds have commonly been ascribed to the nutritional benefit of increased iron availability for bacteria20,39. In fact, iron withholding is a widely accepted immune mechanism for restricting bacterial growth by limiting iron bioavail-ability40. Consistent with the notion that all bacterial pathogens are able to circumvent nutritional immunity25, our data indicate that the iron requirement for bacterial growth is met in the course of infection, independent of heme-iron acquisition by the pathogen in vivo.
Efficient pathogen removal greatly relies on phagocytosis by mac-rophages as a first line of defense41. Following phagocytic receptor engagement, precise signaling triggers local cytoskeletal rearrange-ments that allow the engulfment of bacteria28. We discovered that this process was disrupted by excess heme, thereby creating a per-missive host environment for bacterial infections and sepsis. Given the importance of phagocytosis, it is not surprising that pathogens have evolved means to avoid internalization, often by manipulating the host cell cytoskeleton42. In fact, some pathogens directly target Cdc42 activity to prevent phagocytosis in a manner analogous to our findings42. It is therefore conceivable that the evolution of erythro-cyte-lysing toxins, such as alpha-hemolysin, provide an important means of evading host defense by inducing heme release. As such, our findings provide a new perspective on the role of these toxins during bacterial infections, independent of their proposed role as a means to increase iron availability. Another aspect to consider relates to the generation of bioactive molecules as a result of heme catabolism by HO-1. Particularly, carbon monoxide (CO) has been implicated as an immunomodulatory second messenger that is able to prime mac-rophages for increased bacterial killing via indirect NLRP3 inflam-masome activation43. This suggests that CO could help to reduce the deleterious effects of excess heme on host resistance.
Our finding that DOCK8 is necessary for the cytoskeleton changes and disruption of bacterial phagocytosis by heme is consistent with recent studies showing that DOCK8 regulates dendritic cell migra-tion via Cdc42 (refs. 37,44). We speculate that heme stimulates
© 2016 Macmillan Publishers Limited. All rights reserved.
nature immunology VOLUME 17 NUMBER 12 DECEMBER 2016 1371
A rt i c l e s
DOCK8 guanine nucleotide exchange factor activity, either directly or indirectly via a DOCK8-containing protein complex. Although it is unlikely that this association is relevant under homeostasis, exhaustion of heme-scavenging proteins following severe hemolysis7,8 might render it especially important for bacterial infections. As such, Dock8−/−>WT chimeric mice were protected from elevated heme dur-ing sepsis. However, the improved bacterial clearance in the absence of DOCK8 was incomplete and likely represents a tradeoff between ben-eficial effects of DOCK8 deletion following hemolysis and inevitable immune defects caused by DOCK8 deficiency37,45. Nevertheless, the net gain in resistance against bacteria further reinforces the relevance of this mechanism during bacterial sepsis. DOCK8 is an intracellular protein that is thought to be anchored to the cell membrane, where it controls cell movement and shape46. Thus, understanding precisely how heme gains access to the cytoplasm of innate immune cells could prove to be useful for therapeutic strategy developments, and might be attainable by complexing extracellular heme or by targeting heme transporters to prevent heme internalization.
The effects of excess heme on host resistance that we identified surprised us, considering the weight malaria has had in shaping the human genome. However, it is important to recognize that these events occur mainly following systemic inflammation or in people with homozygous sickle hemoglobin, where even highly conserved mechanisms to scavenge and degrade heme are overwhelmed9. It is reasonable to speculate that the need to mitigate the effect of excess heme on vital organs is such that it takes priority over host defense mechanisms, especially given the fact that both functions are essen-tially coordinated by macrophages.
Rising antibiotic resistance and widespread prophylactic antibiotic use have created an urgent need for new therapeutic strategies. As a proof of concept, we found that quinine treatment was able to prevent cytoskeletal changes and phagocytosis inhibition induced by heme. Quinine is a long-standing antimalarial drug, whose mechanism of action is not fully understood, although it has been reported that quinine forms complexes with heme47, indicating that quinine might interfere with the association of heme with DOCK8 through steric hindrance. This is important, as targeting heme effects upstream of Cdc42 signaling should conserve its normal function. Our results with quinine suggest that adjuvant immunotherapy strategies focused on restoring host resistance are a viable alternative to fighting the increased infection rates resulting from hemolysis.
Taken together, our findings uncover an unexpected effect of heme on the innate immune response and pave the way toward future therapeutic approaches. This could have far-reaching implications, not only for patients with inherited hemolytic disorders, but also for patients with acquired hemolysis, such as malaria, systemic inflam-mation and sepsis.
METHODSMethods and any associated references are available in the online version of the paper.
Note: Any Supplementary Information and Source Data files are available in the online version of the paper.
ACKnOwLEDGMEnTSY. Fukui (Medical Institute of Bioregulation, Kyushu University) and J. Stein (Theodor Kocher Institute, University of Bern) are acknowledged for providing the DOCK8 deficient bone marrow. and H. Häcker (St. Judes Children’s Research Hospital) for providing the ERHBD-HoxB8-encoding retroviral construct. pSpCas9(BB)-2a-Puro (PX459) was a gift from F. Zhang (Massachusetts Institute of Technology) (Addgene plasmid # 48139) and pGRG36 was a gift from N. Craig (Johns Hopkins University School of Medicine) (Addgene plasmid # 16666).
LifeAct-GFP-encoding retrovirus was kindly provided by A. Leithner (Institute of Science and Technology Austria). pSIM8 and TKC E. coli were gifts from D.L. Court (Center for Cancer Research, National Cancer Institute). We acknowledge M. Gröger and S. Rauscher for excellent technical support (Core imaging facility, Medical University of Vienna). We thank D.P. Barlow and L.R. Cheever for critical reading of the manuscript. This work was supported by the Austrian Academy of Sciences, the Science Fund of the Austrian National Bank (14107) and the Austrian Science Fund FWF (I1620-B22) in the Infect-ERA framework (to S.Knapp).
AUTHOR COnTRIBUTIOnSR.M. performed and designed the in vivo, in vitro, pull-down and confocal microscopy experiments, analyzed data, and performed bioinformatics analysis. K.V.M.H. performed pull-down experiments. J.M. assisted with in vitro and in vivo experiments. A.-D.G. assisted with CRISPR/Cas9 knockout clone generation. O.S. performed efferocytosis assay. P.S., S.S., F.Q., R.G., K.L., A.H., A.K., B.R.-S., C.-H.L., K.V. and M.D. provided experimental support. T.D. designed and M.C.A. performed the L. monocytogenes experiments. M.B. performed the Cellix experiments. D.K., H.E. and S.C.E. provided reagents or mice. J.C. and K.L.B. analyzed the liquid chromatography mass spectrometry experiments. S. Kubicek supported and oversaw chemical screening instrumentation. M.S. and G.S.-F. provided technical and intellectual support. S. Knapp designed and supervised the research. R.M. and S. Knapp wrote the manuscript. All of the authors reviewed the manuscript.
COMPETInG FInAnCIAL InTERESTSThe authors declare no competing financial interests.
reprints and permissions information is available online at http://www.nature.com/reprints/index.html.
1. Modell, B. & Darlison, M. Global epidemiology of haemoglobin disorders and derived service indicators. Bull. World Health Organ. 86, 480–487 (2008).
2. World Health Organization. World Malaria Report 2013. World Health Organization: Geneva, 2013.
3. Adamzik, M. et al. Free hemoglobin concentration in severe sepsis: methods of measurement and prediction of outcome. Crit. Care 16, R125 (2012).
4. Larsen, R. et al. A central role for free heme in the pathogenesis of severe sepsis. Sci. Transl. Med. 2, 51ra71 (2010).
5. Schaer, D.J., Buehler, P.W., Alayash, A.I., Belcher, J.D. & Vercellotti, G.M. Hemolysis and free hemoglobin revisited: exploring hemoglobin and hemin scavengers as a novel class of therapeutic proteins. Blood 121, 1276–1284 (2013).
6. Muller-Eberhard, U., Javid, J., Liem, H.H., Hanstein, A. & Hanna, M. Plasma concentrations of hemopexin, haptoglobin and heme in patients with various hemolytic diseases. Blood 32, 811–815 (1968).
7. Dutra, F.F. & Bozza, M.T. Heme on innate immunity and inflammation. Front. Pharmacol. 5, 115 (2014).
8. Smith, A. & McCulloh, R.J. Hemopexin and haptoglobin: allies against heme toxicity from hemoglobin not contenders. Front. Physiol. 6, 187 (2015).
9. Gozzelino, R., Jeney, V. & Soares, M.P. Mechanisms of cell protection by heme oxygenase-1. Annu. Rev. Pharmacol. Toxicol. 50, 323–354 (2010).
10. Chiabrando, D., Vinchi, F., Fiorito, V., Mercurio, S. & Tolosano, E. Heme in pathophysiology: a matter of scavenging, metabolism and trafficking across cell membranes. Front. Pharmacol. 5, 61 (2014).
11. Fortes, G.B. et al. Heme induces programmed necrosis on macrophages through autocrine TNF and ROS production. Blood 119, 2368–2375 (2012).
12. Seixas, E. et al. Heme oxygenase-1 affords protection against noncerebral forms of severe malaria. Proc. Natl. Acad. Sci. USA 106, 15837–15842 (2009).
13. Ramakrishnan, M. et al. Increased risk of invasive bacterial infections in African people with sickle-cell disease: a systematic review and meta-analysis. Lancet Infect. Dis. 10, 329–337 (2010).
14. Wiener, E. Impaired phagocyte antibacterial effector functions in beta-thalassemia: a likely factor in the increased susceptibility to bacterial infections. Hematology 8, 35–40 (2003).
15. Church, J. & Maitland, K. Invasive bacterial co-infection in African children with Plasmodium falciparum malaria: a systematic review. BMC Med. 12, 31 (2014).
16. Scott, J.A. et al. Relation between falciparum malaria and bacteraemia in Kenyan children: a population-based, case-control study and a longitudinal study. Lancet 378, 1316–1323 (2011).
17. Cober, M.P. & Phelps, S.J. Penicillin prophylaxis in children with sickle cell disease. J. Pediatr. Pharmacol. Ther. 15, 152–159 (2010).
18. Hirst, C. & Owusu-Ofori, S. Prophylactic antibiotics for preventing pneumococcal infection in children with sickle cell disease. Cochrane Database Syst. Rev. 11, CD003427 (2014).
19. Dutra, F.F. et al. Hemolysis-induced lethality involves inflammasome activation by heme. Proc. Natl. Acad. Sci. USA 111, E4110–E4118 (2014).
20. Cassat, J.E. & Skaar, E.P. Iron in infection and immunity. Cell Host Microbe 13, 509–519 (2013).
21. Cunnington, A.J. et al. Prolonged neutrophil dysfunction after Plasmodium falciparum malaria is related to hemolysis and heme oxygenase-1 induction. J. Immunol. 189, 5336–5346 (2012).
© 2016 Macmillan Publishers Limited. All rights reserved.

1372 VOLUME 17 NUMBER 12 DECEMBER 2016 nature immunology
22. Cunnington, A.J., de Souza, J.B., Walther, M. & Riley, E.M. Malaria impairs resistance to Salmonella through heme- and heme oxygenase-dependent dysfunctional granulocyte mobilization. Nat. Med. 18, 120–127 (2011).
23. Ganz, T. Macrophages and systemic iron homeostasis. J. Innate Immun. 4, 446–453 (2012).
24. Jais, A. et al. Heme oxygenase-1 drives metaflammation and insulin resistance in mouse and man. Cell 158, 25–40 (2014).
25. Skaar, E.P. The battle for iron between bacterial pathogens and their vertebrate hosts. PLoS Pathog. 6, e1000949 (2010).
26. Wandersman, C. & Stojiljkovic, I. Bacterial heme sources: the role of heme, hemoprotein receptors and hemophores. Curr. Opin. Microbiol. 3, 215–220 (2000).
27. Létoffé, S., Delepelaire, P. & Wandersman, C. The housekeeping dipeptide permease is the Escherichia coli heme transporter and functions with two optional peptide binding proteins. Proc. Natl. Acad. Sci. USA 103, 12891–12896 (2006).
28. Flannagan, R.S., Jaumouillé, V. & Grinstein, S. The cell biology of phagocytosis. Annu. Rev. Pathol. 7, 61–98 (2012).
29. Moulding, D.A., Record, J., Malinova, D. & Thrasher, A.J. Actin cytoskeletal defects in immunodeficiency. Immunol. Rev. 256, 282–299 (2013).
30. McEver, R.P. & Zhu, C. Rolling cell adhesion. Annu. Rev. Cell Dev. Biol. 26, 363–396 (2010).
31. Wagener, F.A. et al. Different faces of the heme-heme oxygenase system in inflammation. Pharmacol. Rev. 55, 551–571 (2003).
32. Choi, H. et al. SAINT: probabilistic scoring of affinity purification-mass spectrometry data. Nat. Methods 8, 70–73 (2011).
33. Mellacheruvu, D. et al. The CRAPome: a contaminant repository for affinity purification-mass spectrometry data. Nat. Methods 10, 730–736 (2013).
34. Franceschini, A. et al. STRING v9.1: protein-protein interaction networks, with increased coverage and integration. Nucleic Acids Res. 41, D808–D815 (2013).
35. Ridley, A.J. Life at the leading edge. Cell 145, 1012–1022 (2011).36. Heasman, S.J. & Ridley, A.J. Mammalian Rho GTPases: new insights into
their functions from in vivo studies. Nat. Rev. Mol. Cell Biol. 9, 690–701 (2008).
37. Harada, Y. et al. DOCK8 is a Cdc42 activator critical for interstitial dendritic cell migration during immune responses. Blood 119, 4451–4461 (2012).
38. Lee, D.J., Cox, D., Li, J. & Greenberg, S. Rac1 and Cdc42 are required for phagocytosis, but not NF-kappaB-dependent gene expression, in macrophages challenged with Pseudomonas aeruginosa. J. Biol. Chem. 275, 141–146 (2000).
39. Hill, G.B. Enhancement of experimental anaerobic infections by blood, hemoglobin, and hemostatic agents. Infect. Immun. 19, 443–449 (1978).
40. Nairz, M., Haschka, D., Demetz, E. & Weiss, G. Iron at the interface of immunity and infection. Front. Pharmacol. 5, 152 (2014).
41. Flannagan, R.S., Cosío, G. & Grinstein, S. Antimicrobial mechanisms of phagocytes and bacterial evasion strategies. Nat. Rev. Microbiol. 7, 355–366 (2009).
42. Sarantis, H. & Grinstein, S. Subversion of phagocytosis for pathogen survival. Cell Host Microbe 12, 419–431 (2012).
43. Wegiel, B. et al. Macrophages sense and kill bacteria through carbon monoxide-dependent inflammasome activation. J. Clin. Invest. 124, 4926–4940 (2014).
44. Krishnaswamy, J.K. et al. Coincidental loss of DOCK8 function in NLRP10-deficient and C3H/HeJ mice results in defective dendritic cell migration. Proc. Natl. Acad. Sci. USA 112, 3056–3061 (2015).
45. Zhang, Q. et al. Combined immunodeficiency associated with DOCK8 mutations. N. Engl. J. Med. 361, 2046–2055 (2009).
46. Nishikimi, A., Kukimoto-Niino, M., Yokoyama, S. & Fukui, Y. Immune regulatory functions of DOCK family proteins in health and disease. Exp. Cell Res. 319, 2343–2349 (2013).
47. Leed, A. et al. Solution structures of antimalarial drug-heme complexes. Biochemistry 41, 10245–10255 (2002).
A rt i c l e s
© 2016 Macmillan Publishers Limited. All rights reserved.

nature immunologydoi:10.1038/ni.3590
ONLINE METHODSMice. Sex- and age-matched 8–10-week old WT C57BL/6, LysM-Cre−/−Hmox1fl/fl and littermate LysM-Cre+/−Hmox1fl/fl mice were used. All mice were kept in SPF conditions, with 12-h light/dark cycle, unrestricted access to food and water, and environmental enrichment. For bone marrow transplant and bone marrow macrophage generation experiments, healthy female WT C57BL/6 and Dock8−/− mice were used44. All in vivo experiments were performed in accord-ance with Austrian law and after approval by the Institutional Review Board of the Medical University of Vienna and the Austrian Ministry of Sciences (BMWF-66.009/0277-II/3b/2013).
Reagents and ELISA. Heme (hemin), hemoglobin, quinine (quinine hydro-chloride dihydrate), 2,2’-bipyridyl, Ammonium iron (III) citrate, Iron (II) sulfate, neutral red, CK666, ML-141, E. coli O55:B5 lipopolysaccharide (LPS), phenylhydrazine, N-acetyl-L-cysteine, trichloroacetic acid, bathophenanthro-line disulfonic acid, ascorbic acid, staurosporine, estradiol, bradykinin, DAPI, phalloidin-TRITC, Hoechst 33258 and hemin-agarose were from Sigma. PPIX (protoporphyrin IX, Frontier Scientific), SnPPIX (tin protoporphyrin IX, Santa Cruz Biotechnology), deferoxamine (Desferal, Novartis), DMSO (CryoSure DMSO, WAK – Chemie Medical GmbH), K216-0385 (ref. 48) (ChemDiv), cytochalasin D (Calbiochem), phalloidin-Alexa Fluor 633 and CellMask Orange (Life Technologies), rhM-CSF, and IL-3 (PeproTech), GM-CSF and IL-6 (eBioscience), TMB substrate (Thermo Scientific).
For flow cytometry Ly-6G-PE or PE/Cy7 (clone 1A8), CD11c-APC or PerCP/Cy5.5 (N418), F4/80-PE/Cy7 or FITC (BM8), CD45.1-APC (A20), CD45.2-PerCP/Cy5.5 (104), CD11b Pacific blue (M1/70), CD19-Brilliant Violet 605 or PE (6D5), and Ly-6C-Brilliant Violet 605 (HK 1.4) were from BioLegend. CD3-APC (17A2), B220-PerCP-Cy5.5 (RA3-6B2), CD11b-Alexa Fluor 700 (M1/70), Fixable Viability Dye eFluor 780 were from eBioscience. CD3e-V500 (500A2), CD11c-FITC (HL3), CD45-V500 (30-F11) were from BD biosciences. ELISA kits for mouse KC, MCP-1, TNF and IL-6 were from R&D Systems. For western blot analysis, rabbit polyclonals against DOCK8 (#11622-1-AP; 1:750), MPP1 (#14715-1-AP; 1:500), ARPC3 (#14652-1-AP, 1:1,000), ATP6V1A (#17115-1-AP, 1:750), and Galectin-3 (LGALS3) (#14979-1-AP; 1:750) were from Proteintech. Anti-beta-actin antibody (AC-15, Sigma; 1:3,000), anti Cdc42 (4B3, Cytoskeleton; 1:500); goat anti-rabbit IgG, HRP-linked antibody (#7074, Cell Signaling; 1:1,000) and goat anti-mouse IgG (H+L), HRP-linked antibody (#170-6516, Bio-Rad; 1:1,000) were used. All flow cytometry analysis was done using FlowJo (v10).
Cell isolation, stimulation and culture. Peritoneal macrophages were obtained from the peritoneal lavage fluid of WT mice, resuspended in RPMI-1640 sup-plemented with 10% FCS and penicillin/streptomycin (pen/strep). Bone mar-row cells were collected from tibia and femur of WT and Dock8−/− mice and differentiated in RPMI-1640 with 10% FCS, pen/strep and 10% L929 condi-tioned medium for 7 d to generate BMDMs, or GM-CSF (20 ng/ml) for 8 d and 24 h with E. coli LPS (200 ng/ml) to generate BMDC. DOCK8 deficient precur-sor cell line and control cell lines were generated by HoxB8 induced conditional immortalization as previously described49. Briefly, bone marrow of Dock8−/− and WT mice was suspended in RPMI-1640 with 10 ng/ml IL-3, 20 ng/ml IL-6 and 1% supernatant of an SCF producing cell line for 2 d, followed by 5% FLT3 supernatant and 1 µM estradiol and spin infected with retrovirus encoding estrogen inducible ERHBD-HoxB8 (ref. 49). Mouse neutrophils were collected from peritoneal exudates of mice 4 h after thioglycollate treatment, purity >90% was confirmed by Giemsa-stained cytospins. RAW264.7 macrophages (ATCC TIB-71) were maintained in RPMI-1640 with 10% FCS and pen/strep.
Human neutrophils and monocytes were isolated from peripheral blood from healthy donors (after obtaining informed consent from all donors) via OptiPrep density gradient centrifugation (Axis-Shield). Human monocytes were differentiated into human monocyte-derived macrophages (hMDM) in RPMI-1640, 10% FCS, pen/strep and rhM-CSF (10 ng/ml) for 7 d. BMDM, PM, hMDM or RAW264.7 macrophages were allowed to adhere for 3 h before stimulation. Heme (hemin) and PPIX stocks for in vitro studies were prepared to 10 mM in DMSO, stored at −20 °C and used within 3 months. SnPPIX and hemoglobin stocks were prepared to 5 mM in PBS. All porphyrin and hemoglobin stimulations were done 15 min before the assay, unless otherwise indicated. Cell lines were routinely checked for Mycoplasma contamination.
Bone marrow transplant. Bone marrow chimeras were generated as described before50. Briefly, 8-week-old WT recipient mice were lethally irradiated and 5 × 10⁵ bone marrow cells from WT or Dock8−/− mice were retro-orbitally injected. 6 weeks later successful engraftment was verified using flow cytometry using the following gating strategy: neutrophils: CD11b+, Ly6G+; T-cells: CD11b−, CD3+, CD19−; B-cells: CD11b−, CD3−, CD19+; monocytes: CD11b+, Ly6G−; macrophages: CD3−, CD19−, F4/80+; DCs: CD3−, CD19−, F4/80−, CD11c+. Distinction between donor and recipient cells was assessed by CD45.1 or CD45.2 variant expression.
E. coli and sterile peritonitis models. Murine peritonitis was induced as pre-viously described50 Briefly, E. coli (strain PMV-1, serotype O18:K1)51,52 or its isogenic mutants (Supplementary Table 1) were cultured in Luria-Bertani medium and mice were infected via i.p. injection with ~104 colony-forming units (CFU) in 200 µl. Where indicated, mice received 100 µl i.p. of PBS, heme (25 µmol/kg body weight) or ammonium iron (III) citrate (25 µmol iron/kg body weight) 30 min before infection with E. coli. Heme stock solutions for in vivo administration were prepared by dissolving hemin to 5 mM in 0.2M NaOH, pH 7.5 and stored at −80 °C. Quinine-treated mice were given one dose (6-h end point) or two doses (16-h end point) 1 h before and 6 h after infection, respectively (60 mg/kg each dose). Serial dilutions of tissue samples were plated to enumerate viable bacteria. In survival studies mortality was monitored every 1 to 2 h. LPS endotoxemia was induced by i.p. injection of E. coli LPS (40 mg/kg). For thioglycollate peritonitis, mice were pretreated PBS or heme as described above before injection of 1ml 4% thioglycollate broth53 Blood and peritoneal lavage fluid were collected 6 h post-injection and cell influx into the peritoneal cavity was assessed on cytospin preparations stained with Giemsa, and via flow cytometry (LSRFortessa). Cells were gated on viable CD45+ cells and further gated as: neutrophils: Ly6G+ CD11b+, F4/80−, CD3−, CD19−, and macrophages: F4/80+, CD11b+, Ly-6G−, CD3−, CD19−.
L. monocytogenes infection model. Mice were infected by intraperito-neal injection of 106 CFU genetically optimized L. monocytogenes strain LO28InlA*54 The bacteria were prepared as previously described55. For detec-tion of bacterial loads (CFU assays), mice were sacrificed at the indicated time points, spleens were homogenized and plated on Oxford agar plates for 24 h at 37 °C.
Heme and total liver iron measurements. Plasma levels of heme were meas-ured using its pseudoperoxidase activity as described earlier56. Briefly, stand-ard dilutions and samples were diluted in PBS 1% BSA, incubated with TMB substrate and absorbance was measured at 450 nm. Additionally, concentration of standard dilutions was confirmed using the heme-chromogen method57, and calculated using Beer’s law57.
Total liver iron levels were measured as previously described58, with the fol-lowing modifications to detect total iron levels. Briefly, 100 µl (= 20 mg tissue) of liver homogenate were hydrolyzed at 65 °C with 50 µl TCA-HCl solution (16 h), and boiled 1 h at 120 °C to release heme. Clarified samples were incubated with sodium acetate, bathophenanthroline disulfonic acid and ascorbic acid solution for 5 min at 21–23 °C, absorbance was measured at 540 nm and iron concentration was calculated using [ ] ((( ) ))/(( ))Fe A A V MW e l ts b= − × × × × , (As: sample absorbance, Ab: blank absorbance, V: volume, MW: molecular weight of iron, e: milimolar absorptivity of bathophenanthroline disulfonic acid, l: path length and t: weight of tissue). Measured concentrations were verified against standard samples with known iron concentrations.
Cloning and bacteria. The E. coli dppC gene was deleted using a recom-bineering approach as described previously59. λ-RED plasmid pSIM8 was electroporated into E. coli (PMV-1) and the kanamycin resistance gene was PCR-amplified from E. coli TKC with the primer set DppC_Kan_For-DppC_Kan_Rev, with 45bp homology arms flanking the dppC gene. Amplicon was electroporated into induced PMV-1-pSIM8 E. coli. Correct substitution of dppC by nptII was verified by PCR using the primer set DppC_R1-_For-DppC_R1-_Rev. pSIM8 plasmid was cured and functional dppC deletion was verified by loss of heme-iron utilization (Supplementary Fig. 1j) generating ∆dppC::KanRE. coli. The hemolysin operon from E. coli CFT073 (ref. 60), including its upstream regulatory elements61, was PCR-amplified using primer set
© 2016 Macmillan Publishers Limited. All rights reserved.

nature immunology doi:10.1038/ni.3590
Hly_NotI_For-Hly_XhoI_Rev, double-digested with NotI-HF and XhoI and ligated to mini-Tn7 plasmid pGRG36 (ref. 62) to generate pRM24. pRM24 was electroporated into PMV-1 E. coli. Insertion of the hemolysin operon onto the E. coli attTn7 site was confirmed using the primer sets attTn7_Left_For-attTn7_Left_Rev and attTn7_Right_For-attTn7_Righ_Rev. the plasmid was cured to generate E. coli hlyABCD::attTn7 (see Supplementary Tables 1–3).
CRISPR-Cas9-mediated gene deletion. Mouse Mpp1 and Lgals3 genes were deleted in RAW264.7 macrophages using CRISPR-Cas9 system63. Briefly, Cas9 and sgRNA expressing plasmids were generated by digesting the pSpCas9(BB)-2A-Puro (pX459) vector63 with BbsI (New England Labs). Unphosphorylated oligos targeting exon 1 of Mpp1, (oligo pair Mpp1_del_For-Mpp1_del_Rev) or exon 2 of Lgals3 (oligo pair Lgals3_del_For-Lgals3_del_Rev) were annealed and ligated to linearized vector to generate pX459-Mpp1_exon1 and pX-459-Lgals3_exon2. Resulting plasmids were sequenced using the primer U6_CRISPR_Seq2 to verify the correct ligation of the vector and targeting oligos. RAW264.7 mac-rophages were plated overnight and transfected with 3.5 µg of each plasmid using Lipofectamine LTX with PLUS reagent (Life Technologies). Puromycin selection (7.5 µg/ml) was started 24 h after transfection, stopped 24 h. After 4–5 d, single-cell cultures were made and individual colonies picked after 10 d for sequencing (Mpp1_Seq and Lgals3_Seq). Lack of Mpp1 and Lgals3 expression was validated by WB.
In vitro bacterial growth assays. Bacteria were cultured in LB medium or minimal salts medium M63 at 37 °C or 32 °C (pSIM8) for the indicated times. LB medium was supplemented with DMSO, or heme plus deferoxamine (DFO) where indicated. M63 medium was supplemented with FeSO4 (1.8 µM), or 30 µM heme plus 200 µM 2,2’-bipyridyl (bip) to chelate residual iron. Bacteria were enumerated by plating serial dilutions on blood-agar plates.
Bacterial killing assay. Bacterial killing assays were performed as described earlier64 using adherent RAW264.7 macrophages (2.5 × 10⁵) that were incu-bated with mid-log phase E. coli PMV1 at MOI 80. Serial dilutions of lysates were plated on blood agar plates to quantify viable CFU, the percentage of killed bacteria was calculated: (CFU (t = 0 min) – CFU (t = x)).
Phagocytosis, efferocytosis assays. Phagocytosis and efferocytosis assays were done essentially as described earlier65. To assess bacterial phagocytosis, 2.5–5 × 10⁵ respective macrophage subsets were allowed to adhere for 3 h. 5 × 10⁵ human and mouse neutrophils were placed in round bottom tubes in RPMI-1640. All cells were pretreated with DMSO or heme (15 min) after which FITC-labeled heat-killed E. coli, S. pneumoniae or P. aeruginosa were added (MOI 100) and incubated at 37 °C for 0.5–1 h (except where indi-cated). For neutrophils, FITC-labeled E. coli PMV-1 were pre-opsonized with 15% autologous serum. Negative controls were incubated at 4 °C during the same period. Adherent macrophages were washed and incubated with proteinase K (50 µg/ml) at 4 °C to remove adherent bacteria, neutrophils were incubated with trypan blue to quench fluorescence of non-internalized bacteria. Uptake of bacteria was assessed via flow cytometry, the phagocytosis index was calculated as (MFI × % positive cells at 37 °C) minus (MFI × % positive cells at 4 °C).
Efferocytosis was assessed essentially as above and described earlier65 using RAW264.7 macrophages and CFSE-labeled apoptotic thymocytes (MOI 10) that were incubated at 37 °C for 1 h, and stained with CD11c-APC. Uptake of apoptotic cells was analyzed via flow cytometry (FACScalibur), and calculated as ( , ( ,MFI %CD11c CFSE cells at 37 C) MFI %CD11c CFSE cells at 4+ +× − ×+ + CC) . FITC-labeled bacteria and CFSE-labeled apoptotic cells were prepared as described earlier65.
For human whole blood phagocytosis assays, venous blood was collected from healthy donors into EDTA tubes and used as described66. Briefly, 100µl undiluted blood was placed in sterile 5-ml tubes and DMSO, heme or phenylhydrazine (125 µg/g) added for 15 min, followed by FITC-labeled E. coli (MOI 50) for 20 min. To assess the background FITC-fluorescence from non-internalized bacteria cytochalasin D was added (10 µM) to con-trol tubes. Erythrocytes were lysed using erythrocyte lysis buffer (Qiagen) and cells were stained with Alexa Fluor 700-CD11b andanalyzed via flow cytometry. Neutrophils and monocytes were identified as CD11b+, SSChigh and
CD11b+, SSClow cells, respectively. The phagocytosis index was calculated as ((MFI × % positive cells) minus (MFI × % positive cells from cytochalasin D treated tubes)).
To test the uptake of live L. monocytogenes, adherent BMDM were pre-treated with 10µM heme or DMSO for 15 min before adding live L. monocytogenes (MOI 10) for 1h, followed by gentamycin treatment to kill non-internalized bacteria. Cell lysates were plated on Oxford-Agar plates and the colonies counted the next day.
Confocal phagocytosis and binding assay. Phagocytosis was additionally measured using confocal microscopy. 5 × 10⁴ macrophages were seeded on 8-well chambers (µ-slide, Ibidi) and allowed to adhere overnight. The cells were treated with DMSO or heme for 15 min, and in some experiments pretreated for 45 min with mock (PBS) or quinine. FITC-labeled E. coli were added (MOI 100) at 37 °C for 1 h, negative controls (and for bacterial binding analysis) were kept at 4 °C. The cells were then washed, fixed with 4% paraformaldehyde, permeabilized with 1% BSA, 0.1% Triton X-100 and stained with DAPI (1 µg/ml, Sigma) and phalloidin (0.2 µg/ml) conjugated to either TRITC or Alexa Fluor 633. Where indicated, CellMask Orange was used at 0.5 µg/ml instead of phalloidin. Four to eight random fields per condition were imaged using a confocal microscope (LSM700, Zeiss) with a Plan-Apochromat 20×/0.8 M27 objective. Automatic image analysis was performed using the CellProfiler software67 (http://www.cellprofiler.org/) which was programed to: a) split images into DAPI, Phalloidin and FITC channels; b) load the channels into the pipeline and identify primary objects (nuclei, DAPI) using Otsu adaptive method with 2-class thresholding, mini-mized weighted variance and shape method to distinguish clumped objects; c) identify secondary objects (cytoplasm, TRITC or AF633) based on the primary objects (nuclei) identified before using the propagation method with 2-class Otsu global thresholding and minimized weighted variance; d) identify primary objects (bacteria, FITC) using the Otsu global method with 2-class thresholding; e) retrieve only the bacteria present within the cyto-plasm of cells. Primary and secondary objects touching the image borders are excluded from analysis. The level of phagocytosis is expressed as the number of internalized bacteria per cell.
In vivo phagocytosis assay. Phagocytosis was assessed in vivo as described ear-lier68. WT mice were treated i.p. with PBS or heme (25 µmol/kg body weight) 30 min before i.p. injection of heat-killed FITC-labeled E. coli (5 × 10⁷). Peritoneal lavage fluid was harvested 90 min later and exudate cells stained for flow cytometry (LSRFortessa). The percentage of FITC+ macrophages (F4/80+, CD11b+, Ly6G−, CD3−, B220−) was assessed as a measure of bacterial uptake and compared to background FITC+ B-cells (CD3−, CD11b−, Ly6G−, F4/80−, B220+).
Cell death and viability assays. Cell death was assessed via LDH release using the CytoTox 96 Non-Radioactive Cytotoxicity kit (Promega) accord-ing to instructions from the manufacturer. Cell viability was assessed via the neutral red assay69. Briefly, 7.5 × 10⁴ adherent RAW264.7 macrophages were treated with DMSO, heme or staurosporine (10 µM; positive control) in RPMI for the indicated time points and cell viability was calculated as the percentage of the DMSO control absorbance for each treatment and time point.
Affinity purification. Affinity chromatography using commercially available hemin-agarose was performed as reported previously70,71 using 10 mg RAW264.7 macrophage total cell lysate as protein input in duplicates. Control and heme-competed lysates (pre-incubated lysates with heme) were incubated with beads for 2 h at 4 °C. Beads were washed extensively with lysis buffer and bound proteins eluted with formic acid. After elution, enriched proteins were reduced with dithiothreitol, cysteine residues alkylated by incubation with iodoacetamide and the samples digested with modified por-cine trypsin (Promega). 3% (and multiples thereof) of the digested eluates were purified and concentrated by C18 reversed-phase material for subse-quent duplicate analysis by gel-free one-dimensional liquid chromatography mass spectrometry (1D-LCMS). Details of the LCMS methodology are as previously described72.
© 2016 Macmillan Publishers Limited. All rights reserved.
nature immunologydoi:10.1038/ni.3590
Protein identification. Peak extraction and conversion of RAW files into the MGF format for subsequent protein identification was performed with msconvert (ProteoWizard Library v2.1.2708). An initial database search was performed with broader mass tolerance to re-calibrate the mass lists for opti-mal final protein identification. For the initial protein database search, Mascot (www.matrixscience.com, version 2.3.02) was used. Error tolerances on the precursor and fragment ions were ±10 ppm and ±0.6 Da, respectively, and the database search limited to fully-tryptic peptides with maximum 1 missed cleavage, carbamidomethyl cysteine and methionine oxidation set as fixed and variable modifications, respectively. The Mascot peptide ion score threshold was set to 30, and at least 3 peptide identifications per protein were required. Searches were performed against the murine UniProtKB/SwissProt database (http://www.uniprot.org release 2012-05) including all protein isoforms.
The initial peptide identifications were used to deduce independent linear transformations for precursor and fragment masses that would minimize the mean square deviation of measured masses from theoretical. Re-calibrated mass list files were searched against the same murine protein database by a combination of Mascot and Phenyx (GeneBio, SA, version 2.5.14) search engines using narrower mass tolerances (±4 ppm and ±0.3 Da). One missed tryptic cleavage site was allowed. Carbamidomethyl cysteine was set as a fixed modification and oxidized methionine was set as a variable modifica-tion. To validate the proteins, Mascot and Phenyx output files were processed by internally-developed parsers. Proteins with ≥2 unique peptides above a score T1, or with a single peptide above a score T2 were selected as unam-biguous identifications. Additional peptides for these validated proteins with score > T3 were also accepted. For Mascot searches, the following thresholds were used: T1 = 14, T2 = 40 and T3 = 10; Phenyx thresholds were set to 4.2, 4.75 and 3.5, respectively (P < 10−3). The validated proteins retrieved by the two algorithms were merged, any spectral conflicts discarded and grouped according to shared peptides. A false discovery rate (FDR) of <1% for protein identifications and <0.1% for peptides (including the ones exported with lower scores) was determined by applying the same procedure against a database of reversed protein sequences.
Scoring of identified proteins. Analysis of heme-binding proteins identified by affinity purification and mass spectrometry was performed using the SAINT and CRAPome database bioinformatic tools32,33 using empty beads (E.B.) and heme beads, competed with free heme (H.B.C.) as controls. The probability distribution for the calculated CRAPome database scores was inverted to rep-resent the likelihood of each interactor being a contaminant. Gene ontology analysis (DAVID)73,74 was used to select a subset of heme-binding proteins involved in the regulation of the actin cytoskeleton, cell and plasma membrane shape, motility, phagocytosis, and related terms. The resulting list was used for network analysis of interactions using the STRING database v9.1 (ref. 34).
Automated chemical screen of phagocytosis. A panel of chemicals and drugs was tested using an automated high-throughput analysis of bacterial phagocytosis. Plate handling was performed using the cell::explorer platform (PerkinElmer). Briefly, 5 × 10³ RAW264.7 macrophages were seeded on 384-well clear-bottom plates (4ti-0201 Vision plate, 4titude), allowed to adhere over-night, and a panel of compounds was transferred using an acoustic dispenser (Echo 520, Labcyte) at a final concentration of 10 µM each and incubated for 3 h at 37 °C. Each condition was run in triplicates and each plate included 32 DMSO (compound) control wells. Each plate layout was prepared twice with one plate treated for 15 min with DMSO (heme control) and the other with 10 µM heme (see Supplementary Fig. 8a for details). FITC-labeled heat-killed E. coli were added (MOI 100) for 1 h at 37 °C, and washed twice to remove adherent bacteria. Then cells were fixed (4% PFA), permeabilized and stained with DAPI (1 µg/ml), phalloidin-TRITC (0.2 µg/ml) and imaged using automated fluorescence microscopy with a LUCPlanFLN 20× NA = 0.45 objective (Operetta, PerkinElmer) and 5 random fields per well were acquired. The Harmony software (PerkinElmer) was then programmed to ana-lyze each image by: a) Find nuclei in the DAPI channel using the M method; b) Find cytoplasm in the TRITC channel from the nuclei identified before using the A method; c) Find spots (bacteria) in the FITC channel within the cyto-plasm identified before using the A method; d) calculate the number of spots (bacteria) identified per cell. The phagocytosis (bacteria/cell) from each image
were compiled into matching wells and mean and median phagocytosis data from each compound was normalized to its respective plate control (DMSO or heme). The normalized values were log2 transformed to obtain the log2 fold change of phagocytosis induced by each compound in the presence of DMSO or heme. To score the tested compounds (C-Score), the following formula was employed:
log| log
2
21fold change(mean or median)fold change(mean or me
Heme+ ddian)DMSO |
The resulting C-Scores obtained from mean or median values of phagocyto-sis for each compound were plotted against each other to estimate the data noise (Supplementary Fig. 8b). Compounds with log2 mean fold change (over heme) of phagocytosis>0.75 and C-scores>0.5 were considered as significantly restoring phagocytosis. Additionally, compounds for which the C-scores differed by more than 30% from the calculated linear regression were excluded (Supplementary Fig. 8b).
Cdc42 activation assay. The activation of Cdc42 was assessed using the Cdc42 G-LISA Activation Assay (Colorimetric format) kit as indicated by the manu-facturer (#BK127, Cytoskeleton, Inc.). Briefly, adherent RAW264.7 or HoxB8 macrophages were serum-starved for 2 h before DMSO or heme was added for the indicated time points. Active Cdc42 signal was measured according to the instructions by the manufacturer and corrected for protein content.
Microscopy, image analysis and live cell imaging. For cell shape analysis, RAW264.7 macrophages, BMDM, human monocyte-derived macrophages and HoxB8 macrophages were seeded on 8-chamber slides (µ-slide, Ibidi) at a den-sity of 5 × 10⁴ per well and allowed to adhere overnight. The cells were washed twice with PBS and, where indicated, pretreated in RPMI with ML-141, CK666 or K216-0385 for 1 h, or N-acetyl-L-cysteine (NAC) for 30min. Where indi-cated, ML-141 was washed away after pretreatment and the cells were allowed 15 min to recover. The cells were then treated with DMSO, heme or bradykinin for 15 to 30 min. For calcium-influx experiments, the cells were treated with DMSO or heme for 15 min in DMEM or in DMEM lacking calcium (LifeTech). After stimulation, cells were fixed with 4% PFA and stained with DAPI (1 µg/ml) and phalloidin-FITC or phalloidin-TRITC (0.2 µg/ml). Four to eight random fields per well were acquired using a Zeiss LSM700 confocal micro-scope equipped with a Plan-Apochromat 20×/0.8 M27 objective. The images were loaded into the CellProfiler image analysis software and the pipeline was programmed to retrieve the cell shape parameters for the cell area, perimeter and form factor (circularity) as described earlier50. For three-dimensional cell reconstruction Z-stacks were acquired using a Zeiss LSM780 confocal microscope equipped with a Plan-Apochromat 100×/1.4 Oil DIC M27 objec-tive. Each slice was then deconvolved using Huygens Professional (Scientific Volume Imaging) and the corresponding theoretical point spread function. The deconvolved Z-stacks were then used to generate three-dimensional ani-mations of the cells using Huygens Professional SFP renderer module.
Live cell imaging of the actin cytoskeleton was performed using the LifeAct-GFP fusion construct75 to generate LifeAct-GFP positive RAW264.7 macro-phages (RAWLifeAct-GFP). These were plated at a density of 7.5 × 10⁴ cells/dish, allowed to adhere and stained with Hoechst 33258 (5 µg/ml). Immediately before time-lapse image acquisition, DMSO, heme or PPIX (10 µM) were added and cells were imaged every 25 s for 60 to 80 frames using a Zeiss LSM780 confocal microscope equipped with a Plan-Apochromat 40×/1.3 DIC M27 objective and an incubator chamber maintaining 37 °C and 5% CO2.
Migration assays. BMDM motility was assessed using a wound-healing (scratch) assay. WT BMDM were seeded to near confluency onto 12-well plates (5 × 10⁵ cells/well) and allowed to adhere for 3 h. The adherent confluent cell layer was scratched using a 10-µl pipette tip and the cells washed twice to remove the cell debris. The cells were treated for 15 min with DMSO or heme (3 to 30 µM) in RPMI-1640 and images of the scratches were collected at the indicated time points using phase-contrast on a DMI6000B inverted micro-scope (Leica) equipped with an N-Plan 10.0x-0.25 objective and a motorized xyz-stage. The images were loaded into CellProfiler software and image illu-mination correction functions were applied to each image. The intensity of the
© 2016 Macmillan Publishers Limited. All rights reserved.

nature immunology doi:10.1038/ni.3590
corrected images was normalized using ImageJ (v1.47) and the images loaded into the scratch assay analysis software TScratch76. The remaining open areas were used to calculate the percentage of the initial open area, which the cells occupy at the different time points.
Cell movement toward a chemokine gradient was performed on collagen gel matrices. Mature BMDC were treated with DMSO or heme at the indicated concentrations in RPMI-1640 and 1.2 × 10⁶ cells/ml were mixed with the col-lagen gel mix (1.6 mg/ml bovine collagen I, 3.5 mM NaHCO3 and 1× MEM final concentrations) at a ratio of 2:1. The gel mix containing the cells were introduced into custom-made migration chambers (2 mm thick) and incu-bated for 45 min to allow the gel to polymerize. The polymerized gel chambers were overlaid with CCL19 (250 ng/ml in RPMI-1640, 10% FCS, 1%P/S) and gel images for each condition were simultaneously taken every 2 min for 6 h using a Zeiss Axiovert 40 CFL inverted microscope equipped with cus-tom-built climate chambers (5% CO2, 37 °C, humidified). The image stacks were loaded into the FiJi image analysis software77 and individual cell move-ment was tracked using a custom plugin to calculate the cell migration index. Track coordinates were introduced onto Ibidi Chemotaxis and Migration tool (http://ibidi.com/software/chemotaxis_and_migration_tool/) to retrieve centered coordinates and track directionality. Math software R (https://www.r-project.org/) with ggplot2 package (https://cran.r-project.org/web/ packages/ggplot2/index.html) were then used to render both the track distance and wind rose plots.
Cell adhesion and rolling. Sterile Cellix Vena8 Endothelial+ Biochip cap-illaries were coated overnight with FNC coating mix (Athena enzyme). Immortalized human microvascular endothelial cells (G1S1) were seeded into each capillary and grown to confluence for 24 h at 37 °C under flow (400 µl/min) in EGM-2-MV medium containing 10ng/ml human TNF. Biochips were then attached to the Cellix Nanopump 2.0 and flushed with EGM-2-MV at 8 Dynes/cm2. 50 µl of DMSO- or heme-treated (15 min) human monocyte cell suspensions (3.5 × 10⁶/ml) were loaded into the biochips and images were acquired with an inverted microscope (Zeiss Axiovert 200M) equipped with a CCD camera (Zeiss Axiocam MRc5) every second for 2 min with an exposure time of 344ms. Image sequences were analyzed for cell adhe-sion and rolling with the cell-tracking tool of Image Pro Plus software.
PCR and western blot. PCR was performed using Taq DNA polymerase, dNTPack (Roche life sciences), High Fidelity PCR Enzyme Mix (Thermo scientific) or Phusion High-Fidelity DNA polymerase (Thermo Scientific) according to instructions from the manufacturers. Primer sequences are indi-cated in Supplementary Table 3. For western blot analysis, cell lysates were prepared in RIPA buffer, mixed 1:1 with 2× SDS sample buffer and boiled for 5 min at 99 °C. Cell lysates or pull-down eluates were resolved in polyacryla-mide gels, blotted onto PVDF membranes, and incubated overnight at 4 °C with anti-DOCK8, LGALS3, MPP1, ATP6V1A, ARPC3 antibodies (1:750), anti-CDC42 antibody (1:500) or anti-ACTB antibody (1:1,000), followed anti-rabbit IgG-HRP (1:1,000) or goat anti-mouse IgG (H+L)-HRP (1:3,000) and Amersham ECL Western Blotting Detection Reagent before developing. Some membranes were stripped using stripping buffer, washed and further stained as above.
Statistical analysis. Comparisons between groups were performed using unpaired, two-sided t-test for normally distributed data, or Mann-Whitney otherwise. For grouped comparisons, one-way or two-way ANOVA followed by Tukey’s multiple comparisons analysis were used where appropriate. Data correlation was assessed using the Pearson product-moment correlation coefficient. Sample sizes for in vivo experiments were calculated based on previous experience using the Power/sample-size calculator (http://www.stat.ubc.ca/~rollin/stats/ssize/n2.html). Statistically significant outliers were assessed using Grubb’s test (alpha = 0.05) and were excluded from analysis. Animal stud-ies were performed without prior randomization or blinding. Survival data was analyzed by Log rank (Mantel-Cox) test using GraphPad Prism v6.07 Software. Data is presented as mean ± s.e.m. except where indicated.
48. Gauvin, T.J., Fukui, J., Peterson, J.R. & Higgs, H.N. Isoform-selective chemical inhibition of mDia-mediated actin assembly. Biochemistry 48, 9327–9329 (2009).
49. Redecke, V. et al. Hematopoietic progenitor cell lines with myeloid and lymphoid potential. Nat. Methods 10, 795–803 (2013).
50. Matt, U. et al. WAVE1 mediates suppression of phagocytosis by phospholipid-derived DAMPs. J. Clin. Invest. 123, 3014–3024 (2013).
51. Sewnath, M.E. et al. IL-10-deficient mice demonstrate multiple organ failure and increased mortality during Escherichia coli peritonitis despite an accelerated bacterial clearance. J. Immunol. 166, 6323–6331 (2001).
52. Peris-Bondia, F., Muraille, E. & Van Melderen, L. Complete genome sequence of the Escherichia coli PMV-1 strain, a model extraintestinal pathogenic E. coli strain used for host-pathogen interaction studies. Genome Announc. 1, e00913–13 (2013).
53. Ploplis, V.A., French, E.L., Carmeliet, P., Collen, D. & Plow, E.F. Plasminogen deficiency differentially affects recruitment of inflammatory cell populations in mice. Blood 91, 2005–2009 (1998).
54. Kernbauer, E., Maier, V., Rauch, I., Müller, M. & Decker, T. Route of infection determines the impact of type I interferons on innate immunity to Listeria monocytogenes. PLoS One 8, e65007 (2013).
55. Stockinger, S. et al. Characterization of the interferon-producing cell in mice infected with Listeria monocytogenes. PLoS Pathog. 5, e1000355 (2009).
56. Huy, N.T. et al. An improved colorimetric method for quantitation of heme using tetramethylbenzidine as substrate. Anal. Biochem. 344, 289–291 (2005).
57. Schenkman, J.B. & Jansson, I. Spectral analyses of cytochromes P450. Methods Mol. Biol. 320, 11–18 (2006).
58. Grundy, M.A., Gorman, N., Sinclair, P.R., Chorney, M.J. & Gerhard, G.S. High-throughput non-heme iron assay for animal tissues. J. Biochem. Biophys. Methods 59, 195–200 (2004).
59. Sharan, S.K., Thomason, L.C., Kuznetsov, S.G. & Court, D.L. Recombineering: a homologous recombination-based method of genetic engineering. Nat. Protoc. 4, 206–223 (2009).
60. Mobley, H.L. et al. Pyelonephritogenic Escherichia coli and killing of cultured human renal proximal tubular epithelial cells: role of hemolysin in some strains. Infect. Immun. 58, 1281–1289 (1990).
61. Cross, M.A., Koronakis, V., Stanley, P.L. & Hughes, C. HlyB-dependent secretion of hemolysin by uropathogenic Escherichia coli requires conserved sequences flanking the chromosomal hly determinant. J. Bacteriol. 172, 1217–1224 (1990).
62. McKenzie, G.J. & Craig, N.L. Fast, easy and efficient: site-specific insertion of transgenes into enterobacterial chromosomes using Tn7 without need for selection of the insertion event. BMC Microbiol. 6, 39 (2006).
63. Ran, F.A. et al. Genome engineering using the CRISPR-Cas9 system. Nat. Protoc. 8, 2281–2308 (2013).
64. Knapp, S., Matt, U., Leitinger, N. & van der Poll, T. Oxidized phospholipids inhibit phagocytosis and impair outcome in gram-negative sepsis in vivo. J. Immunol. 178, 993–1001 (2007).
65. Sharif, O. et al. The triggering receptor expressed on myeloid cells 2 inhibits complement component 1q effector mechanisms and exerts detrimental effects during pneumococcal pneumonia. PLoS Pathog. 10, e1004167 (2014).
66. White-Owen, C., Alexander, J.W., Sramkoski, R.M. & Babcock, G.F. Rapid whole-blood microassay using flow cytometry for measuring neutrophil phagocytosis. J. Clin. Microbiol. 30, 2071–2076 (1992).
67. Carpenter, A.E. et al. CellProfiler: image analysis software for identifying and quantifying cell phenotypes. Genome Biol. 7, R100 (2006).
68. Gawish, R. et al. Triggering receptor expressed on myeloid cells-2 fine-tunes inflammatory responses in murine Gram-negative sepsis. FASEB J. 29, 1247–1257 (2014).
69. Repetto, G., del Peso, A. & Zurita, J.L. Neutral red uptake assay for the estimation of cell viability/cytotoxicity. Nat. Protoc. 3, 1125–1131 (2008).
70. Fernbach, N.V. et al. Acid elution and one-dimensional shotgun analysis on an Orbitrap mass spectrometer: an application to drug affinity chromatography. J. Proteome Res. 8, 4753–4765 (2009).
71. Huber, K.V. et al. Stereospecific targeting of MTH1 by (S)-crizotinib as an anticancer strategy. Nature 508, 222–227 (2014).
72. Maurer, M. et al. Combining filter-aided sample preparation and pseudoshotgun technology to profile the proteome of a low number of early passage human melanoma cells. J. Proteome Res. 12, 1040–1048 (2013).
73. Huang, W., Sherman, B.T. & Lempicki, R.A. Systematic and integrative analysis of large gene lists using DAVID bioinformatics resources. Nat. Protoc. 4, 44–57 (2009).
74. Huang, W., Sherman, B.T. & Lempicki, R.A. Bioinformatics enrichment tools: paths toward the comprehensive functional analysis of large gene lists. Nucleic Acids Res. 37, 1–13 (2009).
75. Riedl, J. et al. Lifeact: a versatile marker to visualize F-actin. Nat. Methods 5, 605–607 (2008).
76. Gebäck, T., Schulz, M.M., Koumoutsakos, P. & Detmar, M. TScratch: a novel and simple software tool for automated analysis of monolayer wound healing assays. Biotechniques 46, 265–274 (2009).
77. Schindelin, J. et al. Fiji: an open-source platform for biological-image analysis. Nat. Methods 9, 676–682 (2012).
© 2016 Macmillan Publishers Limited. All rights reserved.