hedge fund market insights - icapital network€¦ · hedge fund market insights. these guides...
TRANSCRIPT

Hedge Fund Market Insights
An overview of the evolution and importance of Hedge Fund strategies
March 2019


Unless otherwise noted, all the data contained herein is compiled by our data partner Preqin, as of Q4 2018.
Dear Network Member,
We are pleased to introduce our newest publications, iCapital’s Alternative Investments Compendium, Private Equity Market Insights, and Hedge Fund Market Insights.
We have developed these tools in response to advisors’ growing interest in exploring the private capital markets and hedge funds as they seek to diversify and grow their client’s portfolios – and, specifically, their interest in augmenting their understanding of the fundamentals of traditional alternative investments.
The Alternative Investments Compendium provides a current snapshot and the historical progression of key information that is essential for understanding these markets. This data includes returns, fundraising volume, dry powder, deal volume, valuation multiples, asset flows, and market volatility.
To provide broader context around the data and some historical perspective as to how these markets have evolved, we have produced Private Equity Market Insights and Hedge Fund Market Insights. These guides discuss the fundamental trends that are impacting investors, such as the profound shift in capital from public to private markets and the advantages of hedge fund strategies at various stages of the economic cycle.
Each quarter we will provide an update to the Compendium, along with our market perspectives, a summary of notable industry news, and commentary on significant changes in the underlying data, which has been provided by our partners Preqin and Hedge Fund Research, Inc.
At a time when the markets are volatile, valuations are high, and the alternative investments landscape is growing more complex, we believe advisors in our network will benefit from having a consistent source of relevant data and insights in their toolkit.
We hope you enjoy these new publications. As always, we welcome and value your feedback.
Lawrence Calcano Chief Executive Officer
Nick Veronis Co-Founder, Head of Research and Due Diligence

4
Global hedge fund assets increased once again in 2018, surpassing $3.0 trillion in aggregate capital for the first time. Over the trailing five years, hedge fund assets have increased by over $1.0 trillion as investors continually seek out investment strategies designed to protect against increasing market volatility. More recently, investors have also been
focusing on select hedge funds to help drive portfolio performance, following a nearly 10-year bull market in global equities.
Hedge Fund Assets Under Management - For the Period: 2013-2018
$-
$500
$1,000
$1,500
$2,000
$2,500
$3,000
$3,500
2013 2014 2015 2016 2017 2018
($bn
)
Source: Barclayhedge
Hedge Fund Industry: Total Assets Under Management
Hedge Funds

5
Insights on Hedge Funds
This increase in assets comes at a time when hedge funds – and active investing generally – have been under pressure as compared against U.S. equity index returns. While hedge funds have lagged long-only equities for much of the post-crisis period on an absolute returns basis, the average hedge fund return has tended to exceed that of a traditionally constructed global portfolio consisting of long-only equities and fixed income securities.
Comparative Performance - For the Period: 2013-2018
Source: Preqin, Evestment, Credit SuisseTraditional 60/40 Portfolio includes a 60% allocation to the MSWI World Index
and 40% to the Bloomberg Barclays Global Aggregate Bond Index
-10.0%
-5.0%
0.0%
5.0%
10.0%
15.0%
20.0%
12.7%
5.2%
7.7%
11.4%
16.6%
-3.2%
-5.1%
5.9%
2.2%
-1.3%
3.5%
14.7%
2013 2014 2015 2016 2017 2018
Average Hedge Fund Global 60/40 Portfolio
% o
f Ann
ual R
etur
ns
Hedge Funds vs. Traditional 60/40 Portfolio
...the average hedge fund return has tended to exceed that of a traditionally constructed global portfolio consisting of long-only equities and fixed income securities.
6
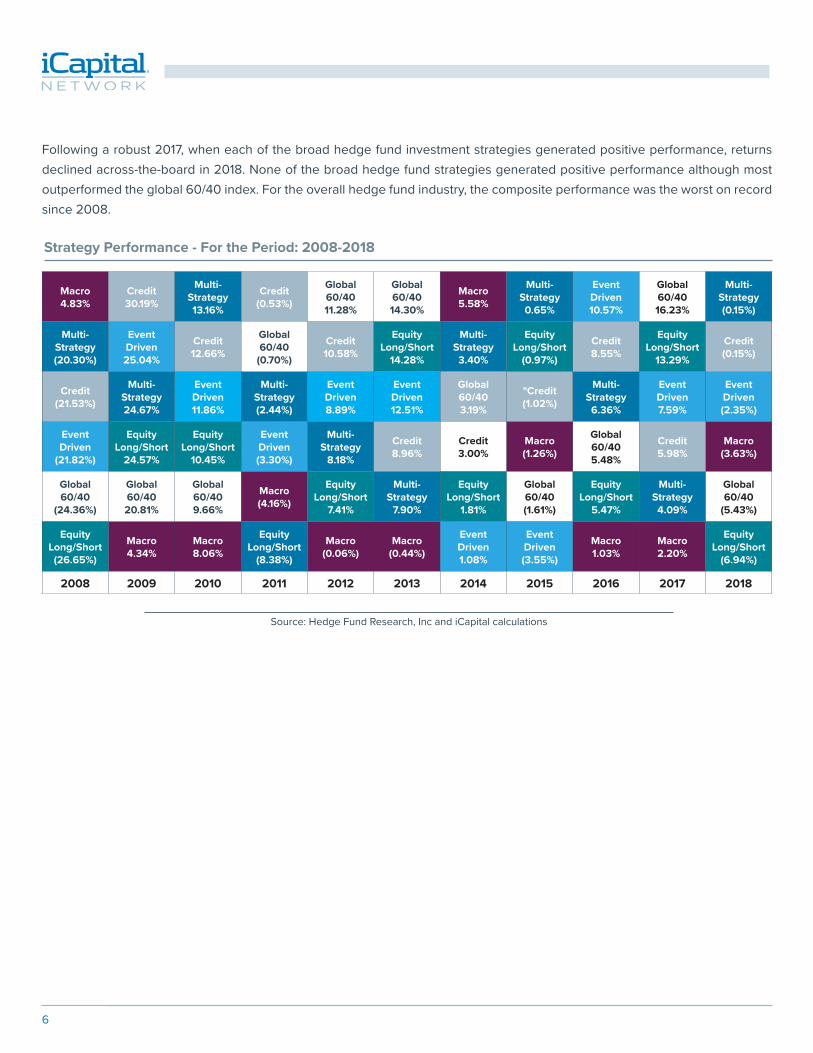
Following a robust 2017, when each of the broad hedge fund investment strategies generated positive performance, returns declined across-the-board in 2018. None of the broad hedge fund strategies generated positive performance although most outperformed the global 60/40 index. For the overall hedge fund industry, the composite performance was the worst on record since 2008.
Strategy Performance - For the Period: 2008-2018
Source: Hedge Fund Research, Inc and iCapital calculations
Macro 4.83%
Credit 30.19%
Multi- Strategy 13.16%
Credit (0.53%)
Global 60/40 11.28%
Global 60/40 14.30%
Macro 5.58%
Multi- Strategy 0.65%
Event Driven 10.57%
Global 60/40 16.23%
Multi- Strategy (0.15%)
Multi- Strategy (20.30%)
Event Driven 25.04%
Credit 12.66%
Global 60/40
(0.70%)
Credit 10.58%
Equity Long/Short
14.28%
Multi- Strategy 3.40%
Equity Long/Short
(0.97%)
Credit 8.55%
Equity Long/Short
13.29%
Credit (0.15%)
Credit (21.53%)
Multi- Strategy 24.67%
Event Driven 11.86%
Multi- Strategy (2.44%)
Event Driven 8.89%
Event Driven 12.51%
Global 60/40 3.19%
"Credit (1.02%)
Multi- Strategy 6.36%
Event Driven 7.59%
Event Driven (2.35%)
Event Driven
(21.82%)
Equity Long/Short
24.57%
Equity Long/Short
10.45%
Event Driven (3.30%)
Multi- Strategy
8.18%
Credit 8.96%
Credit 3.00%
Macro (1.26%)
Global 60/40 5.48%
Credit 5.98%
Macro (3.63%)
Global 60/40
(24.36%)
Global 60/40 20.81%
Global 60/40 9.66%
Macro (4.16%)
Equity Long/Short
7.41%
Multi- Strategy
7.90%
Equity Long/Short
1.81%
Global 60/40 (1.61%)
Equity Long/Short
5.47%
Multi- Strategy 4.09%
Global 60/40
(5.43%)
Equity Long/Short (26.65%)
Macro 4.34%
Macro 8.06%
Equity Long/Short
(8.38%)
Macro (0.06%)
Macro (0.44%)
Event Driven 1.08%
Event Driven (3.55%)
Macro 1.03%
Macro 2.20%
Equity Long/Short
(6.94%)
2008 2009 2010 2011 2012 2013 2014 2015 2016 2017 2018

7
Insights on Hedge Funds
Comparative Hedge Fund Performance - For the Period: 1990-2018
HFRI Fund Weighted Composite Index Bloomberg Barclays Global Agg. Bloomberg Barclays US Agg.
S&P 500 TR MSCI World-ND Global 60/40
$0.00
$2,000.00
$4,000.00
$6,000.00
$8,000.00
$10,000.00
$12,000.00
$14,000.00
$16,000.00
Jan 90 Jan 92 Jan 94 Jan 96 Jan 98 Jan 00 Jan 02 Jan 04 Jan 06 Jan 08 Jan 10 Jan 12 Jan 14 Jan 16 Jan 18
Hedge Fund Performance vs. Global Stocks and Bonds: 1990 to 2018
Grow
th o
f $1,0
00
Source: Hedge Fund Research Inc, Bloomberg, MSCI Inc, Standard & Poors, and iCapital calculations
Nevertheless, given the challenges facing traditional equities and fixed income in 2018,1 the long-term outperformance of a representative hedge fund as compared to U.S. and global stocks, bonds and a traditional “60/40” portfolio remains intact, with available data going back to 1990.2

8
Of course, referencing “hedge fund performance” as a single number presents myriad challenges, including the diverse mix of strategies, varying risk/return profiles and the post-crisis proliferation of “mega funds”.3 For instance, Hedge Fund Research (HFR) reports that the number of hedge funds in operation total 8,389.4 Additionally, HFR reports that the Largest 100 Hedge Funds collectively manage $1.75 trillion of the total $3.21 trillion in aggregate assets, representing 54% of total industry-wide assets. Stated another way, roughly 1%
of the hedge funds today manage over half of the industry's total assets under management. While a percentage of those Funds could undoubtedly benefit from increased scale – e.g., quantitatively-oriented, global multi-asset class firms that require more people and processing power – there are many more funds that struggle following a significant uptick in their asset base, particularly those with a focus on off-the-run, less liquid securities. These strategies very often benefit smaller and mid-sized funds, vs. their much larger peers.
Hedge Fund Industry - Concentration of Assets Under Management
Largest 100 Hedge Funds
Remaining 8,289 Hedge Funds
98.8%
1.2%
Source: Hedge Fund Research, Inc.
Largest 100 Hedge Funds
Remaining 8,289 Hedge Funds
54.0%
46.0%
Largest Hedge Funds:% of Total Number of Hedge Funds
Largest Hedge Funds:% of Total Industry Assets Under Management
...roughly 1% of the hedge funds today manage over half of the industry's total assets...

9
Insights on Hedge Funds
Hedge Fund Industry - Performance Dispersion - Interquartile Spreads & Median During 2018
5.27%
3.26%
6.19%
3.71%
6.65% 6.72%5.19%
-1.82%
-4.74%
1.96%
-0.22%1.27%
0.17% 0.22%
-10.89%
-14.03%
-0.78%
-10.27%
-5.73%
-7.80%
-4.24%
-20%
-15%
-10%
-5%
0%
5%
10%
All Strategies
Equity Strategies
Credit Strategies
Event DrivenStrategies
Macro Strategies
Multi-Strategy
RV Strategies
Net R
etur
ns
Source: Preqin, data for calendar year 2018
Another factor that makes the evaluation of “hedge fund performance” so challenging is the significant level of interquartile spread strategies. In 2018, for example, there was an approximately 16% differential between top quartile (+5%) and bottom quartile (-11%) funds performing funds based on HFRI data. Even those strategies that tend to have less dispersion, such as credit and relative value, saw the best-performing funds outperform the laggards by 6%-10% in 2018 alone. As is always the case with alternative investment strategies, manager selection is critically important.
Hedge funds show a "significant level of interquartile spread across strategies."

10
Comparative Performance: Active vs. Passive Strategies
Spread of 2-year Rolling Returns: HFRI Fund Weighted Composite Index - MSCI World Index (net dividends)
-25.00%
-20.00%
-15.00%
-10.00%
-5.00%
0.00%
5.00%
10.00%
15.00%
20.00%
25.00%
30.00%
Jan
92Oc
t 92
Jul 9
3Ap
r 94
Jan
95Oc
t 95
Jul 9
6Ap
r 97
Jan
98Oc
t 98
Jul 9
9Ap
r 00
Jan
01Oc
t 01
Jul 0
2Ap
r 03
Jan
04Oc
t 04
Jul 0
5Ap
r 06
Jan
07Oc
t 07
Jul 0
8Ap
r 09
Jan
10Oc
t 10
Jul 1
1Ap
r 12
Jan
13Oc
t 13
Jul 1
4Ap
r 15
Jan
16Oc
t 16
Jul 1
7Ap
r 18
Rolli
ng 2
-yea
r Ret
urns
(%)
Source: Hedge Fund Research Inc, MSCI Inc, and iCapital calculations
One contributing factor relating to the historical outperformance of actively managed hedge funds often corresponds with the level of interest rates. While the 4th quarter of 2018 represented the 10-year anniversary of the Global Financial Crisis, it also marked the first time in 10+ years that the Fed Funds Rate exceeded 2%, as referenced in the following chart. The primary challenge for hedged strategies in a low / zero interest rate environment is a lack of dispersion across stocks, bonds, and many investment securities. Essentially, most hedge fund strategies are not “short the market” – instead, they are effectively short correlation and long dispersion, meaning that an era of extremely high correlation and low dispersion is the worst environment for most hedged strategies. Throughout much of the post-crisis period, we saw an extended period of exceptionally high correlations (assets moving in near-lockstep) with historically low dispersions (narrower range of outcome). In such an
environment, long-only strategies have tended to outperform since most hedge fund strategies require some level of price dispersion, benefiting from lower correlations within and across asset classes globally. While the trailing ten years have been dominated by interventionist policies and various forms of quantitative easing, more recently we have seen a shift towards new return drivers and the performance of many hedged strategies has improved. From a fundamental perspective, at zero interest rates and ample market liquidity, the majority of global companies can easily refinance their debt and restructure their balance sheets, ostensibly “kicking the can down the road.” However, with higher rates and a tougher lending environment, the available options for lower quality companies diminish, which can lead to a widening gap in performance of individual investments across bonds, stocks, sectors, and global markets.
While the average hedge fund outperformed equity markets and a global “60/40” portfolio last year, performance was still generally disappointing for most active fund managers. Historically, actively managed hedge funds have tended to provide significant outperformance during the latter stages of an economic cycle. As shown in the following chart, the rolling 2-year returns of the HFRI Fund Weighted Composite Index surpassed the performance of the MSCI World Index in the early ’90s, in the early ’00s, and again in 2009 by an average of 20%, with relative underperformance more recently.5

11
Insights on Hedge Funds
Effective Federal Funds Rate - For the Period: 2008-2018
0.0%
2.5%
0.5%
1.0%
1.5%
20%.
2010 2011 2012 2013 2014 2015 2016 2017 2018 2019
Effe
ctiv
e Fe
dera
l Fun
d Ra
te (%
)
Effective Federal Funds Rate
Source: Board of Governors of the Federal Reserve System (US)
Another benefit for hedged strategies relates to changes in the macroeconomic cycle. For example, during the “peak/growth” phase the top-performing securities are very often long-only risk assets, e.g., stocks and high yield bonds. Compare that to the opportunity set as markets contract, when active management in relatively complex situations can lead to substantial outperformance over time in many event-driven and credit-based strategies.

12
Dynamic Changes in the Market Opportunity Set for Hedge Funds
Typically, the most robust Event-Driven strategy during the latter stages of an economic cycle is merger arbitrage, as companies look to grow strategically in anticipation of a decline in their organic growth prospects. As demonstrated on the chart below, deal activity for U.S. mergers remains relatively strong, albeit having contracted from its recent peak in 2015. Conversely, this compares to a dearth of opportunities for distressed specialists, with the default rate still hovering around half its long-term average and historically tight high-yield spreads. Even within specific hedge fund strategies such as Event Driven, the divergence of opportunities is often quite varied, particularly in the latter stages of an economic cycle.
Liquidation
Restructurings
Exchanges
Special Situations
Recapitalization
Reorganized equities
Leveraged Equities
Performing Yields
Liability Management
Restructuring
Developing M&A
Refinancings
Liability Management
Listings / IPOs
Reorganized Equities
Announced M&A
Recapitalizations
Refinancings
IPOs & Public Listings
CDS and Shorts
Stressed Yields
Covenant Breach
Amend & Extends
CDS and Shorts
Restructurings
TROUGH RECOVERY PEAKGROWTH CONTRACTION
Comparative Opportunity Set: Distressed v. Merger Arbitrage
# of Deals (right axis)Deal Equity Value ($mn)
$1,400,000
$1,200,000
$1,000,000
$800,000
$600,000
$400,000
$200,000
$0
300
250
200
150
100
50
01998 1999 2000 2001 2002 2003 2004 2005 2006 2007 2008 2009 2010 2011 2012 2013 2014 2015 2016 2017 2018
Deal
Equ
ity V
alue
($m
n)#
of Deals
Source: UBS and Bloomberg
For illustrative purposes only

13
Insights on Hedge Funds
The primary drivers for utilizing hedged strategies within a diversified portfolio are the increasing volatility in traditional equity markets, and investor expectations of future risk-adjusted equity performance. The increases in the Federal Funds rate over the past few years have demonstrated how the post-Financial Crisis era of zero-percent interest rates has come to an end. This policy shift has coincided with the end of quantitative easing strategies globally, and the Federal Reserve has initiated its process of actively seeking to reduce its balance sheet. This combination has resulted in rising investor concerns about a potential economic slowdown, and a reduction in investor expectations for future equity performance, leading to an uptick in global market volatility.
Federal Reserve: Balance Sheet Holdings
1-AUG-07 1-AUG-08 1-AUG-09 1-AUG-191-AUG-181-AUG-171-AUG-161-AUG-151-AUG-141-AUG-131-AUG-121-AUG-111-AUG-10
$0
$500,000
$1,000,000
$1,500,000
$2,000,000
$2,500,000
$3,000,000
$3,500,000
$4,000,000
$4,500,000
$5,000,000
Fede
ral R
eser
ve: B
alan
ce S
heet
Hol
ding
s ($
mn)
Source: Board of Governors of the Federal Reserve System (US)

14
Potential Increases Market Volatility
-1.00%
-0.50%
0.00%
0.50%
1.00%
1.50%
2.00%
2.50%
3.00%10
50
Jan-
92
Jan-
93
Jan-
94
Jan-
95
Jan-
96
Jan-
97
Jan-
98
Jan-
99
Jan-
00
Jan-
01
Jan-
02
Jan-
03
Jan-
04
Jan-
05
Jan-
06
Jan-
07
Jan-
08
Jan-
09
Jan-
10
Jan-
11
Jan-
12
Jan-
13
Jan-
14
Jan-
15
Jan-
16
Jan-
17
Jan-
18
Jan-
19
10 Year Minus 2 Year Spread3M Ave VIX, lagged 36 mos
3M A
ve V
IX10 Year M
inus 2 Year Spread (%)
Source: Board of Governors of the Federal Reserve System (US)
Though equity volatility has been compressed for much of the past ten years, multi-year periods of elevated volatility can be tied to factors such as global policy changes, market liquidity, investor sentiment, or security prices that can be seen as potential leading indicators. For example, the following chart depicts the “flattening yield curve”6 juxtaposed to the historical level of volatility, as measured by the VIX Index. This highlights the historical relationship of a narrowing spread between the short and long-end of the Treasury curve as a leading indicator of increasing equity market volatility. Assuming that the spread between short and long-duration bonds remains relatively tight, one can expect the recently realized increase in market volatility to remain a factor that advisors must consider when constructing and adjusting client portfolios.

15
Insights on Hedge Funds
Primary Investor Concerns for 2019
Most Concerning
% of Respondents
Average Rank (1-7)
Least Concerning
Continued lack of alpha generation(41% ranked #1, but 20% ranked as #6 or 7)
Economic cycle turning(61% ranked as #1, 2, or 3)
Lack of market liquidity(54% ranked as #1, 2, or 3)
Concerns of a credit crisis(28% ranked as #1, or 2, but 18% ranked as #6 or 7)
Earnings growth slowdown(38% ranked as #1, 2, or 3)
Trade war continuing(54% ranked as #5, 6, or 7)
Lack of companies going public(93% ranked as #6 or 7)
#1
#2
#3
#4
#5
#6
#7
3.0
3.1
3.4
3.8
3.9
4.2
6.6
Source: Morgan Stanley 4Q18 Prime Brokerage Investor Survey
There is no shortage of factors to keep investors on “high alert” these days including, changes in the global economy, heightened volatility in equity markets, and a lack of alpha generation amongst certain alternative strategies, particularly during periods of elevated asset class correlations. Looking ahead, Advisors must remain vigilant in providing their clients with access to diversified sources of return, portfolio diversification, and consistent wealth preservation. Complementary hedge fund strategies can provide access to each of those portfolio objectives, ideally executed through a combination of (i) smaller or larger funds, (ii) sector specialists or multi-asset generalists, (iii) fundamental or quantitative techniques, and (iv) long-only or long/short investment strategies. Through pre-defining each hedge fund investment’s long-term role in a diversified portfolio - and choosing the best strategy and style for its primary objective - Advisors can beneficially utilize multiple hedge fund investments to improve the overall quality of the clients’ portfolios.
From an Allocator Perspective, What are your Investment Concerns of 2019?

16
END NOTES1The MSCI World Index was down (8.7%) in 2018, and the Bloomberg Barclays Global Aggregate Bond Index was down (1.2%). Source: Evestment2As referenced by the HFRI Fund Weighted Composite Index3Hedge funds with at least $5 billion in assets under management4Source: Hedge Fund Research, Inc. As of Sep. 30th, 20185 For the 2-year period ending Dec. 31st, 2018 the HFRI Fund Weighted Composite Index underperformed the MSCI World index by less than 4%6As measured by the yield of the 10-year U.S. Treasury Bond minus the yield on the 2-year Treasury Note
Joseph Burns Managing Director, Research and Diligence
Aref Jessani Senior Vice President, Research and Diligence

IMPORTANT INFORMATION/DISLAIMERThis material is provided for informational purposes only and is not intended as, and may not be relied on in any manner as legal, tax or investment advice, a recommendation, or as an offer to sell, a solicitation of an offer to purchase or a recommendation of any interest in any fund or security offered by iCapital. Past performance is not indicative of future results. Alternative investments are complex, speculative investment vehicles and are not suitable for all investors. An investment in an alternative investment entails a high degree of risk and no assurance can be given that any alternative investment fund’s investment objectives will be achieved or that investors will receive a return of their capital. The information contained herein is subject to change and is also incomplete. This industry information and its importance is an opinion only and should not be relied upon as the only important information available. Information contained herein has been obtained from sources believed to be reliable, but not guaranteed, and iCapital Network assumes no liability for the information provided.
This information is the property of iCapital Network. No part of this material may be reproduced in any form, or referred to in any other publication, without express written permission.
Products offered by iCapital are typically private placements that are sold only to qualified clients of iCapital through transactions that are exempt from registration under the Securities Act of 1933 pursuant to Rule 506(b) of Regulation D promulgated thereunder (“Private Placements”). An investment in any product issued pursuant to a Private Placement, such as the funds described, entails a high degree of risk and no assurance can be given that any alternative investment fund’s investment objectives will be achieved or that investors will receive a return of their capital. Further, such investments are not subject to the same levels of regulatory scrutiny as publicly listed investments, and as a result, investors may have access to significantly less information than they can access with respect to publicly listed investments. Prospective investors should also note that investments in the products described involve long lock-ups and do not provide investors with liquidity.
Securities may be offered through iCapital Securities, LLC, a registered broker dealer, member of FINRA and SIPC and subsidiary of Institutional Capital Network, Inc. (d/b/a iCapital Network). These registrations and memberships in no way imply that the SEC, FINRA or SIPC have endorsed the entities, products or services discussed herein. iCapital and iCapital Network are registered trademarks of Institutional Capital Network, Inc. Additional information is available upon request.
© 2019 Institutional Capital Network, Inc. All Rights Reserved.

18