heavy metal content in soil reclaimed from a municipal solid waste landfill
TRANSCRIPT

www.elsevier.com/locate/wasman
Waste Management 25 (2005) 25–35
Heavy metal content in soil reclaimedfrom a municipal solid waste landfill
Pradeep Jain, Hwidong Kim, Timothy G. Townsend *
Department of Environmental Engineering Sciences, University of Florida, P.O. BOX 116450, Gainesville, FL 32611-6450, USA
Accepted 13 August 2004
Abstract
Residues reclaimed from a municipal solid waste (MSW) landfill were characterized for the concentrations of a number of heavy
metals. The residue fractions analyzed included a fine fraction (<0.425 mm), an intermediate fraction (>0.425 and <6.3 mm) and a
fraction consisting of paper products that could ultimately degrade to a smaller size. The intermediate fraction appeared to be
organic in nature, while the fine fraction was more soil-like. In general, the metal concentrations were greatest in the intermediate
fraction and lowest in the fine fraction. The effect of sample age on the elemental content was also investigated. The concentrations
of several elements were greater in older samples (sample �8 years in age) when compared to newer samples (sample �3 years in
age). Limitations associated with the land application of residual soil (composed of the fine and intermediate fractions) were assessed
by comparing measured concentrations to regulatory threshold values. In general, most metal concentrations were below regulatory
thresholds for use in unrestricted settings. At the concentrations measured, however, several elements might limit reuse options,
depending on which regulatory threshold serves as a benchmark. Elevated concentrations of arsenic presented the greatest limitation
with respect to common US thresholds while elevated cadmium concentrations presented the greatest limitation when compared to
UK thresholds. The source of the arsenic was determined to be the waste, not the cover soil.
� 2004 Elsevier Ltd. All rights reserved.
1. Introduction
Municipal solid waste (MSW) landfill reclamation is
the mining of landfills to recover metal, glass, plastic
and other combustibles, soil, and the landfill volume it-
self (Morelli, 1990). Approximately 55% of the MSW
generated in the United States is landfilled annually(US EPA, 2002). Although the number of landfills is
decreasing, the capacity has remained relatively constant
because newer landfills are much larger than those built
previously (US EPA, 2002). With the inception of biore-
actor operation to promote rapid stabilization of the
landfilled waste, the MSW landfill has been promoted
as a potential biochemical waste treatment unit rather
0956-053X/$ - see front matter � 2004 Elsevier Ltd. All rights reserved.
doi:10.1016/j.wasman.2004.08.009
* Corresponding author. Tel.: +1 352 392 0846; fax: +1 352 392
3076.
E-mail address: [email protected] (T.G. Townsend).
than a mere waste storage facility (Morelli, 1990; Spen-
cer, 1990; Magnuson, 1991; Reinhart and Townsend,
1997). While landfill reclamation was originally con-
ceived as a method to address groundwater contamina-
tion problems at old, unlined landfills, it has been
proposed as a potentially integral part of future bioreac-
tor landfills (Nelson, 1994; Reinhart and Townsend,1997). Reclaiming stabilized waste offers potential eco-
nomic benefits for landfill operators through the crea-
tion of additional disposal capacity.
The major end product from the treatment of waste
in a bioreactor landfill, in addition to landfill gas, is
the stabilized residual material. The stabilized residual
materials consist of soil, medium-sized residue and over-
sized residue. Major components of the oversized resi-due fraction include plastic, metals, wood, leather and
rubber. The cover soil and degraded organic waste have
been reported to constitute �75% of the recovered

26 P. Jain et al. / Waste Management 25 (2005) 25–35
material (US EPA, 1997a). Potential reuse options for
the recovered soil include use as daily and intermediate
landfill cover material and as construction fill (US
EPA, 1997a). A number of other end uses may be pos-
sible, dictated by available markets, the quality of the
material, and the regulatory framework for reuse. Thequality issue that would most likely limit its use would
be the presence of trace amounts of hazardous chemicals
(Reinhart and Townsend, 1997). It is likely that most of
the organic chemicals will eventually be destroyed in the
biochemical environment of the landfill (Field et al.,
1995; Reinhart and Townsend, 1997; Atuanya et al.,
2000; Cohen and Speitel, 2001). Contaminants such as
heavy metals, however, will remain in the waste unlessleached out. Several investigations indicate that the
migration of heavy metals is very low during the first
decades after deposition compared to the accumulated
amount (Finnveden, 1996). Several attenuating mecha-
nisms that limit the mobility of metals in the landfill
have been shown to exist (Gould et al., 1990). More than
90% of non-metals and more than 99.9% of metals are
reported as still found in the residual solids at the begin-ning of the humic phase (Belevi and Baccini, 1989; Boz-
kurt et al., 1999).
Before stabilized materials reclaimed from a landfill
are land applied, they should be characterized for heavy
metals of environmental concern. Stabilized residues
from a MSW test cell in Sweden were characterized
for heavy metals (Flyhammar et al., 1998). Hg levels
in stabilized residues from a MSW landfill in US havebeen reported (Earle et al., 1999). Residues passing
through 19.1- and 9.5-mm screens from an aerobic bio-
reactor test cell in Georgia, US, were characterized for
metals (Das et al., 2002). The results of these studies
are limited because only a small number of samples were
used to characterize the reclaimed material, which is
very heterogeneous in nature. Moreover, the studies fo-
cused on a limited number of elements. There is need fora more comprehensive characterization of heavy metals
in residual material recovered from MSW landfills in the
United States. In addition to the opportunities presented
as a result of bioreactor operations, the difficulty in sit-
ing new landfills will push municipalities to explore the
possibility of mining old, unlined landfills to create
new disposal capacity. The disposition of the reclaimed
soils will have an impact of the feasibility of such efforts.The primary objective of this study was to character-
ize reclaimed residues from a MSW landfill in Florida in
terms of heavy metals. The human health risk associated
with land application of reclaimed residual soil was as-
sessed by comparing results to typical ‘‘risk-based’’ stan-
dards or guidelines for heavy metals in soils developed in
the US and Europe (US EPA, 1996; MHSPE, 2000; DE-
FRA and Environment Agency, 2002). A secondaryobjective was to investigate the impact of the age of
waste on metal concentrations in reclaimed residues.
2. Materials and methods
2.1. Site description
The Alachua County Southwest Landfill (ACSWL) is
located in north central Florida. The site consists of anumber of landfill units, including an 11-ha (27-acre)
composite-lined unit that began receiving waste in
1988. Approximately 270 metric tons per day of waste
were deposited in the lined unit between 1988 and
1998. A sandy soil was used as daily and intermediate
cover at the site. A detailed description of the landfill
unit can be found elsewhere (Townsend et al., 1995).
In 1990, an infiltration pond leachate recirculation sys-tem was constructed and operated for 28 months in a
section of the lined landfill to examine the effects of
leachate addition on landfill stabilization (Townsend et
al., 1996). In 1993, leachate was recirculated using 11
horizontal injection lines in a section adjacent to the
leachate recirculation pond to evaluate the performance
of horizontal injection lines for leachate recirculation
(Townsend and Miller, 1998). Hg levels in stabilizedresiduals from part of this landfill unit and an adjacent
unlined section have been reported (Earle et al., 1999).
Gas extraction wells were constructed with 20-cm (8-
in.) perforated PVC pipe and installed after the landfill
closed. The wells were drilled with a 75-cm (30-in.) buck-
et auger. During the process of drilling holes for gas
wells, samples were collected at 1.5 m (5 ft) intervals
to a maximum depth of 18 m (60 ft). Sample sizes ran-ged from 10 to 20 kg. A total of 128 solid waste samples
were collected from nineteen gas wells. Eighty-nine sam-
ples from fourteen wells were processed and analyzed
for metals. Each sample was double-bagged with large
plastic trash bags, excess air was squeezed from the
bags, and both bags were individually tied. All samples
were transported to the laboratory where they were fro-
zen until analysis. Sample ages were estimated fromlandfill records of waste placement.
2.2. Sample processing
Because of their heterogeneous nature, waste samples
required processing prior to analyses. Fig. 1 schemati-
cally illustrates the sample-processing scheme. The mois-
ture content of each sample was measured by drying theentire sample at 105 �C for 24–48 h, depending on the
time needed for the sample to reach a constant weight.
After drying, some of the samples were combined to re-
duce sample-processing time. Samples from consecutive
depth locations of a gas well were combined to create
composite samples for intervals of 3.3–5 m (10–15 ft).
Samples were combined only if moisture contents were
within ±10% and the samples were similar in appearance(an indicator of sample age). The process of combining
samples resulted in 78 samples. Samples were then size-

Drying sample
Screening(50 mm, 12.5 mm, 6.3 mm and
0.425 mm)
Retained material(on 50 mm, 12.5 mm and
6.3 mm screen)
Intermediate fraction(I)
(< 6.3 and >0 .425 mm screen)
Fine fraction (F)(< 0.425 mm screen)
Fine picking and sample characterization
Glass andCeramics
Yard WasteMetal/Stone
Biodegradable(mainly paper)(B)
Plastic
Textile
Weighing each fraction for mass balance
Grinding(to 0.76-mm
size)
B I F
Used for analysis
Fig. 1. Sample processing scheme.
P. Jain et al. / Waste Management 25 (2005) 25–35 27
separated using a shaker table with sieves of sizes 50,
12.5, 6.3 and 0.425 mm. The 50, 12.5 and 6.3 mm sieve
sizes were selected based on reported typical screen sizes
used for landfill reclamation (Reinhart and Townsend,
1997). The 0.425-mm screen was selected based on the
results of study conducted by Miller et al. (1996), who
reported that a 0.42-mm sieve allowed most of the coversoil to pass through (�99%) while retaining a majority
of the biodegradable material.
Sample fractions retained on the 50, 12.5 and 6.3 mm
sieves were manually separated into the following six
different categories: (i) paper; (ii) plastic; (iii) yard
waste; (iv) glass and ceramics; (v) textiles; (vi) stone/me-
tal. Only 25% of the sample (by weight) retained on the
12.5- and 6.3-mm sieves was used for the componentcategorization exercise. Each component was weighed.
Representative samples were collected for the fraction
that passed through the 0.425-mm sieve, referred to
herein as the fine fraction; the fraction retained on the
0.425-mm sieve, referred to as the retained or intermedi-
ate fraction; and the fraction consisting of paper and
paper products greater than 6.3 mm size, referred herein
as the paper fraction. The paper fraction (in addition to
the fine and retained fractions) was characterized formetals as this might ultimately degrade and become part
of the screened residue of a reclamation activity. The
intermediate and paper fractions were ground using a
2200-W Pulverisette, manufactured by Fritsch (Ger-
many). All three fractions of each sample were refriger-
ated. The sample processing scheme used in this study
was very similar to one reported by Miller et al.
(1996) that was also used by Earle et al. (1999) for inves-tigating Hg levels in MSW samples collected from the
same site.
28 P. Jain et al. / Waste Management 25 (2005) 25–35
2.3. Sample analyses
All three fractions (fine, intermediate and paper frac-
tion) were analyzed for Ag, Al, As, Ba, Be, Cd, Co, Cr,
Cu, Fe, Hg, Mn, Ni, Pb, Se, V and Zn. Total recover-
able concentrations for all metals except mercury weremeasured using hot plate digestion with nitric acid fol-
lowing method 3050B (US EPA, 1995). Arsenic was
analyzed using a Perkin–Elmer 5100 graphite furnace
atomic absorption spectrometer (GFAA), equipped
with Zeeman correction, following method 7060A (US
EPA, 1995). Samples with high metal concentrations
were diluted to fit within the linear region of the calibra-
tion curve. All other metals except Hg were analyzedusing inductively coupled plasma atomic emission spec-
trometer (ICP-AES), Model 36 Thermo Elemental Inc.,
following method 6010B (US EPA, 1995). The total Hg
concentrations in the three fractions were measured
using the cold-vapor atomic absorption technique, fol-
lowing method 7471 of SW-846 (US EPA, 1995).
Quality assurance and quality control procedures in-
cluded calibration checks, duplicates, blanks and samplespikes. Approximately 5% of the samples were digested
in duplicate and spiked in duplicate to assess the preci-
sion and accuracy of the analytical procedures.
3. Results and discussion
3.1. Sample composition
The moisture content of all 128 samples was mea-
sured. After combining some of the samples to reduce
the sample processing time, a total of seventy-eight sam-
ples were processed for component characterization.
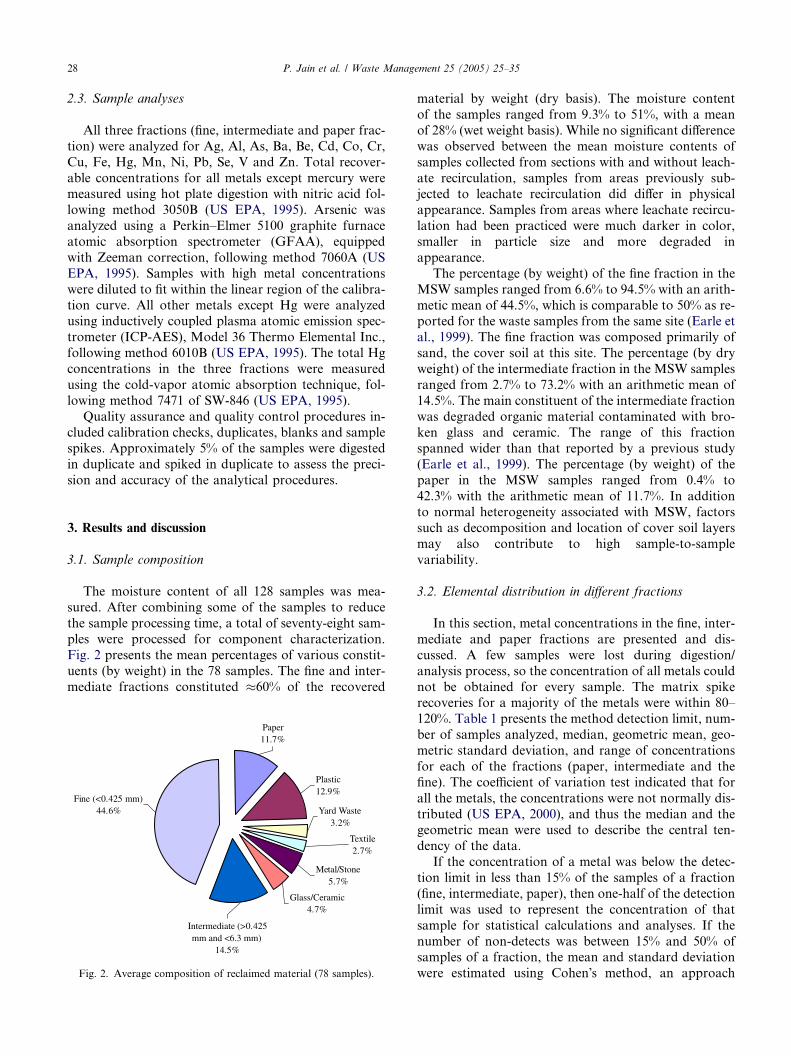
Fig. 2 presents the mean percentages of various constit-
uents (by weight) in the 78 samples. The fine and inter-
mediate fractions constituted �60% of the recovered
Fine (<0.425 mm)44.6%
Intermediate (>0.425mm and <6.3 mm)
14.5%
Plastic12.9%
Paper11.7%
Glass/Ceramic4.7%
Metal/Stone5.7%
Textile2.7%
Yard Waste3.2%
Fig. 2. Average composition of reclaimed material (78 samples).
material by weight (dry basis). The moisture content
of the samples ranged from 9.3% to 51%, with a mean
of 28% (wet weight basis). While no significant difference
was observed between the mean moisture contents of
samples collected from sections with and without leach-
ate recirculation, samples from areas previously sub-jected to leachate recirculation did differ in physical
appearance. Samples from areas where leachate recircu-
lation had been practiced were much darker in color,
smaller in particle size and more degraded in
appearance.
The percentage (by weight) of the fine fraction in the
MSW samples ranged from 6.6% to 94.5% with an arith-
metic mean of 44.5%, which is comparable to 50% as re-ported for the waste samples from the same site (Earle et
al., 1999). The fine fraction was composed primarily of
sand, the cover soil at this site. The percentage (by dry
weight) of the intermediate fraction in the MSW samples
ranged from 2.7% to 73.2% with an arithmetic mean of
14.5%. The main constituent of the intermediate fraction
was degraded organic material contaminated with bro-
ken glass and ceramic. The range of this fractionspanned wider than that reported by a previous study
(Earle et al., 1999). The percentage (by weight) of the
paper in the MSW samples ranged from 0.4% to
42.3% with the arithmetic mean of 11.7%. In addition
to normal heterogeneity associated with MSW, factors
such as decomposition and location of cover soil layers
may also contribute to high sample-to-sample
variability.
3.2. Elemental distribution in different fractions
In this section, metal concentrations in the fine, inter-
mediate and paper fractions are presented and dis-
cussed. A few samples were lost during digestion/
analysis process, so the concentration of all metals could
not be obtained for every sample. The matrix spikerecoveries for a majority of the metals were within 80–
120%. Table 1 presents the method detection limit, num-
ber of samples analyzed, median, geometric mean, geo-
metric standard deviation, and range of concentrations
for each of the fractions (paper, intermediate and the
fine). The coefficient of variation test indicated that for
all the metals, the concentrations were not normally dis-
tributed (US EPA, 2000), and thus the median and thegeometric mean were used to describe the central ten-
dency of the data.
If the concentration of a metal was below the detec-
tion limit in less than 15% of the samples of a fraction
(fine, intermediate, paper), then one-half of the detection
limit was used to represent the concentration of that
sample for statistical calculations and analyses. If the
number of non-detects was between 15% and 50% ofsamples of a fraction, the mean and standard deviation
were estimated using Cohen�s method, an approach

Table 1
Metal concentrations in three fractions of stabilized MSW (mg/kg dry basis)
Detection limit Fine Intermediate Paper
Number of
samplesaMedian GM ± GSDb Range Number of
samplesaMedian GM ± GSDb Range Number of
samplesaMedian GM ± GSDb Range
Alc 0.004 77(77) 3.5 4.5 ± 0.0 1.9–76.1 78(78) 10.3 12 ± 0.0 2.5–169 78(78) 7.9 7.8 ± 0.0 1.7–39.3
Ag 1.5 77(19) 1.5e – <1.5–23.8 78(20) 1.5e – <1.5–24.6 78(16) 1.5e – <1.5–37.3
As 0.2 77(77) 1.5 1.4 ± 2.3 0.2–10.1 76(76) 4.2 4.5 ± 2.1 1.1–58.6 74(74) 4.3 5.2 ± 3.1 0.5–188
Ba 0.4 77(77) 16.1 18.3 ± 1.9 8.2–70 78(78) 50.8 54.1 ± 1.9 13.8–681 78(78) 37.3 38.6 ± 1.7 16.1–360
Be 0.1 77(17) 0.1e – <0.1–0.3 78(37) 0.1e – <0.1–0.8 78(15) 0.1e – <0.1–0.4
Cd 0.3 77(55) 0.6 0.5 ± 3.7 d <0.3–13.8 78(72) 1.8 1.9 ± 2.7 <0.3–40 78(74) 1.0 1.2 ± 2.7 0.3–90
Co 0.5 77(43) 0.7 0.6 ± 3.1d <0.5–32.9 78(77) 2.6 2.9 ± 2.2 <0.5–86.7 78(74) 1.7 1.9 ± 2.2 <0.5–45.2
Cr 0.9 77(77) 8.6 9.5 ± 2.2 2.5–151 78(78) 39.4 44.0 ± 2.1 9.5–531 78(78) 23.9 24.7 ± 1.9 5.8–187
Cu 0.7 77(76) 16.9 16.9 ± 3.2 0.7–170 78(78) 89.7 105 ± 3.1 5.8–5530 78(78) 47.2 52.9 ± 2.0 12.5–352
Fec 0.002 77(77) 3.0 3.2 ± 0.0 0.8–28.2 78(78) 14.8 14.6 ± 0.0 4.6–61.8 78(78) 5.1 5.6 ± 0.0 1–51.5
Hg 0.04 75(75) 0.1 0.13 ± 2.87 <0.04–1.8 74(74) 0.2 0.24 ± 3.33 0.04–9.0 71(71) 0.1 0.16 ± 2.66 0.04–1.7
Mn 0.6 77(77) 47.8 44.2 ± 3.0 6.2–993 78(78) 181 209 ± 2.6 50.4–14700 78(78) 78.0 93.5 ± 1.8 35.7–457
Ni 0.8 77(77) 5.0 5.0 ± 2.8 0.8–340 78(78) 18.8 21.2 ± 2.2 6.4–743 78(78) 10.7 11.7 ± 2.4 2.1–491
Pb 2 77(68) 9.0 10.8 ± 3.4 <2.0–297 78(71) 25.5 26.6 ± 4.8 <2.0–3250 78(56) 9.3 5.9 ± 7.9d <2.0–627
Se 2.5 77(49) 4.2 3.7 ± 2.5d <2.5–16.1 78(46) 3.0 3.1 ± 2.7d <2.5–103 78(16) 2.5e – <2.5–13.6
V 0.5 77(77) 2.9 3.1 ± 1.6 1.2–12.3 78(78) 9.7 9.7 ± 1.5 4.1–35.2 78(78) 5.7 5.9 ± 1.7 2.2–20.2
Zn 1.3 77(77) 140 126 ± 2.9 12.8–875 78(78) 536 582 ± 2.6 37.4–7420 78(78) 280 288 ± 2.0 70.5–3660
a Number in the parenthesis is the number of samples with concentration above the detection limit.b GM = geometric mean, GSD = geometric standard deviation.c Concentrations and detection limit in g/kg.d Geometric mean and standard deviation estimated using Cohen�s method.e Median is equal to detection limit because more than 50% of the samples are below detection limit.
P.Jain
etal./Waste
Managem
ent25(2005)25–35
29

30 P. Jain et al. / Waste Management 25 (2005) 25–35
often used for statistical analysis of environmental sam-
ples (US EPA, 2000). If the number of non-detects ex-
ceeded 50% of the samples, then the detection limit is
reported as the median, and the geometric mean and
standard deviation are not reported.
The concentration of all the metals varied over a widerange. More than 50% of samples of all three fractions
contained Ag and Be at concentrations below detection.
Se was below detection in about 40% of the fine fraction
samples, in more than 40% of the intermediate fraction
and in 80% of the paper fraction samples. Pb was below
detection in more than 25% of the paper fraction
samples.
The mean metal concentrations found in this studywere compared with the concentrations reported from
other studies. The arithmetic mean was calculated for
some specific elements and used for comparison because
other studies reported the arithmetic mean of elemental
concentrations. The mean (arithmetic) Hg concentra-
tions in the paper, intermediate and the fine fraction
were 0.3, 0.6 and 0.3 mg/kg, respectively. The mean
Hg concentrations in the intermediate and fine fractionswere somewhat higher than the values of 0.38 and 0.13
mg/kg reported by Earle et al. (1999) for the intermedi-
ate and the fine fraction, respectively. Flyhammar et al.
(1998) investigated concentrations of some metals in the
paper and fine fractions of MSW samples collected from
a 20 year old test cell in Sweden. The mean (arithmetic)
Fe (8316 mg/kg) and Ni (21.7 mg/kg) concentrations in
the paper fraction compared well to the 8810 and 21.4mg/kg reported in the Swedish results, while the mean
Mn, Cd, Cr, Cu and Zn concentrations in the paper
fraction were found to be much lower than those re-
ported for the Swedish test cell (Flyhammar et al.,
1998). The mean (arithmetic) metal content of all metals
in the fine fraction were much lower than those reported
by Flyhammar et al. (1998). It should be noted, how-
ever, that Flyhammar et al. (1998) used 2-mm screen,larger than used in this study (0.425 mm), to separate
the fine fraction.
3.3. Comparison between fractions
The fine, intermediate and the paper fractions were
compared to each other in terms of elemental concentra-
tions. Because of high variability, the analysis of vari-ance (ANOVA test) could not be used for the
comparison of mean metal concentrations of the three
MSW fractions (Ott and Longnecker, 2001). The metal
concentrations were transformed to their respective nat-
ural logarithms. Hartley�s test was used to check the
equality of the variance of transformed data. If the vari-
ances of the transformed concentrations for a metal in
all three fractions were found equal, the ANOVA anal-ysis was used to compare the means of the transformed
data set. If the null hypothesis of equality of the trans-
formed mean metal concentrations in the three fractions
was rejected, Fisher�s Least Square Difference (LSD)
procedure was used for the comparison of the trans-
formed mean concentrations of that metal in the three
fractions (Ott and Longnecker, 2001). ANOVA and
Fisher�s LSD were used for comparison of mean metalconcentrations among the three fractions if the number
of non-detects was less than 15%. If the number of non-
detects was between 15% and 50%, the geometric means
(estimated using Cohen�s methods) of the different frac-
tions were compared using the Student�s t-test. If the
number of non-detects for any fraction exceeded 50%,
the Test for Proportions was used to compare the metal
concentrations among the different fractions.Table 2 summarizes the results of the statistical com-
parisons of the metal concentrations among the three
fractions. For each element, the statistical technique per-
formed is identified along with the relative order of each
fraction where statistical differences were found. In gen-
eral, metal concentrations were lowest in the fine frac-
tion and greatest in intermediate fraction. For many of
the elements (Al, Ba, Cr, Cu, Co, Fe, Mn, Ni, V andZn), the mean concentrations in the three fractions were
significantly different from each other (p < 0.001) and
were encountered in the following order: intermedi-
ate > paper > fine. The fine fraction, composed mainly
of sand, has been reported to have the lowest organic
matter content of the three fractions (Miller et al.,
1996). The lower organic content of the fine fraction
may account for the lower metal concentrations as com-pared to the other fractions. The mean concentration for
all the metals analyzed except As and Ag were lower in
the paper fraction than the intermediate fraction. This
indicates that the intermediate fraction has greater affin-
ity for the metals than the paper fraction, which also has
high organic content. The greater affinity of the interme-
diate fraction for metals might be because of the smaller
particle size providing greater cumulative surface areafor interaction.
3.4. Impact of waste age
To evaluate the impact of waste age, the mean metal
concentrations of eighteen samples from the three south-
ern most wells (�8 years old; defined as old samples)
were compared with mean metal concentrations of sev-enteen samples from the three northern most wells (�3
years old; defined as new samples). Sample ages were
estimated from landfill record of waste placement. The
southern most (old) samples were also in an area known
to be exposed to leachate recirculation in the past. The
mean percent paper fraction in the old samples (10%)
was significantly (p < 0.05) less than that of the new
samples (16%). The lower percent of the paper fractionin the old samples as compared to the new ones is likely
because of the decomposition of paper over the period

Table 2
Summary of statistical comparisons of metal concentrations among fractions
Element Statistical comparisons of metal concentrationsa Statistical test used
Al Intermediate > paper > fine ANOVA
Ag (a) Test of proportions
As Intermediate > fine; paper > fine ANOVA
Ba Intermediate > paper > fine ANOVA
Be Intermediate > paper; intermediate > fine Test of proportions
Cd (a) Student t-tests
Co Intermediate > paper > fine Student t-tests
Cr Intermediate > paper > fine ANOVA
Cu Intermediate > paper > fine ANOVA
Fe Intermediate > paper > fine ANOVA
Hg Intermediate > paper; intermediate > fine ANOVA
Mn Intermediate > paper > fine ANOVA
Ni Intermediate > paper > fine ANOVA
Pb Intermediate > fine > paper Student t-tests
Se Intermediate > paper; intermediate > fine Test of proportions
V Intermediate > paper > fine ANOVA
Zn Intermediate > paper > fine ANOVA
(a) No statistical difference among fractions.a Statistical significance tested at 99.9% confidence.
P. Jain et al. / Waste Management 25 (2005) 25–35 31
of time. In general, the metal concentrations in all the
three fractions of old samples were greater than those
of new samples. The mean Al, Fe, and Cr concentra-
tions in all three fractions of the old MSW samples were
significantly (p < 0.05) greater than those of the new
samples (Table 3). The mean Fe concentrations of all
the three fractions of the old samples were �3 times that
of the new ones. The mean Al concentrations of all thethree fractions of the intermediate fraction of the old
samples were �4 times that of the new ones. The mean
Ba, Cd, and Cu concentrations in the fine and paper
fractions of the old MSW samples were significantly
(p < 0.05) greater than the new samples. The mean As
concentrations in the fine and intermediate fractions of
Table 3
Metal concentration in old and new MSW samples (mg/kg dry basis)
Ala As Ba Cd Cr Cu
Fine arithmetic mean
Old 12.4a 2.4a 26.3ab 1.2ac 18.2a 44.3a
New 3.9b 1.4b 17.4b 0.4bc 9.9b 17.8b
Intermediate arithmetic mean
Old 36.1a 6.5a 65.4 1.7c 86.4ab 225
New 8.7b 3.8b 68.6 2.4 48.8b 308
Paper arithmetic mean
Old 14.7a 11.9 56.6a 2.1a 27.2ab 69.3ab
New 5.7b 6.2 32.7b 0.9b 39.3b 47.4b
Composite arithmetic mean
Old 16.2a 7.9ab 54.5 2.3 63.3 174
New 4.9b 4.4b 55.0 1.7 42.3 197
Mean concentrations within a column (for a fraction) followed by differenta Concentration is in g/kg dry basis.b Significance level p < 0.1.c Mean estimated using Cohen�s method.
the old sample were significantly greater than the new
samples.
In order to explore the effect of sample age on the ele-
mental content of the parent MSW samples, metal con-
centrations of the composite samples were calculated.
The fine, intermediate and paper fractions represented
the entire sample taken from the landfill minus the over-
sized non-biodegradable and very slowly biodegradablematerial. The metal concentrations of the composite
(paper + intermediate + fine) samples were determined
by multiplying the percentage of the total sample weight
that each fraction represented by the metal concentra-
tion of that fraction, adding the resulting three numbers
together and the dividing by the percentage of total
Fea Pb Mn Hg Ni V Zn
7.7a 29.2a 135 0.50 9.0 4.0 253
2.6b 10.1b 90.3 0.17 25.2 3.2 175
28.1a 51.7 644 1.44a 26.2 10.5 861
10.1b 38.3 988 0.28b 65.3 9.1 898
12.3a 37.5 179a 0.40ab 11.8 8.4a 314
4.5b 18.0 67.8b 0.21b 45.4 5.1b 345
18.8a 46.2 451a 0.92a 20.1 9.3a 662
6.8b 34.8 377b 0.21b 50.5 7.6b 690
letter are significantly different (p < 0.05).

32 P. Jain et al. / Waste Management 25 (2005) 25–35
sample weight that the three fractions represented to-
gether (Eq. (1)).
Concentration of metal Mj in composite sample
¼P
iCijpiPipi
, ð1Þ
where i is the paper, intermediate and the fine; pi, the
percentage of ith fraction in total sample weight; Cij,
concentration of metal Mj in ith fraction.
The mean Al, As, Fe, Mn, Hg, and V concentrations
in the old composite samples were found to be signifi-cantly (p < 0.05) greater than those in the new samples.
The lower Hg content of the new samples could be the
consequence of a sharp decline in the disposal of Hg bat-
teries in MSW, the major source of Hg in the MSW
stream (US EPA, 1997b), from 29.3 metric tons in
1989 to 6.7 metric tons in 1995 in Florida (FDEP,
1996). The increased concentration that could be caused
by the extended degradation of organic for old samplescompared with new samples would not be great enough
to be the sole cause of the increased concentrations seen.
The higher concentrations of many of the other metals
in the old MSW samples as compared to the new sam-
ples are most likely because of redistribution of these
metals as a result of leaching and waste decomposition.
3.5. Management of reclaimed material
The feasibility of a landfill reclamation project will
largely depend on management of the reclaimed mate-
rial. As mentioned earlier, the cover soil and degraded
organic waste have been reported to constitute �75%
of the recovered material and possible reuse options
for the recovered soil include landfill cover material
and construction fill (US EPA, 1997a). Before suchmaterial can be recycled outside of the landfill, the risk
posed by elevated pollutant concentrations should be
evaluated. An examination of such risk is usually re-
quired by regulatory agencies and elevated pollutant
concentrations may limit reuse options. Possible limita-
tions to the land application of reclaimed soils from the
Florida landfill under study were evaluated by compar-
ing the concentrations of the combined fine and interme-diate fractions (denoted herein as ‘‘residual soil’’) to the
guidelines or regulations of several different environ-
mental agencies.
The residual soil concentrations were obtained using
Eq. (1) for the intermediate and fine fractions only. One-
half of the detection limit was used when concentrations
were below detection. Sufficient data existed to calculate
the metal concentrations in the residual soil for a total of71 samples.
The arithmetic mean was calculated for some specific
elements and used for comparison with data reported by
Das et al. (2002), who reported the mean metal concen-
trations of six composite samples from a Georgia, US,
landfill; these samples would have been comparable to
the residual soil fraction reported here. The concentra-
tions of As, Cd, Cu, Pb and Zn in the residual soils from
the Florida landfill were found to be comparable to the
values reported for the Georgia landfill, while the meanNi and Cr concentrations (17.2 and 27.4 mg/kg, respec-
tively) were found to be much lower in the Florida
samples.
Upper 95% confidence limits (UCL) of the metal con-
centrations assuming a log normal distribution were
compared to regulatory thresholds for the US, the UK
and the Netherlands. The 95% upper confidence level
is often used when comparing variable field results toregulatory thresholds. Table 4 provides for each metal
the number of samples, the geometric mean and stan-
dard deviation, the 95% log-normal UCL and the con-
centration range, along with the regulatory thresholds.
As Table 4 illustrates, regulatory thresholds can vary
dramatically for some elements. The US EPA developed
soil screening levels (SSL) as part of their soil screening
guidance (SSG) for cleanup of contaminated sites (USEPA, 1996). Many US states have adopted a similar risk
assessment methodology to develop their thresholds for
clean soils and land-applied wastes. Similar risk-based
soil thresholds have been developed by a number of
European countries. Included in this comparison are soil
guideline values (SGV) developed by the United King-
dom Department of Environment, Food and Rural Af-
fairs and Environment Agency and intervention values(IV) developed by the Netherlands Ministry of Housing,
Spatial Planning and Environment (MHSPE). Differ-
ences in threshold values for a given element result from
differences in assumptions on toxicity, acceptable risk,
exposure scenarios, and algorithms for calculating
thresholds.
When the 95% UCL values were compared to the dif-
ferent thresholds, three different elements appear to posethe greatest concern with respect to possible limitations:
As, Be, and Cd. Arsenic concentrations in 67 samples
out of 69 exceeded the US EPA SSL (0.4 mg/kg). Ar-
senic did not exceed the UK SGV or the Netherlands
IV for arsenic, as these thresholds are much larger than
the US EPA SSL. The US EPA SSL was developed for
arsenic as a carcinogen and determined at a 1 in
1,000,000 cancer risk. The Florida Department of Envi-ronmental Protection�s soil cleanup target level for ar-
senic in residential settings (developed using
methodology and assumptions similar to the SSLs) is
0.8 mg/kg (FAC, 1999). Arsenic concentrations would
likely limit the reuse of these residual soils in Florida
to residential areas. When Das et al. (2002) assessed
the metal concentrations in soils from the Georgia land-
fill for land application, they compared the results(which were similar to this study) to standards promul-
gated for the land application of biosolids and con-

Table 4
Comparison of metal concentrations in residual soil with risk-based concentrationsa
Number of samples Metal concentration in residual soil (mg/kg dry basis) Risk-based metal concentrations in soil
(mg/kg)b
GM ± GSD 95% Upper confidence level for mean Range SSLc (mg/kg) SGVd IVe (mg/kg)
Alf 71 6.6 ± 0.001 7.6 2.4–73
As 69 2.0 ± 0.7 2.4 0.3–13.7 0.4(67) 20 55
Ba 71 26.2 ± 0.4 29.9 9.6–356 5500 625
Be 71 0.1 ± 0.3 0.1 <0.1–0.5 0.1(35)
Cd 71 0.9 ± 1.2 1.1 <0.3–21.2 78 1(31) 12(1)
Co 71 3.5 ± 0.6 4.0 <1.8–430 240
Cr 71 17.7 ± 0.7 20.9 3.2–331 390 130(1) 380(1)
Cu 71 38.7 ± 1.3 48.4 3.3–738 190(5)
Fef 71 5.8 ± 0.001 6.9 1.0–42.6
Pb 71 15.3 ± 1.7 19.9 <2.0–403 400(1) 450 530
Mn 71 80.6 ± 1.1 99.1 9.7–2510
Hg 69 0.2 ± 1.2 0.2 0.05–4.7 23 10
Ni 71 9.1 ± 0.9 11.0 1.6–369 1600 50(1) 210(1)
Se 71 3.7 ± 0.4 4.1 <2.5–69 390 35(1)
Ag 71 1.1 ± 0.5 1.3 <1.5–20.6 390
V 71 4.6 ± 0.3 5.1 1.7–22.8 550
Zn 71 238 ± 1.3 247 22–7420 23,000 720(9)
a Residual soil is composed of the fine and retained fraction.b Number is the parenthesis is the number of samples that exceeded the respective risk-based concentration.c US EPA soil screening levels corresponding to ingestion pathway.d UK EA soil guideline values corresponding to sandy soil, residential (with plant uptake) land-use. The SGV for Cd is a function of soil pH
(value for pH 6.0 is shown).e Netherlands MHSPE intervention value.f Concentrations in g/kg.
P. Jain et al. / Waste Management 25 (2005) 25–35 33
cluded land application would be appropriate. The ar-senic standard determined in the biosolids rule does
not consider arsenic carcinogenicity, while most state
guidelines do. This illustrates the importance of utilizing
the appropriate thresholds for comparison.
While 19 samples of the 71 samples exceeded the
US SSL for Be (0.1 mg/kg), it should be noted that
�80% of the fine and 50% the of intermediate fraction
samples were below detection and the detection limitof Be was equal to the SSL. Additional work at lower
limits of detection would therefore be recommended to
assess true risks posed by Be. No UK soil guidelines
levels or Netherlands intervention values were avail-
able for Be. Cd was found to be a concern with respect
to the UK SGVs. Since plant uptake is factored into
the development of the SGV, assumed soil pH has
an impact of the SGV used for comparison. Table 3shows an SGV for cadmium of 1 mg/kg which corre-
sponds to a soil pH of 6.0. At a soil pH of 7, the
SGV is 2 mg/kg. Only one sample exceeded the Neth-
erlands IV for Cd, while no samples exceeded the US
SSL for Cd.
Since arsenic was the most limiting element with re-
spect to reuse (considering the US SSL), an effort was
made to identify the source of As in the residual soil.As indicated in Table 1, the geometric mean of As con-
centration of the fine fraction, which is primarily cover
soil and which represented approximately half of sam-
ple mass and �75% of the ‘‘residual soil’’ fraction, was1.4 mg/kg. The arsenic concentrations in the intermedi-
ate and paper were fraction were larger than this. Sam-
ples of natural soil, which were believed to be
representative of the cover soil used during landfill
operation, were collected and analyzed for arsenic.
The arsenic concentration in each of eleven composite
soil samples collected was below detection (0.2 mg/
kg). Thus the source of the arsenic appears to be thesolid waste itself. Apparently during the process of
mixing soil with waste in the landfill, and the subse-
quent leaching and decomposition occurring, arsenic
concentrations in the fine fraction (the cover soil) be-
came elevated. The exact source of the arsenic and
the mechanism of transport to the fine fraction are un-
known. This merits further research.
4. Conclusions
The objectives of this study were to characterize soil
and fine organic matter recovered from a MSW landfill
with respect to the metal content and to assess limita-
tions associated with the reuse of these materials out-
side the landfill environment. Samples were collectedfrom a MSW landfill in Florida and separated into dif-
ferent size fractions. Approximately 45% of the re-
claimed material (by weight) was composed of the

34 P. Jain et al. / Waste Management 25 (2005) 25–35
sand that was used as daily and intermediate cover
material. Another 15% was composed of stabilized
organic material (>0.425 and <6.3 mm). The paper
fraction constituted about 12% of the recovered
material. In general, the metal concentrations were
greatest in intermediate fraction and least in the fine(soil) fraction. The mean Al, Ba, Cr, Cu, Co, Fe, Mn,
Ni, V, and Zn concentrations in the three fractions were
significantly different from each other (p < 0.001) and
were encountered in the following order: intermedi-
ate > paper > fine. The effect of age on metal concentra-
tions was found to be dependent on the metal and the
fraction. The mean Al, Fe, and Cr concentrations in
all three fractions of the old MSW samples were signif-icantly (p < 0.05) greater than those of the new samples.
The mean Al, As, Fe, Mn, Hg and V concentrations in
the old composite samples were found to be signifi-
cantly (p < 0.05) greater than those in the new samples.
Lower Hg concentrations in the new samples may be
the consequence of a sharp decline in the amount of
Hg in household products disposed in MSW. The high-
er Al and Fe concentrations of the old MSW samples ascompared to the new samples are most likely because of
redistribution of these metals as a result of leaching and
waste decomposition.
To assess the possible limitations of reuse of the re-
claimed soil (consisting of fine and intermediate frac-
tions) outside of the landfill, metal concentrations were
compared to regulatory thresholds from the US, UK
and the Netherlands. For the most part, metal concen-trations were below the regulatory thresholds, though
As, Be and Cd may be a concern. Elevated concentra-
tions of As presented the most concern with respect to
reuse when compared to US thresholds that treat arsenic
as a carcinogen; arsenic was a not a problem when com-
pared to the European thresholds. The source of the ar-
senic was the waste itself, and not the cover soil.
Cadmium was not a limiting element using the USthresholds, but was limited under the UK thresholds.
Many assumptions go into the development of risk-
based regulatory thresholds, and they are oftentimes
conservative in nature. A more detailed site-specific
study to evaluate the risk associated with the land appli-
cation of the residual soil reclaimed from an MSW land-
fill would be beneficial. The impacts of pollutant
leaching or the impacts of organic chemicals were notevaluated and may also have to be addressed prior to
a reclamation project.
Acknowledgements
The authors wish to acknowledge the support of the
Florida Centre for Solid and Hazardous Waste Manage-ment and the Alachua County Public Works Depart-
ment. Thabet Tolaymat, Scott Sheridan, and Brajesh
Dubey provided valuable assistance in the collection of
data presented in this paper.
References
Atuanya, E.I., Purohit, H.J., Charabarti, T., 2000. Anaerobic and
aerobic biodegradation of chlorophenols using UASB and ASG
bioreactors. World Journal of Microbiology and Biotechnology 16,
95–98.
Belevi, H., Baccini, P., 1989. Long-term behavior of municipal solid
waste landfills. Waste Management and Research 7, 43–56.
Bozkurt, S., Moreno, L., Neretnieks, I., 1999. Long-term fate of
organics in waste deposits and its effect on metal release. The
Science of the Total Environment 228, 135–152.
Cohen, L.A., Speitel, G.E., 2001. Kinetics of aerobic cometabolism of
chlorinated solvents. Biodegradation 12, 105–126.
Das, K.C., Smith, M.C., Gattie, D.K., Boothe, D.D.H., 2002. Stability
and quality of municipal solid waste compost from a landfill
aerobic bioreduction process. Advances in Environmental
Research 6, 401–409.
DEFRA and Environment Agency, 2002. Assessment of risks to
human health from land contamination: an overview of the
development of guideline values and related research, Report
CLR7, Swindon, Wilts.
Earle, C.D.A., Rhue, R.D., Earle, J.F.K., 1999. Mercury in a
municipal solid waste landfill. Waste Management and Research
17, 305–312.
FDEP, 1996. 1996 Solid Waste Management in Florida Annual
Report. Bureau of Solid and Hazardous Waste. Florida Depart-
ment of Environmental Protection, Tallahassee FL.
Field, J.A., Stams, A.J.M., Kato, M., Schraa, G., 1995. Enhanced
biodegradation of aromatic pollutants in cocultures of anaerobic
and aerobic bacterial consortia. Antonie van Leeuwenhoek 67, 47–
77.
Finnveden, G., 1996. Solid waste treatment within the framework
of life cycle assessment. International Journal of LCA 1 (2), 74–
78.
Florida Administrative Code (FAC), 1999. Development of Soil
Cleanup Target Levels (SCTLs). Chapter 62–777. Florida Depart-
ment of Environmental Protection Agency, Tallahassee FL.
Flyhammar, P., Tamaddon, F., Bengtsson, L., 1998. Heavy metals in a
municipal solid waste deposition cell. Waste Management and
Research 16 (5), 403–410.
Gould, J.P., Pohland, F.G., Cross, W.H., 1990. Factors influencing
mobility of toxic metals in landfill operated with leachate recycle.
Emerging Technologies in Hazardous Waste Management, 267–
291.
Magnuson, A., 1991. Landfill reclamation at Edinburg. Waste Age 22
(11), 75–78.
MHSPE, 2000. Circular on Target Values and Intervention Values for
Soil Remediation. Ministry of Housing, Spatial Planning and
Environment, Hague, Netherlands.
Miller, W.L., Earle, J.F.K., Townsend, T.G., 1996. Engineering
Control and Augmentation of Biological Decomposition at the
Solid Waste Landfills. Project Summary. Department of Environ-
mental Engineering and Sciences, University of Florida Gainesville
FL, USA.
Morelli, J., 1990. Landfill reuse strategies. Biocyle (April), 60–61.
Nelson, H., 1994. Landfill reclamation strategies. Biocyle (October),
41–44.
Ott, R.L., Longnecker, M., 2001. An Introduction to Statistical
Methods and Data Analysis, fifth ed. Duxbury Thomson Learning,
Pacific Grove, CA, USA.
Reinhart, D.R., Townsend, T.G., 1997. Landfill Bioreactor Design and
Operation. Lewis Publishers, Boca Raton FL, USA.

P. Jain et al. / Waste Management 25 (2005) 25–35 35
Spencer, R., 1990. Landfill space reuse. Biocycle (February), 30–33.
Townsend, T.G., Miller, W.L., 1998. Leachate recycle using horizontal
injection. Advances of Environmental Research 2 (2), 129–138.
Townsend, T.G., Miller, W.L., Earle, J.F.K., 1995. Leachate recycle
infiltration ponds. Journal of Environmental Engineering (June),
465–471.
Townsend, T.G., Miller, W.L., Lee, H.J., Earle, J.F.K., 1996.
Acceleration of landfill stabilization using leachate recycle. Journal
of Environmental Engineering (April), 263–268.
US EPA, 1995. Test methods for evaluating solid waste. US EPA SW-
846 3rd Ed. Office of Solid Waste, Washington, DC.
US EPA, 1996. Soil screening guidance: technical background docu-
ment. Office of Solid Waste and Emergency Response, EPA540-R-
95-128. Washington, DC.
US EPA, 1997a. Landfill reclamation. Office of Solid Waste and
Emergency Response (5305W) EPA530-F-97-001, July, Washing-
ton, DC.
US EPA, 1997b. Implementation of the mercury-containing and
rechargeable battery management act. EPA530-K-97-009, Novem-
ber, Washington, DC.
US EPA, 2000. Guidelines for data quality analysis: practical
methods for data analysis. Office of Environmental Information,
EPA600-R-96/084. US Environmental Protection Agency, Wash-
ington, DC.
US EPA, 2002. Municipal solid waste in the United States: 2000 facts
and figures executive summary. Office of Solid Waste and Emer-
gency Response (5305W). EPA530-R-02-001. June, Washington,
DC.