healthy marketplace index: medical issue brief #16 treatment indices part 2: intensity ... ·...
TRANSCRIPT

1
www.healthcostinstitute.org
Issue Brief #16 May 2017
KEY FINDINGS
There were no consistent rela-
tionships among utilization rates
across medical treatments stud-
ied
High utilization of one medical treatment
did not necessarily mean high utilization
across all treatments.
A moderate, positive correlation
existed between the intensity of
services provided, within CBSAs
The correlation between ACL repair and
knee replacement indices was 0.2918,
the lowest cross-treatment correlation of
intensity indices was 0.1732 (Knee Injec-
tion–ACL Repair).
Healthy Marketplace Index: Medical
Treatment Indices—Part 2: Intensity
and Utilization
spending) to evaluate whether resources are being used appropriately.
All three treatments are knee related, but there was no consistent relationship amongst the three treatments’ utilization rates at the CBSA-level. There was however, a moderate positively related relationship between the intensity of the services provid-ed.
Index calculations
UTILIZATION RATES
Utilization was measured by the total count of treatments within the population. Treat-ment counts were based on particular proce-dure codes associated with each medical treatment. For each CBSA, a raw utilization rate was found by dividing the total number of treatments (e.g., count of all knee injec-tions) by the total number of patients in that CBSA.2 The raw utilization rates were then adjusted for differences in the distribution of age and gender across the 61 study CBSAs (see Data and Methods for a more detailed description). The age-gender adjusted utili-
The Health Care Cost Institute (HCCI), with funding from the Robert Wood Johnson Foundation, calculated measures of health care price, compe-tition, and productivity, which collec-tively make up the Healthy Market-place Index (HMI). This issue brief, the fourth and final brief in the 2017 HMI series, reports utilization rates and indices of health care service use (e.g., “intensity”) for an injection to alleviate knee pain, arthroscopy and surgery to repair a torn ACL, and a full knee re-placement; the same three treatments for which price and spending measures were reported in the third HMI brief: Healthy Marketplace Index: Medical Treatment Indices - Part 1: Spending and Price (Part 1).
The measures in Part 1 focused on the relationships between price and total spending for the three specific treat-ments, as well as how prices for those services related to overall medical category price levels (inpatient facili-ty, outpatient facility, and physician services).1 In this brief (Part 2), we examined aspects of marketplaces: related to productivity. As in the pre-vious three HMI issue briefs, the measures in this report were calculat-ed for 61 Core-Based Statistical Areas (CBSAs).
Due to the complexity of creating a health care productivity measure, we addressed the question of productivity indirectly by calculating measures related to the components of produc-tivity. Productivity can generally be thought of as how much output is pro-duced from a given amount of re-sources. Although this may seem to be
a straightforward question, measuring productivity in health care is particu-larly challenging. Identifying the ap-propriate inputs and outputs in health care is difficult, not to mention accu-rately estimating those measures. For example, a health outcome is depend-ent not only on the health care ser-vices provided, but can vary due to unobservable factors related to the patients, providers, and environ-ments.
Using specific medical treatments, we were able to compare a consistent output by assuming each treatment has a given output. In other words, assuming no quality differences, the result of each treatment is the same for all patients. Utilization rates are a measure of how many treatments oc-curred (e.g., total outputs). With a fixed output measure, we were also able to compare the services used to achieve the output (e.g., average in-puts). The intensity index is a measure designed to compare the differences in the services that commonly used to deliver each medical treatment. Thus we indirectly evaluated the produc-tion process, inputs and outputs, for each medical treatment. For example, one area may use many services when providing a treatment, but provide that treatment relatively infrequently overall. Conversely, another area may use very few services for a treatment, while providing that treatment many times throughout the study. Although, neither of the measures were adjusted for quality, knowledge of the average inputs and total outputs can be com-bined with other sources of data (which may include quality, prices, or
Comparing utilization of health care services for three medical treat-
ments within and across geographies

2
www.healthcostinstitute.org
zation (utilization) rates were then mul-tiplied by 1,000 for reporting purposes – utilization rates are per 1,000 insured individuals or members.
INTENSITY INDEX
The intensity index measures the aver-age collection of services or inputs for each medical treatment, independent of the price of inputs. To calculate the in-dex, a normalized price was calculated for every procedure code as the average price from the full set of claims in the analysis sample (the total population).3 The normalized prices account for dif-ferences in price by service category type (inpatient, outpatient, or physi-cian), but otherwise remove differences in prices due to differences in insurer, plan type, market power, etc. The nor-malized prices were then used to calcu-late a total population and CBSA-level average treatment price by dividing the sum of normalized prices by the number of treatments observed. The index was calculated by dividing the CBSA-level average normalized treatment price by the respective total population normal-ized average price.
The intensity index measures how the provision of services differs on average across CBSAs. Intensity can vary be-cause of differences in the types or loca-tion of services used, because of differ-ences in the number of procedures used, or both type and number. A CBSA with an index level greater than 1.00 implies that, on average, a patient in that CBSA receives either more expensive (e.g., intensive) procedures or more proce-
dures in their medical treatment when compared to the national average for the same treatment. An index value less than 1.00 indicates the opposite.
Although we did not calculate a produc-tivity measure, the intensity index pro-vides a relative measure of what the average health care inputs for a treat-ment were in a CSBA. The utilization rate provides a standardized measure of how many treatments were provided. Thus, we report measures of the compo-nents of productivity, inputs and output, for each medical treatment.
Results
UTILIZATION
Table 1 presents descriptive statistics of the CBSA-level utilization rates for the three medical treatments. As expected, there were substantial differences in the magnitude of the utilization rates across treatments. Knee injections were by far the most common, an average of 27.03 treatments per 1,000 people. The ACL repair and knee replacement utilization rates were substantially lower at 0.43 and 1.68 occurrences per 1,000 mem-bers, respectively. The relative im-portance of these rates, however, differs in the context of the prices of the treat-ments. As shown in Part 1, spending on an ACL repair is over 30 times greater than that of a knee injection, and a knee replacement costs nearly 100 times more, on average.4
There was also wide variation in utiliza-tion across CBSAs. On a nominal basis,
knee injection had the most utilization and, subsequently, the most variation. The knee injection treatment not only had the largest overall range (40.70 in-jections per 1,000 members), but also the large interquartile range – a com-mon measure of variability displaying the difference between the 75th and 25th percentiles – of 12.24 occurrences per 1,000. Looking at the relative varia-tion within each treatment category, however, the variation in all three treat-ments becomes apparent. The ratio of maximum to minimum utilization rates over all 61 CBSAs was 5.94 for knee in-jections, 68.25 for ACL repairs, and 25.17 for knee replacements.
Although all three treatments are knee related, there was no consistent rela-tionship amongst the three treatments’ utilization rates at the CBSA-level. The correlation coefficients of the CBSA-level utilization rates for each pair of treatments are shown in Table 2. The knee replacement utilization rates were positively correlated with both knee injections and ACL repairs. The correla-tion was slightly higher for the knee in-jection rates (0.2427) than the ACL re-pair utilization rates (0.1452), but nei-ther correlation was strong. This im-plies, however, that areas with higher rates of injections or ACL repairs may also have slightly higher rates of re-placements, and vice versa. This would be consistent with underlying popula-tion characteristics that lead to more knee injuries overall. Conversely, the utilization rates of knee injections and ACL repairs were negatively correlated, although the magnitude was smaller
Table 1. CBSA-level Spending Index Summary Statistics—Utilization
per 1,000 Individuals (weighted by Age & Gender) Knee Injection ACL Repair Knee Replacement
Average
(Standard Deviation)
27.03
(9.69)
0.43
(0.37)
1.68
(1.17)
Minimum 8.23 0.04 0.23
25th Percentile 19.12 0.25 0.86
50th Percentile 26.76 0.37 1.48
75th Percentile 31.36 0.52 2.19
Maximum 48.93 2.73 5.79
Source: HCCI, 2017.

3
www.healthcostinstitute.org
than the other two correlations in abso-lute value (-0.0903). This result seem-ingly contradicts the knee replacement related results and is a potential area for future research related to relationships between medical treatments and under-lying population health.
Table 3 shows the correlations between price, utilization, and spending for each of the three treatments studied. Measures of utilization are important in understanding spending, given that total health care spending is dependent on both the number of services provided, as well as the price paid for those ser-vices. Therefore, the HMI utilization measures can be used in conjunction with the spending and price measures reported in Part 1 to better understand trends in specific CBSAs and as a means to compare these markets to one anoth-er.
The results in Table 3 show that there were strong positive correlations be-tween the spending and price indices within medical treatments. When these two indices were juxtaposed to the CBSA-level utilization rates, however, the relationships were not as strong. Both spending and prices were weakly, negatively correlated with utilization among knee injections. For ACL repairs, there was essentially no relationship between spending and utilization, but utilization and prices were slightly, posi-tively correlated. The strongest relation-ships between the utilization rates and either of the Part 1 indices were among knee replacements. Both spending and
prices were moderately, negatively cor-related to utilization.
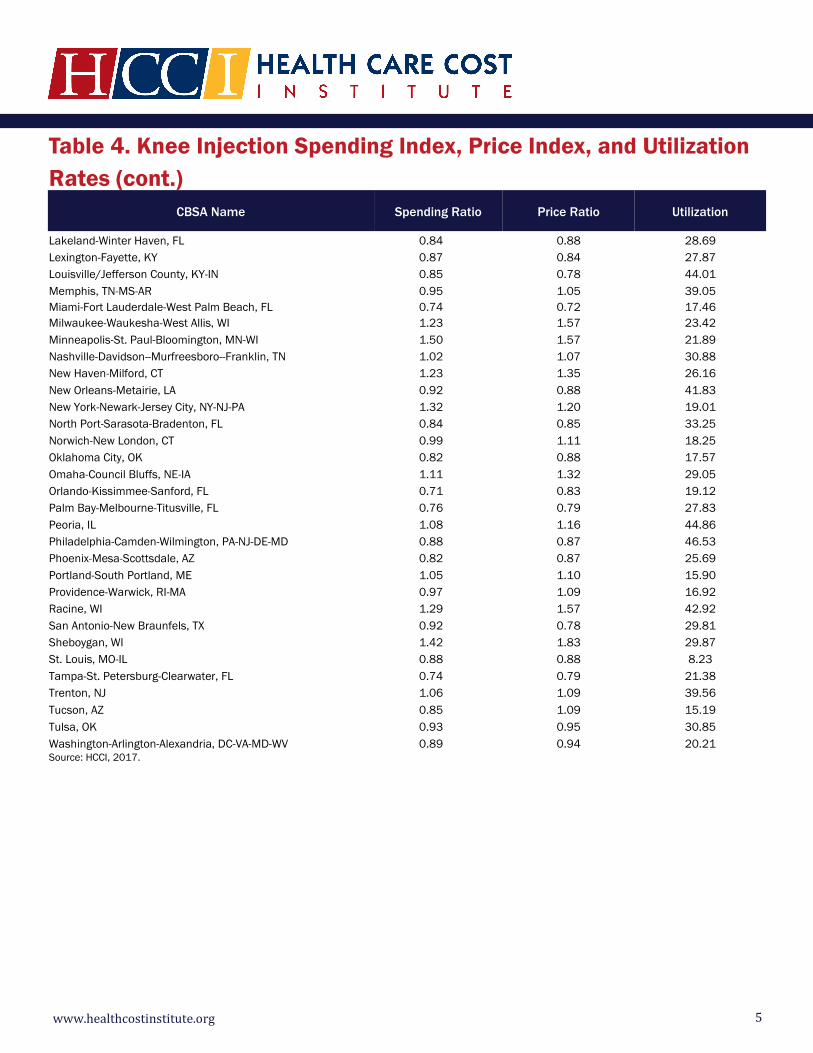
The relationship between utilization and prices, and how they both factor into spending, can be potentially in-formative when addressing high or low spending at a CBSA-level. Tables 4–6 report the spending index, price index, and utilization rates for the three medi-cal treatments for each of the 61 CBSAs. While the price and spending indices for each treatment were previously report-ed in Part 1, the addition of the utiliza-tion rates provide additional data and possible insights into the reasons for variation in spending across CBSAs.
The CBSA-level knee injection spending and price indices, as well as the utiliza-tion rates for knee injections are listed in Table 4. As seen in previous HMI briefs, when displayed by the CBSA lev-el, there are many individual CBSAs that align with the overall trends in the rela-tionships between the measures, but also several outliers. For example, both Appleton and Racine, Wisconsin were among the six highest spending CBSAs – Appleton the 2nd highest, Racine the 6th. While both of their price ratios – the respectively 3rd and 4th highest price index values – supported the strong positive correlation between spending and price, the same was not true for both utilization rates. The knee injec-tion utilization rate in Racine was the 6th highest, generally consistent with the relative spending and price rankings. In Appleton, however, the utilization rate was the 4th lowest rate among all CBSAs
studied – roughly one third that of Ra-cine .
Table 5 presents the ACL repair spend-ing and price indices alongside the utili-zation rates for every CBSA studied. As seen in Table 3, the ACL repair spending and price indices had the weakest corre-lation among the three medical treat-ments, although still strongly positive. Utilization had next to no relationship with spending, and only a weak relation-ship with price. At the CBSA-level, how-ever, there were areas that both aligned and contradicted the overall relation-ship trends. Some CBSAs, such as Dallas-Fort Worth-Arlington, Texas, had con-sistent rankings with spending, price, and utilization all being in the top 15% of all CBSAs. Some CBSAs, such as Colo-rado Springs, Colorado, had consistent price and spending rankings (both in the lowest 10% of CBSAs) but high utili-zation (in the top 10% of CBSAs). Others still, such as North Port-Sarasota-Bradenton, Florida, had no relationship among any of the three measures, with low utilization (0.08), average prices (0.93), and average spending well above average (1.24).
The CBSA-level knee replacement spending index, price index, and utiliza-tion rates are shown in Table 6. Of the three medical treatments, the relation-ship between utilization with both spending and price was strongest in the knee replacement indices. The relation-ship, however, was a moderately, nega-tive correlation, with correlation values of approximately -0.3000 for both. This
Table 3. Correlations of Spending, Price, and Utilization Measures Spending to Price Spending to Utilization Price to Utilization
Knee Injection 0.9127 -0.1054 -0.0567
ACL Repair 0.8399 0.0048 0.1437
Knee Replacement 0.9913 -0.3069 -0.2867
Source: HCCI, 2017.
Table 2. Correlation of Age-Gender Adjusted Utilization Correlation
Knee Injection to ACL Repair -0.0903
Knee Injection to Knee Replacement 0.2427
ACL Repair to Knee Replacement 0.1452
Source: HCCI, 2017.

4
www.healthcostinstitute.org
Table 4. Knee Injection Spending Index, Price Index, and Utilization
Rates
CBSA Name Spending Ratio Price Ratio Utilization
Appleton, WI 1.58 1.66 15.00
Atlanta-Sandy Springs-Roswell, GA 0.96 1.03 39.16
Augusta-Richmond County, GA-SC 0.89 1.01 27.74
Austin-Round Rock, TX 1.07 1.01 15.51
Baltimore-Columbia-Towson, MD 0.84 0.88 21.95
Baton Rouge, LA 0.97 0.95 39.02
Beaumont-Port Arthur, TX 0.88 0.97 17.45
Boulder, CO 0.89 1.10 29.50
Bridgeport-Stamford-Norwalk, CT 1.20 1.28 23.89
Cape Coral-Fort Myers, FL 0.96 0.80 32.86
Charlotte-Concord-Gastonia, NC-SC 1.09 1.16 27.77
Charlottesville, VA 1.10 1.22 21.87
Chicago-Naperville-Elgin, IL-IN-WI 1.21 1.12 14.43
Cincinnati, OH-KY-IN 0.89 0.94 41.07
Colorado Springs, CO 0.97 0.98 28.82
Columbus, OH 0.95 0.94 31.36
Corpus Christi, TX 0.84 0.80 23.24
Dallas-Fort Worth-Arlington, TX 1.08 0.97 20.81
Dayton, OH 0.78 0.87 36.67
Deltona-Daytona Beach-Ormond Beach, FL 0.76 0.79 21.45
Denver-Aurora-Lakewood, CO 0.97 0.96 23.72
Des Moines-West Des Moines, IA 0.93 1.11 19.55
El Paso, TX 0.90 0.85 13.64
Green Bay, WI 1.60 1.95 26.76
Greensboro-High Point, NC 0.85 0.99 44.30
Hartford-West Hartford-East Hartford, CT 1.18 1.33 17.96
Houston-The Woodlands-Sugar Land, TX 1.01 0.89 15.63
Jacksonville, FL 0.88 0.94 27.88
Kansas City, MO-KS 0.80 0.90 27.40
Knoxville, TN 0.90 0.97 48.93 Source: HCCI, 2017.
Note: Table continues.
5
www.healthcostinstitute.org
Table 4. Knee Injection Spending Index, Price Index, and Utilization
Rates (cont.)
CBSA Name Spending Ratio Price Ratio Utilization
Lakeland-Winter Haven, FL 0.84 0.88 28.69
Lexington-Fayette, KY 0.87 0.84 27.87
Louisville/Jefferson County, KY-IN 0.85 0.78 44.01
Memphis, TN-MS-AR 0.95 1.05 39.05
Miami-Fort Lauderdale-West Palm Beach, FL 0.74 0.72 17.46
Milwaukee-Waukesha-West Allis, WI 1.23 1.57 23.42
Minneapolis-St. Paul-Bloomington, MN-WI 1.50 1.57 21.89
Nashville-Davidson--Murfreesboro--Franklin, TN 1.02 1.07 30.88
New Haven-Milford, CT 1.23 1.35 26.16
New Orleans-Metairie, LA 0.92 0.88 41.83
New York-Newark-Jersey City, NY-NJ-PA 1.32 1.20 19.01
North Port-Sarasota-Bradenton, FL 0.84 0.85 33.25
Norwich-New London, CT 0.99 1.11 18.25
Oklahoma City, OK 0.82 0.88 17.57
Omaha-Council Bluffs, NE-IA 1.11 1.32 29.05
Orlando-Kissimmee-Sanford, FL 0.71 0.83 19.12
Palm Bay-Melbourne-Titusville, FL 0.76 0.79 27.83
Peoria, IL 1.08 1.16 44.86
Philadelphia-Camden-Wilmington, PA-NJ-DE-MD 0.88 0.87 46.53
Phoenix-Mesa-Scottsdale, AZ 0.82 0.87 25.69
Portland-South Portland, ME 1.05 1.10 15.90
Providence-Warwick, RI-MA 0.97 1.09 16.92
Racine, WI 1.29 1.57 42.92
San Antonio-New Braunfels, TX 0.92 0.78 29.81
Sheboygan, WI 1.42 1.83 29.87
St. Louis, MO-IL 0.88 0.88 8.23
Tampa-St. Petersburg-Clearwater, FL 0.74 0.79 21.38
Trenton, NJ 1.06 1.09 39.56
Tucson, AZ 0.85 1.09 15.19
Tulsa, OK 0.93 0.95 30.85
Washington-Arlington-Alexandria, DC-VA-MD-WV 0.89 0.94 20.21 Source: HCCI, 2017.

6
www.healthcostinstitute.org
Table 5. ACL Repair Spending Index, Price Index, and Utilization
Rates
CBSA Name Spending Ratio Price Ratio Utilization
Appleton, WI 1.47 1.37 0.21
Atlanta-Sandy Springs-Roswell, GA 0.87 1.00 0.33
Augusta-Richmond County, GA-SC 0.61 0.71 0.11
Austin-Round Rock, TX 0.89 0.98 0.53
Baltimore-Columbia-Towson, MD 0.83 0.84 0.42
Baton Rouge, LA 0.70 0.66 0.56
Beaumont-Port Arthur, TX 0.85 0.70 0.18
Boulder, CO 1.01 1.01 2.73
Bridgeport-Stamford-Norwalk, CT 1.20 1.30 1.21
Cape Coral-Fort Myers, FL 1.20 1.02 0.09
Charlotte-Concord-Gastonia, NC-SC 1.29 1.05 0.40
Charlottesville, VA 1.19 0.76 0.04
Chicago-Naperville-Elgin, IL-IN-WI 0.97 0.96 0.44
Cincinnati, OH-KY-IN 0.73 0.79 0.53
Colorado Springs, CO 0.57 0.69 0.75
Columbus, OH 1.21 1.14 0.35
Corpus Christi, TX 0.86 1.08 0.47
Dallas-Fort Worth-Arlington, TX 1.26 1.16 0.74
Dayton, OH 1.20 1.02 0.49
Deltona-Daytona Beach-Ormond Beach, FL 0.76 0.80 0.37
Denver-Aurora-Lakewood, CO 1.12 1.10 0.81
Des Moines-West Des Moines, IA 0.60 0.83 0.75
El Paso, TX 0.95 0.88 0.52
Green Bay, WI 1.37 1.35 0.40
Greensboro-High Point, NC 1.16 1.11 0.14
Hartford-West Hartford-East Hartford, CT 0.94 0.91 0.34
Houston-The Woodlands-Sugar Land, TX 1.22 1.10 0.26
Jacksonville, FL 1.02 0.89 0.29
Kansas City, MO-KS 0.73 0.76 0.51
Knoxville, TN 0.55 0.59 0.25 Source: HCCI, 2017.
Note: Table continues.

7
www.healthcostinstitute.org
Table 5. ACL Repair Spending Index, Price Index, and Utilization
Rates (cont.)
CBSA Name Spending Ratio Price Ratio Utilization
Lakeland-Winter Haven, FL 0.91 0.78 0.14
Lexington-Fayette, KY 0.99 1.02 0.06
Louisville/Jefferson County, KY-IN 0.83 0.77 0.16
Memphis, TN-MS-AR 0.80 0.76 0.10
Miami-Fort Lauderdale-West Palm Beach, FL 0.77 0.82 0.31
Milwaukee-Waukesha-West Allis, WI 1.11 1.19 0.71
Minneapolis-St. Paul-Bloomington, MN-WI 1.01 0.93 0.62
Nashville-Davidson--Murfreesboro--Franklin, TN 0.86 0.87 0.36
New Haven-Milford, CT 0.97 0.99 0.27
New Orleans-Metairie, LA 1.26 1.02 0.29
New York-Newark-Jersey City, NY-NJ-PA 1.27 1.21 0.37
North Port-Sarasota-Bradenton, FL 1.25 0.93 0.09
Norwich-New London, CT 1.14 1.09 0.33
Oklahoma City, OK 0.71 0.65 0.37
Omaha-Council Bluffs, NE-IA 1.01 1.09 0.45
Orlando-Kissimmee-Sanford, FL 0.89 0.81 0.32
Palm Bay-Melbourne-Titusville, FL 0.92 0.78 0.35
Peoria, IL 0.95 0.87 0.37
Philadelphia-Camden-Wilmington, PA-NJ-DE-MD 1.00 1.00 0.24
Phoenix-Mesa-Scottsdale, AZ 0.80 0.92 0.19
Portland-South Portland, ME 1.02 1.05 0.76
Providence-Warwick, RI-MA 1.12 0.99 0.58
Racine, WI 1.01 1.10 0.51
San Antonio-New Braunfels, TX 0.79 0.90 0.39
Sheboygan, WI 1.39 1.46 0.44
St. Louis, MO-IL 0.75 0.80 0.13
Tampa-St. Petersburg-Clearwater, FL 0.93 0.90 0.28
Trenton, NJ 1.25 1.44 0.22
Tucson, AZ 0.61 0.61 0.36
Tulsa, OK 0.79 0.80 0.75
Washington-Arlington-Alexandria, DC-VA-MD-WV 0.88 0.96 0.62 Source: HCCI, 2017.

8
www.healthcostinstitute.org
Table 6. Knee Replacement Spending Index, Price Index, and Utiliza-
tion Rates
CBSA Name Spending Ratio Price Ratio Utilization
Appleton, WI 0.89 0.91 2.02
Atlanta-Sandy Springs-Roswell, GA 1.02 1.02 1.32
Augusta-Richmond County, GA-SC 0.85 0.86 1.79
Austin-Round Rock, TX 1.06 1.06 0.76
Baltimore-Columbia-Towson, MD 0.81 0.81 1.72
Baton Rouge, LA 0.91 0.91 0.70
Beaumont-Port Arthur, TX 1.10 1.06 0.91
Boulder, CO 1.10 1.11 3.11
Bridgeport-Stamford-Norwalk, CT 1.06 1.03 0.64
Cape Coral-Fort Myers, FL 1.15 1.15 2.19
Charlotte-Concord-Gastonia, NC-SC 1.24 1.25 0.23
Charlottesville, VA 1.09 1.10 1.34
Chicago-Naperville-Elgin, IL-IN-WI 1.00 1.03 0.90
Cincinnati, OH-KY-IN 1.01 1.01 3.05
Colorado Springs, CO 1.10 1.11 1.73
Columbus, OH 1.00 1.02 1.74
Corpus Christi, TX 0.85 0.82 0.93
Dallas-Fort Worth-Arlington, TX 1.38 1.39 0.76
Dayton, OH 0.99 1.00 2.94
Deltona-Daytona Beach-Ormond Beach, FL 1.00 1.00 1.16
Denver-Aurora-Lakewood, CO 1.01 0.98 3.03
Des Moines-West Des Moines, IA 0.67 0.70 0.98
El Paso, TX 1.46 1.48 0.26
Green Bay, WI 0.94 0.97 5.79
Greensboro-High Point, NC 0.94 0.98 1.61
Hartford-West Hartford-East Hartford, CT 0.93 0.91 1.48
Houston-The Woodlands-Sugar Land, TX 1.14 1.10 0.40
Jacksonville, FL 1.00 0.96 1.73
Kansas City, MO-KS 0.83 0.85 1.96
Knoxville, TN 0.71 0.72 3.06 Source: HCCI, 2017.
Note: Table continues.

9
www.healthcostinstitute.org
Table 6. Knee Replacement Spending Index, Price Index, and Utiliza-
tion Rates (cont.)
CBSA Name Spending Ratio Price Ratio Utilization
Lakeland-Winter Haven, FL 0.95 0.95 0.80
Lexington-Fayette, KY 0.80 0.79 1.63
Louisville/Jefferson County, KY-IN 0.75 0.75 3.38
Memphis, TN-MS-AR 0.79 0.77 1.02
Miami-Fort Lauderdale-West Palm Beach, FL 0.86 0.86 0.55
Milwaukee-Waukesha-West Allis, WI 1.03 1.08 3.65
Minneapolis-St. Paul-Bloomington, MN-WI 1.00 0.96 2.40
Nashville-Davidson--Murfreesboro--Franklin, TN 1.04 1.06 1.65
New Haven-Milford, CT 1.03 1.03 1.21
New Orleans-Metairie, LA 0.86 0.86 0.44
New York-Newark-Jersey City, NY-NJ-PA 1.20 1.20 0.28
North Port-Sarasota-Bradenton, FL 0.92 0.88 2.06
Norwich-New London, CT 0.85 0.84 2.38
Oklahoma City, OK 0.80 0.82 0.66
Omaha-Council Bluffs, NE-IA 1.00 1.02 1.23
Orlando-Kissimmee-Sanford, FL 1.15 1.16 1.04
Palm Bay-Melbourne-Titusville, FL 1.28 1.28 1.35
Peoria, IL 0.73 0.69 3.30
Philadelphia-Camden-Wilmington, PA-NJ-DE-MD 1.14 1.16 1.18
Phoenix-Mesa-Scottsdale, AZ 0.88 0.87 0.68
Portland-South Portland, ME 0.94 0.96 1.88
Providence-Warwick, RI-MA 0.92 0.93 1.54
Racine, WI 1.01 1.06 5.18
San Antonio-New Braunfels, TX 0.98 0.99 1.73
Sheboygan, WI 0.85 0.90 0.44
St. Louis, MO-IL 0.66 0.68 3.95
Tampa-St. Petersburg-Clearwater, FL 1.02 1.03 0.86
Trenton, NJ 1.19 1.20 0.26
Tucson, AZ 0.65 0.64 2.27
Tulsa, OK 0.69 0.66 2.28
Washington-Arlington-Alexandria, DC-VA-MD-WV 0.94 0.96 0.93 Source: HCCI, 2017.

10
www.healthcostinstitute.org
negative relationship was exemplified within the highest and lowest spending CBSAs. Tucson, Arizona had the lowest spending and price ratios among all CBSAs, yet had a utilization rate in the highest quadrant. Similarly, in El Paso, Texas, the highest spending and price ratios coincide with the third lowest knee replacement utilization rate. Like the other treatments, there were outli-ers to the trends, such as Oklahoma City, Oklahoma, which had consistently low rates across the three measures, or Co-lumbus, Ohio, where the two indices and utilization rate were all slightly above average. More often than in the other two treatments, however, high spending and prices were associated with low utilization, and vice versa.
INTENSITY
The intensity index provides a concise measure of the composition of the pro-cedures used in the delivery of a given treatment. The treatment output was assumed to be constant (e.g., a new knee), but there could be variability in what was done to achieve that output. The intensity measure gives insight into how a certain treatment was delivered on average. A high intensity measure suggests that the number or type of the services being used to provide a treat-ment are higher or more resource inten-sive relative to the total population baseline.
A single measure was preferable for the purpose of the HMI, allowing for easy comparisons across CBSAs. It is worth noting, however, that it is possible to decompose the intensity measure into the various aspects of providing health care services that produce variations in intensity: the number, place, and type of services. The components of intensity were not analyzed specifically as part of the HMI, but are discussed in more de-tail in the “Intensity Decomposition” section.
For each of the three treatments, the summary statistics of the CBSA-level intensity measures are shown in Table 7. Compared to the other HMI measures, utilization as well as price and spending, the overall variation in the intensity indices was limited. The knee injection and ACL repair indices had some vari-ance measured by the interquartile range, 0.09 and 0.12, respectively. Due to the intensity indices medians being 0.99 and 1.00, the IQR differences of 110% for knee injections and 113% for ACL repairs were not trivial.
Minimal variation was found in knee replacement measure, the interquartile range was 0.03. This is consistent with the fact that the majority of services were provided in an inpatient setting and rolled up into a single DRG code in the claims data. However, some varia-tion did exist due to the variability in the physician services provided during a
knee replacement that are not included in the DRG bundle of services.
Table 8 presents the cross-treatment correlations of intensity indices. Posi-tive correlations should be expected if there are market specific factors influ-encing the delivery of all knee related services. However, the correlations do not explain why measures are related. For example, if variability in intensity was related to only a CBSA’s health, pos-itive correlations would be expected as areas with less healthy populations need to use more services for all treat-ments. Alternatively, positive correla-tions may also indicate preferences of health care providers to use newer types of services in an area.
There were moderate correlations be-tween all pairwise combinations of treatments, with the highest being 0.2918 between the ACL repair and knee replacement. Although there was not a strong correlation, the fact that there was a positive correlation maybe informative to stakeholders in CBSAs where there are particularly high measures for multiple treatments. Fur-ther investigation into what is driving the measures may be warranted to de-termine the cause and how to address it if necessary.
Knee Injection
Table 9 presents the intensity index val-ues for each of the three medical treat-
Table 7. CBSA-level Intensity Index Summary Statistics Knee Injection ACL Repair Knee Replacement
Average
(Standard Deviation)
0..98
(0.08)
1.00
(0.09)
1.00
(0.02)
Minimum 0.84 0.85 0.96
25th Percentile 0.94 0.93 0.99
50th Percentile 0.99 1.00 1.00
75th Percentile 1.03 1.05 1.02
Maximum 1.16 1.21 1.04
Source: HCCI, 2017.
Table 8. Intensity Index Correlation Coefficients Intensity Correlation
Knee Injection to ACL Repair 0.1732
Knee Injection to Knee Replacement 0.1974
ACL Repair to Knee Replacement 0.2918
Source: HCCI, 2017.

11
www.healthcostinstitute.org
ments for all 61 study CBSAs. Greensbo-ro-High Point, North Carolina and Des Moines-West Des Moines, Iowa had the lowest knee injection intensity index (0.84). Moreover, the five lowest indices were geographically distributed across five different states from North Carolina to Arizona. As shown in the summary statistics, only 25% of the study CBSAs had knee injection intensity index val-ues greater than 1.03, and only seven of the 61 CBSAs had an index value of 10% or greater than the national average. The highest index was 1.16 (Cape Coral-Fort Myers, Florida and Charlottesville, Virginia).
Notably, six of the seven Texas CBSA studied had intensity index values above the national average, ranging from 1.02 in El Paso to 1.14 in San Anto-nio-New Braunfels. While the Beaumont-Port Arthur CBSA (0.91) was in the lowest index quadrant, Texas still had the highest knee injection intensity in-
dex state average of 1.05.
ACL Repair
The ACL repair intensity index was sim-ilar to the knee injection index in range and magnitude of variation. There was not, however, much consistency be-tween indices – supporting the weak correlation result in Table 8. One differ-ence was the lack of geographic varia-tion amongst the lower ACL repair in-dex values. Three of the 4 CBSAs with the lowest intensity index levels were in Wisconsin, with Sheboygan as the mini-mum (0.85). Appleton, Wisconsin (1.10), being the state’s only CBSA above the national average, prevented Wisconsin from having the lowest state intensity index average; Missouri was slightly lower.
Conversely, the CBSA with the highest index value was El Paso, Texas (1.21). While Texas did have three of the 5
highest ACL repair intensity index val-ues, the state’s index values were not as tightly clustered as in the knee injection intensity index. Moreover, the highest knee injection Texas CBSAs were not the same set as the highest ACL repair Texas CBSAs. Finally, of note, the lowest knee injection intensity index CBSA, Greensboro-High Point, North Carolina, was the second highest ACL repair knee injection index.
Knee Replacement
As discussed earlier, because inpatient hospital services are rolled up into the single DRG code and the normalization prices based on codes in the intensity index’s calculation, there was very little variation at the CBSA-level for the knee replacement index. The lack of variance, results in few identifiable outliers or regional trends. However, Greensboro-High Point, North Carolina was once again at the extremes of the index value
INTENSITY DECOMPOSITION
One component of intensity is the number of procedures performed in providing a given treatment. For example, some CBSAs averaged less than 3 services per knee replacement, while other CBSAs averaged over 14. A second component of in-tensity is the place of service. Some services that can be provided either in a physician office setting or in an outpatient clinic setting. Similarly, some procedures can be performed in either an outpatient or an inpatient setting. The location most likely impacts prices, but may also have implications for how care is provided. Finally, intensity is affected by the type of services, which can vary in two ways: 1) procedures can vary based on technological or clinical specifications (e.g., a bare metal stent versus a drug eluting stent), 2) the type of procedure can vary based on the composition of services (e.g. use of either an MRI or X-ray in a preliminary diagnostic assessment). Note, there are potential interactions across these components as well. For example, a doctor may prescribe an MRI of a patient’s knee in order to determine if surgery is needed. Hypothetically, a doc-tor may determine from an X-ray that surgery is needed, and later order an MRI prior to scheduling a surgery. This would result in two procedures for the second patient compared to one for the first.
The influences underlying intensity are exemplified in each of the treatments studied as part of the HMI. For example, even though the majority of knee replacement spending is comprised from the services included in the DRG code, knee replace-ments had the most variation in number of services. The interquartile range for knee replacement services was nearly 4 ser-vices, with the 25th and 75th percentiles being 6.63 and 10.41, respectively. The collections of procedures comprising ACL repairs exemplified how place of service influences the intensity of a treatment. Of the average 6.96 total services, 3.79 were outpatient and 3.16 were physician. Moreover, among the procedures within a given place of service, there was variation in the number of services provided. There was more variation in the number of outpatient procedures than physician proce-dures, with almost a full service difference in their interquartile ranges – 2.76 services for outpatient procedures and 1.85 services for physician. The impact of types of services can be seen among the knee injection treatments. There were, on aver-age, approximately 3 procedures included in an injection – a physician visit, the knee injection, and a common injection drug. However, the choice of drug can vary and different types of drugs may require different doses, all of which may influence the total spending on a knee injection.
The utilization rates and intensity indices provide a useful references to stakeholders. As the examples discussed above show, further investigation of the composition of health care treatments may also help stakeholders identify and design ap-propriate policy solutions in local areas or market places.

12
www.healthcostinstitute.org
Table 9. Intensity Index by Medical Treatment
CBSA Name Knee Injection ACL Repair Knee Replacement
Appleton, WI 1.11 1.10 1.00
Atlanta-Sandy Springs-Roswell, GA 0.95 0.95 1.00
Augusta-Richmond County, GA-SC 0.96 0.98 1.01
Austin-Round Rock, TX 1.13 0.99 1.00
Baltimore-Columbia-Towson, MD 0.96 0.98 1.00
Baton Rouge, LA 1.01 1.01 1.02
Beaumont-Port Arthur, TX 0.91 1.02 1.02
Boulder, CO 0.86 1.03 1.02
Bridgeport-Stamford-Norwalk, CT 1.03 1.01 1.01
Cape Coral-Fort Myers, FL 1.16 1.06 1.02
Charlotte-Concord-Gastonia, NC-SC 0.93 1.14 1.00
Charlottesville, VA 1.16 1.09 1.01
Chicago-Naperville-Elgin, IL-IN-WI 1.11 0.92 0.98
Cincinnati, OH-KY-IN 1.02 1.01 1.02
Colorado Springs, CO 1.03 0.9 1.02
Columbus, OH 0.99 0.99 1.00
Corpus Christi, TX 1.05 0.98 1.02
Dallas-Fort Worth-Arlington, TX 1.07 1.14 1.01
Dayton, OH 0.91 1.06 1.01
Deltona-Daytona Beach-Ormond Beach, FL 0.96 0.91 1.01
Denver-Aurora-Lakewood, CO 1.03 1.05 1.03
Des Moines-West Des Moines, IA 0.84 0.99 0.97
El Paso, TX 1.02 1.21 1.00
Green Bay, WI 1.01 0.94 0.99
Greensboro-High Point, NC 0.84 1.20 0.96
Hartford-West Hartford-East Hartford, CT 0.95 0.92 1.00
Houston-The Woodlands-Sugar Land, TX 1.06 1.14 1.02
Jacksonville, FL 0.99 1.11 1.03
Kansas City, MO-KS 0.90 0.93 0.99
Knoxville, TN 0.99 1.07 0.99 Source: HCCI, 2017.
Note: Table continues.

13
www.healthcostinstitute.org
Table 9. Intensity Index by Medical Treatment (cont.)
CBSA Name Knee Injection ACL Repair Knee Replacement
Lakeland-Winter Haven, FL 0.95 1.01 1.01
Lexington-Fayette, KY 0.97 0.92 1.02
Louisville/Jefferson County, KY-IN 1.02 0.98 1.01
Memphis, TN-MS-AR 0.95 1.05 1.02
Miami-Fort Lauderdale-West Palm Beach, FL 0.97 0.98 0.98
Milwaukee-Waukesha-West Allis, WI 0.88 0.86 0.99
Minneapolis-St. Paul-Bloomington, MN-WI 1.05 1.03 1.02
Nashville-Davidson--Murfreesboro--Franklin, TN 0.99 1.00 0.98
New Haven-Milford, CT 1.02 0.89 0.99
New Orleans-Metairie, LA 1.04 1.14 1.01
New York-Newark-Jersey City, NY-NJ-PA 1.10 0.98 0.97
North Port-Sarasota-Bradenton, FL 0.99 1.05 1.00
Norwich-New London, CT 1.03 0.88 1.01
Oklahoma City, OK 0.97 1.10 0.98
Omaha-Council Bluffs, NE-IA 0.93 1.12 1.00
Orlando-Kissimmee-Sanford, FL 0.90 1.00 1.02
Palm Bay-Melbourne-Titusville, FL 0.97 0.99 1.03
Peoria, IL 0.96 1.02 1.03
Philadelphia-Camden-Wilmington, PA-NJ-DE-MD 0.89 0.88 0.97
Phoenix-Mesa-Scottsdale, AZ 0.94 0.96 1.01
Portland-South Portland, ME 1.00 0.94 0.99
Providence-Warwick, RI-MA 1.02 1.04 1.00
Racine, WI 0.94 0.88 0.98
San Antonio-New Braunfels, TX 1.02 0.91 0.97
Sheboygan, WI 1.14 0.90 1.00
St. Louis, MO-IL 0.88 0.85 0.98
Tampa-St. Petersburg-Clearwater, FL 0.95 1.01 1.00
Trenton, NJ 0.90 0.87 0.97
Tucson, AZ 0.85 0.91 1.02
Tulsa, OK 1.03 1.10 1.04
Washington-Arlington-Alexandria, DC-VA-MD-WV 0.92 1.00 0.99 Source: HCCI, 2017.

14
www.healthcostinstitute.org
range. Like the knee injection intensity index, it was the lowest index value of the 61 study CBSAs.
COMBINED RESULTS
Just as utilization and price can provide a better understanding of the forces driving spending, the intensity index can provide a better understanding of utili-zation, prices, and spending. Table 10 shows the correlations between the in-tensity index and the utilization rates and price and spending indices.
There was no correlation between in-tensity and utilization for ACL repair or knee replacement. In this case, a non-result can be informative. A lack of a relationship between intensity and utili-zation suggests there is not a pattern of using more intensive treatment to com-pensate for a lack of utilization of ser-vices. It is also appears not to be the case that more intensive treatments are needed in areas where there is more utilization, which could have implica-tions for spending.
Even though there is not a systematic pattern across the study CBSAs, there were areas with both similar or dissimi-lar ACL repair or knee replacement in-tensity indices and utilization rates. For example, Dallas-Fort Worth-Arlington, Texas had the 5th highest intensity index (1.14) and the 8th highest utilization rate (0.74) for ACL repairs. Conversely, Ba-ton Rouge, Louisiana had the 12th high-est intensity index (1.02), but the 12th lowest utilization rate (0.70) for knee replacements.
There was a slight negative correlation between intensity and utilization for knee injections – areas with lower utili-
zation had higher intensity, and vice versa. Although the correlation was rela-tively low, -0.1547, it provides potential-ly useful information about health care service use. CBSAs where the relations is stronger may be interested in why and what impact it has on spending. As with the other two treatments, there were examples of CBSAs with both simi-lar and dissimilar relative indices and rates. For example, Cape Coral-Fort Meyers, Florida had the 2nd highest in-tensity index (1.16) and the 14th highest utilization rate (32.86). On the contrary, Chicago-Naperville-Elgin, Illinois-Indiana-Wisconsin had the 5th highest intensity index (1.11), but the 3rd lowest utilization rate (14.43).
Between the intensity and price indices there was no correlation for ACL repairs or knee replacements. While the coeffi-cient estimate was negative (as com-pared to positive for utilization), the absolute values were both of the esti-mate were both less than 0.1000 of a zero relationship. The lack of a relation-ship between intensity and price is po-tentially informative. The results sug-gest that areas with higher or lower prices do not necessarily provide more or more resource intensive services. There is, however, a moderate positive correlation between intensity and spending indices for ACL repair. This implies that for that treatment areas with higher intensity have higher spend-ing. Given there is no evidence of an overall relationship with price though, the result is likely driven by the number of services used in providing the treat-ment.
The correlation between the knee injec-tion intensity and price indices was stronger than for knee injection similar
to the intensity-utilization correlation. However, the direction of the relation-ship reversed. There was slight positive correlation, 0.1734, between intensity and price. While the correlation was again relatively low, it suggests that there is a general patter of CBSAs with higher prices using more or more inten-sive services. This result is supported by the moderate correlation, 0.4371, be-tween knee injection intensity and spending indices. Areas with higher in-tensity had higher levels of spending. Taken together the correlations suggest that higher spending is likely driven in part by higher priced services.
Data and Methods
The eligible populations for both the utilization rates and intensity index in-cluded all ESI members with a positive dollar claim for one of the three trigger codes in 2013. Compared to the Part 1 inclusion criteria for identifying proce-dures associated with treatments, the inclusion criteria for the measures in Part 2 was less restrictive. As in Part 1, knee injection procedures that were part of a larger surgery were not includ-ed in the analyses in this brief. However, for both ACL repair and knee replace-ment, all relevant procedures identified were included in the analyses.5 The in-clusion criteria were used to identify the populations for both the utilization rate and intensity index calculations.
For the utilization rates, after isolating the data into the specific desired CPT or DRG codes, we counted treatments by claim lines for the knee injections and patient visits for both ACL repairs knee replacements. Claim line counts were used for injections because a patient could have received multiple injections
Table 10. Intensity Index—Utilization Rate and Intensity Index—Price
Index Correlations Intensity to Utilization Intensity to Price Intensity to Spending
Knee Injection -0.1547 0.1734 0.4371
ACL Repair 0.0245 -0.0568 0.2352
Knee Replacement 0.0424 -0.0933 -0.0030
Source: HCCI, 2017.

15
www.healthcostinstitute.org
(into the same knee or both knees) dur-ing a single visit. Patient visits were used as the basis for counting the other two treatments because that is con-sistent with how the procedures are provided. It may under count patients who received treatments on both knees on the same day, but inspection of the claims suggested that rarely occurred. In each CBSA, these counts (e.g., total num-ber of ACL repair patient visits) were divided by the total number of individu-al in the CBSA, creating a raw utilization rate.
We adjusted the raw utilization rates for the 61 study CBSAs by age and gender to account for differences in demographics that could lead to differences in utiliza-tion. We first calculated the utilization rates for 12 different age-gender catego-ries within each CBSA – dividing the total number of treatments by the total number of patients within each age-gender category.6 We then calculated similar age-gender utilization rates us-ing the total study population, resulting in 12 standard age-gender utilization rates. These standard utilization rates were multiplied by their corresponding age-gender category total patient counts within each CBSA, creating expected utilization counts within each CBSA if each CBSA had average age and gender populations.
The 12 actual age-gender utilization counts, within each CBSA, were summed and then divided by the sum of the 12 expected age-gender utilization counts in the same CBSA, resulting in an age-gender weight specific to each of the study’s CBSAs. Each CBSA’s weight was multiplied by the CBSA’s raw overall utilization rate, creating 61 utilization rates adjusted by age and gender. The adjusted utilization rates were then multiplied by 1,000 for reporting pur-poses.7
The intensity index was similar in over-all methodology to the spending and price indices reported in Part 1. Each of the 61 CBSA-level normalized average payments were divided by the total
study population’s normalized average payment, creating the intensity index. Within each treatment, the average price for each ‘CPT-Facility Type’ (or ‘DRG-Facility Type’ for inpatient claims) was calculated from the allowed pay-ments. The total population average prices were substituted for each corre-sponding ‘code-facility type’ claim line, normalizing the prices for each service. The normalized prices for all procedures performed on an individual patient on the day of the trigger code procedure, or, in the case of a knee replacement, the length of an inpatient admission, were summed and averaged over the number of occurrences identified for each treat-ment within every CBSA and across the total population.8
Limitations
The general limitations of the HMI medi-cal treatment utilization rates and inten-sity indices are the same as all the other HMI measures.9 The analyses were con-ducted with 2013 HCCI data, which were a convenience sample and may not be representative of the prices among the ESI population not included in the HCCI data set. Second, CBSAs are not necessarily a relevant market boundary for all health care analyses. Further-more, the results may not generalize to CBSAs not included in the study or to rural areas in the US. Third, the analyses focused on only one population in a sin-gle year.
In addition to the general limitations of the HMI measures, there are also limita-tions specific to utilization rates and intensity indices. In particular, it is im-portant not to immediately consider higher rates indicative of inefficient or unnecessary health care. The measures provide information about how many services or how much health care were provided. This information may be use-ful as a starting point for additional re-search or as inputs into related re-search. In comparing across CBSAs, we assume that the output is the same, for example, after the treatment all knee replacement patients will have a new
knee. The HMI measures do not account for the quality of the services provided and do not account for variations in out-comes. For example, there may also be differences in rates of follow-up surger-ies among patients who received a knee replacement. We believe outcome measures are also important but were outside of the scope of these measures. Additionally, the HMI measures did not control for health status of the underly-ing populations. We did adjust for differ-ences in demographics (age and gen-der), but other differences a CBSA’s pop-ulation makeup or the population’s comorbidities may influence the rates of a treatment and the intensity of the treatment provided.
Conclusion
Previous HMI briefs have shown that prices and spending vary across CBSAs, between broad service categories, and even over specific treatments. The measures reported in this brief demon-strate that the utilization and mix of ser-vices also vary. Taken together with measures of prices and spending, the HMI utilization rates and intensity indi-ces exemplify the complexity and specif-ic nature of health care marketplaces. Hopefully these measures can be used to initiate further research or be used in more focused research to continue to learn about health care markets.
Endnotes
1. Overall medical category price levels were calculated in Healthy Marketplace Index: Medical Service Category Price Index. See, Health Care Cost Institute. Healthy Marketplace Index: Medical Ser-vice Category Price Index. Health Care Cost Institute, Apr. 2016 Web.
2. Additional details regarding the popu-lation and geographic units of analysis are available in Healthy Marketplace Index: Medical Service Category Price Index. See, Health Care Cost Institute. Healthy Marketplace Index: Medical Ser-

16
www.healthcostinstitute.org
vice Category Price Index. Health Care Cost Institute, Apr. 2016 Web.
3. The total allowed amount for each claim line was used to find each ‘code-facility’ combination’s national average price. An allowed amount per unit was not feasibly calculated for this report. Because of this, the national average price used assumes both the average unit price and the average number of units for each ‘code-facility’ combina-tion.
4. Health Care Cost Institute. Healthy Marketplace Index: Medical Treatment–Part1: Spending and Price Indices. Health Care Cost Institute, May 2016 Web.
5. In Healthy Marketplace Index: Medi-cal Treatment–Part 1: Spending and Price Indices, additional inclusion criteria were used in determining the ACL re-pair and knee replacement populations. Only patients with a single arthroscopy CPT code on the day of their ACL repair were included. For knee replacements, only the first knee replacement a patient had in the calendar year was included. These criteria were not used in this cur-rent issue brief. See, Health Care Cost Institute. Healthy Marketplace Index: Medical Treatment–Part1: Spending and Price Indices. Health Care Cost Institute, May 2016 Web.
6. The population was divided up into 6 distinct age bands. The 6 age bands were : Under the Age of 18, Ages 18-24, Ages 25-34, Ages 35-44, Ages 45-54, and Ages 55-64. Each age band was subse-quently split up into male and female groupings, creating 12 distinct ‘age-
gender’ categories. These 12 categories were used to adjust the study’s utiliza-tion rates by age and gender, according-ly.
7. The utilization adjustment methodol-ogy was based off of similar indirect adjustments used for the Dartmouth Atlas Project. “An Example of Indirect Adjustment The Dartmouth Atlas,” Available at: http://www.dartmouthatlas.org/downloads/methods/indirect_adjustment.pdf
8. The trigger codes for each treatment were reported in Part 1. Health Care Cost Institute. Healthy Marketplace In-dex: Medical Treatment–Part1: Spending and Price Indices. Health Care Cost Insti-tute, May 2016 Web.
9. Additional details can be found in the Limitation sections of the previous Healthy Marketplace Index briefs. See, Health Care Cost Institute. Healthy Mar-ketplace Index: Medical Service Category Price Index. Health Care Cost Institute, Apr. 2016 Web; or Health Care Cost In-stitute. Healthy Marketplace Index: Med-ical Treatment–Part1: Spending and Price Indices. Health Care Cost Institute, May 2016 Web.
Authors Eric Barrette and Kevin Kennedy
571-257-1584
Health Care Cost Institute, Inc. 1100 G Street NW, Suite 600 Washington, DC 20005 202-803-5200
Acknowledgements This HCCI research project was independently initiated by HCCI and is part of the HCCI research agenda
Support for this project was provided in part by the Robert Wood Johnson Foundation. The views expressed here do not necessarily reflect the views of the Foundation.
Copyright 2017 Health Care Cost Institute, Inc. Unless explicitly noted, the content of this report is licensed under a Creative Commons Attribution Non-Commercial No Derivatives 4.0 License