health status of children entering kindergarten in nevadanic.unlv.edu/files/khs year 7...
TRANSCRIPT
Health Status of Children Entering
Kindergarten in Nevada
This project was completed in collaboration with the following: All Nevada County School Districts
Nevada School District Superintendents
Nevada Division of Public and Behavioral Health
This publication was supported by the Nevada State Division of Public and Behavioral Health through
Grant Number B04MC26680 from the U.S. Department of Health and Human Service, Health Resources
and Services Administration. Its contents are solely the responsibility of the authors and do not
necessarily represent the official views of the Division nor the U.S. Department of Health and Human
Service Health Resources and Services Administration.
University of Nevada, Las Vegas
School of Community Health Sciences
Results of the
2014-2015 (Year 7)
Nevada
Kindergarten
Health Survey
June 2015

Nevada Institute for Children’s Research and Policy, UNLV April 2015
Results of the 2014-2015 Nevada Kindergarten Health Survey Page 2
The Nevada Institute for Children's Research and Policy (NICRP) is a not-for-profit, non-
partisan organization dedicated to advancing children's issues in Nevada.
As a research center within the UNLV School of Community Health Sciences, NICRP is
dedicated to improving the lives of children through research, advocacy, and other specialized
services.
NICRP's History: NICRP started in 1998 based on a vision of First Lady Sandy Miller. She
wanted an organization that could bring credible research and rigorous policy analysis to
problems that confront Nevada's children. But she didn't want to stop there; she wanted to
transform that research into meaningful legislation that would make a real difference in the lives
of our children.
NICRP's Mission: The Nevada Institute for Children's Research and Policy (NICRP) looks out
for Nevada's children. Our mission is to conduct community-based research that will guide the
development of programs and services for Nevada's children. For more information regarding
NICRP research and services, please visit our website at: http://www.nic.unlv.edu
NICRP Staff Contributors:
Amanda Haboush-Deloye, Ph.D.
Chief Research Associate
Patricia Haddad
Research Assistant
Mirzah Trejo, BA
Research Assistant
Dawn L. Davidson, Ph.D.
Senior Research Associate
Tara Phebus, M.A.
Executive Director
Nevada Institute for Children’s Research and Policy
School of Community Health Sciences, University of Nevada, Las Vegas
4505 S. Maryland Parkway, 453030
Las Vegas, NV 89154-3030
(702) 895-1040
http://nic.unlv.edu
Nevada Institute for Children’s Research and Policy, UNLV April 2015
Results of the 2014-2015 Nevada Kindergarten Health Survey Page 3
TABLE OF CONTENTS
Executive Summary ........................................................................................................................6
Introduction .....................................................................................................................................8
Methodology ........................................................................................................................8
Limitations to the Study .......................................................................................................9
Survey Results ...............................................................................................................................11
Response Rates ....................................................................................................................11
Demographics .....................................................................................................................14
Insurance Status ..................................................................................................................19
Access to Healthcare ............................................................................................................23
Routine Care .......................................................................................................................25
Care for Illness or Injury ......................................................................................................28
Medical Conditions .............................................................................................................30
Dental Care .........................................................................................................................32
Mental Health.......................................................................................................................33
Weight and Healthy Behaviors ............................................................................................34
Appendix A: Summary of the 2014-2015 Survey Results by County ......................................50
Appendix B: Comparison of Survey Results by Survey Year ..................................................56
Appendix C: Survey Instrument .................................................................................................63
Appendix D: References ...............................................................................................................65

TABLE OF CONTENTS
Nevada Institute for Children’s Research and Policy, UNLV April 2015
Results of the 2014-2015 Nevada Kindergarten Health Survey Page 4
List of Tables
Table 1.1: Survey Response Rate by School District .........................................................11
Table 1.2: Kindergarten Unaudited Enrollment and Response Rate by School District .....12
Table 2.1: Average Preschool Hours of Attendance ............................................................18
Table 10.1: Weight Status Categories by BMI Percentile Ranges .....................................34
Table 10.2: Weight Status Category Calculations Based on BMI Values ..........................35
Table 10.3: Average Television Watched During a Weekday ...........................................40
Table 10.4: Average Sleep per Night for the State of Nevada .............................................49
Table 11.1: Comparison of 2014-2015 Weighted Data by County .....................................50
Table 11.2: Comparison of 2012-2013 through 2014-2015 Weighted Data .......................56
List of Figures Figure 1.1: Survey Participation by School District ............................................................13
Figure 1.2: Survey Response Rate Among All Rural Counties ...........................................13
Figure 2.1: Weighted Survey Data by School District ........................................................14
Figure 2.2: Annual Household Income by School Year .....................................................15
Figure 2.3: Child’s Race/Ethnicity .....................................................................................16
Figure 2.4: Child’s Type of Preschool Setting During Last Twelve Months .....................17
Figure 3.1: Types of Children’s Health Insurance Coverage by School Year ....................19
Figure 3.2: Annual Household Income by Child’s Insurance Status ..................................21
Figure 3.3: Child’s Race/Ethnicity by Child’s Insurance Status ........................................22
Figure 4.1: Types of Barriers When Accessing Healthcare for Child .................................23
Figure 4.2: Access to Support Services by Child’s Race/Ethnicity .....................................24
Figure 5.1: Child’s Routine Check-Ups and Presence of Primary Care Provider ..............25
Figure 5.2: Presence of Primary Care Provider by Child’s Insurance Status .....................26
Figure 5.3: Child’s Routine Check-Ups by Presence of Primary Care Provider (PCP) ......27
Figure 6.1: Number of Emergency Room Visits for Non-Life-Threatening Care .............28
Figure 6.2: Percentage of Emergency Room Visits for Non-Life-Threatening Care by
Child’s Insurance Status ...................................................................................29
Figure 7.1: Types of Medical Conditions in Children .........................................................30
Figure 7.2: Developmental Screening by Child’s Race/Ethnicity ...................................... 31
Figure 8.1: Child’s Dental Visit ...........................................................................................32
Figure 9.1: Trouble Obtaining Mental Health Services by County ....................................33
Figure 10.1: Child’s Weight Status Category ......................................................................36
Figure 10.2: Race/Ethnicity of Participants with a Valid Body Mass Index .......................37
Figure 10.3: Child’s Weight Status Category by Child’s Race/Ethnicity ..........................38
Figure 10.4: Child’s Weight Status Category by Amount of Physical Activity
Per Week ........................................................................................................39
Figure 10.5: Child’s Weight Status Category by Hours of Television Watched on
Average School Day ......................................................................................41
Figure 10.6: Child’s Weight Status Category by Hours of Video Game Playing on
Average School Day.. ......................................................................................42
Figure 10.7: Child’s Weight Status Category by Number of Non-Diet Sodas Consumed in
a Week ............................................................................................................43
TABLE OF CONTENTS
Nevada Institute for Children’s Research and Policy, UNLV April 2015
Results of the 2014-2015 Nevada Kindergarten Health Survey Page 5
Figure 10.8: Child’s Weight Status Category by Number of Diet Sodas Consumed in a
Week ................................................................................................................44
Figure 10.9: Child’s Weight Status Category by Number of Juice Drinks Consumed in a
Week ..............................................................................................................45
Figure 10.10: Infancy Feeding Habits .................................................................................47
Figure 10.11: Child’s Weight Status Category by Infancy Feeding Habits ........................48
Nevada Institute for Children’s Research and Policy, UNLV April 2015
Results of the 2014-2015 Nevada Kindergarten Health Survey Page 6
EXECUTIVE SUMMARY
To gather data on the health status of children entering the school system and to better track student health
status, the Nevada Institute for Children’s Research and Policy (NICRP), in partnership with all Nevada
School Districts and the Nevada Division of Public and Behavioral Health, conducted a health survey of
children entering kindergarten in Nevada. The goal of this study was to:
longitudinally quantify the health status of children as they enter school,
identify specific areas for improvement to potentially increase academic success, and
provide local information to policy makers to guide decisions that impact children’s health.
In the fall of 2014, NICRP distributed questionnaires to all public elementary schools in the state, except
Clark County School District, who requested that a sample of their schools be surveyed. The survey had
an overall response rate of 30.6 percent, with a total of 7,480 surveys received from parents in all 17
school districts in Nevada. The data for this year and the past two were weighted so that the survey data
collected represent each district and all children in the state (32,163). Weighted data are presented
throughout this report to compare Clark County (73.6 percent), Washoe County (14.6 percent) and the
rural counties combined (11.8 percent) as well as the past two survey years. The following tables contain
some of the key findings of the survey. Please note that for each table, red arrows indicate what we think
is a negatie change, green indicates positive change, and yellow indicates no change.
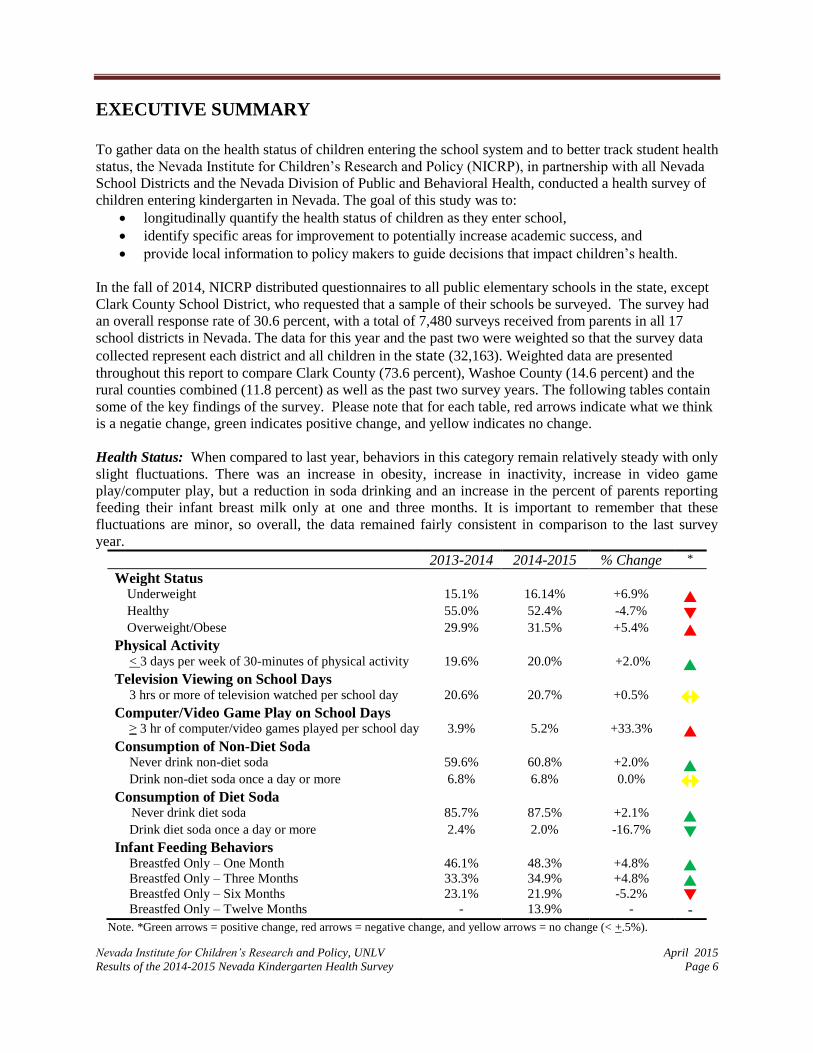
Health Status: When compared to last year, behaviors in this category remain relatively steady with only
slight fluctuations. There was an increase in obesity, increase in inactivity, increase in video game
play/computer play, but a reduction in soda drinking and an increase in the percent of parents reporting
feeding their infant breast milk only at one and three months. It is important to remember that these
fluctuations are minor, so overall, the data remained fairly consistent in comparison to the last survey
year.
2013-2014 2014-2015 % Change *
Weight Status Underweight 15.1% 16.14% +6.9% Healthy 55.0% 52.4% -4.7% Overweight/Obese 29.9% 31.5% +5.4%
Physical Activity < 3 days per week of 30-minutes of physical activity 19.6% 20.0% +2.0%
Television Viewing on School Days 3 hrs or more of television watched per school day 20.6% 20.7% +0.5%
Computer/Video Game Play on School Days ≥ 3 hr of computer/video games played per school day 3.9% 5.2% +33.3%
Consumption of Non-Diet Soda Never drink non-diet soda 59.6% 60.8% +2.0% Drink non-diet soda once a day or more 6.8% 6.8% 0.0%
Consumption of Diet Soda Never drink diet soda 85.7% 87.5% +2.1%
Drink diet soda once a day or more 2.4% 2.0% -16.7% Infant Feeding Behaviors
Breastfed Only – One Month 46.1% 48.3% +4.8% Breastfed Only – Three Months 33.3% 34.9% +4.8% Breastfed Only – Six Months 23.1% 21.9% -5.2% Breastfed Only – Twelve Months - 13.9% - -
Note. *Green arrows = positive change, red arrows = negative change, and yellow arrows = no change (< +.5%).

EXECUTIVE SUMMARY
Nevada Institute for Children’s Research and Policy, UNLV April 2015
Results of the 2014-2015 Nevada Kindergarten Health Survey Page 7
Household Income: There were slight fluctuations in data from last year, but overall incomes remained
steady in all three categories.
2013-2014 2014-2015 % Change *
Household Income Less than $25,000 per year 33.4% 33.2% -0.6% Less than $45,000 per year 55.6% 55.0% -0.6% $45,000 or more per year 44.3% 45.0% +1.6%
Note. *Green arrows = positive change, red arrows = negative change, and yellow arrows = no change (< +.5%).
Insurance Status: The percentage of uninsured children dramatically decreased from last year. Medicaid
coverage continues to increase at a greater rate than enrollment in private insurance which decreased this
past year.
2013-2014 2014-2015 % Change *
Insurance Status Uninsured 12.6% 7.6% -39.7% Private Insurance 50.0% 48.4% -3.2% Medicaid 25.9% 31.3% +20.8% Nevada Check-up 6.5% 6.7% +3.1%
Note. * Green arrows = positive change, red arrows = negative change, and yellow arrows = no change (< +.5%).
Routine Care: As compared to last year, the percentage of children receiving a routine check-up
increased while having a primary care provider and visiting the dentist remained consistent.
2013-2014 2014-2015 % Change *
Routine Care Had a routine medical checkup in last 12 months 85.9% 87.0% +1.3% Have a primary care provider 86.4% 86.4% 0.0% Have been to the dentist in past 12 months 74.0% 74.8% +1.1%
Note. * Green arrows = positive change, red arrows = negative change, and yellow arrows = no change (< +.5%).
Access to Health Care: Compared to last year, fewere respondents this year indicated that they had
barriers to accessing health care. For those that reported having barriers, there was a decrease in barriers
due to lack of insurance and lack of money. The percentage of respondents trying to access mental health
care remained fairly consistent over the past year, and there was a decrease in the percentage of
respondents having trouble obtaining these services.
2013-2014 2014-2015 % Change *
Barriers to Accessing Health Care**
None 72.1% 79.4% +7.6% Lack of Transportation 3.4% 3.4% 0.0% Lack of Insurance 10.1% 7.3% -27.7% Lack of Quality Medical Providers 5.2% 5.1% -1.9% Lack of Money/Financial Resources 13.8% 10.4% -24.6% Have tried to access mental health services 4.2% 4.4% +4.8%
Had trouble obtaining mental health services 35.9% 31.8% -11.4% Note: *Green arrows = positive change, red arrows = negative change, and yellow arrows = no change (< +.5%).
**Since respondents could select more than one barrier, totals may add up to more than 100%.
For more detailed information on all survey items, please see Appendix B of the full report.
Data for specific counties and/or schools may also be available upon request.
Please contact NICRP at (702) 895-1040 for additional information.
Nevada Institute for Children’s Research and Policy, UNLV April 2015
Results of the 2014-2015 Nevada Kindergarten Health Survey Page 8
INTRODUCTION
Academic achievement for children is vital to their success in life. Those that do well in school
have greater opportunities for post-secondary education, and later have better prospects for
employment. One of the major factors that can affect a child’s academic achievement is his or
her health status. Academic outcomes and health conditions are consistently linked in the
literature (Eide, Showalter, & Goldhaber, 2010; Taras & Potts-Datema, 2005). Children with
poor health status, especially those with common chronic health conditions such as obesity or
asthma have increased numbers of school absences, thus more academic deficiencies than those
students with a good health status (Basch, 2010). In addition, children that have health insurance
have fewer absences from school, as compared to children without health insurance (Yeung,
Gunton, Kalbacher, Seltzer, & Wesolowski, 2010). In a study examining school achievement,
when compared with children with low absenteeism, children with high absenteeism had lower
academic performance (Farrington, Roderick, Allensworth, Ngaoka, Keyes, Johnson &
Beechum, 2012). Therefore, to increase the likelihood for academic success in children, their
health concerns need to be addressed. Preventative care is crucial to a child’s ability to succeed
in school.
According to data from the KIDS COUNT Data Center at the Annie E. Casey Foundation
(2013), 13 percent of Nevada’s teens (ages 16-19) are not in school and are not working, and 42
percent are not graduating on time compared to 8 percent and 22 percent nationally. The
National Dropout Prevention center lists poor attendance and low achievement as two of the
significant risk factors for school dropout (Hammond, Linton, Smink, & Drew, 2007).
Additionally, studies examining school dropout rates indicate that early intervention is necessary
to prevent students from dropping out of school. Middle and high school students that drop out
likely stopped being engaged in school much earlier in their academic career. Therefore, early
prevention and intervention is crucial to improving graduation rates. Ensuring that children have
their basic needs met, including receiving adequate health care, can directly impact a child’s
academic achievement as well as increase their likelihood for high school graduation.
To gain information about the health status of children entering the school system and better
track student health status, in 2008 the Nevada Institute for Children’s Research and Policy
(NICRP) partnered with the state’s 17 school districts, the Southern Nevada Health District, and
the Nevada Division of Public and Behavioral Health (NDPBH) to conduct an annual health
survey examining the health status as well as health insurance status of Nevada’s children
entering kindergarten. The goal of the study is to longitudinally quantify the health status of
children as they enter school so that specific areas for improvement can be identified and
potentially increase academic success among Nevada’s students. This report reflects the results
of the seventh year of the Annual Kindergarten Health Survey.
METHODOLOGY
The original survey used in this study was created in 2008 in partnership with the Clark County
School District (CCSD) and the Southern Nevada Health District (SNHD). The survey was
intended to provide a general understanding of the overall health status of children when they
INTRODUCTION
Nevada Institute for Children’s Research and Policy, UNLV April 2015
Results of the 2014-2015 Nevada Kindergarten Health Survey Page 9
enter school. The original short questionnaire was developed in both English and Spanish and
consisted of 22 questions. Small revisions to the survey have occurred each year; therefore, data
for all items presented in this report may not be available for all seven years. The current version
of the survey consists of 28 questions (13 demographic questions and 15 health related
questions) and, like the original survey, is available in both English and Spanish.
In the Fall of 2014, questionnaires were distributed to kindergarten teachers in all public
elementary schools in the state, with the exception of schools in the Clark County School
District. The Clark County School District requested that only a sample of their schools be
included in the survey to reduce burden on school staff. Therefore, surveys were sent to a
randomly selected sample of schools (n = 139) in the district. This sample size was determined
based on a 5 percent margin of error in survey results. In addition, schools were divided by Title
I status, and a representative random sample of both Title I eligible and non-Title I eligible
schools was selected. Schools qualify as Title I eligible when they serve large populations of
children from low income families (typically a minimum of 40%) and receive supplemental
federal funding from the Department of Education. Title I eligibility status was provided by the
Clark County School District. It was determined that 159 of the 215 elementary schools in the
district (74%) were Title I eligible schools. One hundred and three schools (74 percent of the
target 139 schools in the sample) were randomly selected from a list of all Title I eligible schools
using the statistical analysis program PASW Statistics 22.0. The remaining 36 schools (26
percent of the needed sample of 139) were randomly selected from a list of schools that were not
Title I eligible.
For all school districts in Nevada, surveys were distributed to parents during the first part of the
school year. Parents who chose to participate, completed the survey and then turned it in to
either the school office or their child’s teacher. The surveys were then returned to NICRP via
mail. The parent could also mail the survey to NICRP directly.
In efforts to increase the response rate from the previous year, this year extra measures were
taken to ensure that all schools had received their surveys in the mail. In August, after surveys
were sent to all school districts, each school was called to verify receipt of the survey materials.
Many schools verified receipt while others could not account for the surveys and it was difficult
who would know whether or not surveys were received. For schools that were sure they had not
received the surveys, they were asked if they wanted to participate and have surveys resent,
which was done upon request. In addition to the calls in August, one more set of phone calls
were made in mid-October to schools in which we had not received any surveys. Once on the
phone we attempted to verify if the surveys were distributed to parents and to determine if the
school had any questions or problems with the survey in which we could be of service. In some
cases, these phone calls reminded the school to distribute the surveys or just to send in collected
surveys in some had been received.
Once surveys were received by NICRP, each survey was assigned a unique identification number
by NICRP staff to aid in tracking of survey responses. All survey responses received as of
January 31, 2015 were analyzed using PASW Statistics software version 22.0 (SPSS IBM, New
York, U.S.A). A weight based on county was applied to each record to adjust for student
nonresponse. The weights are scaled so that the weighted count of students equals each county’s

INTRODUCTION
Nevada Institute for Children’s Research and Policy, UNLV April 2015
Results of the 2014-2015 Nevada Kindergarten Health Survey Page 10
population of kindergarten students as of count day for each survey year listed in this report.
Therefore, the responses received from the 7,480 respondents represents a total of 32,163
kindergarten students in the State of Nevada. Weighted estimates are representative of all
kindergarten students in the state of Nevada, as well as for Clark County, Washoe County, and
the combination of all rural counties. This report only displays weighted results that are
representative of the regions and the state.
LIMITATIONS TO THE STUDY
As in all research studies, there are limitations to the data collected. First, all information
contained in this report was self-reported by each parent or guardian. The information provided
relies on the memory and honesty of the survey respondents. Additionally, several of the
responses were left blank on the surveys received. All of the surveys received were included in
the analyses, but it is important to note when reading percentages presented in the figures below
that not all respondents answered all questions. Therefore some figures may represent all cases
(indicating all responded to the question), while others may have a smaller number of total cases
because of respondents leaving that particular question blank. All percentages calculated for this
report are based on the total weighted number of people answering the question, rather than the
total number of people who completed a survey. Third, the school district survey data apply only
to children who attend kindergarten and therefore are not representative of all persons in that age
group. However, based on the number of 5 year olds that were projected to reside in the state of
Nevada in 2013 (making them 6 years old in 2014 and eligible for kindergarten which was
approximately 39,809 children) (Nevada State Demographer, 2013) and the number of children
enrolled on count day (39,739) (Nevada Department of Education, personal communication,
May 5, 2015), it appears that only a very small percentage of children do not attend kindergarten.
Nevada Institute for Children’s Research and Policy, UNLV April 2015
Results of the 2014-2015 Nevada Kindergarten Health Survey Page 11
SURVEY RESULTS Presented in the figures below are the basic frequencies (counts and percentages) of responses
for all questions included in the survey. Cross tabulations were also calculated for selected
variables to provide additional information on specific topics. A chi-square statistic was also
calculated to test for the statistical significance of the differences provided in the cross tabulation
tables. Percentage calculations are presented with figures as appropriate. In addition, the 2014-
2015 data were compared across counties (Clark, Washoe, rural counties combined) for the
current data collection period, and with data from the previous two years. All data presented after
the response rates will be weighted data.
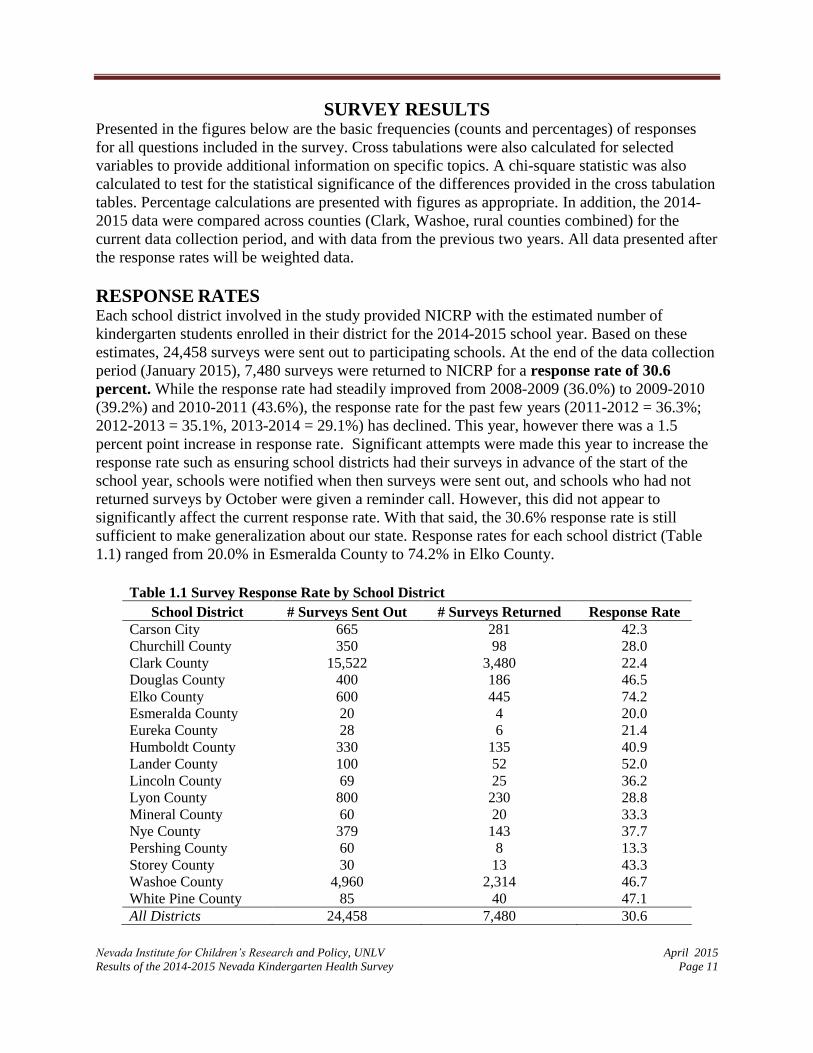
RESPONSE RATES Each school district involved in the study provided NICRP with the estimated number of
kindergarten students enrolled in their district for the 2014-2015 school year. Based on these
estimates, 24,458 surveys were sent out to participating schools. At the end of the data collection
period (January 2015), 7,480 surveys were returned to NICRP for a response rate of 30.6
percent. While the response rate had steadily improved from 2008-2009 (36.0%) to 2009-2010
(39.2%) and 2010-2011 (43.6%), the response rate for the past few years (2011-2012 = 36.3%;
2012-2013 = 35.1%, 2013-2014 = 29.1%) has declined. This year, however there was a 1.5
percent point increase in response rate. Significant attempts were made this year to increase the
response rate such as ensuring school districts had their surveys in advance of the start of the
school year, schools were notified when then surveys were sent out, and schools who had not
returned surveys by October were given a reminder call. However, this did not appear to
significantly affect the current response rate. With that said, the 30.6% response rate is still
sufficient to make generalization about our state. Response rates for each school district (Table
1.1) ranged from 20.0% in Esmeralda County to 74.2% in Elko County.
Table 1.1 Survey Response Rate by School District
School District # Surveys Sent Out # Surveys Returned Response Rate
Carson City 665 281 42.3
Churchill County 350 98 28.0
Clark County 15,522 3,480 22.4
Douglas County 400 186 46.5
Elko County 600 445 74.2
Esmeralda County 20 4 20.0
Eureka County 28 6 21.4
Humboldt County 330 135 40.9
Lander County 100 52 52.0
Lincoln County 69 25 36.2
Lyon County 800 230 28.8
Mineral County 60 20 33.3
Nye County 379 143 37.7
Pershing County 60 8 13.3
Storey County 30 13 43.3
Washoe County 4,960 2,314 46.7
White Pine County 85 40 47.1
All Districts 24,458 7,480 30.6

RESPONSE RATES
Nevada Institute for Children’s Research and Policy, UNLV April 2015
Results of the 2014-2015 Nevada Kindergarten Health Survey Page 12
NICRP was able to calculate a response rate based on the number of surveys returned and the
number of kindergartners enrolled within each school district by obtaining the unaudited
enrollment numbers for each school district from the Department of Education. This information
would indicate how much of the actual kindergarten sample was surveyed. This unaudited
enrollment response rate was then compared to the response rate based on the number of surveys
distributed within each school district.
For the majority of districts, the number of surveys distributed was similar, but slightly higher
than the unaudited enrollment data and the response rate varied between 2% and 10%. However,
for Esmeralda County, the response rate differed by almost 40% with the unaudited enrollment
response rate being higher than the survey distribution response rate. This indicates that
Esmeralda County overestimated their enrollment. In Elko County, response rates differed by
about 20%, with the survey distribution response rate being higher than the unaudited enrollment
response rate.
Despite the differences, the overall response rate for the unaudited enrollment response rate and
the survey distribution response rate only varied by 0.6 percentage points. Some deviation
between estimated and actual enrollment numbers is expected, and based on the similarities in
response rates for the state as a whole, the response rate based on the survey distribution appears
to be valid for all districts combined.
Table 1.2 Kindergarten Unaudited Enrollment and Response Rate by School District
School District
Unaudited
Enrollment
# Surveys
Sent Out
Unaudited Enrollment
Response Rate
Survey
Distribution
Response Rate
Carson City 635 665 44.3% 42.3%
Churchill County 265 350 37.0% 28.0%
Clark County 14,210 15,522 24.5% 22.4%
Douglas County 400 400 46.5% 46.5%
Elko County 818 600 54.4% 74.2%
Esmeralda County 7 20 57.1% 20.0%
Eureka County 25 28 24.0% 21.4%
Humboldt County 272 330 49.6% 40.9%
Lander County 101 100 51.5% 52.0%
Lincoln County 61 69 41.0% 36.2%
Lyon County 604 800 38.1% 28.8%
Mineral County 46 60 43.5% 33.3%
Nye County 369 379 38.8% 37.7%
Pershing County 47 60 17.0% 13.3%
Storey County 26 30 50.0% 43.3%
Washoe County 4,692 4,960 49.3% 46.7%
White Pine County 112 85 35.7% 47.1%
All Districts 22,690 24,458 33.0% 30.6%

RESPONSE RATES
Nevada Institute for Children’s Research and Policy, UNLV April 2015
Results of the 2014-2015 Nevada Kindergarten Health Survey Page 13
Survey Participation by School District
Figure 1.1 illustrates the participation of Washoe, Clark, and Rural Counties. A total of 7,480
surveys were returned, with 46.5% of those surveys completed by parents in Clark County,
30.9% from Washoe County, and the remaining 22.5% from the rural counties. This year, Clark
County had a much lower response rate (60.2%) compared to previous years and Washoe County
had a much higher response rate (26.4%). It is unknown why Clark County’s rates decreased so
substantially, however, in Washoe County, their district made a concerted effort to distribute the
survey to all of their schools and encouraged participation.
Figure 1.2 illustrates county-specific participation for only rural counties, which combined,
represents 22.4 percent of the total respondents.
46.5%
30.9%
22.5%
Figure 1.1: Survey Participation by School District(2014-2015 n = 7,480 )
Clark County
Washoe County
Rural Counties
16.7%
5.8%
11.0%
26.4%
0.2% 0.4%
8.0%
3.1%1.5%
13.6%
1.2%
8.5%
0.5% 0.8%2.4%
0.0%
5.0%
10.0%
15.0%
20.0%
25.0%
30.0%
Figure 1.2: Survey Response Rate Among All Rural Counties
(2014-2015 n =1,686 )
Nevada Institute for Children’s Research and Policy, UNLV April 2015
Results of the 2014-2015 Nevada Kindergarten Health Survey Page 14
DEMOGRAPHICS
The survey was created to be one page in length, with one side presented in English and the
reverse side presented in Spanish. Of the 7,480 respondents that returned the surveys, 85.8
percent completed the English version and 14.2 percent completed the Spanish version.
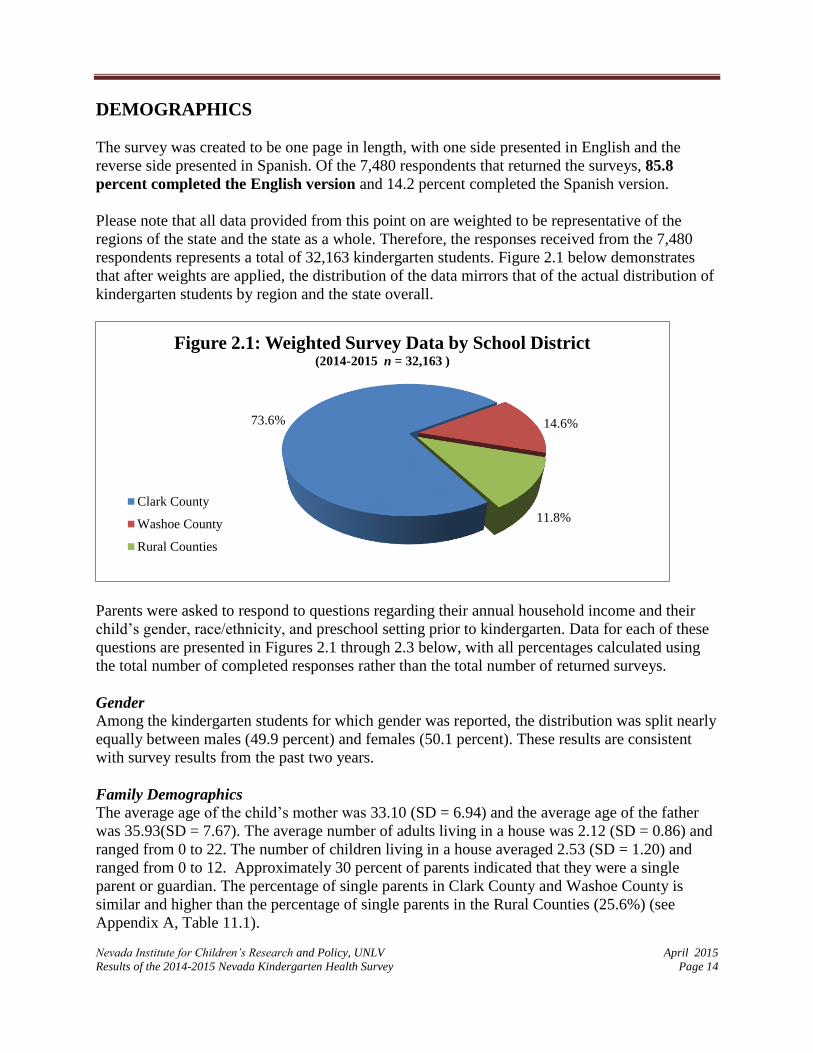
Please note that all data provided from this point on are weighted to be representative of the
regions of the state and the state as a whole. Therefore, the responses received from the 7,480
respondents represents a total of 32,163 kindergarten students. Figure 2.1 below demonstrates
that after weights are applied, the distribution of the data mirrors that of the actual distribution of
kindergarten students by region and the state overall.
Parents were asked to respond to questions regarding their annual household income and their
child’s gender, race/ethnicity, and preschool setting prior to kindergarten. Data for each of these
questions are presented in Figures 2.1 through 2.3 below, with all percentages calculated using
the total number of completed responses rather than the total number of returned surveys.
Gender
Among the kindergarten students for which gender was reported, the distribution was split nearly
equally between males (49.9 percent) and females (50.1 percent). These results are consistent
with survey results from the past two years.
Family Demographics
The average age of the child’s mother was 33.10 (SD = 6.94) and the average age of the father
was 35.93(SD = 7.67). The average number of adults living in a house was 2.12 (SD = 0.86) and
ranged from 0 to 22. The number of children living in a house averaged 2.53 (SD = 1.20) and
ranged from 0 to 12. Approximately 30 percent of parents indicated that they were a single
parent or guardian. The percentage of single parents in Clark County and Washoe County is
similar and higher than the percentage of single parents in the Rural Counties (25.6%) (see
Appendix A, Table 11.1).
73.6% 14.6%
11.8%
Figure 2.1: Weighted Survey Data by School District(2014-2015 n = 32,163 )
Clark County
Washoe County
Rural Counties

DEMOGRAPHICS
Nevada Institute for Children’s Research and Policy, UNLV April 2015
Results of the 2014-2015 Nevada Kindergarten Health Survey Page 15
Annual Household Income
According to the U.S. Census Bureau, Small Area Income and Poverty Estimates, the 2008-2012
estimated median household income in Nevada was $54,083. This median income represents the
middle value of a distribution, and is the best measure of central tendency to reduce the impact of
outliers (very high or very low incomes) in the distribution. Compared to the median income
listed for Nevada, 55 percent of all respondents reported an annual income below $45,000
(Figure 2.2 below).
Compared to previous survey years:
The number of families with annual income levels below $25,000 has decreased by .2
percentage points since last year, although there was a decrease in families earning less
than $15,000 per year.
Over the past three years, there have been minor fluctuations in both directions in all
income categories.
The largest change among all the categories has been a 1.4 percentage point increase the
number of families earning over $95,000.
$0-
$14,999
$15,000
-
$24,999
$25,000
-
$34,999
$35,000
-
$44,999
$45,000
-
$54,000
$55,000
-
$64,999
$65,000
-
$74,999
$75,000
-
$84,999
$85,000
-
$94,999
$95,000
+
2012-2013 18.1 15.6 12.9 9.3 8.0 6.3 6.1 6.0 4.0 13.7
2013-2014 18.0 15.5 12.6 9.6 7.6 6.7 6.1 5.5 4.0 14.4
2014-2015 17.3 15.9 13.1 8.7 7.5 6.3 5.7 5.8 3.9 15.8
0.0
5.0
10.0
15.0
20.0
% o
f R
esp
ond
ents
Figure 2.2: Annual Household Income by School Year(2012-2013 n = 27,451; 2013-2014 n = 28,124; 2014-2015 n= 27,461 )

DEMOGRAPHICS
Nevada Institute for Children’s Research and Policy, UNLV April 2015
Results of the 2014-2015 Nevada Kindergarten Health Survey Page 16
Race/Ethnicity This year, race and ethnicity data were compared to the most recent data available from the
Nevada Department of Education student demographic profiles. This provides a more accurate
comparison of race and ethnicity as it is restricted to school aged children rather than to all
residents of in the state of Nevada. Compared to the racial demographics of the students
attending public schools in Nevada, the reported race/ethnicity of the kindergartners in this
survey were fairly similar with differences only ranging from 0-6.9% percentage points (see
Figure 2.3). However, there were proportionally more children in the KHS survey whose parents
or guardians reported that the child had multiple races. It is important to note that the Nevada
Department of Education does not provide an option for “other” while the KHS does take that
into account.
These results are consistent with KHS data received in 2012-2013 and in 2013-2014. When
comparing results across counties for the 2014-2015 school year (refer to Table 11.1 in
Appendix A), there is a higher percentage of African American/Black and Asian/Pacific Islander
kindergartners in Clark County as compared to Washoe County, and even fewer in the Rural
Counties. In addition, there are more Native American/Alaska Native kindergartners in the Rural
Counties as compared to Washoe County, and even fewer in Clark County.
Note. * Nevada Department of Education 2013-2014 Demographic Profile
African
American
/Black
Asian/
Pacific
Islander
Caucasian Hispanic
Native
American
/ Alaska
Native
Other
Race
Multiple
Races
Survey Sample 6.3% 6.5% 38.3% 33.7% 1.1% 0.1% 14.1%
Nevada DOE* 9.9% 6.9% 36.0% 40.6% 1.1% 5.6%
0.0%
10.0%
20.0%
30.0%
40.0%
50.0%
Race/Ethnicity
Figure 2.3: Child's Race/Ethnicity(2014-2015 n = 31,310)

DEMOGRAPHICS
Nevada Institute for Children’s Research and Policy, UNLV April 2015
Results of the 2014-2015 Nevada Kindergarten Health Survey Page 17
Preschool Setting
Respondents were asked to indicate the type of preschool setting, if any, their kindergartner
attended in the past twelve months (see Figure 2.4). These categories were adjusted from the
2012-2013 survey in order to capture more specific settings. Therefore, the 2013-2014 school
year might not have data for certain categories.
Compared to 2013-2014 data:
33.5 percent of respondents indicated that their kindergartner had stayed at home in the
prior year, which is a 2.4 percentage point decrease from last year.
Attendance at school district preschool sites has steadily increased over the past two
years.
When comparing the 2014-2015 data across counties (Table 11.1):
A higher percentage of children attended Head Start in Washoe County (8.5) and the
rural counties (10.2) as compared to Clark County (4.9).
A higher percentage of children attended school district run preschools in Clark County
(24.9) as compared to Washoe (20.9) and the Rural counties (23.4).
A higher percentage of children in Washoe County (35.8) did not attend preschool as
compared to rural counties (23.2) and Clark County (34.0).
Note. Blank boxes indicate data are not available. For these categories, percents will not total 100 because not all
categories for those years are available.
Head
Start
Other
Facility/
Care
Home-
Based
Care
University
Campus
Pre-
School
School
District
Pre-
School
None/
Stayed
Home
Multiple
Sites
Friends/
Family/
Neighbor
Care
2012-2013 5.8% 24.7% 6.6% 1.2% 19.2% 40.0% 2.4%
2013-2014 6.6% 21.9% 5.8% 1.1% 21.8% 35.9% 4.0% 2.8%
2014-2015 5.8% 22.6% 5.1% 0.9% 24.2% 33.5% 4.7% 3.1%
0.0%
10.0%
20.0%
30.0%
40.0%
50.0%
Figure 2.4: Child's Type of Preschool Setting During Last Twelve Months(2012-2013 n = 32,116; 2013-2014 n = 32,103; 2014-2015 n= 29,812 )

DEMOGRAPHICS
Nevada Institute for Children’s Research and Policy, UNLV April 2015
Results of the 2014-2015 Nevada Kindergarten Health Survey Page 18
Average Hours of Preschool Attendance Since the 1950s there has been a drastic increase in the percentage of children who are spending
time in non-parental child care settings (McGroder, 1988). Sixty percent of children under five
spend an average of 29 hours per week in some form of non-parental child care setting (Iruka &
Carver, 2011). Therefore, it is important to specifically understand how preschool environments
affect our children. Some of these effects, positive or negative, might be correlated with the time
spent in non-parental care. Therefore, in addition to the preschool setting, a question was
included to determine how many hours children spent in the preschool setting.
Results from Table 2.1 indicate that almost half of parents/guardians have their child in someone
else’s care 20 hours or less per week (40.7 percent) and only 7.6 percent have them in someone
else’s care more than 40 hours a week.
When comparing the results across counties (Table 11.1):
A higher percentage of children were in care 20 hours a week or less in the Rural
counties (56.1) as compared to Clark (40.1) and Washoe (36.3) counties.
A higher percentage of children were in care more than 20 hours a week in Washoe
County (28.2) and Clark County (28.1) compared to the Rural Counties (20.3).
Table 2.1 Average Preschool Hours of Attendance (n=27,034) 0 HRS 5-10 HRS 10-15 HRS 15-20 HRS 20-30 HRS 30-40 HRS 40+ HRS
31.8% 17.7% 14.4% 8.6% 8.4% 11.5% 7.6%

Nevada Institute for Children’s Research and Policy, UNLV April 2015
Results of the 2014-2015 Nevada Kindergarten Health Survey Page 19
INSURANCE STATUS
Background
Nevada has consistently placed near the bottom of nationwide rankings with regard to the
percent of children covered by health insurance. According to the U.S. Census Bureau American
Community Survey (2013), approximately 7.1 percent of children under the age of 18 in the
United States are uninsured compared to 14.9 percent of children under the age of 18 in Nevada.
A correlation exists between children’s health insurance status and access to health care services.
Research indicates that uninsured children are less likely to have access to the care they need and
are more likely to have poorer health outcomes as compared to insured children. For example,
parents of uninsured children are more likely to report that their child has an unmet health need
(DeRigne, Porterfield & Metz 2009). Nevada was ranked 46th when compared nationally across
four dimensions of health: healthcare access and affordability, prevention and treatment,
avoidable hospital use and cost, equity, and healthy lives (Radley, McCarthy, Lippa, Hayes, &
Schoen, 2014).
Status of Health Insurance of Kindergarten Students
In the current study, respondents were asked to indicate their child’s current health insurance
coverage.
Uninsured Private MedicaidNevada
Check UpOther
Multiple
Types
2012-2013 13.6% 47.6% 23.5% 6.3% 6.4% 2.6%
2013-2014 12.6% 50.0% 25.9% 6.5% 2.1% 2.9%
2014-2015 7.6% 48.4% 31.3% 6.7% 2.8% 3.2%
0.0%
10.0%
20.0%
30.0%
40.0%
50.0%
60.0%
70.0%
80.0%
% o
f R
esp
on
den
ts
Figure 3.1: Types of Children's Health Insurance Coverage
by School Year(2012-2013 n = 32,719; 2013-2014 n = 32.595; 2014-2015 n= 27,309 )

INSURANCE STATUS
Nevada Institute for Children’s Research and Policy, UNLV April 2015
Results of the 2014-2015 Nevada Kindergarten Health Survey Page 20
Approximately 92.4 percent of respondents indicated that their child had some type of
health insurance and 7.6 percent of respondents stated that their child had no coverage. This is
the lowest rate of uninsured children since this survey’s inception in 2008-2009 (not presented
here because the data is unweighted) and a 40% decrease in the number of uninsured children
compared to last year.
Approximately 2.8 percent of respondents indicated that their child had some “other” type of
health insurance not listed on the survey questionnaire. Respondents indicated that these “other”
types of insurance included coverage provided through tribal insurance and by discount
companies (e.g., Access to Healthcare). Unfortunately, some of the responses were illegible and
thus could not be reported or recoded into another category. It is possible that some of these
responses could have been coded as belonging to the private or public survey categories.
In addition, 3.1 percent of respondents selected “multiple types” of health insurance for their
kindergartner. The majority of these respondents specified that their child had both Medicaid and
a private form of health insurance, or Medicaid and Nevada Check Up.
Of the health insurance options:
Nearly half (48.4%) of the respondents indicated that their kindergartner had private
health insurance.
Approximately 38% of the respondents indicated that their kindergartner had public
health insurance (either Medicaid or the state’s children’s health insurance program,
Nevada Check Up).
The rates of children enrolled in private insurance are decreasing while enrollment in
public insurance (e.g., Medicaid) is increasing. Given that private insurance rates over the past
year decreased slightly (50.0% in 2013-2014), participation in public health insurance raised
approximately 5 percentage points since 2013-2014, and the number of children uninsured
decreased the same amount this year, many of these children likely obtained public health
insurance (see Figure 3.1). A recent study using data from the Kindergarten Health Survey
suggests, access to health care is reduced for those receiving public insurance compared to
private insurance (Haboush, Phebus, Hensley, Teramoto, & Tanata, 2013).While it is a goal to
increase health coverage for children, it is important to ensure that they have access to quality
healthcare.
Increasing Access to Insurance through the Nevada Health Link (Silver State Exchange)
Due to regulations of the Affordable Care Act, in October of 2013, Nevada began its health
exchange program, the Silver State Exchange, better known as Nevada Health Link. The 2014-
2015 survey was able to capture respondent’s participation in that program for their children.
Results are as follows:
19.2% of respondents (n=31,148) indicated that they or someone else applied for their
child.
11.6% of respondents (n=27,589) indicated that they had applied for insurance for
themselves.
o Of those that applied for themselves, 71% indicated that they were approved.

INSURANCE STATUS
Nevada Institute for Children’s Research and Policy, UNLV April 2015
Results of the 2014-2015 Nevada Kindergarten Health Survey Page 21
Annual Household Income and Insurance Status
Not surprisingly, children from families with a lower household income are more likely to be
uninsured than those children whose family has a higher income (see Figure 3.2).
43.1 percent of children who are uninsured live in households with an annual income
of less than $25,000. This is consistent with previous years.
However, 32.2 percent of children who live in a household with an annual income of
less than $25,000 have insurance, which is not consistent with data from previous
years.
Given the reduced rates on uninsured children in Nevada, income may be less of a
barrier than in previous years.
Note. Percentages are calculated out of the number within each insurance category. Percentages may not add up to
100 due to rounding.
$0 -
$14,999
$15,000
-
$24,999
$25,000
-
$34,999
$35,000
-
$44,999
$45,000
-
$54,999
$55,000
-
$64,999
$65,000
-
$74,999
$75,000
-
$84,999
$85,000
-
$94,999
$95,000
+Total
Uninsured 23.1% 20.0% 19.8% 8.5% 11.6% 5.6% 3.1% 3.8% 1.4% 3.2% 100%
Insured 16.7% 15.5% 12.5% 8.8% 7.2% 6.4% 5.9% 6.0% 4.1% 16.9% 100%
0.0%
5.0%
10.0%
15.0%
20.0%
25.0%
30.0%
Household Income
Figure 3.2: Annual Household Income by Child's Insurance
Status(2014-2015: Uninsured n = 2,033 ; Insured n = 25,273 ; Total n = 27,306 )

INSURANCE STATUS
Nevada Institute for Children’s Research and Policy, UNLV April 2015
Results of the 2014-2015 Nevada Kindergarten Health Survey Page 22
Race/Ethnicity and Insurance Status
Figure 3.3, detailing the relationship between race/ethnicity and insurance status, shows that
nearly half of children who are uninsured are Hispanic (47.2 percent) and almost a third are
Caucasian (28.3 percent).
While data has been fairly consistent over the past 2 survey years (Appendix B), compared to the
2013-2014 school year:
The percentage of uninsured children decreased for all racial groups with the exception of
Caucasian children (25.3%) and children with multiple races (10.8%).
The percentage of uninsured Hispanic children decreased by 3.1 % , but are still more
likely to be uninsured as compared to other racial/ethnic groups.
Note. Percentages are calculated out of the number within each insurance category.
Research indicates that in Nevada, and across the United States, Hispanic populations are much
more likely to be uninsured than Caucasian populations (Newport & Mendes, 2009).
Approximately 32 percent of Hispanics across the country are uninsured (Kaiser Family
Foundation, 2013). This rate is likely to increase in states with large proportions of Hispanic
immigrants like Nevada. Although many of these Hispanic children are eligible for public health
insurance, barriers to enrollment such as language and literacy challenges, and fears about
immigration enforcement for families with mixed immigration status continue to impede
parents/guardians from obtaining insurance coverage for their children (Kaiser Family
Foundation, 2013).
African
American/
Black
Asian/
Pacific
Islander
Caucasian Hispanic
Native
American/
Alaska
Native
Other
Race
Multiple
RacesTotal
Uninsured 4.8% 3.9% 28.3% 47.2% 0.6% 0.1% 15.0% 100%
Insured 6.3% 6.7% 39.2% 32.5% 1.1% 0.1% 14.1% 100%
Total % of
Respondents6.2% 6.5% 38.4% 33.6% 1.1% 0.1% 14.2% 100%
0.0%
10.0%
20.0%
30.0%
40.0%
50.0%
Race/Ethnicity
Figure 3.3: Child's Race/Ethnicity by Child's Insurance Status(2014-2015:Uninsured n = 28,665 ; Insured n = 2,361 ; Total n = 31,026)

Nevada Institute for Children’s Research and Policy, UNLV April 2015
Results of the 2014-2015 Nevada Kindergarten Health Survey Page 23
ACCESS TO HEALTHCARE
Barriers to Accessing Healthcare
When asked about accessing health care for their child, 20.6 percent of respondents indicated
that they had experienced at least one barrier. The majority had difficulty due to either “lack
of money” or “lack of insurance” for health care services.
Of all respondents experiencing one or more barriers to accessing health care (approximately
6,370 respondents):
77.4% reported having health insurance (28.9% private, 34.5% Medicaid, 7.8%
Nevada Check Up, and 3.7% Other/Multiple);
60.3% had an annual household income of less than $35,000.
3.0%
10.3%
4.9%
14.6%
2.3%
3.4%
10.1%
5.2%
13.8%
2.1%
3.4%
7.3%
5.1%
10.4%
1.9%
0.0%
5.0%
10.0%
15.0%
Barriers
.
Figure 4.1: Types of Barriers When Accessing Health Care
for Child(2012-2013 n = 31,810; 2013-2014 n = 31,583; 2014-2015 n= 6,370 )
2012-2013 2013-2014 2014-2015
ACCESS TO HEALTHCARE
Nevada Institute for Children’s Research and Policy, UNLV April 2015
Results of the 2014-2015 Nevada Kindergarten Health Survey Page 24
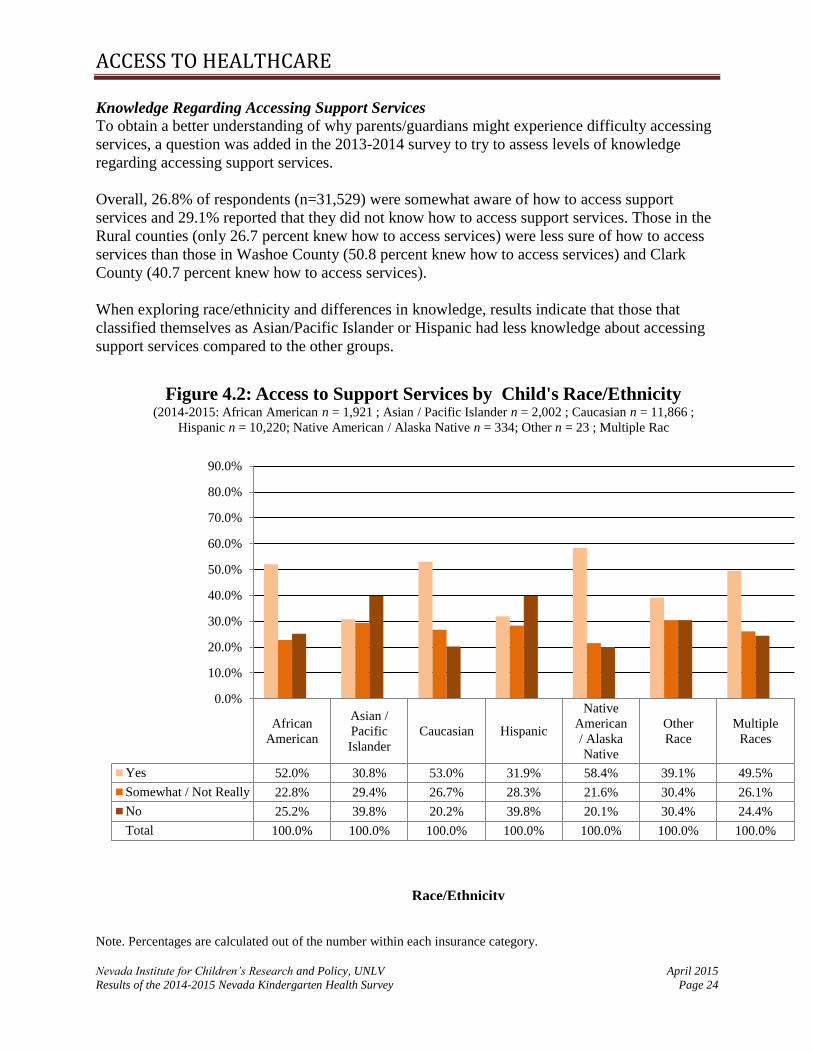
Knowledge Regarding Accessing Support Services
To obtain a better understanding of why parents/guardians might experience difficulty accessing
services, a question was added in the 2013-2014 survey to try to assess levels of knowledge
regarding accessing support services.
Overall, 26.8% of respondents (n=31,529) were somewhat aware of how to access support
services and 29.1% reported that they did not know how to access support services. Those in the
Rural counties (only 26.7 percent knew how to access services) were less sure of how to access
services than those in Washoe County (50.8 percent knew how to access services) and Clark
County (40.7 percent knew how to access services).
When exploring race/ethnicity and differences in knowledge, results indicate that those that
classified themselves as Asian/Pacific Islander or Hispanic had less knowledge about accessing
support services compared to the other groups.
Note. Percentages are calculated out of the number within each insurance category.
African
American
Asian /
Pacific
Islander
Caucasian Hispanic
Native
American
/ Alaska
Native
Other
Race
Multiple
Races
Yes 52.0% 30.8% 53.0% 31.9% 58.4% 39.1% 49.5%
Somewhat / Not Really 22.8% 29.4% 26.7% 28.3% 21.6% 30.4% 26.1%
No 25.2% 39.8% 20.2% 39.8% 20.1% 30.4% 24.4%
Total 100.0% 100.0% 100.0% 100.0% 100.0% 100.0% 100.0%
0.0%
10.0%
20.0%
30.0%
40.0%
50.0%
60.0%
70.0%
80.0%
90.0%
Figure 4.2: Access to Support Services by Child's Race/Ethnicity(2014-2015: African American n = 1,921 ; Asian / Pacific Islander n = 2,002 ; Caucasian n = 11,866 ;
Hispanic n = 10,220; Native American / Alaska Native n = 334; Other n = 23 ; Multiple Rac
Race/Ethnicity

Nevada Institute for Children’s Research and Policy, UNLV April 2015
Results of the 2014-2015 Nevada Kindergarten Health Survey Page 25
ROUTINE CARE
Background
Access to routine medical care services is a major factor contributing to a child’s health status.
Routine care includes basic health care services such as immunizations, vision screenings, and
well child visits. Children without health insurance are more likely to miss out on routine care
than insured children. Hoilette, Clark, Gebremariam, and Davis (2009) found that 23.3% of
uninsured children in the United States reported that they did not have a regular source of care.
Having access to regular primary care services, or a medical home, is another key indicator of
children’s overall health status. Studies have shown that having access to usual care has been
associated with better health and reduced health disparities, and that children without a regular
source of care are nine times more likely to be hospitalized for a preventable problem (Shi, et al.,
1999; Starfield, Shuh, 2004). Primary care providers, (e.g. physicians, physician’s assistants,
nurses) offer a medical home where children can receive basic care services, such as annual
check-ups and immunizations. Children that regularly see a primary care provider who
coordinates and organizes their care tend to have a better health status than children without
access to a primary care provider (Starfield, Shi & Macinko, 2005).
Routine Care for Kindergarten Students
Current survey results indicate that 87 percent of kindergartners had at least one routine medical
check-up in the twelve months prior to the date of the survey. Similarly, 86.4 percent of parents
reported that their child had a primary care provider. Compared to last year, the percentage of
children who had a routine checkup slightly increased (1.1 points) while the percentage of
children who had a primary care provide remained the same.
Note. Percentages are calculated out of the number within each insurance category.
13.0%
87.0%
13.6%
86.4%
0.0%
10.0%
20.0%
30.0%
40.0%
50.0%
60.0%
70.0%
80.0%
90.0%
No Yes
Figure 5.1: Child's Routine Check-Ups and Presence of
Primary Care Provider(2014-2015: Check-Up n = 31,441 ; Primary Care Provider n = 31,450)
Has your child been seen by a medical provider for a routine check-up in the past twelve months?
Does your child have a primary care provider?
ROUTINE CARE
Nevada Institute for Children’s Research and Policy, UNLV April 2015
Results of the 2014-2015 Nevada Kindergarten Health Survey Page 26
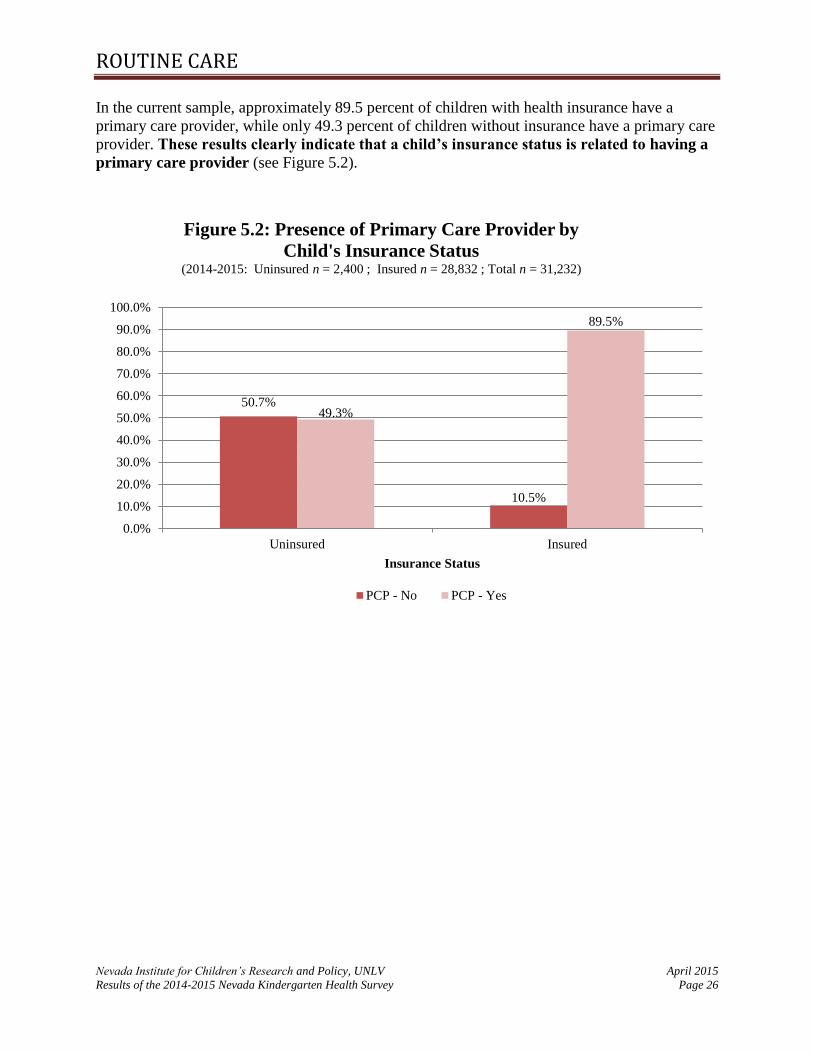
In the current sample, approximately 89.5 percent of children with health insurance have a
primary care provider, while only 49.3 percent of children without insurance have a primary care
provider. These results clearly indicate that a child’s insurance status is related to having a
primary care provider (see Figure 5.2).
50.7%
10.5%
49.3%
89.5%
0.0%
10.0%
20.0%
30.0%
40.0%
50.0%
60.0%
70.0%
80.0%
90.0%
100.0%
Uninsured Insured
Insurance Status
Figure 5.2: Presence of Primary Care Provider by
Child's Insurance Status(2014-2015: Uninsured n = 2,400 ; Insured n = 28,832 ; Total n = 31,232)
PCP - No PCP - Yes

ROUTINE CARE
Nevada Institute for Children’s Research and Policy, UNLV April 2015
Results of the 2014-2015 Nevada Kindergarten Health Survey Page 27
Having a primary care provider is also related to whether or not a child has had a routine check-
up in the past 12 months (see Figure 5.3).
Of the children that had a routine check-up, 98.1 percent had a primary care provider.
Of the children that had not had a routine check-up in the last year, 46.7 percent did not
have a primary care provider.
Note. Percentages are calculated out of the number within each PCP category.
46.7%
8.2%
53.3%
98.1%
0.0%
10.0%
20.0%
30.0%
40.0%
50.0%
60.0%
70.0%
80.0%
90.0%
100.0%
Routine Check-Up - No Routine Check-Up - Yes
Presence of PCP
Figure 5.3: Child's Routine Check-Ups by Presence of
Primary Care Provider (PCP)(2014-2015: No PCP n = 4,010 ; Has PCP n = 26,883 ; Total n = 30,893)
PCP - No PCP - Yes

Nevada Institute for Children’s Research and Policy, UNLV April 2015
Results of the 2014-2015 Nevada Kindergarten Health Survey Page 28
CARE FOR ILLNESS OR INJURY
In recent years, a growing number of uninsured children with minor, non-life-threatening
conditions have accessed health care services at emergency care facilities (Garcia, Bernstein, &
Bush, 2010). Most uninsured children come from lower-income families that cannot afford to
pay high costs for medical care (Garcia et al., 2010). These families are often left with little
option but to use hospital emergency rooms (ERs) or other urgent care facilities for non-life-
threatening conditions because that is the only place that they can get the care they need.
Approximately 19.3 percent of respondents indicated they had visited an ER for a non-life
threatening illness or injury for their child once or twice in the past year. This number has risen
slightly over the past three years, however the number of those that have not used the ER has
remained fairly consistent, with a slight decrease in the past two years (see Figure 6.1).
No Visits 1-2 Visits 3-5 Visits 6-9 Visits10 or More
VisitsTotal
2012-2013 80.6% 17.9% 1.4% 0.1% 0.1% 100.0%
2013-2014 80.0% 18.3% 1.5% 0.2% 0.1% 100.0%
2014-2015 79.0% 19.3% 1.5% 0.1% 0.1% 100.0%
0.0%
10.0%
20.0%
30.0%
40.0%
50.0%
60.0%
70.0%
80.0%
90.0%
Figure 6.1: Number of Emergency Room Visits for
Non-Life-Threatening Care(2012-2013 n = 32,693; 2013-2014 n = 32,575; 2014-2015 n= 31,725)

CARE FOR ILLNESS OR INJURY
Nevada Institute for Children’s Research and Policy, UNLV April 2015
Results of the 2014-2015 Nevada Kindergarten Health Survey Page 29
Insurance status does not appear to be an indicator of usage of an ER. Figure 6.2 shows the
percentage of ER visits by child’s insurance status. For both insured and uninsured groups, the
vast majority of children had not been to an ER for a non-emergency in the past 12 months.
However, those with insurance seem to use the ER more frequently than those without insurance
for non-life threatening care.
No Visits 1-2 Visits 3-5 Visits 6-9 Visits10 or More
VisitsTotal
Uninsured 86.7% 12.0% 1.4% 0.0% 0.0% 100%
Insured 78.3% 20.0% 1.5% 0.1% 0.1% 100%
0.0%
10.0%
20.0%
30.0%
40.0%
50.0%
60.0%
70.0%
80.0%
90.0%
Number of Visits.
Figure 6.2: Percentage of Emergency Room Visits for Non-
Life-Threatening Care by Child's Insurance Status(2014-2015: Uninsured n = 2,392 ; Insured n = 29,089 ; Total n = 31,481 )

Nevada Institute for Children’s Research and Policy, UNLV April 2015
Results of the 2014-2015 Nevada Kindergarten Health Survey Page 30
MEDICAL CONDITIONS
Many of Nevada’s children have medical conditions. Treatment for these children can be
expensive and can require a team of medical care providers, led by a primary care physician,
devoted to the treatment and maintenance of their conditions. Thus, quality health insurance
coverage is vital for children with special health conditions, as it improves their chances of
having ongoing care and treatment.
According to this year’s survey results, 27.7 percent of parents indicated that their child had
a medical condition (see Figure 7.1).
6.9 percent of respondents reported that their child had asthma, which was the highest
reported medical condition after allergies.
Diedhiou, Probst, Harding, Martin, and Xirasagar (2010), found that in the United
States, approximately 9% of 14,916 children with special health care needs and
asthma lacked consistent health care coverage; children aged 0 to 5 years
represented 23.7% of that sample.
Approximately 4.7 percent of respondents indicated that their child had an “other”
health condition not listed on the survey. Such “other” conditions included eczema, food
allergies, and rare diseases or disorders.
Note. Blank cells indicate data is not available. Respondents can select multiple categories therefore the total percent
within each year might exceed 100%.
ADD/
ADHDAllergy Asthma Autism Cancer Diabetes
Glasses/
Contacts
Hearing
Impaired
Mental
Health
Physical
Disabilit
y
Other SeizuresNo
Medical
2012-2013 1.4% 8.1% 0.4% 0.0% 0.2% 3.5% 0.3% 0.3% 0.3% 6.6% 0.5% 81.8%
2013-2014 1.3% 15.1% 7.5% 0.6% 0.1% 0.1% 5.1% 0.3% 0.4% 0.4% 5.2% 0.6% 71.2%
2014-2015 1.3% 15.5% 6.9% 0.5% 0.1% 0.1% 4.7% 0.4% 0.4% 0.4% 4.7% 0.4% 72.3%
0.0%
2.0%
4.0%
6.0%
8.0%
10.0%
12.0%
14.0%
16.0%
Figure 7.1: Types of Medical Conditions in Children(2012-2013 n = 30,599; 2013-2014 n = 32,969; 2014-2015 n= 29,765)

MEDICAL CONDITIONS
Nevada Institute for Children’s Research and Policy, UNLV April 2015
Results of the 2014-2015 Nevada Kindergarten Health Survey Page 31
Developmental Screening
Developmental screening is a method used by child care providers (e.g. mental health providers,
pediatricians, child care professionals) to assess whether a young child has delayed mental or
physical development. Early identification of developmental delay, coupled with the initiation of
intervention programs can contribute to greater academic and social success throughout a child’s
life (Brookings Institute 2014). Many children with developmental disabilities are not identified
until they have entered kindergarten or later, causing the child to miss out on crucial years of
intervention (CDC, 2014b). Therefore, a question was added to this year’s survey in which
respondents were asked whether or not their child received a developmental screening in the past
12 months.
Overall, 51.8 percent of respondents (n=30,068) reported that their child did not have a
developmental screening and 25.0% reported that they were unsure. When exploring differences
among the counties, more respondents in the Rural Counties (30.2 percent) reported that their
child had been screened as compared to Washoe County (24.6 percent) and Clark County (21.8
percent).
When exploring race/ethnicity differences in screening (Figure 7.2), results indicate that those
that classified their child as Native American/Alaskan Native had the highest rate of reported
screening, while those classified as Hispanic and Asian/Pacific Islander had the lowest screening
rates.
Note. Percentages may not add up to 100 due to rounding.
African
American
Asian / Pacific
IslanderCaucasian Hispanic
Native
American /
Alaska Native
Yes 28.1% 17.6% 27.5% 18.7% 20.2%
No 48.0% 59.0% 49.1% 55.9% 45.5%
Not Sure 23.9% 23.4% 23.5% 25.4% 34.2%
Total 100.0% 100.0% 100.0% 100.0% 100.0%
0.0%
10.0%
20.0%
30.0%
40.0%
50.0%
60.0%
Pe
rce
nt
of
Res
po
nd
ents
Figure 7.2 Developmental Screening by Child's
Race/Ethnicity(2014-2015: African American n = 1,908 ; Asian/Pacific Islander n = 1,987 ; Caucasian n =
11,760 ; Hispanic n = 9,749 ; Native American/Alaska Native n = 336)

Nevada Institute for Children’s Research and Policy, UNLV April 2015
Results of the 2014-2015 Nevada Kindergarten Health Survey Page 32
DENTAL CARE
Background
Routine dental care is also important to children’s health and daily functioning. Children without
access to regular dental care are more likely to experience dental problems, such as dental
cavities and tooth abscesses. Dental problems have been linked to poor performance in school,
difficulty concentrating, and problems completing school work. (Seirawan, Faust, Mulligan,
2012). Research also indicates that uninsured children are much more likely to have unmet
dental needs (e.g. teeth cleanings). One study found that 4 percent of privately insured children
and 5 percent of publicly insured children had an unmet dental need, whereas 22 percent of
uninsured children had an unmet dental need (Child Trends, 2015). Additionally, uninsured
children are 1.5 times more likely to not have received preventative care in the last year and 3
times more likely to have an unmet dental need than insured children (Liu et al., 2007).
Dental Care of Children Entering Kindergarten
To prevent oral health problems, it is generally recommended that children receive regular dental
check-ups every six months to a year as soon as they receive their first tooth, or when they are
one year old (American Academy of Pediatric Dentistry, 2014). In the current study, 25.2 percent
of survey respondents indicated that their kindergartner had NOT seen a dentist in the past
twelve months, which was a slight decrease from the 2012-2013 and 2013-2014 data (Figure
8.1).
25.8%
74.2%
26.0%
74.0%
25.2%
74.8%
0.0%
10.0%
20.0%
30.0%
40.0%
50.0%
60.0%
70.0%
80.0%
No Yes
Figure 8.1: Child's Dental Visit (2012-2013 n = 32,772; 2013-2014 n = 31,224; 2014-2015 n= 29,289)
2012-2013 2013-2014 2014-2015

Nevada Institute for Children’s Research and Policy, UNLV April 2015
Results of the 2014-2015 Nevada Kindergarten Health Survey Page 33
MENTAL HEALTH
Many of Nevada’s children have mental health conditions that require specialized treatment. It is
important that these children have regular access to mental health services. This is particularly
true for young children entering the elementary school system. Without access to mental health
care providers to manage and treat their conditions, children with mental health conditions are
more likely to experience learning difficulties and developmental delays (Baker, Neece Fenning,
Crni & Blacher, 2010).
The survey results indicate that 4.4 percent of respondents have tried to access mental health
services for their children, a percentage similar to the 2012-2013 and 2013-2014 data. Of the
respondents who have tried to access these services for their child:
Of those that attempted to access services, 31.8 percent reported having trouble
obtaining the services, a slight decrease from the previous survey year (35.9).
When examining this percentage across counties, it was found that there were
slight differences between counties, with those in Washoe County reporting
less trouble obtaining services (see Figure 9.1).
Reported barriers to obtaining services most frequently included problems
making appointments/waiting periods, lack of providers, or insurance not
covering the issue.
33.6%
22.0%
34.5%31.8%
0.0%
10.0%
20.0%
30.0%
40.0%
50.0%
60.0%
70.0%
Yes
Trouble Obtaining Mental Health Service
Figure 9.1: Trouble Obtaining Mental Health Services
by County
(2014-2015 Tried to obtain Mental Health Services
Clark n = 851 ; Washoe n = 205 ; Rural n = 171 ; Statewide n = 1,227 )
Clark County Washoe County Rural County Statewide

Nevada Institute for Children’s Research and Policy, UNLV April 2015
Results of the 2014-2015 Nevada Kindergarten Health Survey Page 34
WEIGHT AND HEALTHY BEHAVIORS
Childhood obesity is a growing public health problem, as it has doubled in children and quadrupled
in adolescents since the 1980’s (Ogden, Carroll, Kit, Flegal, 2014). Research has indicated there is a
significant link between high Body Mass Index (BMI) values and type II diabetes (Ganz, Wintfeld,
Li, Alas, Langer, & Hammer, 2014).). Therefore, monitoring children’s weight has become an
important tool for analyzing potential health problems.
The current survey asked parents to write in their child’s height and weight information. NICRP
used this information to calculate a Body Mass Index (BMI) value for each child with valid height
and weight responses. BMI values were calculated using the standard formula employed by the CDC
and other health agencies:
BMI = [(Weight in pounds) / Height in inches2]*703
However, to increase the validity of the data, several strict guidelines were implemented for the
calculation of BMI. First, if the respondent reported that the child was under the age of 4, or over the
age of 6, they were excluded from the analyses, as it is unlikely kindergartners would be outside of
this age range. Age is an important determinant as it is used to determine weight status category and
is strongly correlated with height. Second, if a child’s reported height was outside of the 95%
interval of average height of 4-6 year olds (based on the CDC, 2000), the child was excluded from
the analysis. Finally, if a child’s weight was reported under 20lbs, the child was excluded from the
analysis. This resulted in 12,077 (37.5 percent of the entire sample) with a valid BMI value.
Once BMI was calculated, each child in the sample was assigned a weight status category based on
CDC standards, which uses a child’s age, gender, and BMI percentile. Table 10.1, below, outlines
the BMI percentile ranges for each weight status category.
Table 10.1: Weight Status Categories by BMI Percentile Ranges
Weight Status Category BMI Percentile Range
Underweight BMI less than the 5th percentile
Healthy Weight BMI from the 5th percentile to less than the 85th percentile
Overweight BMI from the 85th percentile to less than the 95th percentile
Obese BMI equal to or greater than the 95th percentile Source: Centers for Disease Control and Prevention (2011a). About BMI for Children and Teens. Retrieved
from http://www.cdc.gov/healthyweight/assessing/bmi/childrens_bmi/about_childrens_bmi.html#What is BMI
percentile

WEIGHT AND HEALTHY BEHAVIORS
Nevada Institute for Children’s Research and Policy, UNLV April 2015
Results of the 2014-2015 Nevada Kindergarten Health Survey Page 35
For the purpose of this study, NICRP used 10 different weight status formulas: one formula for girls
and one for boys in each of the following ages: 4.0, 4.5, 5.0, 5.5, and 6.0. Table 10.2 outlines the
calculations used to determine weight status categories.
Table 10.2: Weight Status Category Calculations Based on BMI Values
Females
Age
Weight Status Category
Underweight Healthy Weight Overweight Obese
4.0 0 < BMI < 13.725 13.725 <= BMI < 16.808 16.808 <= BMI < 18.028 BMI >= 18.028
4.5 0 < BMI < 13.614 13.614 <= BMI < 16.760 16.760 <= BMI < 18.084 BMI >= 18.084
5.0 0 < BMI < 13.527 13.527 <= BMI < 16.796 16.796 <= BMI < 18.240 BMI >= 18.240
5.5 0 < BMI < 13.465 13.465 <= BMI < 16.906 16.906 <= BMI < 18.486 BMI >= 18.486
6.0 0 < BMI < 13.428 13.428 <= BMI < 17.083 17.083 <= BMI < 18.808 BMI >= 18.808
Males
Age
Weight Status Category
Underweight Healthy Weight Overweight Obese
4.0 0 < BMI < 14.043 14.043 <= BMI < 16.935 16.935 <= BMI < 17.842 BMI >= 17.842
4.5 0 < BMI < 13.932 13.932 <= BMI < 16.852 16.852 <= BMI < 17.829 BMI >= 17.829
5.0 0 < BMI < 13.845 13.845 <= BMI < 16.839 16.839 <= BMI < 17.927 BMI >= 17.927
5.5 0 < BMI < 13.781 13.781 <= BMI < 16.891 16.891 <= BMI < 18.118 BMI >= 18.118
6.0 0 < BMI < 13.739 13.739 <= BMI < 17.003 17.003 <= BMI < 18.389 BMI >= 18.389 Source: Centers for Disease Control and Prevention (2011b). Body Mass for Age Tables. Retrieved from
http://www.cdc.gov/growthcharts/html_charts/bmiagerev.htm
In the 2010-2011 report, specific validity criteria was established regarding age, height, and weight
to calculate the most accurate BMI.
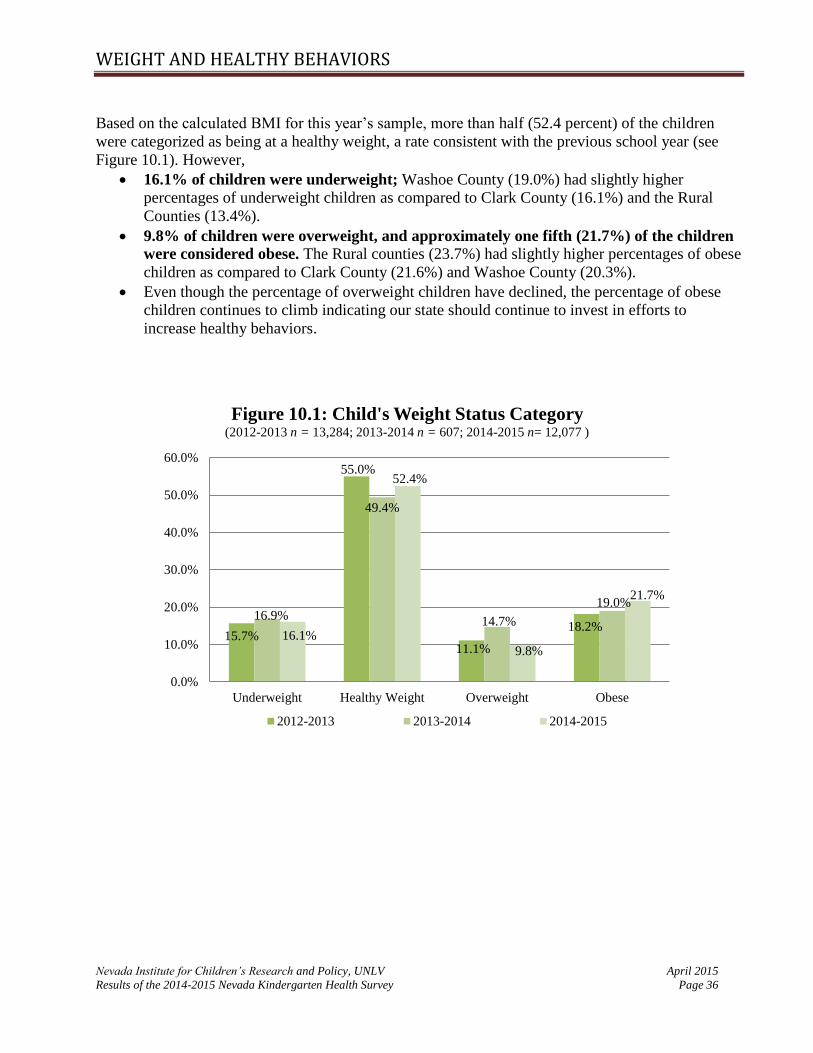
WEIGHT AND HEALTHY BEHAVIORS
Nevada Institute for Children’s Research and Policy, UNLV April 2015
Results of the 2014-2015 Nevada Kindergarten Health Survey Page 36
Based on the calculated BMI for this year’s sample, more than half (52.4 percent) of the children
were categorized as being at a healthy weight, a rate consistent with the previous school year (see
Figure 10.1). However,
16.1% of children were underweight; Washoe County (19.0%) had slightly higher
percentages of underweight children as compared to Clark County (16.1%) and the Rural
Counties (13.4%).
9.8% of children were overweight, and approximately one fifth (21.7%) of the children
were considered obese. The Rural counties (23.7%) had slightly higher percentages of obese
children as compared to Clark County (21.6%) and Washoe County (20.3%).
Even though the percentage of overweight children have declined, the percentage of obese
children continues to climb indicating our state should continue to invest in efforts to
increase healthy behaviors.
15.7%
55.0%
11.1%
18.2%16.9%
49.4%
14.7%
19.0%
16.1%
52.4%
9.8%
21.7%
0.0%
10.0%
20.0%
30.0%
40.0%
50.0%
60.0%
Underweight Healthy Weight Overweight Obese
Figure 10.1: Child's Weight Status Category(2012-2013 n = 13,284; 2013-2014 n = 607; 2014-2015 n= 12,077 )
2012-2013 2013-2014 2014-2015
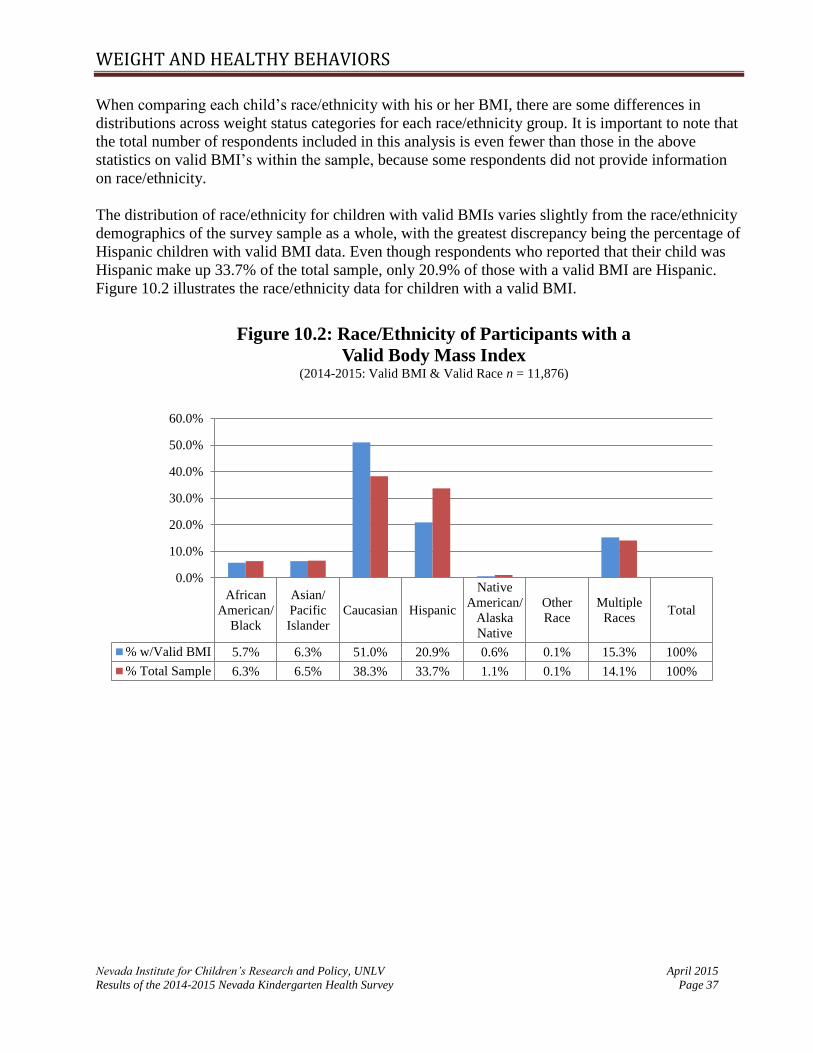
WEIGHT AND HEALTHY BEHAVIORS
Nevada Institute for Children’s Research and Policy, UNLV April 2015
Results of the 2014-2015 Nevada Kindergarten Health Survey Page 37
When comparing each child’s race/ethnicity with his or her BMI, there are some differences in
distributions across weight status categories for each race/ethnicity group. It is important to note that
the total number of respondents included in this analysis is even fewer than those in the above
statistics on valid BMI’s within the sample, because some respondents did not provide information
on race/ethnicity.
The distribution of race/ethnicity for children with valid BMIs varies slightly from the race/ethnicity
demographics of the survey sample as a whole, with the greatest discrepancy being the percentage of
Hispanic children with valid BMI data. Even though respondents who reported that their child was
Hispanic make up 33.7% of the total sample, only 20.9% of those with a valid BMI are Hispanic.
Figure 10.2 illustrates the race/ethnicity data for children with a valid BMI.
African
American/
Black
Asian/
Pacific
Islander
Caucasian Hispanic
Native
American/
Alaska
Native
Other
Race
Multiple
RacesTotal
% w/Valid BMI 5.7% 6.3% 51.0% 20.9% 0.6% 0.1% 15.3% 100%
% Total Sample 6.3% 6.5% 38.3% 33.7% 1.1% 0.1% 14.1% 100%
0.0%
10.0%
20.0%
30.0%
40.0%
50.0%
60.0%
Figure 10.2: Race/Ethnicity of Participants with a
Valid Body Mass Index (2014-2015: Valid BMI & Valid Race n = 11,876)

WEIGHT AND HEALTHY BEHAVIORS
Nevada Institute for Children’s Research and Policy, UNLV April 2015
Results of the 2014-2015 Nevada Kindergarten Health Survey Page 38
As seen in Figure 10.3, the differences in BMI across racial/ethnic groups indicates that:
The highest percentages of obese children were Native American/Alaska Native children
(29.2 percent); however, this is based on a very small sample of Native American/Alaska
Native children.
Hispanic children (28.9%), children of multiple races (27.4%), and African
America/Black children (26.0%) all had obesity rates that were over 25%.
Caucasian children had the lowest rates of obesity (16.8%), and African American
children had much lower rates of children who were overweight (4.5%) compared to all
other racial/ethnic groups listed below.
Note. * indicates percentages are calculated out of the total number of Valid BMI responses in each race/ethnicity
category. Other race is not included due to the minimal response rate in that category (.01%).
African
American/
Black
Asian/
Pacific
Islander
Caucasian Hispanic
Native
American/
Alaska
Native
Multiple
Races
Underweight 29.9% 20.0% 14.0% 17.4% 5.6% 15.0%
Healthy Weight 39.6% 45.4% 60.0% 42.6% 50.0% 48.2%
Overweight 4.5% 13.5% 9.2% 11.1% 15.3% 9.5%
Obese 26.0% 21.0% 16.8% 28.9% 29.2% 27.4%
Total 100% 100% 100% 100% 100% 100%
*Total % Valid BMI 5.7% 6.3% 51.0% 20.9% 0.6% 15.1%
0.0%
10.0%
20.0%
30.0%
40.0%
50.0%
60.0%
Race/Ethnicity
Figure 10.3: Child's Weight Status Category by
Child's Race/Ethnicity(2014-2015 n = 11,844 )
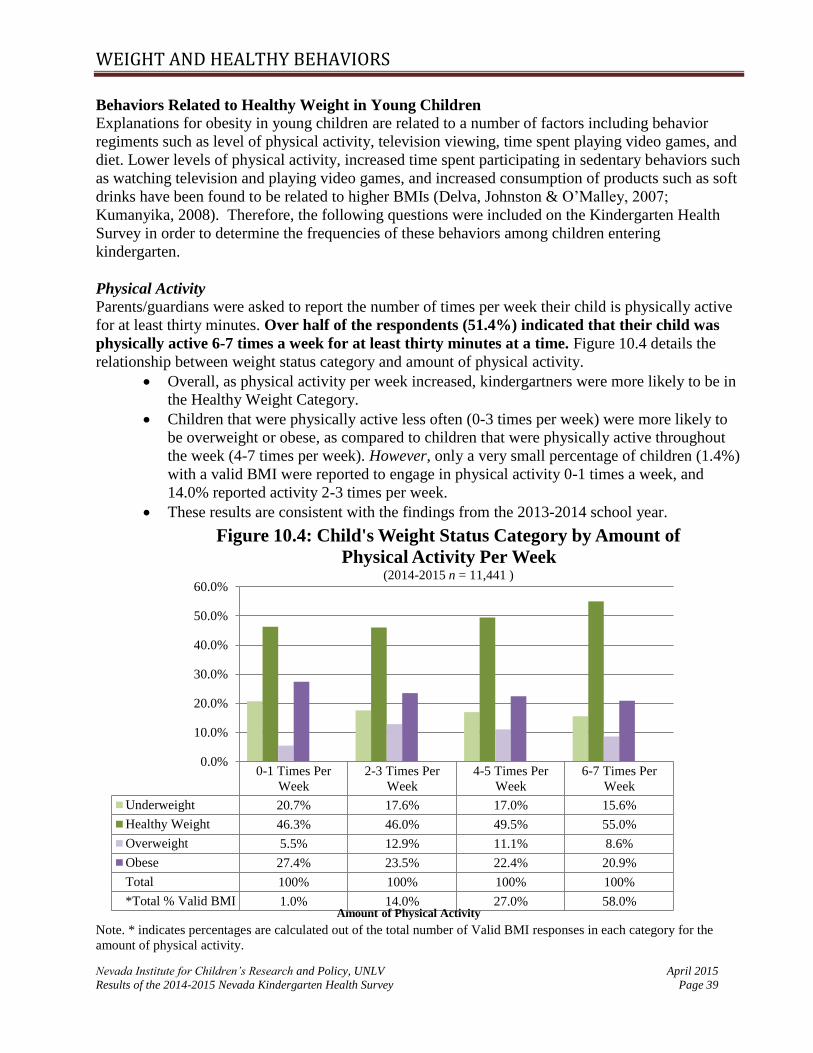
WEIGHT AND HEALTHY BEHAVIORS
Nevada Institute for Children’s Research and Policy, UNLV April 2015
Results of the 2014-2015 Nevada Kindergarten Health Survey Page 39
Behaviors Related to Healthy Weight in Young Children
Explanations for obesity in young children are related to a number of factors including behavior
regiments such as level of physical activity, television viewing, time spent playing video games, and
diet. Lower levels of physical activity, increased time spent participating in sedentary behaviors such
as watching television and playing video games, and increased consumption of products such as soft
drinks have been found to be related to higher BMIs (Delva, Johnston & O’Malley, 2007;
Kumanyika, 2008). Therefore, the following questions were included on the Kindergarten Health
Survey in order to determine the frequencies of these behaviors among children entering
kindergarten.
Physical Activity Parents/guardians were asked to report the number of times per week their child is physically active
for at least thirty minutes. Over half of the respondents (51.4%) indicated that their child was
physically active 6-7 times a week for at least thirty minutes at a time. Figure 10.4 details the
relationship between weight status category and amount of physical activity.
Overall, as physical activity per week increased, kindergartners were more likely to be in
the Healthy Weight Category.
Children that were physically active less often (0-3 times per week) were more likely to
be overweight or obese, as compared to children that were physically active throughout
the week (4-7 times per week). However, only a very small percentage of children (1.4%)
with a valid BMI were reported to engage in physical activity 0-1 times a week, and
14.0% reported activity 2-3 times per week.
These results are consistent with the findings from the 2013-2014 school year.
Note. * indicates percentages are calculated out of the total number of Valid BMI responses in each category for the
amount of physical activity.
0-1 Times Per
Week
2-3 Times Per
Week
4-5 Times Per
Week
6-7 Times Per
Week
Underweight 20.7% 17.6% 17.0% 15.6%
Healthy Weight 46.3% 46.0% 49.5% 55.0%
Overweight 5.5% 12.9% 11.1% 8.6%
Obese 27.4% 23.5% 22.4% 20.9%
Total 100% 100% 100% 100%
*Total % Valid BMI 1.0% 14.0% 27.0% 58.0%
0.0%
10.0%
20.0%
30.0%
40.0%
50.0%
60.0%
Amount of Physical Activity
Figure 10.4: Child's Weight Status Category by Amount of
Physical Activity Per Week(2014-2015 n = 11,441 )

WEIGHT AND HEALTHY BEHAVIORS
Nevada Institute for Children’s Research and Policy, UNLV April 2015
Results of the 2014-2015 Nevada Kindergarten Health Survey Page 40
To gain a better understanding of the barriers that parents are facing in regards to providing physical
activities for their children, respondents that indicated that their child was physically active one time
or less per week, were asked to indicate barriers to them being more physically active. The most
frequently reported barrier was weather (46.9%), followed by lack of time and/or a busy work
schedule (28.2%), lack of a safe play space which included comments regarding air quality (9.0%),
medical conditions (12.5%), preference for electronic media (2.3%), and transportation (1.0%).
Please note the response categories are not mutually exclusive; one respondent could have listed
multiple barriers.
Television Viewing
In the current study, the majority of respondents reported that their child watches some television but
less than 2 hours during a weekday. The 2011 National Survey of Children's Health reported data
regarding the amount of television or videos children ages 1-5 years watch (NSCH, 2011/2012).
Compared to the national data:
Fewer respondents in the current sample reported that their child did not watch television,
which could be due to the age difference in the samples.
Fewer respondents in the current sample reported that their child watches 4 or more hours of
television.
Table 10.3 Average Television Watched During a Weekday (n=28,713)
None 1 hour or less
Between 1hr
& 4 hrs
4 hours or
more Total %
Nationwide 6.3% 41.8% 40.3% 11.6% 100.0%
Nevada 4.7% 38.9% 41.9% 14.5% 100.0%
KHS Data 2.1% 42.5% 49.4% 5.9% 100.0%
Note. Nationwide/Nevada data source: NSCH, 2011/2012. Percentages may not add up to 100 due to rounding.
When comparing the number of hours a child watches television per day with his or her BMI, it
appears that as TV viewing time increases, it is less likely that he/she will be of a healthy weight.

WEIGHT AND HEALTHY BEHAVIORS
Nevada Institute for Children’s Research and Policy, UNLV April 2015
Results of the 2014-2015 Nevada Kindergarten Health Survey Page 41
Note. * indicates percentages are calculated out of the total number of Valid BMI responses in each category.
Video Game Use
According to the 2013 High School Youth Risk Behavior Survey (Office of Public Health
Informatics and Epidemiology), 37.9 percent of youths in Nevada used computers 3 or more hours
per day for something that was not related to school, which was slightly less than the most recent
national average of 41.3 percent (CDC, 2013). To determine similar activity in children entering
kindergarten, this same question on video game use was included on the survey starting in the 2011-
2012 school year.
2014-2015 results indicate that the majority of children either do not play video or computer games
(30%) or play one hour or less (54%) on an average school day. While these numbers are fairly
consistent across all counties, the percentage of children that do not play video games is less in Clark
County (28.7%) compared to both Washoe (32.3%) and the Rural (38.6%) counties.
When looking at the amount of hours that children play video games per day, the percent of children
in the obese category increases as the number of hours of video game play increases. Among those
kindergartners that reportedly play two or more hours of video games per day, there is a slightly
higher rate of obesity (23.6%) compared to those who reportedly do not play video games (18.9%).
NoneLess than 1
Hr a Day1 Hr a Day
2 Hrs a
Day
3 Hrs a
Day
4 Hrs a
Day
5+ Hrs a
Day
Underweight 12.7% 16.7% 15.5% 16.9% 19.6% 13.1% 15.6%
Healthy 65.3% 59.6% 55.6% 45.6% 44.3% 58.8% 40.6%
Overweight 7.7% 6.1% 11.5% 10.9% 9.4% 10.6% 3.1%
Obese 14.3% 17.7% 17.4% 26.7% 26.7% 17.4% 40.6%
*Total % Valid BMI 2.4% 14.9% 33.0% 32.3% 12.7% 3.6% 1.2%
0.0%
10.0%
20.0%
30.0%
40.0%
50.0%
60.0%
70.0%
Hours of Television Watched
Figure 10.5: Child's Weight Status Category by Hours of
Television Watched on Average School Day(2014-2015 n = 10,971 )

WEIGHT AND HEALTHY BEHAVIORS
Nevada Institute for Children’s Research and Policy, UNLV April 2015
Results of the 2014-2015 Nevada Kindergarten Health Survey Page 42
Note. * indicates percentages are calculated out of the total number of Valid BMI responses in each race/ethnicity
category.
Soda Consumption: Non-Diet Soda
According to the 2013 High School Youth Risk Behavior Survey, 16.2 percent of youth in Nevada
drank a can, bottle, or glass of non-diet soda/pop at least one time per day, 7 days prior to
administration of the survey, which was below the national average of 29.2 percent (Office of Public
Health Informatics and Epidemiology). To determine similar activity in children entering
kindergarten, this same question on soda consumption was included on the survey starting in the
2011-2012 school year.
Results indicate that:
The majority of children either did not drink any non-diet soda/pop (60.8%) or drank some a
few times per week (29.9%).
o These numbers are fairly consistent among Clark and Washoe County and are
slightly higher in the Rural Counties (64.1%).
6.8% of respondents reported that their child drank non-diet soda/pop once a day, and 2.5%
indicated that their child drank non-diet soda/pop more than once a day.
o These proportions are slightly lower in the Rural Counties as compared to the other
two counties, and highest in Clark County.
NoneLess than 1 Hour a
Day1 Hour a Day 2 + Hours a Day
Underweight 16.7% 14.5% 17.6% 17.4%
Healthy 55.3% 53.7% 48.2% 47.8%
Overweight 9.2% 9.4% 10.4% 11.2%
Obese 18.9% 22.4% 23.8% 23.6%
Total 100% 100% 100% 100%
*Total % Valid BMI 27.8% 30.9% 26.2% 15.1%
0.0%
10.0%
20.0%
30.0%
40.0%
50.0%
60.0%
Figure 10.6: Child's Weight Status Category by
Hours of Video Game Playing on Average School Day(2014-2015 n = 11,142 )

WEIGHT AND HEALTHY BEHAVIORS
Nevada Institute for Children’s Research and Policy, UNLV April 2015
Results of the 2014-2015 Nevada Kindergarten Health Survey Page 43
Figure 10.7 illustrates child’s weight status category by number of non-diet sodas consumed in one
week’s time. Of the respondents with kindergartners having a valid BMI, most reported that their
child had less than one non-diet soda a day (94.3%). The highest rates of overweight and obesity are
seen in children who drank non-diet soda a once day.
Note. * indicates percentages are calculated out of the total number of Valid BMI responses in each race/ethnicity category.
Diet Soda
Similarly, the survey asked the parents/guardians to indicate the level of consumption of diet soda
products in the past seven days. Although this question was asked on the High School Youth Risk
Behavior Survey, this data was not available for comparison at the time of this report.
Results indicate that:
The majority of children in the current study did not drink any diet soda/pop (87.5%). This
percentage was highest in Rural Counties (88.6%) and lower in Clark County (87.8%) and
the lowest in Washoe County (85.7%).
10.1 % reported that their child drank diet soda/pop a few times a week, 2% reported daily
consumption, and 0.4% reported consumption more than once a day.
o In Washoe County, more children drank diet soda/pop a few times a week (11.5%),
followed by Clark (9.8%) and Rural Counties (9.5%). Washoe County also reported
None A Few Times One a DayMore than One
a Day
Underweight 14.8% 19.4% 20.0% 17.5%
Healthy 55.5% 47.4% 36.3% 55.6%
Overweight 9.6% 9.1% 16.3% 6.4%
Obese 20.1% 24.1% 27.5% 20.5%
Total 100% 100% 100% 100%
*Total % Valid BMI 67.3% 27.0% 4.2% 1.5%
0.0%
10.0%
20.0%
30.0%
40.0%
50.0%
60.0%
Per
cent
of
Res
po
nd
ents
Figure 10.7: Child's Weight Status Category by Number of
Non-Diet Sodas Consumed in a Week (2014-2015 n = 11,211)

WEIGHT AND HEALTHY BEHAVIORS
Nevada Institute for Children’s Research and Policy, UNLV April 2015
Results of the 2014-2015 Nevada Kindergarten Health Survey Page 44
slightly higher rates of diet soda/pop consumption once a day (2.4%) compared to
Clark County (2%) and the Rural Counties (1.6%).
When looking at children’s weight status category by number of diet sodas/pop drank in one week, it
is difficult to project a relationship given that so few of the respondents reported that their child
drank diet soda either once a day or more than once a day.
Note. * indicates percentages are calculated out of the total number of Valid BMI responses in each race/ethnicity category.
Juice Consumption Parents and childcare providers often perceive fruit juice as a healthy alternative to sodas and other
sugary beverages for children. Coupled by a wide variety of types of juices available, there has been
an increase in the consumption of fruit juices by children over the past 30 to 40 years. Low levels of
fiber and high sugar, even in 100% fruit juice, raises health issues for children (Wojcicki, Heyman,
2012). Research has also found that an excessive consumption of fruit juice among children may be
a contributing factor to obesity (Wojcicki, Heyman 2012). Because of the current debates over the
impact of consumption of juice on children’s health benefits, a question was added in the 2013-2014
survey year.
None A Few Times One a DayMore than One a
Day
Underweight 16.4% 15.1% 21.3% 0.0%
Healthy 53.5% 42.5% 39.1% 69.0%
Overweight 9.5% 13.5% 13.0% 0.0%
Obese 20.7% 28.9% 26.6% 31.0%
Total 100% 100% 100% 100%
*Total % Valid BMI 88.6% 9.6% 1.5% 0.3%
0.0%
10.0%
20.0%
30.0%
40.0%
50.0%
60.0%
Per
cent
of
Res
po
nd
ents
Figure 10.8: Child's Weight Status Category by Number of
Diet Sodas Consumed in a Week (2014-2015 n = 11,177)
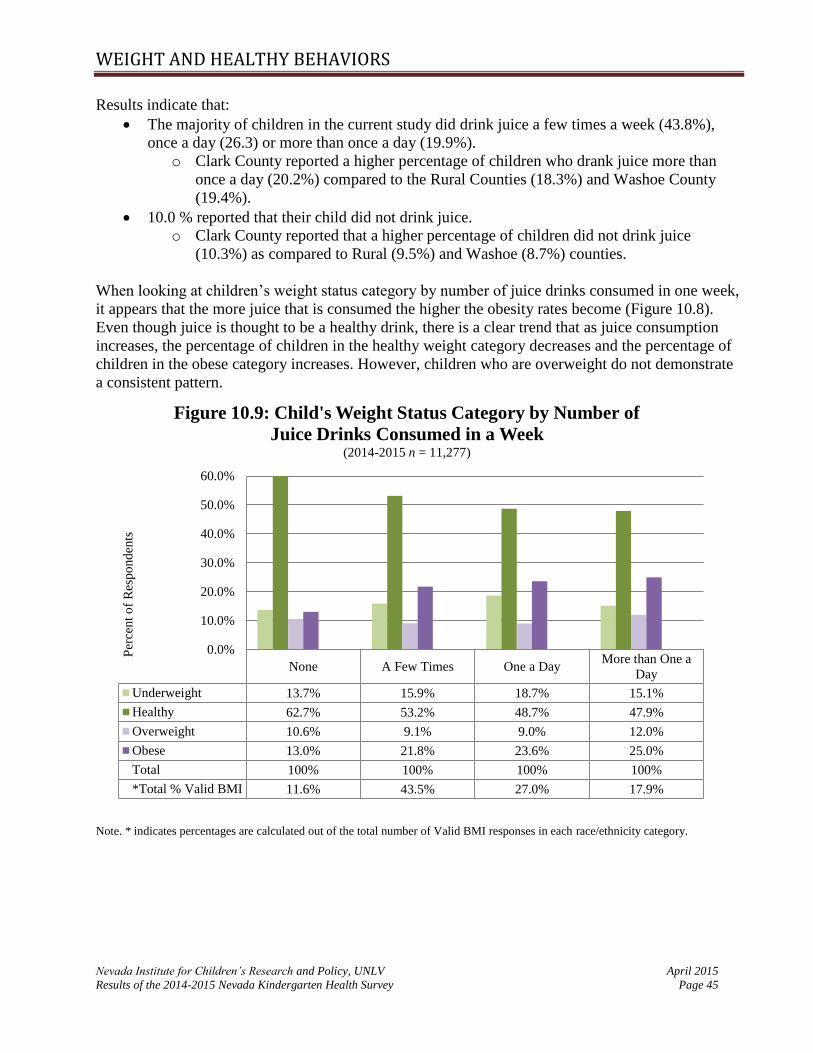
WEIGHT AND HEALTHY BEHAVIORS
Nevada Institute for Children’s Research and Policy, UNLV April 2015
Results of the 2014-2015 Nevada Kindergarten Health Survey Page 45
Results indicate that:
The majority of children in the current study did drink juice a few times a week (43.8%),
once a day (26.3) or more than once a day (19.9%).
o Clark County reported a higher percentage of children who drank juice more than
once a day (20.2%) compared to the Rural Counties (18.3%) and Washoe County
(19.4%).
10.0 % reported that their child did not drink juice.
o Clark County reported that a higher percentage of children did not drink juice
(10.3%) as compared to Rural (9.5%) and Washoe (8.7%) counties.
When looking at children’s weight status category by number of juice drinks consumed in one week,
it appears that the more juice that is consumed the higher the obesity rates become (Figure 10.8).
Even though juice is thought to be a healthy drink, there is a clear trend that as juice consumption
increases, the percentage of children in the healthy weight category decreases and the percentage of
children in the obese category increases. However, children who are overweight do not demonstrate
a consistent pattern.
Note. * indicates percentages are calculated out of the total number of Valid BMI responses in each race/ethnicity category.
None A Few Times One a DayMore than One a
Day
Underweight 13.7% 15.9% 18.7% 15.1%
Healthy 62.7% 53.2% 48.7% 47.9%
Overweight 10.6% 9.1% 9.0% 12.0%
Obese 13.0% 21.8% 23.6% 25.0%
Total 100% 100% 100% 100%
*Total % Valid BMI 11.6% 43.5% 27.0% 17.9%
0.0%
10.0%
20.0%
30.0%
40.0%
50.0%
60.0%
Per
cent
of
Res
po
nd
ents
Figure 10.9: Child's Weight Status Category by Number of
Juice Drinks Consumed in a Week (2014-2015 n = 11,277)

WEIGHT AND HEALTHY BEHAVIORS
Nevada Institute for Children’s Research and Policy, UNLV April 2015
Results of the 2014-2015 Nevada Kindergarten Health Survey Page 46
Infant Feeding Behaviors Breastfeeding has been shown to have many health benefits for both the breastfeeding mother and
her child. Breastfeeding has been associated with reduced risk of cancer, diabetes, and postpartum
depression in mothers, and reduced risk of ear infections, gastrointestinal issues, allergies, SIDS,
obesity, and diabetes in children (United States Department of Health and Human Services, 2011).
Starting in 2007, the Centers for Disease Control and Prevention has issued a Breastfeeding Report
Card that provides both national and state level data. According to the 2014 report card, Nevada is
1.7 percentage points above the national average (79.2%) for babies who have ever been breastfed,
and Nevada is slightly below the national average for exclusive breastfeeding at 6 months (US =
18.8%; NV = 18.0%) but above the national average at 3 months (US = 40.7%; NV = 43.9%) (CDC,
2014a).
In order to obtain more detailed information about breastfeeding practices in Nevada, a new question
was added to the 2012-2013 survey to determine feeding practices of children entering kindergarten
when they were one, three, and six months old. As illustrated in Figure 10.10, 48.3% of respondents
indicated that their child was breastfed exclusively at one month old and this percentage declined at
both the three and six month time periods. These results are consistent with the data from 2012-
2013. The Healthy People 2020 breastfeeding objectives are to increase the proportion of infants
who are breastfed ever (81.9%), and at 6 months nonexclusively (60.6%) (CDC, 2013). According
to the 2014-2015 KHS survey, 41.8% of children entering kindergarten in Nevada were breastfed at
6 months nonexclusively, which is a slight decrease from last year (45.8%). This year, we extended
the question to include feeding practices at 12 months. Results indicated that 13.9% of respondents
breastfed exclusively at 12 months and 30.8% nonexclusively.
It is important to note that there are many reasons that a child may not receive breast milk
exclusively during the first six months (US Department of Health and Human Services, 2011). The
KHS expanded this year to capture information regarding barriers to breastfeeding. Of those who
reported barriers (32,163), the most frequently reported barrier was the inability to produce milk
(35.4%), followed by medical conditions (allergies, premature birth, etc.; 26.5%), issues latching
onto the nipple (14%), and work/school (15.4%). Other barriers (8.7%) included lack of support,
foster children, the baby was not gaining enough weight, and breast implants.

WEIGHT AND HEALTHY BEHAVIORS
Nevada Institute for Children’s Research and Policy, UNLV April 2015
Results of the 2014-2015 Nevada Kindergarten Health Survey Page 47
There is mixed literature on the relationship between breastfeeding as a protective factor for obesity.
Some research has indicated that breastfeeding has small preventative effects against obesity in
children (Gubbels, Thijs, Stafleu, Von Buuren, & Kremers, 2011). Figure 10.11 illustrates child
weight status categories by infant feeding behaviors. Children who received breast milk exclusively
at all time periods tend to be at a healthy weight and are less likely to be obese, compared to those
children who received both breast milk and formula or formula only.
Breast OnlyBreast and
FormulaFormula Only
Other (e.g.
Food)Not Sure
1 Month 48.3% 22.2% 27.9% 0.4% 1.2%
3 Months 34.9% 24.5% 38.5% 1.0% 1.1%
6 Months 21.9% 19.9% 46.0% 10.9% 1.3%
12 Months 13.9% 16.9% 40.6% 27.3% 1.3%
0.0%
10.0%
20.0%
30.0%
40.0%
50.0%
60.0%P
erce
nt
of
Res
po
nd
ents
Figure 10.10: Infancy Feeding Habits(2014-2015 1 month n = 20,341 ; 3 months n = 20,436; 6 months n = 16,380; 12 months n = 20,605 )
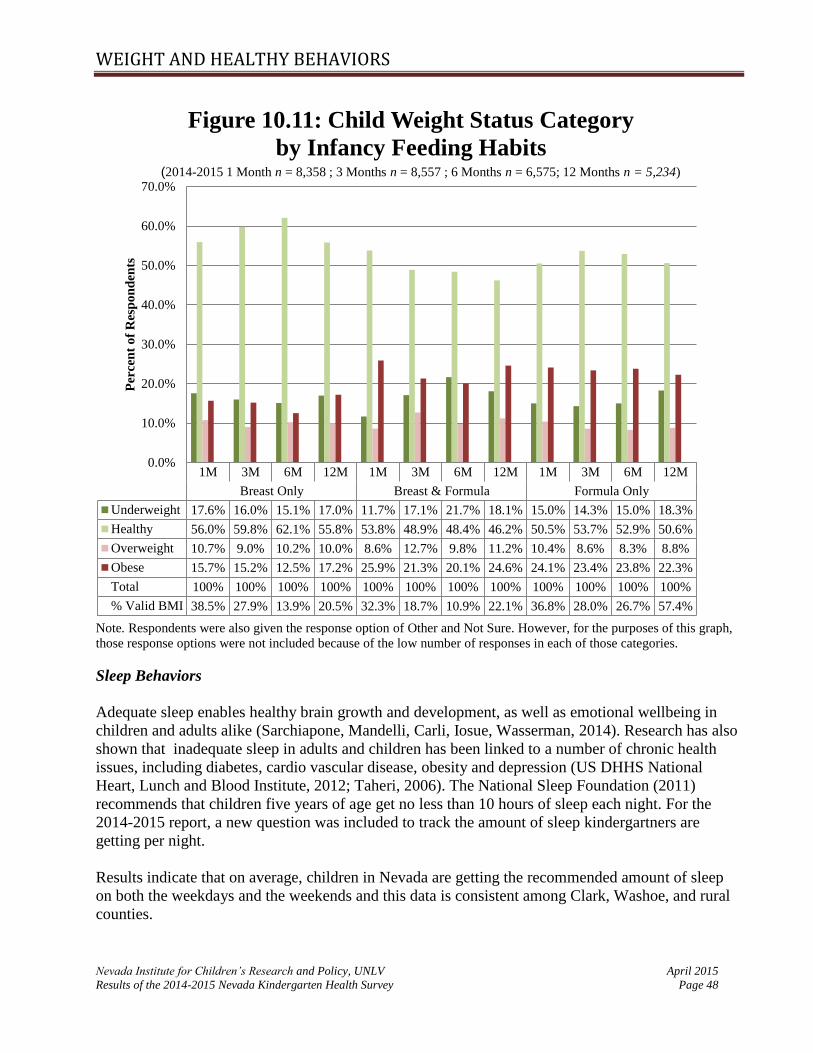
WEIGHT AND HEALTHY BEHAVIORS
Nevada Institute for Children’s Research and Policy, UNLV April 2015
Results of the 2014-2015 Nevada Kindergarten Health Survey Page 48
Note. Respondents were also given the response option of Other and Not Sure. However, for the purposes of this graph,
those response options were not included because of the low number of responses in each of those categories.
Sleep Behaviors
Adequate sleep enables healthy brain growth and development, as well as emotional wellbeing in
children and adults alike (Sarchiapone, Mandelli, Carli, Iosue, Wasserman, 2014). Research has also
shown that inadequate sleep in adults and children has been linked to a number of chronic health
issues, including diabetes, cardio vascular disease, obesity and depression (US DHHS National
Heart, Lunch and Blood Institute, 2012; Taheri, 2006). The National Sleep Foundation (2011)
recommends that children five years of age get no less than 10 hours of sleep each night. For the
2014-2015 report, a new question was included to track the amount of sleep kindergartners are
getting per night.
Results indicate that on average, children in Nevada are getting the recommended amount of sleep
on both the weekdays and the weekends and this data is consistent among Clark, Washoe, and rural
counties.
1M 3M 6M 12M 1M 3M 6M 12M 1M 3M 6M 12M
Breast Only Breast & Formula Formula Only
Underweight 17.6% 16.0% 15.1% 17.0% 11.7% 17.1% 21.7% 18.1% 15.0% 14.3% 15.0% 18.3%
Healthy 56.0% 59.8% 62.1% 55.8% 53.8% 48.9% 48.4% 46.2% 50.5% 53.7% 52.9% 50.6%
Overweight 10.7% 9.0% 10.2% 10.0% 8.6% 12.7% 9.8% 11.2% 10.4% 8.6% 8.3% 8.8%
Obese 15.7% 15.2% 12.5% 17.2% 25.9% 21.3% 20.1% 24.6% 24.1% 23.4% 23.8% 22.3%
Total 100% 100% 100% 100% 100% 100% 100% 100% 100% 100% 100% 100%
% Valid BMI 38.5% 27.9% 13.9% 20.5% 32.3% 18.7% 10.9% 22.1% 36.8% 28.0% 26.7% 57.4%
0.0%
10.0%
20.0%
30.0%
40.0%
50.0%
60.0%
70.0%
Per
cen
t o
f R
esp
on
den
tsFigure 10.11: Child Weight Status Category
by Infancy Feeding Habits (2014-2015 1 Month n = 8,358 ; 3 Months n = 8,557 ; 6 Months n = 6,575; 12 Months n = 5,234)

WEIGHT AND HEALTHY BEHAVIORS
Nevada Institute for Children’s Research and Policy, UNLV April 2015
Results of the 2014-2015 Nevada Kindergarten Health Survey Page 49
Table 10. 4 Average Sleep per Night for the State of Nevada
n Average Standard Deviation
Average Weekday Per Night 31,456 10.41 (.82)
Average Weekend Per Night 28,494 10.59 (.96)
Though napping is commonly associated with a productive daily routine for young children, recent
literature has stated that naps for children over 2 years old contribute to restlessness and poorer sleep
at night than children who do not nap during the day (Staton, Smith, Pattinson, & Thorpe, 2015;
Lam, Mahone, Mason, & Scharf, 2011; Spittler, 2007). Children require adequate night time sleep in
order to support healthy brain growth and development, so the amount of time per day children
spend napping on weekends and on weekdays (if at all) was also added to this year’s survey.
Therefore, the 2014-2015 survey also inquired about the average number of hours a child naps
during the day.
Results are as follows:
Naps During the Week
o 23.2% of respondents indicated that their child took a nap on weekdays
For 29% of the data, it could not be determined if the child did or did not take
a nap.
o The average length of the naps were 1.44 hours (SD=.63) and the range was between
.17 hours and 4.5 hours (n = 6,089).
o This data is consistent among Clark, Washoe, and rural counties.
Naps on the Weekend
o 21% of respondents indicated that their child took a nap on the weekend.
For 40% of the data, it could not be determined if the child did or did not take
a nap.
o The average length of the naps were 1.60 hours (SD=.67) and the range was between
.25 hours and 4.5 hours (n = 5,716).
o This data is also consistent among Clark, Washoe, and rural counties.

Nevada Institute for Children’s Research and Policy, UNLV April 2015
Results of the 2014-2015 Nevada Kindergarten Health Survey Page 50
APPENDIX A:
SUMMARY OF 2014-2015 WEIGHTED SURVEY RESULTS BY COUNTY
Table 11.1 below outlines the percentages of responses for the 2014-2015 school year survey
results by Clark County, Washoe County, and the Rural Counties. Not all respondents answered
every question on the surveys that were returned. All percentages calculated are based on the
total weighted number of people answering the question, rather than the total number of people
who completed a survey. In addition, percentages are represented by county(ies); therefore
percentages will total 100% within each county category and not across all county categories.
Table 11.1 Comparison of 2014-2015 Weighted Data by County
Survey Indicator State
(Percents)
Clark
County (Percents)
Washoe
County (Percents)
Rural
Counties (Percents)
Survey Participation -- 73.6 14.6 11.8
Demographic Information
Gender of Kindergartener
Male 49.9 49.9 49.5 50.4
Female 50.1 50.1 50.5 49.6
Race/Ethnicity of Kindergartener
African American/Black 6.3 7.9 2.6 0.5
Asian/Pacific Islander 6.5 7.7 4.6 1.1
Caucasian 38.3 33.8 42.4 61.2
Hispanic 33.7 35.0 36.9 21.4
Native American/ Alaska
Native 1.1 0.4 1.9 4.4
Other Race 0.1 0.1 0.0 0.2
Multiple Races 14.1 15.1 11.5 11.2
Annual Household Income of Survey Respondents
$0-$14,999 17.3 17.7 16.8 14.9
$15,000-$24,999 15.9 15.5 18.8 14.6
$25,000-$34,999 13.1 12.9 15.2 11.3
$35,000-$44,999 8.7 8.3 9.8 10.0
$45,000-$54,999 7.5 7.5 7.4 7.9
$55,000-$64,999 6.3 6.2 5.3 8.5
$65,000-$74,999 5.7 5.8 4.9 5.8
$75,000-$84,999 5.8 5.9 5.1 6.1
$85,000-$94,999 3.9 3.8 3.9 4.9
$95,000+ 15.8 16.4 12.9 15.9

APPENDIX A: WEIGHTED 2014-2015 SURVEY RESULTS BY COUNTY
Nevada Institute for Children’s Research and Policy, UNLV April 2015
Results of the 2014-2015 Nevada Kindergarten Health Survey Page 51
Table 11.1 continued
Survey Indicator State
(Percents)
Clark
County (Percents)
Washoe
County (Percents)
Rural
Counties (Percents)
Type of School Child Attended in the Past 12 Months
Head Start 5.8 4.9 8.5 10.2
Other Facility/Center 22.6 22.4 22.0 25.2
Home-Based 5.1 5.4 3.7 4.9
School District Preschool 24.2 24.9 20.9 23.4
University Campus
Preschool 0.9 0.7 0.5 4.2
None/Stayed at Home 33.5 34.0 35.8 23.2
Friends/Family Care 3.1 3.1 2.9 3.7
Multiple 4.7 4.5 5.7 5.2
Average Preschool Hours of Attendance
0 Hours 31.8 31.9 35.5 23.6
5-10 Hours 17.7 18.6 12.1 20.3
10-15 Hours 14.4 13.7 13.8 22.9
15-20 Hours 8.6 7.8 10.4 12.9
20-30 Hours 8.4 8.6 8.4 6.2
30-40 Hours 11.5 11.4 13.1 9.9
More than 40 Hours 7.6 8.1 6.7 4.2
Single Parent or Guardian 29.9 30.5 30.6 25.6
Average # of Children in
Household (Standard Deviation)
2.53
(1.20)
2.53
(1.21)
2.55
(1.20)
2.52
(1.10)
Average # of Adults in Household
(Standard Deviation)
2.12
(0.86)
2.14
(0.88)
2.12
(0.85)
2.01
(0.63)
Average Age of Mother/Guardian
(Standard Deviation)
33.10
(6.94)
33.29
(6.91)
32.62
(6.81)
32.55
(7.21)
Average Age of Father/Guardian
(Standard Deviation)
35.93
(7.67)
36.17
(7.65)
35.53
(7.47)
34.94
(7.97)
Health Insurance Status and Access to Health Care
Health Insurance Type
Uninsured 7.6 7.8 6.7 7.7
Private 48.4 48.5 44.3 53.1
Medicaid 31.3 30.9 35.4 28.2
Nevada Check-up 6.7 7.0 7.6 4.2
Other 2.8 2.9 2.3 3.0
Multiple Types 3.1 2.9 3.7 3.8
Kindergartner Does NOT Have a
Primary Care Provider 13.6 12.6 13.8 19.1
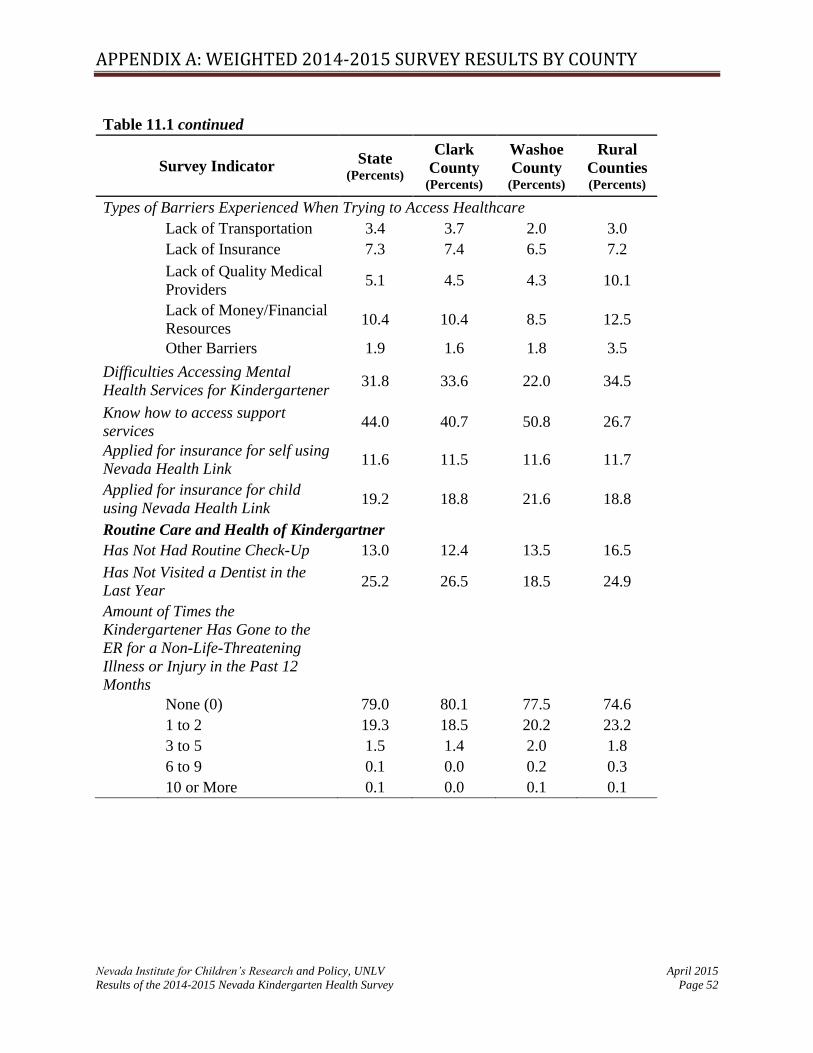
APPENDIX A: WEIGHTED 2014-2015 SURVEY RESULTS BY COUNTY
Nevada Institute for Children’s Research and Policy, UNLV April 2015
Results of the 2014-2015 Nevada Kindergarten Health Survey Page 52
Table 11.1 continued
Survey Indicator State
(Percents)
Clark
County (Percents)
Washoe
County (Percents)
Rural
Counties (Percents)
Types of Barriers Experienced When Trying to Access Healthcare
Lack of Transportation 3.4 3.7 2.0 3.0
Lack of Insurance 7.3 7.4 6.5 7.2
Lack of Quality Medical
Providers 5.1 4.5 4.3 10.1
Lack of Money/Financial
Resources 10.4 10.4 8.5 12.5
Other Barriers 1.9 1.6 1.8 3.5
Difficulties Accessing Mental
Health Services for Kindergartener 31.8 33.6 22.0 34.5
Know how to access support
services 44.0 40.7 50.8 26.7
Applied for insurance for self using
Nevada Health Link 11.6 11.5 11.6 11.7
Applied for insurance for child
using Nevada Health Link 19.2 18.8 21.6 18.8
Routine Care and Health of Kindergartner
Has Not Had Routine Check-Up 13.0 12.4 13.5 16.5
Has Not Visited a Dentist in the
Last Year 25.2 26.5 18.5 24.9
Amount of Times the
Kindergartener Has Gone to the
ER for a Non-Life-Threatening
Illness or Injury in the Past 12
Months
None (0) 79.0 80.1 77.5 74.6
1 to 2 19.3 18.5 20.2 23.2
3 to 5 1.5 1.4 2.0 1.8
6 to 9 0.1 0.0 0.2 0.3
10 or More 0.1 0.0 0.1 0.1

APPENDIX A: WEIGHTED 2014-2015 SURVEY RESULTS BY COUNTY
Nevada Institute for Children’s Research and Policy, UNLV April 2015
Results of the 2014-2015 Nevada Kindergarten Health Survey Page 53
Table 11.1 continued
Survey Indicator State
(Percent)
Clark
County (Percent)
Washoe
County (Percent)
Rural
Counties (Percent)
Types of Medical Conditions Seen in Kindergarteners
ADD/ADHD 1.3 1.1 1.3 2.1
Allergies 15.5 15.9 11.4 17.5
Asthma 6.9 7.1 5.5 7.7
Autism 0.5 0.5 0.6 0.7
Cancer 0.1 0.1 0.2 0.0
Diabetes 0.1 0.1 0.2 0.2
Glasses/Contacts 4.7 4.5 4.6 6.2
Hearing Aid/Impairment 0.4 0.4 0.2 0.2
Mental Health Condition 0.4 0.3 0.2 0.8
Physical Disability 0.4 0.3 0.5 0.5
Seizures 0.4 0.2 0.6 0.8
Other Condition 4.7 4.6 5.2 5.0
Received a Developmental
Screening in past 12 months 23.2 21.8 24.6 30.2
Weight and Healthy Behaviors
Underweight 16.1 16.1 19.0 13.4
Healthy Weight 52.4 52.6 50.7 52.8
Overweight 9.8 9.8 9.9 10.1
Obese 21.7 21.6 20.3 23.7
Amount of Times per Week that Child Has at Least 30 Minutes of Physical Activity
0-1 Times 2.4 2.5 1.8 1.4
2-3 Times 17.6 19.2 12.9 11.2
4-5 Times 28.6 29.5 27.4 21.6
6 or More Times 51.4 48.8 58.0 65.9
Hours of Television Watched on an Average School Day
None 2.1 2.1 1.7 3.0
Less than One 12.5 12.0 11.2 20.2
1 Hour 30.0 30.0 29.0 31.8
2 Hours 34.6 34.9 34.6 31.1
3 Hours 14.8 14.9 17.3 9.5
4 Hours 4.1 4.3 4.0 3.1
5 Hours or More 1.8 1.8 2.2 1.3
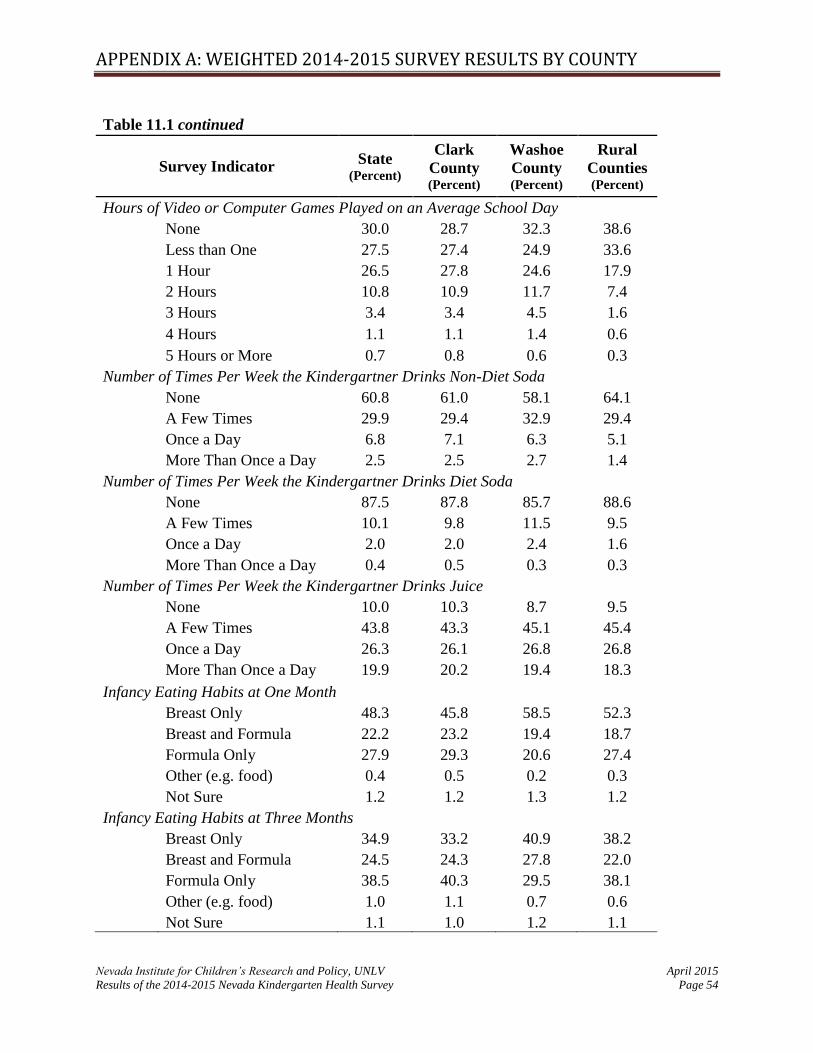
APPENDIX A: WEIGHTED 2014-2015 SURVEY RESULTS BY COUNTY
Nevada Institute for Children’s Research and Policy, UNLV April 2015
Results of the 2014-2015 Nevada Kindergarten Health Survey Page 54
Table 11.1 continued
Survey Indicator State
(Percent)
Clark
County (Percent)
Washoe
County (Percent)
Rural
Counties (Percent)
Hours of Video or Computer Games Played on an Average School Day
None 30.0 28.7 32.3 38.6
Less than One 27.5 27.4 24.9 33.6
1 Hour 26.5 27.8 24.6 17.9
2 Hours 10.8 10.9 11.7 7.4
3 Hours 3.4 3.4 4.5 1.6
4 Hours 1.1 1.1 1.4 0.6
5 Hours or More 0.7 0.8 0.6 0.3
Number of Times Per Week the Kindergartner Drinks Non-Diet Soda
None 60.8 61.0 58.1 64.1
A Few Times 29.9 29.4 32.9 29.4
Once a Day 6.8 7.1 6.3 5.1
More Than Once a Day 2.5 2.5 2.7 1.4
Number of Times Per Week the Kindergartner Drinks Diet Soda
None 87.5 87.8 85.7 88.6
A Few Times 10.1 9.8 11.5 9.5
Once a Day 2.0 2.0 2.4 1.6
More Than Once a Day 0.4 0.5 0.3 0.3
Number of Times Per Week the Kindergartner Drinks Juice
None 10.0 10.3 8.7 9.5
A Few Times 43.8 43.3 45.1 45.4
Once a Day 26.3 26.1 26.8 26.8
More Than Once a Day 19.9 20.2 19.4 18.3
Infancy Eating Habits at One Month
Breast Only 48.3 45.8 58.5 52.3
Breast and Formula 22.2 23.2 19.4 18.7
Formula Only 27.9 29.3 20.6 27.4
Other (e.g. food) 0.4 0.5 0.2 0.3
Not Sure 1.2 1.2 1.3 1.2
Infancy Eating Habits at Three Months
Breast Only 34.9 33.2 40.9 38.2
Breast and Formula 24.5 24.3 27.8 22.0
Formula Only 38.5 40.3 29.5 38.1
Other (e.g. food) 1.0 1.1 0.7 0.6
Not Sure 1.1 1.0 1.2 1.1

APPENDIX A: WEIGHTED 2014-2015 SURVEY RESULTS BY COUNTY
Nevada Institute for Children’s Research and Policy, UNLV April 2015
Results of the 2014-2015 Nevada Kindergarten Health Survey Page 55
Table 11.1 continued
Survey Indicator State
(Percent)
Clark
County (Percent)
Washoe
County (Percent)
Rural
Counties (Percent)
Infancy Eating Habits at Six Months
Breast Only 21.9 20.9 26.1 22.6
Breast and Formula 19.9 20.0 20.9 18.2
Formula Only 46.0 46.7 41.8 46.8
Other (e.g. food) 10.9 11.3 9.7 10.4
Not Sure 1.2 1.1 1.5 2.0
Infancy Eating Habits at Twelve Months
Breast Only 13.9 13.0 17.1 15.1
Breast and Formula 16.9 17.0 19.5 13.2
Formula Only 40.6 41.9 36.8 36.4
Other (e.g. food) 27.3 26.9 24.9 32.8
Not Sure 1.3 1.2 1.7 2.1
Average # Hours of Sleep Per
Night on Weekdays
(Standard Deviation)
10.41
(.83)
10.36
(.81)
10.65
(.86)
10.42
(.74)
Average # Hours of Sleep Per
Night on Weekends
(Standard Deviation)
10.59
(.96)
10.57
(.97)
10.67
(.95)
10.66
(.88)
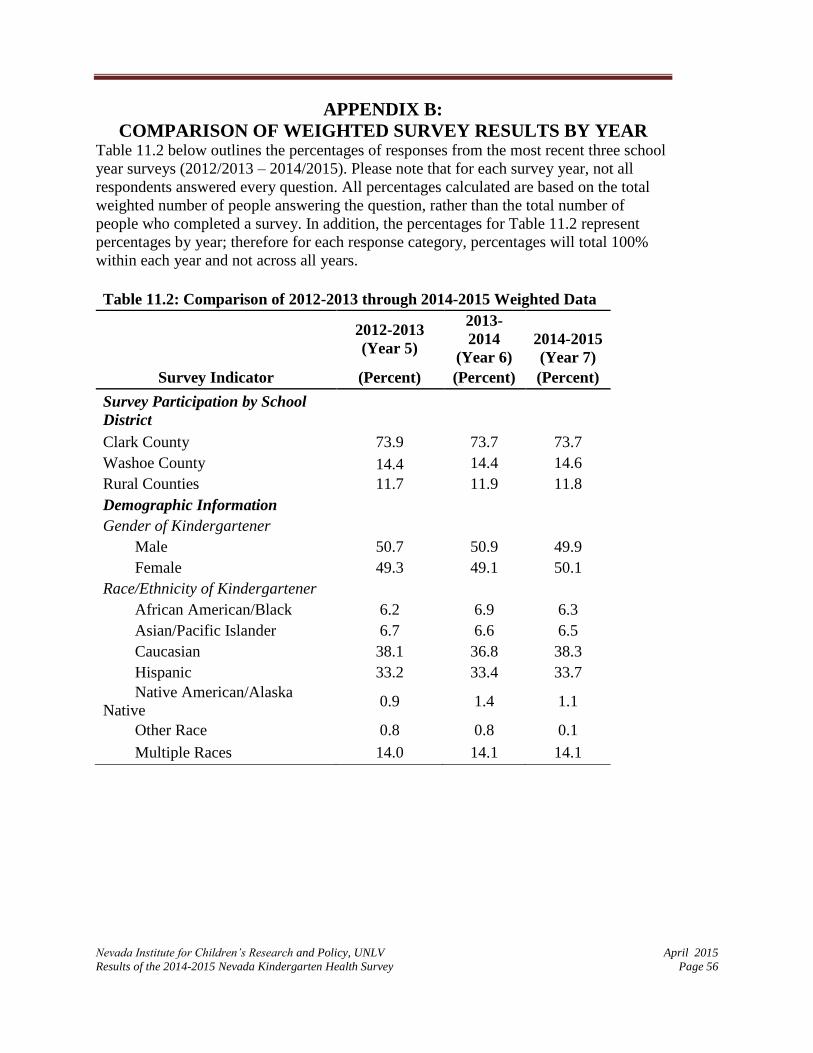
Nevada Institute for Children’s Research and Policy, UNLV April 2015
Results of the 2014-2015 Nevada Kindergarten Health Survey Page 56
APPENDIX B:
COMPARISON OF WEIGHTED SURVEY RESULTS BY YEAR Table 11.2 below outlines the percentages of responses from the most recent three school
year surveys (2012/2013 – 2014/2015). Please note that for each survey year, not all
respondents answered every question. All percentages calculated are based on the total
weighted number of people answering the question, rather than the total number of
people who completed a survey. In addition, the percentages for Table 11.2 represent
percentages by year; therefore for each response category, percentages will total 100%
within each year and not across all years.
Table 11.2: Comparison of 2012-2013 through 2014-2015 Weighted Data
2012-2013
(Year 5)
2013-
2014
(Year 6)
2014-2015
(Year 7)
Survey Indicator (Percent) (Percent) (Percent)
Survey Participation by School
District
Clark County 73.9 73.7 73.7
Washoe County 14.4 14.4 14.6
Rural Counties 11.7 11.9 11.8
Demographic Information Gender of Kindergartener Male 50.7 50.9 49.9
Female 49.3 49.1 50.1
Race/Ethnicity of Kindergartener
African American/Black 6.2 6.9 6.3
Asian/Pacific Islander 6.7 6.6 6.5
Caucasian 38.1 36.8 38.3
Hispanic 33.2 33.4 33.7
Native American/Alaska
Native 0.9 1.4 1.1
Other Race 0.8 0.8 0.1
Multiple Races 14.0 14.1 14.1

APPENDIX B: WEIGHTED SURVEY RESULTS BY SURVEY YEAR
Nevada Institute for Children’s Research and Policy, UNLV April 2015
Results of the 2014-2015 Nevada Kindergarten Health Survey Page 57
Table 11.2 Continued
2012-2013
(Year 5)
2013-2014
(Year 6)
2014-2015
(Year 7)
Survey Indicator (Percent) (Percent) (Percent)
Annual Household Income of
Survey Respondent $0-$14,999 18.1 18.0 17.3
$15,000-$24,999 15.6 15.4 15.9
$25,000-$34,999 12.9 12.6 13.1
$35,000-$44,999 9.3 9.6 8.7
$45,000-$54,000 8.0 7.6 7.5
$55,000-$64,999 6.3 6.7 6.3
$65,000-$74,999 6.1 6.1 5.7
$75,000-$84,999 6.0 5.5 5.8
$85,000-94,999 4.0 4.0 3.9
$95,000 + 13.7 14.4 15.8
Type of School Child Attended in
the Past 12 Months
Head Start 5.8 6.6 5.8
Other Facility/Care 24.7 21.9 22.6
Home-Based 6.6 5.8 5.1
University Campus Pre
School 1.2 1.1 0.9
School District Preschool 19.2 21.8 24.2
None/Stayed at Home 40 35.9 33.5
Friends/Family Care - 2.8 3.1
Multiple 2.4 4 4.7
Average Preschool Hours of
Attendance
0 Hours - 31.6 31.8
5-10 Hours - 17.7 17.7
10-15 Hours - 15.3 14.4
15-20 Hours - 8.9 8.6
20-30 Hours - 7.5 8.4
30-40 Hours - 11 11.5
More than 40 Hours - 8 7.6 Note: - Indicates no data available

APPENDIX B: WEIGHTED SURVEY RESULTS BY SURVEY YEAR
Nevada Institute for Children’s Research and Policy, UNLV April 2015
Results of the 2014-2015 Nevada Kindergarten Health Survey Page 58
Table 11.2 Continued
2012-2013
(Year 5)
2013-2014
(Year 6)
2014-2015
(Year 7)
Survey Indicator (Percent) (Percent) (Percent)
Single Parent or Guardian 29.5 31.2 29.9
Average # of Children in
Household (Standard Deviation) 2.54 (1.2)
2.55
(1.22) 2.53 (1.20)
Average # of Adults in Household
(Standard Deviation) 2.08 (0.81)
2.09
(0.79) 2.12 (0.86)
Average Age of Mother/Guardian
(Standard Deviation) 33.02 (6.69)
32.92
(6.75)
33.10
(6.94)
Average Age of Father/Guardian
(Standard Deviation) 35.7 (7.3)
35.56
(7.51)
35.93
(7.67)
Health Insurance Status and Access to Health Care
Health Insurance Type
Uninsured 13.6 12.6 7.6
Private 47.6 50.0 48.4
Medicaid 23.5 25.9 31.3
Nevada Check-Up 6.3 6.5 6.7
Other 6.4 2.1 2.8
Multiple Types 2.6 2.9 3.1
Kindergartner Does Not Have a
Primary Care Provider 16.6 13.6 13.6
Types of Barriers Experienced
When Trying to Access
Healthcare
Lack of Transportation 3.0 3.4 3.4
Lack of Insurance 10.3 10.1 7.3
Lack of Quality Medical
Providers 4.9 5.2 5.1
Lack of Money/Financial
Resources 14.6 13.8 10.4
Other Barriers 2.3 2.1 1.9
Respondent Has Experienced
Difficulties Attempting to Access
Mental Health Services for
Kindergartener
33.0 35.9 31.8
Knows how to access support
services - 43.1 44.0
Note: - Indicates no data available
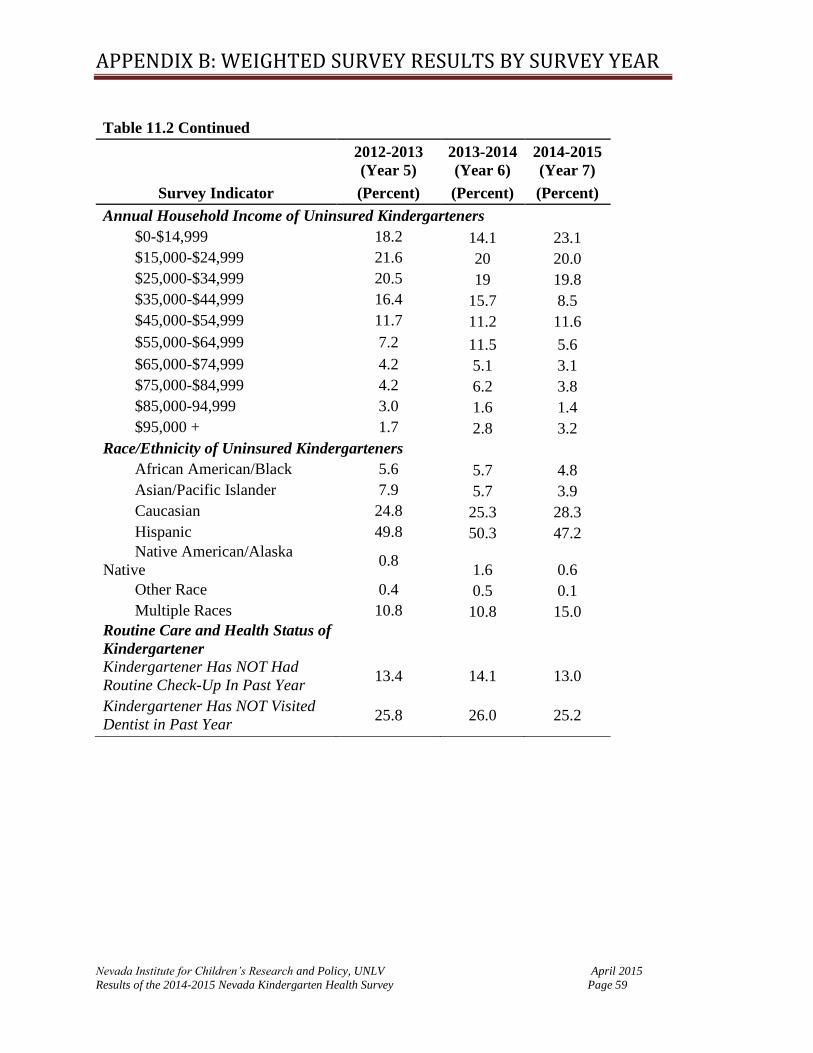
APPENDIX B: WEIGHTED SURVEY RESULTS BY SURVEY YEAR
Nevada Institute for Children’s Research and Policy, UNLV April 2015
Results of the 2014-2015 Nevada Kindergarten Health Survey Page 59
Table 11.2 Continued
2012-2013
(Year 5)
2013-2014
(Year 6)
2014-2015
(Year 7)
Survey Indicator (Percent) (Percent) (Percent)
Annual Household Income of Uninsured Kindergarteners $0-$14,999 18.2 14.1 23.1
$15,000-$24,999 21.6 20 20.0
$25,000-$34,999 20.5 19 19.8
$35,000-$44,999 16.4 15.7 8.5
$45,000-$54,999 11.7 11.2 11.6
$55,000-$64,999 7.2 11.5 5.6
$65,000-$74,999 4.2 5.1 3.1
$75,000-$84,999 4.2 6.2 3.8
$85,000-94,999 3.0 1.6 1.4
$95,000 + 1.7 2.8 3.2
Race/Ethnicity of Uninsured Kindergarteners African American/Black 5.6 5.7 4.8
Asian/Pacific Islander 7.9 5.7 3.9
Caucasian 24.8 25.3 28.3
Hispanic 49.8 50.3 47.2
Native American/Alaska
Native 0.8
1.6 0.6
Other Race 0.4 0.5 0.1
Multiple Races 10.8 10.8 15.0
Routine Care and Health Status of
Kindergartener Kindergartener Has NOT Had
Routine Check-Up In Past Year 13.4 14.1 13.0
Kindergartener Has NOT Visited
Dentist in Past Year 25.8 26.0 25.2
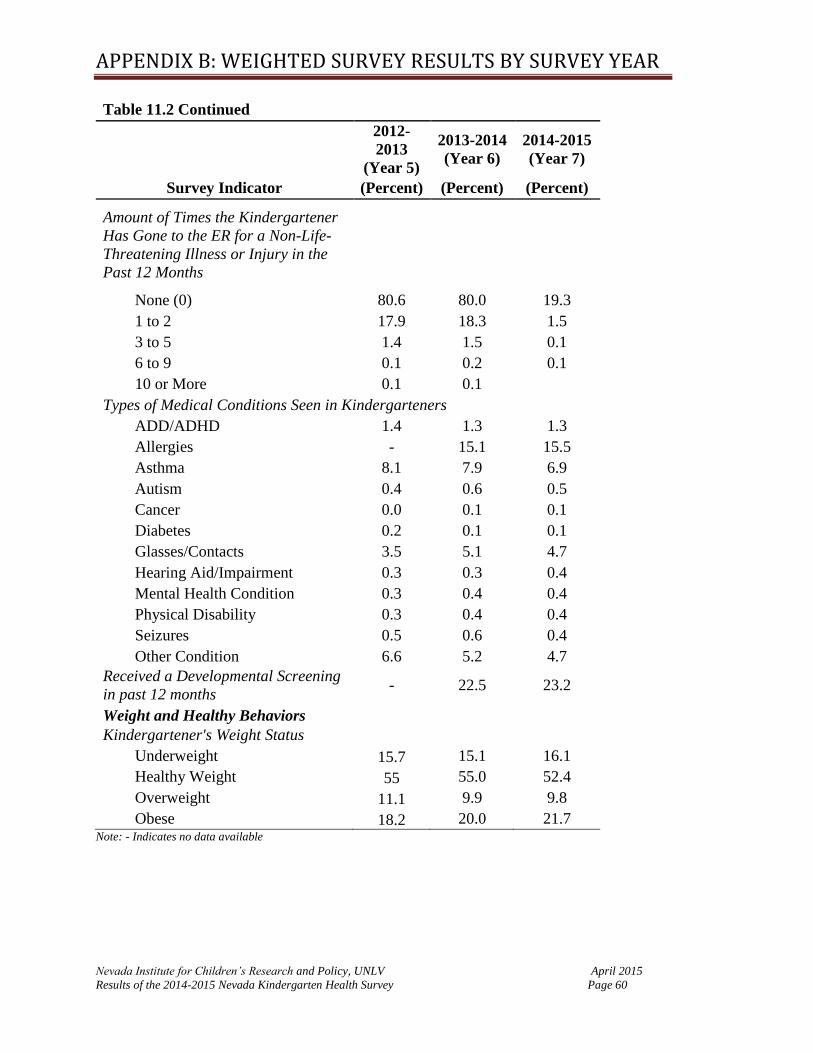
APPENDIX B: WEIGHTED SURVEY RESULTS BY SURVEY YEAR
Nevada Institute for Children’s Research and Policy, UNLV April 2015
Results of the 2014-2015 Nevada Kindergarten Health Survey Page 60
Table 11.2 Continued
2012-
2013
(Year 5)
2013-2014
(Year 6)
2014-2015
(Year 7)
Survey Indicator (Percent) (Percent) (Percent)
Amount of Times the Kindergartener
Has Gone to the ER for a Non-Life-
Threatening Illness or Injury in the
Past 12 Months
None (0) 80.6 80.0 19.3
1 to 2 17.9 18.3 1.5
3 to 5 1.4 1.5 0.1
6 to 9 0.1 0.2 0.1
10 or More 0.1 0.1 Types of Medical Conditions Seen in Kindergarteners ADD/ADHD 1.4 1.3 1.3
Allergies - 15.1 15.5
Asthma 8.1 7.9 6.9
Autism 0.4 0.6 0.5
Cancer 0.0 0.1 0.1
Diabetes 0.2 0.1 0.1
Glasses/Contacts 3.5 5.1 4.7
Hearing Aid/Impairment 0.3 0.3 0.4
Mental Health Condition 0.3 0.4 0.4
Physical Disability 0.3 0.4 0.4
Seizures 0.5 0.6 0.4
Other Condition 6.6 5.2 4.7
Received a Developmental Screening
in past 12 months - 22.5 23.2
Weight and Healthy Behaviors Kindergartener's Weight Status
Underweight 15.7 15.1 16.1
Healthy Weight 55 55.0 52.4
Overweight 11.1 9.9 9.8
Obese 18.2 20.0 21.7 Note: - Indicates no data available

APPENDIX B: WEIGHTED SURVEY RESULTS BY SURVEY YEAR
Nevada Institute for Children’s Research and Policy, UNLV April 2015
Results of the 2014-2015 Nevada Kindergarten Health Survey Page 61
Table 11.2 Continued
2012-2013
(Year 5)
2013-2014
(Year 6)
2014-2015
(Year 7)
Survey Indicator (Percent) (Percent) (Percent)
Times A Week Kindergartner Does at Last 30min of Physical Activity
0-1 Times 2.8 2.5 2.4
2-3 Times 17.7 17.1 17.6
4-5 Times 27.7 27.2 28.6
6 or More Times 51.8 53.3 51.4
Hours of Television Watched on an Average School Day
None 1.8 2.0 2.1
Less than One 11.8 12.1 12.5
1 Hour 28.8 29.2 30.0
2 Hours 36.8 36.2 34.6
3 Hours 15.1 14.4 14.8
4 Hours 3.6 4.2 4.1
5 Hours or More 2.0 2.0 1.8
Hours of Video or Computer Games Played on an Average School Day
None 35.1 31.7 30.0
Less than One 29.3 29.0 27.5
1 Hour 24.1 25.2 26.5
2 Hours 8.6 10.3 10.8
3 Hours 1.8 2.8 3.4
4 Hours 0.7 0.7 1.1
5 Hours or More 0.4 0.4 0.7
Number of Times Per Week the Kindergartner Drinks Non-Diet Soda
None 55.6 59.6 60.8
A Few Times 33.8 30.7 29.9
Once a Day 6.9 6.8 6.8
More Than Once a Day 3.7 2.9 2.5

APPENDIX B: WEIGHTED SURVEY RESULTS BY SURVEY YEAR
Nevada Institute for Children’s Research and Policy, UNLV April 2015
Results of the 2014-2015 Nevada Kindergarten Health Survey Page 62
Table 11.2 Continued
2012-2013
(Year 5)
2013-2014
(Year 6)
2014-2015
(Year 7)
Survey Indicator (Percent) (Percent) (Percent)
Number of Times Per Week the Kindergartner Drinks Diet Soda
None 82.9 85.7 87.5
A Few Times 14.2 11.3 10.1
Once a Day 2.5 2.4 2.0
More Than Once a Day 0.4 0.5 0.4
Number of Times Per Week the Kindergartner Drinks Juice
None - 8.6 10.0
A Few Times - 40.1 43.8
Once a Day - 27.7 26.3
More Than Once a Day - 23.5 19.9
Infancy Eating Habits at One Month
Breast Only 45.5 46.1 48.3
Breast and Formula 21.8 22.6 22.2
Formula Only 30.6 29.6 27.9
Other (e.g. food) 0.5 0.4 0.4
Not Sure 1.5 1.3 1.2
Infancy Eating Habits at Three Months
Breast Only 32.4 33.3 34.9
Breast and Formula 24.7 23.6 24.5
Formula Only 40.9 41.3 38.5
Other (e.g. food) 0.7 0.7 1.0
Not Sure 1.3 1.0 1.1
Infancy Eating Habits at Six Months
Breast Only 22.0 23.1 21.9
Breast and Formula 22.3 22.7 19.9
Formula Only 46.8 46.5 46.0
Other (e.g. food) 7.4 6.4 10.9
Not Sure 1.5 1.3 1.2 Note: - Indicates no data available
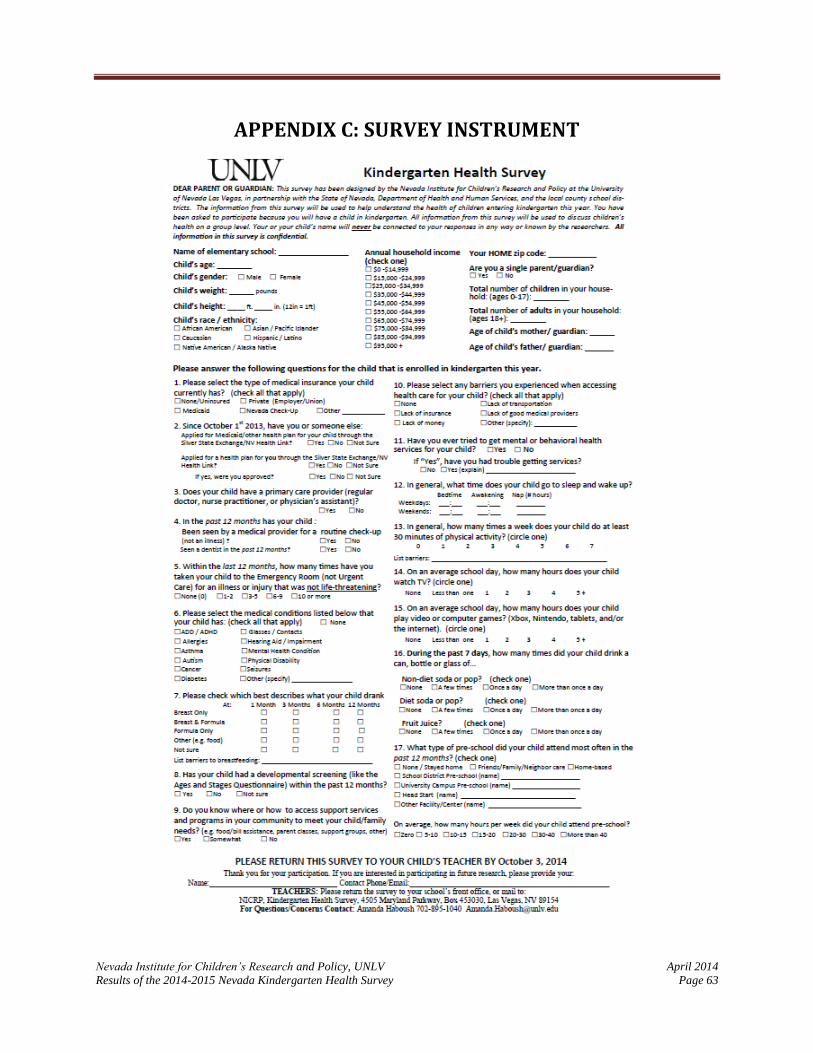
Nevada Institute for Children’s Research and Policy, UNLV April 2014
Results of the 2014-2015 Nevada Kindergarten Health Survey Page 63
APPENDIX C: SURVEY INSTRUMENT

APPENDIX C: SURVEY INSTRUMENT
Nevada Institute for Children’s Research and Policy, UNLV April 2014
Results of the 2013-2014 Nevada Kindergarten Health Survey Page 64
Nevada Institute for Children’s Research and Policy, UNLV April 2014
Results of the 2014-2015 Nevada Kindergarten Health Survey Page 65
APPENDIX D: REFERENCES American Academy of Pediatric Dentistry. (2014). Frequently asked question. Retrieved from
http://www.aapd.org/resources/frequently_asked_questions/#36
Annie E Casey Foundation. (2013). 2013 Data Book: State Trends of Child Well-Being. Retrieved from
http://datacenter.kidscount.org/files/2013kidscountdatabook.pdf
Baker, B. L., Neece, C. L., Fenning, R. M., Crnic, K. A., & Blacher, J. (2010). Mental Disorders in Five Year Old
Children With or Without Developmental Delay: Focus on ADHD. Journal of Clinical Child and
Adolescent Psychology : The Official Journal for the Society of Clinical Child and Adolescent Psychology,
American Psychological Association, Division 53, 39(4), 492–505. doi:10.1080/15374416.2010.486321
Basch, C.E. (2010). Healthier Students are Better Learners: A Missing Link in Efforts to Close the Achievement
Gap. Retrieved from http://www.equitycampaign.org/i/a/document/12557_EquityMattersVol6_Web
03082010. Pdf
Centers for Disease Control and Prevention. (2000). Clinical Growth Charts: Children 2 to 20 years. Retrieved from
http://www.cdc.gov/growthcharts/clinical_charts.htm
Centers for Disease Control and Prevention. (2011a). About BMI for Children and Teens. Retrieved from
http://www.cdc.gov/healthyweight/assessing/bmi/childrens_bmi/about_childrens_bmi.html#What is BMI
percentile
Centers for Disease Control and Prevention. (2011b). Body Mass for Age Tables. Retrieved from
http://www.cdc.gov/growthcharts/html_charts/bmiagerev.htm
Centers for Disease Control and Prevention. (2013). Youth Risk Behavior Surveillance System: 2013 National
Overview. Retrieved from http://www.cdc.gov/mmwr/pdf/ss/ss6304.pdf
Centers for Disease Control and Prevention. (2014a). Breastfeeding Report Card – United States, 2014. Retrieved
from http://www.cdc.gov/breastfeeding/pdf/2014breastfeedingreportcard.pdf
Centers for Disease Control and Prevention. (2014b). Developmental Monitory and Screening. Retrieved
from www.cdc.gov/ncbddd/childevelopment/screening.html
Child Trends. (2015). Unmet Dental Needs. Retrieved from http://www.childtrends.org/wpcontent/uploads/
2012/07/82_Unmet_Dental_Needs.pdf
Delva, J., Johnston L. D., O’Malley P. M. (2007). The epidemiology of overweight and related lifestyle behaviors:
racial/ ethnic and socioeconomic status differences among American youth. American Journal of
Preventative Medince, 33, S178-186.
DeRigne, L., Porterfield, S., & Metz, S. (2009). The influence of health insurance on parent’s reports of children’s
unmet mental health needs. Maternal & Child Health Journal, 13(2), 176-186, doi: 10.1007/s10995-008-
1346-0
Diedhiou, A., Probst, J. C., Hardin, J. W., Martin, A. B., & Xirasagar, S. (2010). Relationship between presence of
reported medical home and emergency department use among children with asthma. Medical Care
Research and Review, 67 (4), 450-475.
Eide, E. R., Showalter, M. H., & Goldhaber, D. D. (2010). The relation between children’s health and academic
achievement. Children and Youth Services Review, 32, 231-238.

APPENDIX D: REFERENCES
Nevada Institute for Children’s Research and Policy, UNLV April 2014
Results of the 2013-2014 Nevada Kindergarten Health Survey Page 66
Farrington, C.E., Roderick, M., Allensworth, E., Ngoaka, Jl, Keyes, T.S., Johnson, D.W., & Beechum, N.O. (2012)
Teaching adolescents to become learners??: The role of noncognitive factors in shaping school
performance. University of Chicago Consortium on Chicago School Research. Retrieved from
https://ccsr.uchicago.edu/ sites/default/files/publications/Noncognitive%20Report.pdf
Ganz, M. L., Wintfeld, N., Li, Q., Alas, V., Langer, J., & Hammer, M. (2014). The association of body mass index
with the risk of type 2 diabetes: a case–control study nested in an electronic health records system in the
United States. Diabetology & Metabolic Syndrome, 6, 50. doi:10.1186/1758-5996-6-50
Garcia, T. C., Bernstein, A. B., & Bush, M. A. (2010) Emergency department visitors and visits: Who used the
emergency room in 2007? NCHS Data Brief, No 38. Hyattsville, MD: National Center for Health Statistics.
Gubbels, J. S., Thijs, C., Stafleu, A., Van Buuren, S., & Kremers, S. P. J. (2011). Association of breast-feeding and
feeding on demand with child weight status up to 4 years. International Journal of Pediatric Obesity, 6,
515-522. doi: 10.3109/17477166.2010.514343
Haboush, A., Phebus, T., Hensley, S., Teramoto, M., & Tanata, D. (2013). The Impacts of Health Insurance
Coverage on Access to Healthcare in Children Entering Kindergarten. Maternal and Child Health Journal.
DOI: 10.1007/s10995-013-1420-9
Hammond, C., Linton, D., Smink, J., & Drew, S. (2007). Dropout Risk Factors and Exemplary Programs. Clemson,
SC: National Dropout Prevention Center, Communities In Schools, Inc.
Hoilette, L. K., Clark, S. J., Gebremariam, A., & Davis, M. M. (2009). Usual source of care and unmet need among
vulnerable children: 1998-2006. Pediatrics, 123. Retrieved from
http://pediatrics.aappublications.org/content/123/2/e214.full.pdf+html
IBM Corp. Released 2012. IBM SPSS Statistics for Windows, Version 21.0. Armonk, NY: IBM Corp.
Iruka, I., & Carver, P. (2011). Initial results from the 2005 NHES early childhood program participation survey
(NCES 2006-075). Washington, DC: US. Retrieved from http://files.eric.ed.gov/fulltext/ED492625.pdf
Kumanyika, S. (2008). Environmental influences on childhood obesity: Ethnic and cultural influences in context.
Physiological Behavior, 94, 61-70.
Lam, J. C., Mahone, E. M., Mason, T. A., & Scharf, S. M. (2011). The effects of napping on cognitive function in
preschoolers. Journal of Developmental and Behavioral Pediatrics, 32(2), 90-97.
doi:10.1097/DBP.0b013e318207ecc7
Liu, J., Probst, J., Martin, A. B., Wang, J., & Salinas, C. F. (2007). Disparities in dental insurance coverage and
dental care among US children: The national survey of children’s health. Pediatrics, 119, S12-S21.
McGroder, S. M. (1988). A Synthesis of Research on Child Care Utilization Patterns. Office of the Assistant
Secretary for Planning and Evaluation, U.S. Department of Health and Human Services. Retrieved from
http://aspe.hhs.gov/daltcp/reports/ccressyn.pdf
Nevada Report Card (2015) Demographic Profile 2013-2014. Retrieved from http://www.nevadareportcard.com.
Nevada State Demographer (2013) Nevada County, Age, Sex, Race, and Hispanic Origin, Estimates and Projections
2000-2032.Reno, NV. Retrieved from http://nvdemography.org/wp-content/uploads/2014/06/2013-
Nevada-Summary-Workbook-ASRHO-Estimates-and-Projections-REV-051614-B.pdf .
National Survey of Children's Health. NSCH 2011/12. Data query from the Child and Adolescent Health
Measurement Initiative, Data Resource Center for Child and Adolescent Health website. Retrieved from
www.childhealthdata.org.
APPENDIX D: REFERENCES
Nevada Institute for Children’s Research and Policy, UNLV April 2014
Results of the 2013-2014 Nevada Kindergarten Health Survey Page 67
Newport, F., & Mendes, E. (2009). About one in six U.S. adults are without health insurance. Retrieved from
http://www.gallup.com/poll/121820/one-six-adults-without-health-insurance.aspx.
Office of Public Health Informatics and Epidemiology. Division of Public and Behavioral Health. 2013 Nevada
Youth Risk Behavior Survey. Carson City, Nevada. February 2014.
Ogden, C.L., Carroll M.D., Kit, B.K., Flegal,K.M. (2014). Prevalence of childhood and adult obesity in the United
States, 2011-2012. Journal of the American Medical Association 311(8): 806-814
Radley, D. C., McCarthy, D., Lippa J. A., Hayes, S. L., & Schoen, C. (2014). Aiming Higher: Results from a
scorecard on state health system performance. New York: The Commonwealth Fund. Retrieved from
http://www.commonwealthfund.org/~/media/Files/Publications/Fund%20Report/2014/Apr/1743_Radley_a
iming_higher_2014_state_scorecard_FINAL.pdf
Sarchiapone , M. , Mandelli L., Carli, V. , Iosue, M., Wasserman, C. (2014) Hours of sleep in adolescents and its
association with anxiety, emotional concerns, and suicidal ideation. Sleep Medicine (15) 2 (248-254).
Sawhill I., & Karpilow Q. (2014). How much could we improve children’s life chances by intervening early and
often? Center on Children and Families at the Brookings Institution. Retrieved May 8, 2015, from
http://www.brookings.edu/~/media/research/files/papers/2014/07/improve_child_life_chances_intervention
s_sawhill/improve_child_life_chances_interventions_sawhill.pdf
Seirawan, H., Faust S., & Mulligan, R. (2012). The Impact of Oral Health on the Academic Performance of
Disadvantaged Children. American Journal of Public Health 102 (9), 1729-1734.
DOI: 10.2105/AJPH.2011.300478
Shi, L., Samuels, M. E., Pease, M., Bailey, W. P., & Corley, E. H. (1999). Patient characteristics associated with
hospitalizations for ambulatory care sensitive conditions in South Carolina. Southern Medical Journal
92(10), 989-998.
Spittler, K. L. (2007). Napping and Insufficient Sleep Lead to Poor Problem-Solving Skills in Children. Neurology
Reviews, 15(10), 13.
Starfield, L., Lieyu, S. (2004). The Medical Home, Access to Care and Insurance: A Review of Evidence.
Pediatrics, 11
Starfield, B., Shi, L. & Macinko, J. (2005). Contribution of primary care to health systems and health. The Milbank
Quarterly, 83 (3), 457-502.
Staton, S. L., Smith, S. S., Pattinson, C. L., & Thorpe, K. J. (2015). Mandatory naptimes in child care and children's
nighttime sleep. Journal of Developmental and Behavioral Pediatrics, 36(4), 235-242.
doi:10.1097/DBP.0000000000000157
Taheri, S. (2006). The link between short sleep duration and obesity: we should recommend more sleep to prevent
obesity. Archives of Disease in Childhood,91(11), 881–884. doi:10.1136/adc.2005.093013
Taras, H., & Potts-Datema, W. (2005). Chronic health conditions and student performance at school. Journal of
School Health, 75 (7) 255-266.
The Kaiser Family Foundation. (2012). Uninsured Rates of the Non-Elderly by Race/Ethnicity. Retrieved from
http://kff.org/uninsured/state-indicator/rate-by-raceethnicity/
The Kaiser Family Foundation (2013). Health Coverage for the Hispanic Population Today & Under the Affordable
Care Act. Retrieved from https://kaiserfamilyfoundation.files.wordpress.com/2013/04/84321.pdf

APPENDIX D: REFERENCES
Nevada Institute for Children’s Research and Policy, UNLV April 2014
Results of the 2013-2014 Nevada Kindergarten Health Survey Page 68
The Kaiser Family Foundation. (2014). Employer Health Benefits Survey 2014 Annual Report. Retrieved from
http://files.kff.org/attachment/2014-employer-health-benefits-survey-full-report
The Kaiser Family Foundation State Health Facts. Data Source: Census Bureau’s March 2010 and 2011 Current
Population Survey (CPS: Annual Social and Economic Supplements). Health Insurance Coverage of
Children 0-18, states (2010-2011), U.S. (2011). Retrieved from http://kff.org/other/state-indicator/children-
0-18/
United States Census Bureau. (2013). American Community Survey: Percent of Children Without Health Insurance
Coverage. Retrieved from
http://factfinder.census.gov/faces/tableservices/jsf/pages/productview.xhtml?pid=ACS_12_1YR_GCT2702
.US01PR&prodType=table
United States Census Bureau. (2012b). State and County QuickFacts. Data derived from Population Estimates,
American Community Survey, Census of Population and Housing, State and County Housing Unit
Estimates, County Business Patterns, Nonemployer Statistics, Economic Census, Survey of Business
Owners, Building Permits. Retrieved from http://quickfacts.census.gov/qfd/states/32000.html
US Department of Health and Human Services, National Heart, Lung and Blood Institute, (2012), Why is sleep
important?. Retrieved from http://www.nhlbi.nih.gov/health/health-topics/topics/sdd/why
United States Department of Health and Human Services' Office on Women's Health. (2011). Your guide to
breastfeeding. Retrieved from http://www.womenshealth.gov/publications/our-
publications/breastfeeding-guide/BreastfeedingGuide-General-English.pdf
United States Department of Health and Human Services' Office on Women's Health. (2014). Why Breastfeeding is
Important Retrieved from http://www.womenshealth.gov/breastfeeding/breastfeeding-benefits.htm
Wojcicki, J. M., & Heyman, M. B. (2012). Reducing Childhood Obesity by Eliminating 100% Fruit Juice. American
Journal of Public Health, 102(9), 1630–1633. doi:10.2105/AJPH.2012.300719
Yeung, R., Gunton, B., Kalbacher, D., Seltzer, J., & Wesolowski, H. (in press). Can health insurance reduce school
absenteeism? Education and Urban Society.