health service delivery in the western cape: a measurement
TRANSCRIPT

Health Service Delivery in the Western Cape: A
Measurement of Perceptions
by
Frederick John Whitford
Thesis presented in partial fulfilment of the requirements for the degree
Masters in Public Administration in the faculty of Management Science
at Stellenbosch University
Supervisor: Prof Erwin Schwella
March 2016

i
Declaration
By submitting this thesis electronically, I declare that the entirety of the work
contained therein is my own, original work, that I am the sole author thereof (safe for
the extent explicitly otherwise stated), that reproduction and publication thereof by
Stellenbosch University will not infringe any third-party rights and that I have not
previously in its entirety or in part submitted it for obtaining any qualification.
March 2016
Copyright © 2016 Stellenbosch University
All rights reserved
Stellenbosch University https://scholar.sun.ac.za

ii
ABSTRACT
Satisfaction surveys are increasingly being suggested as a means to understand the
service expectations and perceptions of patients in hospitals. The purpose of this study
is to measure patient expectations and perceptions in public hospitals and establish if a
service gap exists between what is expected and what is experienced. Literature
suggests that service dimensions exist that can offer an explanation for the service
gap. The survey conducted at district hospitals in the Western Cape, South Africa,
provides useful information on the determinants of patient satisfaction across the five
dimensions of service quality (SERVQUAL).The findings suggest that a service
performance gap exists for subjective questions regarding (for example) treatment by
nursing staff, as well as for relatively objective questions regarding (for example)
hospital cleanliness or physical conditions. The results of the research led to the
conclusion that service quality is measurable when a well-established tool is used and
questions posed measure well-defined areas of service quality. The results can serve
as the basis for service improvement plans.
Stellenbosch University https://scholar.sun.ac.za

iii
OPSOMMING
Tevredenheidsopnames word toenemend aanbeveel as ‘n manier om
diensverskaffingsverwagtinge en perspesie van pasiente in hospitale te verstaan. Die
doel van die studie is om die pasiënte in openbare hospitale se verwagtings en
perspesies te meet en om te bepaal of ‘n diensverskaffingsgaping tussen wat verwag
word en wat ervaar word bestaan. Literatuur dui aan dat diensverskaffingsdimensies
bestaan wat die dienswagtingsgaping kan verduidelik. Die opnames wat in
distrikshospitale in die Wes-Kaap, Suid Afrika, gedoen is verskaf bruikbare inligting
oor die determinante van pasiëntetevredenheid dwarsoor die vyf dimensies van
diensverskaffingsgehalte (SERVQUAL). Die bevindinge dat die
diensverskaffingsprestasiegaping bestaan vir subjektiewe vrae aangaande, bv.
behandeling deur verpleegpersoneel, sowel as relatiewe objektiewe aangaande bv.
hospitaalsindelikheid of fisiese omgewing. Die resultaat van die navorsing lei tot die
gevolgtrekking dat die diensverskaffingsgehalte meetbaar is wanneer ‘n goed
gevestige instrument gebruik word en die vrae goed gedefinieerde areas van
diensverskaffingsgehalte meet. Die resultate kan gebruik word as ‘n basis vir
diensverskaffingsplanne.
Stellenbosch University https://scholar.sun.ac.za

iv
ACKNOWLEDGEMENTS
I would like to thank the following people:
Professor Erwin Schwella, my supervisor from the School of Public Leadership at
Stellenbosch University, who guided my efforts and steered me into new
directions.
Ms Adele Burger, my research lecturer at the School of Public Leadership, who
offered insight into research practices.
The academic staff at the School of Public Leadership, who presented their
courses with commitment and vigour and provided the background to further
study.
Professor Daan Nel from the Centre for Statistical Consultation at Stellenbosch
University, who performed the statistical analysis for the study.
My wife, Mary-Ann, who offered love and support and our children who remain the
reason we take on challenges.
My immediate supervisor at the Auditor-General of South Africa, Mr Corrie
Pretorius, who allowed me the time and space for this endeavour and who offered
valuable background information on public management issues, and Ms Ruxana Jina,
my colleague, who motivated and guided me when I needed it, and Mr Raj Mahabeer
for his encouragement.
Stellenbosch University https://scholar.sun.ac.za

v
TABLE OF CONTENTS
DECLARATION ..................................................................................................................................... I
ABSTRACT .......................................................................................................................................... II
OPSOMMING .................................................................................................................................... III
ACKNOWLEDGEMENTS ..................................................................................................................... IV
TABLE OF CONTENTS .......................................................................................................................... V
LIST OF ABBREVIATIONS/ACRONYMS ..............................................................................................VII
LEGISLATION ...................................................................................................................................VIII
LIST OF FIGURES ................................................................................................................................ IX
LIST OF TABLES ................................................................................................................................... X
LIST OF ADDENDUMS ........................................................................................................................ XI
CHAPTER 1: INTRODUCTION .............................................................................................................. 1
1.1. INTRODUCTION ....................................................................................................................... 1 1.2. BACKGROUND ......................................................................................................................... 1 1.3 MOTIVATION FOR THE RESEARCH ........................................................................................... 2 1.4. RESEARCH AIM AND OBJECTIVES ............................................................................................. 3 1.5. STRUCTURE OF THE THESIS ...................................................................................................... 4
CHAPTER 2: SERVICE QUALITY IN HEALTH SERVICES – A LITERATURE STUDY ..................................... 5
2.1. INTRODUCTION ....................................................................................................................... 5 2.2. THE NATURE OF HEALTH AND HEALTH SERVICES..................................................................... 5 2.3. SERVICE QUALITY IN HEALTH SERVICES ................................................................................... 6 2.4. THE MEASUREMENT OF SERVICE QUALITY .............................................................................. 6 2.5. PATIENT SATISFACTION ......................................................................................................... 14 2.6 THE MEASUREMENT OF PATIENT SATISFACTION .................................................................. 14 2.7 OTHER MEASURES OF SERVICE QUALITY ............................................................................... 15 2.7.1 The Gronroos model .............................................................................................................. 15 2.7.2 The Naumann and Giel model ............................................................................................... 16 2.8 CONCLUSION ......................................................................................................................... 17
CHAPTER 3: HEALTH SERVICES IN SOUTH AFRICA: A WESTERN CAPE PERSPECTIVE .......................... 18
3.1 INTRODUCTION ..................................................................................................................... 18 3.2 THE AFRICAN CONTEXT .......................................................................................................... 18 3.3 HEALTH GOVERNANCE AND LEADERHIP ................................................................................ 18 3.4 HEALTH INSTITUTIONS ........................................................................................................... 20 3.5 HEALTH STRATEGY ................................................................................................................. 21 3.6 HEALTH STANDARDS .............................................................................................................. 25 3.7 NATIONAL HEALTH SERVICE REALITY ..................................................................................... 27 3.7.1 Health facilities in SA ............................................................................................................. 28 3.7.2 Performance information in SA ............................................................................................. 29 3.7.3 The health workforce in SA .................................................................................................... 31 3.7.4 Healthcare cost in SA ............................................................................................................. 33 3.7.5 Access to healthcare in SA ..................................................................................................... 36 3.8 HEALTH SERVICES IN THE WESTERN CAPE ............................................................................. 39 3.8.1 Introduction ........................................................................................................................... 39 3.8.2 Health governance in the WC ................................................................................................ 39 3.8.3 Health programme in the WC ................................................................................................ 39 3.8.4 Health strategy in the WC...................................................................................................... 40
Stellenbosch University https://scholar.sun.ac.za

vi
3.8.5 Health standards in the WC ................................................................................................... 42 3.8.6 Health facilities in the WC...................................................................................................... 42 3.8.7 Performance information in the WC ...................................................................................... 43 3.8.8 The health workforce in the WC ............................................................................................ 43 3.8.9 Health funding in the WC....................................................................................................... 44 3.8.10 Access to healthcare in WC .................................................................................................... 45 3.9 CONCLUSION ......................................................................................................................... 46
CHAPTER 4 – MEASURING HEALTH SERVICES IN THE WESTERN CAPE: A PERCEPTION-BASED ANALYSIS ......................................................................................................................................... 47
4.1 INTRODUCTION ..................................................................................................................... 47 4.2 STUDY DESIGN ....................................................................................................................... 47 4.3 STUDY SITES ........................................................................................................................... 47 4.4 STUDY POPULATION .............................................................................................................. 47 4.5 SAMPLE AND PROCEDURE ..................................................................................................... 48 4.6 MEASUREMENT ..................................................................................................................... 51 4.7 DATA COLLECTION METHOD ................................................................................................. 51 4.8 STATISICAL ANALYSIS ............................................................................................................. 52 4.8.1 Exploratory data analysis ...................................................................................................... 52 4.8.2 Factor analysis ....................................................................................................................... 53 4.8.3 Boxplots ................................................................................................................................. 53 4.8 ETHICAL CONSIDERATIONS .................................................................................................... 54 4.9 THE LIMITATIONS OF THE STUDY ........................................................................................... 55 4.10 CONCLUSION ......................................................................................................................... 56
CHAPTER 5 – FINDINGS, SUMMARY, CONCLUSIONS AND RECOMMENDATIONS .............................. 57
5.1 INTRODUCTION ..................................................................................................................... 57 5.2 FINDINGS ............................................................................................................................... 57 5.2.1 Exploratory analysis .............................................................................................................. 57 5.2.2 Survey response .................................................................................................................... 58 5.2.3 Application of the SERVQUAL gap model ............................................................................. 59 5.2.4 Overall gap scores by hospital .............................................................................................. 61 5.2.5 Tangibility score by hospital ................................................................................................. 62 5.2.6 Reliability score by hospital .................................................................................................. 62 5.2.7 Responsiveness score by hospital ......................................................................................... 63 5.2.8 Assurance score by hospital .................................................................................................. 63 5.2.9 Empathy score by hospital .................................................................................................... 64 5.2.10 Reliability .............................................................................................................................. 64 5.2.11 Validity .................................................................................................................................. 65 5.2.12 Boxplots ................................................................................................................................. 68 5.3 SUMMARY OF FINDINGS ....................................................................................................... 71 5.4 CONCLUSIONS ....................................................................................................................... 72 5.5 FUTURE RESEARCH ................................................................................................................ 73 5.6 CONCLUSION ......................................................................................................................... 73
REFERENCES ..................................................................................................................................... 74
ADDENDUMS ................................................................................................................................... 82
ADDENDUM 1: STRUCTURED QUESTIONNAIRE .................................................................................. 82 ADDENDUM 2: REDRAFTED QUESTIONNAIRE (ENGLISH) ................................................................... 85 ADDENDUM 3: REDRAFTED QUESTIONNAIRE (AFRIKAANS) ............................................................... 90 ADDENDUM 4: CONSENT TO PARTICIPATE IN RESEARCH FORM ........................................................ 96 ADDENDUM 5: STELLENBOSCH UNIVERISTY HUMANITIES ETHICS APPROVAL (1) ............................ 100 ADDENDUM 6: STELLENBOSCH UNIVERISTY HUMANITIES ETHICS APPROVAL (2) ............................ 102 ADDENDUM 7: WC HEALTH APPROVAL TO ACCESS HOSPITALS (1) .................................................. 103 ADDENDUM 8: WC HEALTH APPROVAL TO ACCESS HOSPITALS (2) .................................................. 104 ADDENDUM 9: CLASSIFICATION OF FACILITIES ................................................................................. 105
Stellenbosch University https://scholar.sun.ac.za

vii
LIST OF ABBREVIATIONS/ACRONYMS
AGSA Auditor-General of South Africa
AIDS Acquired immune deficiency syndrome
CDC Community day centre
CEO Chief executive officer
CHC Community health centre
CSS Client satisfaction survey
DHS District Health Services
DPSA Department of Public Service & Administration
GDP Gross Domestic Product
HIS Health Information Systems
HPCSA Health Professions Council of South Africa
NDoH National Department of Health
NCS National Core Standards
NDP National Development Plan
NHI National Health Insurance
NHS National Health Systems
OHSC Office of Health Standards Compliance
PDE Patient day equivalent
PFMA Public Finance Management Act
PHC Primary healthcare
SAIRR South African Institute of Race Relations
SCM Supply Chain Management
TB Tuberculosis
WC Western Cape
WCDoH Western Cape Department of Health
WCG Western Cape Government
WHO World Health Organisation
Stellenbosch University https://scholar.sun.ac.za

viii
LEGISLATION
1 Constitution of the Republic of South Africa, 1996 (Act 108 of 1996)
2 Health Professions Act, 1974 (Act 56 of 1974)
3 Medical Schemes Act, 2001 (Act 55 of 2001)
4 National Health Act, 2003 (Act 61 of 2003)
5 Nursing Act, 1978 (Act 50 of 1978)
6 Public Finance Management Act, 1999 (Act 1 of 1999)
Stellenbosch University https://scholar.sun.ac.za

ix
LIST OF FIGURES
Figure Title Page
Figure 3.1 Health system improvement strategy, 2009 23
Figure 3.2 Public clinic utilisation, 1993-5 24
Figure 3.3 Number of general practitioner posts, 2006-8 25
Figure 3.4 A value-adding model for SA healthcare system 30
Figure 3.5 Annual nursing enrolment, 1999-2008 32
Figure 3.6 Age distribution of nurses registered with SANC, 2009 33
Figure 3.7 Proportional patient problems at public health facilities, 2012 36
Figure 3.8 Western Cape: Compliance score on vital measures for the six
ministerial priority areas, 2011
42
Figure 5.1 Number of survey responses by hospital 58
Figure 5.2 Overall GAP score by hospital 62
Figure 5.3 Tangibility score by hospital 62
Figure 5.4 Reliability score by hospital 63
Figure 5.5 Responsiveness score by hospital 63
Figure 5.6 Assurance score by hospital 64
Figure 5.7 Empathy score by hospital 65
Figure 5.8 Tangibility boxplot by hospital 69
Figure 5.9 Reliability boxplot by hospital 69
Figure 5.10 Responsiveness boxplot by hospital 70
Figure 5.11 Assurance boxplot by hospital 70
Figure 5.12 Empathy boxplot by hospital 71
Stellenbosch University https://scholar.sun.ac.za

x
LIST OF TABLES
Table Title Page
Table 2.1 Groonroos’ dimensions of perceived service quality 15
Table 3.1 NSC dimensions 26
Table 3.2 Health NSDA targets till 2014 27
Table 3.3 Number of facilities by classification 2011 28
Table 3.4 Total health expenditure as a proportion of GDP 1995-2011 34
Table 3.5 Public and private health expenditure as a proportion of total
health expenditure 1995-2011
34
Table 3.6 Medical aid coverage for the population 2014 37
Table 3.7 Changes in the national population between 2004 & 2014 37
Table 3.8 WC patient satisfaction rates 2013/14 43
Table 3.9 Extract of number of public health personnel by category 43
Table 3.10 WC professional nurse positions 2011-14 44
Table 3.11 WC personnel expenditure analysis 2010-13 44
Table 3.12 WC actual expenditure by programme 2010-13 45
Table 3.13 WC actual expenditure by economic classification 2010-13 45
Table 4.1 Western Cape district hospitals 2015 49
Table 4.2 Wards at Hermanus Hospital 2015 50
Table 4.3 Wards at Stellenbosch Hospital 2015 50
Table 4.4 Wards at Victoria Hospital 2015 50
Table 4.5 Population estimates of the Western Cape 2014 50
Table 5.1 Statistical results for Hermanus Hospital 57
Table 5.2 Statistical results for Stellenbosch Hospital 57
Table 5.3 Statistical results for Victoria Hospital 57
Table 5.4 Socio-demographic characteristics of respondents 58
Table 5.5 GAP 5 scores 59
Table 5.6 Reliability analysis 65
Table 5.7 Tangibles factor analysis 65
Table 5.8 Tangibles factor loadings 65
Table 5.9 Tangibles rotated factor loadings 66
Table 5.10 Reliability factor analysis 66
Table 5.11 Reliability factor loadings 66
Table 5.12 Reliability rotated factor loadings 66
Table 5.13 Responsiveness factor analysis 66
Table 5.14 Responsiveness factor loadings 67
Table 5.15 Responsiveness rotated factor loadings 67
Table 5.16 Assurance factor analysis 67
Table 5.17 Assurance factor loadings 67
Table 5.18 Assurance rotated factor loadings 67
Table 5.19 Empathy factor analysis 68
Table 5.20 Empathy factor loadings 68
Table 5.21 Empathy rotated factor loadings 68
Stellenbosch University https://scholar.sun.ac.za

xi
LIST OF ADDENDUMS
Addendum Title Page
1 Structured questionnaire 83
2 Redrafted questionnaire (English) 86
3 Redrafted questionnaire (Afrikaans) 91
4 Consent to participate in research form 97
5 Stellenbosch University Humanities ethics approval (1) 101
6 Stellenbosch University Humanities ethics approval (2) 103
7 Western Cape Health approval to access hospitals (1) 104
8 Western Cape Health approval to access hospitals (2) 105
9 Classification of facilities 106
Stellenbosch University https://scholar.sun.ac.za

1
CHAPTER 1: INTRODUCTION
1.1. INTRODUCTION
This thesis explores the theme of patient satisfaction in the South African context.
Patient satisfaction is the level of satisfaction that a patient experiences after using a
health facility. It is important as a measure of quality of care, because it reflects the
difference between the expected service and the perception or actual experience of the
service. Expectations of the service are influenced by past experiences, external
influences, personal needs and word of mouth. Actual experiences or perceptions of
the service are influenced by the various dimensions of service quality: tangibles,
reliability, responsiveness, assurance and empathy.
Although patients may experience poor service delivery in South Africa, they are
often unaware of the mechanisms available to voice their concerns. The assessment of
client satisfaction is a mechanism used by management and it forms part of the
management function of a health facility.
The overwhelming majority of people in this country rely on public sector health
services. The health service providers in the public sector face an increasing demand
for their services. Since 1994, government has introduced policy and legislation
periodically to regulate this environment with the aim of improving health outcomes
in the face of increasing service demands.
1.2. BACKGROUND
Primary healthcare is important because it is the first line of defence against the
quadruple burden of disease causing high rates of mortality and morbidity
(Department of Health, 2013:3). Primary healthcare includes the most accessible of
facilities offering the most essential services to communities. This includes clinics;
community health centres and district hospitals, which are the gateway to more
specialised levels of care. Together, they form the core of the South African public
health system and remain a key focus of the national health department with the re-
engineering of the primary healthcare programme (Department of Health, 2013:3).
Within a health system, regular patient feedback is a basic requirement of any quality
assurance system. The Gauteng health department partnered with Health Systems
Trust to develop a client satisfaction survey based on an earlier tool from 2000. The
survey was conducted over a period of six months at hospitals in the province in
2007/8. The results from the respondents showed that most patients are not satisfied
with the quality of care they received.
In this study, the phenomenon of the patient’s expectations and perceptions of the
following were determined and analysed:
The physical appearance, the equipment, the personnel and in-house
communications in the hospital (tangibles)
The ability of the hospital to provide clinical and support services with certainty
and to an expected standard to patients (reliability)
Stellenbosch University https://scholar.sun.ac.za

2
The willingness of the staff to provide services and the promptness with which
services were delivered to patients (responsiveness)
The extent to which the knowledge and courtesy of staff convey trust and
confidence in patients (assurance)
The extent to which the staff provide individual and attention to patients
(empathy)
1.3 MOTIVATION FOR THE RESEARCH
The motivation to conduct the research came from a project in which the researcher
was involved at work. While gathering background information for an audit of health
projects in the Northern Cape, the researcher found the Minister of Health’s response
to the National Council of Provinces (NCOP) Social Services Committee in March
2012 of interest. The Minister’s response on findings of the Auditor-General on
vacancies in the health sector pointed to a problem that was much wider than staff
vacancies.
The Minister responded to departmental vacancy rates; however, he linked the
vacancy rates to overworked staff, patient expectations, the cost of the Occupation
Specific Dispensation (OSD) on the department and agency costs. It was evident that
the problem outlined could have many causes.
To address the vacancy rate problem and its related causes the Minister had developed
a strategy that included improving leadership, governance, accountability, creating
health information to monitor results, reengineering the workforce, and measures to
provide patients with professional quality of care. The range of activities to address
the problem was quite comprehensive.
In his response to the National Council of Provinces (NCOP) Social Services
Committee, the Minister explained that problems could not be addressed in isolation,
but needed a holistic approach. The problems in the provisioning of public healthcare
are to a certain extent historical and structural in nature.
A review of research articles showed that a patient-centred approach could shed some
light on how to deal with patient expectations. In a patient-centred approach, the
possible causes of patient dissatisfaction are studied. A similar approach is followed
in marketing management studies. In marketing management, the concept “service
quality” is used to determine the level of customer satisfaction. Service quality defines
the dimensions of service and it is the subject of further academic study.
Current research
A search of the SAePublications database using the keywords “patient satisfaction”
AND “survey” AND “public hospital” produced 389 results. From these results, 11
articles were directly related to the research topic. One of the articles highlighted the
importance of quality improvement projects to improve the quality of care at facilities
(van Deventer & Sondzaba, 2012).
Stellenbosch University https://scholar.sun.ac.za

3
Another search of the SAePublications database using different keywords “patient
satisfaction” AND “information systems” yielded 15 results. Of these results, three
articles had a direct relationship to the research topic.
A search of the EBSCOhost database using the keywords “patient perceptions” AND
“healthcare quality” AND “health systems” revealed 23 results. Only two of the 23
results were related to the objectives of this study. One study showed that as little as
six questionnaire items can deliver reliable statistics on patient experiences (Larsson,
Larsson, Chantereau & Stael van Holstein, 2005), the other study showed when a
hospital has a strong community orientation, it is more likely to provide high quality
care (Kang & Hasnian-Wynia, 2013).
Lack of current research into the theme
Literature suggests that the way in which patient satisfaction is perceived in different
counties, could be due to way patient satisfaction is defined and measured (Larrson,
Larrson, Chantereau & Stael van Holstein, 2005). A number of studies have been
conducted on the patient experience within the healthcare system (Bleich, Ozaltin &
Murray, 2009), and underlying factors which influence the patient experience (Bleich,
Ozaltin & Murray, 2009).
Contribution to the body of knowledge
The study should contribute to the body of knowledge on the factors that influence
patient satisfaction in hospitals.
This study was designed to answer the research questions as presented below.
1.4. RESEARCH AIM AND OBJECTIVES
The aim of the research was to measure the satisfaction levels of patients in Western
Cape district hospitals and to produce evidence-based results that hospital
management could integrate into their service planning.
Research questions
This study will attempt to answer the following core research questions:
a. Do patients expect service quality at public district hospitals?
b. Do patients perceive service quality at the public district hospitals they visit?
c. Which factors could give rise to the gap between patients’ expectations and
perceptions of service quality at district hospitals?
Research objective
The primary research objective of the study was to describe the perceptions and
experiences of patients admitted to district hospitals in the Western Cape in August
2015 and to recommend measures to improve service quality.
To achieve the research objective, literature dealing with the following was obtained:
Patient satisfaction
Service quality
Provision of quality health services at national and provincial level
Survey measuring instruments
Stellenbosch University https://scholar.sun.ac.za

4
Health policy, legislation, strategies and challenges
1.5. STRUCTURE OF THE THESIS
This thesis is structured as follows.
Chapter 1: Introduction
The first chapter provides a background to the study, the motivation for the study and
the research aim and objectives.
Chapter 2: Service Quality in Health Services: A Literature Study
The second chapter provides a literature review on the provisioning of health services
within the local context using books, journals and the SAePublications and
EBSCOhost databases. It includes definitions of the key concepts, models, theories,
approaches and systems. It also provides the theoretical background on different ways
to measure service quality.
Chapter 3: Health Services in South Africa: A Western Cape Perspective
The third chapter is a study of policy, legislation, strategy and health systems within
the public health sector. The institutionalisation of health services and the current
realities facing health services in the country have been dealt with. A perspective on
the delivery of public health services in the Western Cape was offered to highlight
what can be achieved with limited resources.
Chapter 4: Measuring Health Services in the Western Cape: A Perception-based
Analysis
The fourth chapter is a discussion of the research methodology used to conduct the
study. It deals with the manner in which data was collected, analysed and reported. It
explains the basis for the sample selection.
Chapter 5: Findings, Summary, Conclusions and Recommendations
The final chapter consists of the presentation of the research findings, which was
analysed and summarised. Conclusions were drawn on whether the study met the
research objectives, and recommendations were made on how perceptions could be
improved. The study limitations were discussed.
Stellenbosch University https://scholar.sun.ac.za

5
CHAPTER 2: SERVICE QUALITY IN HEALTH SERVICES – A
LITERATURE STUDY
2.1. INTRODUCTION
Recognition of quality shortcomings in healthcare in developing countries has
motivated new efforts to monitor and measure quality of health services. Among, the
different tools used to measure service quality, surveys are intended to measure
patient expectations and perceptions.
In the course of the research, literature on what constitutes health services, how it is
delivered and what the challenges are in the country were obtained and reviewed. The
research theme was explored using relevant books, journal articles and independent
studies.
In order to be able to gather relevant research data, literature on different research
instruments used to measure customer satisfaction was obtained and reviewed. The
review examined the history, the nature and the advantages and disadvantages of
instruments.
The seminal text, Delivering quality service: balancing customer perceptions and
expectations by Zeithaml, Parasuraman and Berry (1990) was used extensively in the
literature review and provides a theoretical background to the study.
2.2. THE NATURE OF HEALTH AND HEALTH SERVICES
In terms of section 27(2) of the Constitution (Republic of South Africa, 1996), the
State must take reasonable legislative and other measures to achieve the progressive
realisation of the right of people of SA to have access to health services, which
includes reproductive health (Republic of South Africa, 2003:2).
A health service is a form of service. People express the need for a unique service
when they are sick or injured – in fear of what is going to happen to them (Berry &
Seltman, 2008:11). The health service a consumer receives should be tailored to meet
the needs of the consumer and the provider should take the age, state of health,
gender, financial means and mental state of the consumer into account when
providing the service (Berry & Seltman, 2008:11). Although a health service is
unique, in many ways it is not dissimilar to many other services. A health service is
intangible, elapses over time, requires highly skilled labour and is delivered with the
consumer present (Berry & Seltman, 2008:11). The quality of a health service can
vary between providers, and socio-economic status of a consumer can be a barrier
restricting access to the health service (Berry & Seltman, 2008:11).
According to Parasuraman, Zeithaml and Berry (1985:1-2) a service has unique
qualities, it is unable to be touched (intangible), it is varied in content (heterogeneous)
and it is difficult to separate into distinct parts (inseparable). The dispensing service of
a pharmacist can illustrate these qualities. A consumer presenting a script to
pharmacist to be filled would not be able to: identify each separate action the
pharmacist takes; compare the pharmacist’s present level of activity to a past level of
activity; and neither touch the human input of the pharmacist to the process. The
consumer would rely on intangible information, largely from the senses, to express an
Stellenbosch University https://scholar.sun.ac.za

6
opinion on the dispensing service of the pharmacist. The point that Parasuraman et al
(1985) make is that services are not a predetermined set of actions that occur exactly
the same way every time and that perceptions are created while the service is being
performed.
This emphasis of this study is on how healthcare is perceived. According to the
Oxford Dictionary, perception is an intuition people use to gauge either the truth of
an expression or the nature of a person or thing.
2.3. SERVICE QUALITY IN HEALTH SERVICES
It has been argued that service quality exists in the provision of health services
because a service is being offered. Gronroos (1990:97) stated that service quality is
the result of a consumer’s perception of the service they received. According to
Parasuraman et al (1994), service quality is a consumer’s assessment of what is
expected compared to what is actually received. Service quality is also a standard a
service that should be offered (Cadotte, Woodruff and Jenkins, 1987:307).
Parasuraman et al (1985:42) found that the expectation of a service is fundamental to
the concept of service quality. An expectation is the consumers’ belief or prediction of
what the result of a service transaction will be (Oliver, 1980:462), an expectation
could be what a service provider offers to a consumer (Parasuraman et al, 1985:42),
an expectation is influenced by individual consumer characteristics (Oliver,
1980:464), word of mouth and past service experiences (O’Connor, Trinh &
Shewchuk, 2000:8).
The extent of the need for health services implies that a dependency on the service
could exist. This state of dependency could mean that service quality is needed to
maintain the level of service offered. The majority of South Africans are dependent on
the public health sector for their healthcare needs (Viljoen, Heunis, van Rensburg, van
Rensburg, Engelbrecht, Fourie, Steyn & Matebesi, 2000).
According to Jost (1992:71), the traditional European viewpoint of what constitutes
quality healthcare focused on the provider, namely the scientific/medical knowledge
and the skill of the medical practitioner. The modern European viewpoint includes the
effectiveness, adequacy, acceptability, accessibility, and equity of the health system.
In certain American literature the viewpoint is narrower and focuses primarily on the
technical competence of the medical practitioner. It has been suggested that South
Africa follows the modern European viewpoint.
2.4. THE MEASUREMENT OF SERVICE QUALITY
Literature dealing with the measurement of the concept service quality was reviewed.
A number of studies point to the preference for using a standardised measuring
instrument to measure the concept (Gronroos, 1990) and Parasuraman et al, 1985).
The assessment of the quality of health services should acknowledge the complexity,
heterogeneity and ambiguity of these services (Eiriz & Figueiredo, 2005:405).
However, the assessment should take the patients point of view into account, and not
only the provider’s point of view (Eiriz & Figueiredo, 2005:405). A number of
healthcare organisations use the principles of quality management used in industry in
Stellenbosch University https://scholar.sun.ac.za

7
their quality assessments (Eiriz & Figueiredo, 2005:405). It is debatable whether the
use of these principles has increased the efficiency and effectiveness of the
organisations (Eiriz & Figueiredo, 2005:405). The question of how to measure the
quality of healthcare offered by healthcare providers has been a focal point of health
service managers for a considerable period of time (Tateke, Woldie & Ololo, 2012:
11).
Rohini and Mahadevappa (2006) used the service quality model of Parasuraman et al
(1985) to measure the delivery of service quality at Bangalore hospitals in India using
the five dimensions of quality.
The SERVQUAL instrument developed by Parasuraman et al (1985) was initially
used to measure service quality and bring their service quality model into reality. The
instrument is in the form of a research questionnaire. Buttle (1994) found the
SERVQUAL instrument to be suitable for research for the following reasons:
The instrument is widely used for measuring service quality.
The instrument produces results which have a scientific basis.
The instrument has been shown to be reliable in a number of different service
settings.
The instrument’s scales have a limited number of items, therefore it is easy to use.
The instrument has a standardised procedure for analysis that makes the
presentation of results less onerous.
The SERVQUAL instrument was the culmination of exploratory research by
Zeithaml, Parasuraman and Berry (1990:23). This process of exploratory research was
performed in great detail and validates the use of the instrument.
Firstly, Zeithaml et al (1990:23) defined service quality and developed 10 evaluative
dimensions of service quality. After a quantitative study based on data gathered on
five different service sectors, they developed their measuring instrument. The
quantitative study is important – it adds statistical acceptability to the SERVQUAL
instrument.
Secondly, Zeithaml et al (1990) recast the 97 constructs they had identified into a pair
of statements. One statement measures the customer’s expectation of firms in general
within a service category. The second statement measures the customer’s perceptions
of the service quality of a specific firm. By using the pairing process the authors were
able to identify non-discernible items and reduce the number of items to ten. The raw
questionnaire data was converted into perception minus expectation scores ranging
from +6 to -6.
Thirdly, Zeithaml et al (1990) further refined the conceptual dimensions of service
quality. They confirmed the reliability and validity of their scale by using survey
results. Before the survey, they used the analysis of difference scores to eliminate
nearly two-thirds of the dimensional items and several overlapping dimensions.
Fourthly, after performing statistical analysis, Zeithaml et al (1990) found that the two
broader dimensions of assurance and empathy have a strong correlation with other
dimensions. From the 10 original dimensions, seven dimensions were consolidated
into two, and the first three original dimensions (tangibles, reliability and
Stellenbosch University https://scholar.sun.ac.za

8
responsiveness) remained intact. The net result was the five dimensions described
below (Zeithaml et al, 1990:25-26):
Tangibles – the physical appearance of facilities, equipment, personnel and
communications materials of the service provider, used by the consumer to
evaluate services.
Reliability – the ability of the service provider to perform the promised service in
a dependable and accurate manner.
Responsiveness – the willingness of employees to assist customers and provide
prompt service.
Assurance – the knowledge and courtesy of employees and their ability to convey
trust and confidence.
Empathy – the caring and individualised attention shown by employees to
customers.
Fifthly, Zeithaml et al (1990:51) found that five gaps give rise to service quality:
Consumer expectation – management expectation gap (GAP 1):
In the study they found that managers who know what their customers expect avoid
spending time and money on things that do not matter. The managers know what level
of service is perceived as excellent and they strive to meet that higher expectation.
The managers deliver what customers want, instead of what they think customers
want. However, inadequate upward communication channels and too many
management levels result in poor communication between management and
employees.
“The gap between consumer expectations and management perceptions of those
expectations will have an impact on the consumer’s evaluation of service quality”
Management perception – service quality specification gap (GAP 2):
In the study they found that when faced with constraints, such as a lack of resources or
adverse market conditions some managers find it difficult to deliver a service against
a formal standard. The focus groups agreed that the difficulties mean that matching or
exceeding their customers’ expectations is inhibited. The question arises whether
management’s perception of their customer’s expectations is realistic in view of
available resources.
“The gap between management perceptions of consumer expectations and the firm’s
service quality specifications will affect service quality for the consumer’s viewpoint”
Service quality specification – service delivery gap (GAP3):
Although organisations have formal standards and specifications, they find it difficult
to maintain standardised quality. In the services industry where service delivery and
consumption occur simultaneously, the extent of standardised quality is difficult to
measure.
“The gap between service quality specifications and actual service delivery will affect
service quality from the consumer’s standpoint”
Service delivery – external communications gap (GAP 4):
In the study they found that promising more in external communications than can be
delivered can raise expectations but lower perceptions of quality when promises are
not fulfilled. Behind-the-scenes efforts to serve the best interests of consumers are
Stellenbosch University https://scholar.sun.ac.za

9
often not communicated externally, consumers would perceive the delivered service
in a more positive way if this was communicated to them. The proposition is:
The gap between actual service delivery and external communications about the
service will affect service quality from the consumer’s standpoint
Expected service – perceived service gap (GAP 5):
In the study the judgements of high and low service quality depend on how the
consumers perceive the actual service performance in the context of what they
expected. The focus groups supported the notion that the key to ensuring good quality
service is meeting or exceeding the service that consumers expect from the service.
One respondent had a cheque refused by the bank a day earlier than it was due. The
respondent perceived the refusal as unwillingness to help as opposed to inability
under the law. The proposition is:
“The quality that a consumer perceives in a service is a function of the magnitude and
direction of the gap between expected service and perceived service
Sixthly, Zeithaml et al (1990) defined the perceived quality component:
The study found that service quality is measured by comparing expected service with
perceived service. The study found that regardless of the type of service, focus groups
used similar criteria to evaluate service quality. They grouped the criteria into ten
categories called “service quality dimensions”, which overlap. The differences in how
consumers evaluate the quality of consumer goods and services are determined by
classifying the properties proposed by Nelson (1970). He distinguished two categories
of properties (1) search properties, attributes a consumer can determine before a
purchase (2) experience properties, attributes which can only be determined after
purchase or during consumption. Search properties include colour, price, style, feel,
while experience properties include wearability and dependability.
Darby and Karni (1973) added to Nelson’s classifications a third classification,
credence properties, characteristics which are difficult to evaluate before, during and
after consumption. Credence properties include medical procedures. Few consumers
possess medical skills to evaluate whether these procedures are necessary or poorly
performed when they are administered. Offerings high in search properties are the
easiest to evaluate, those high in experience properties are more difficult to evaluate,
those high in credence properties are the hardest to evaluate. Most services contain
few search properties and are high in experience and credence properties, making
their quality more difficult to evaluate than goods (Zeithaml et al, 1990). Most of the
dimensions of service quality mentioned by the focus group were the experience
properties: access, courtesy, reliability, responsiveness, understanding the customer
and communication. Each of the dimensions can only become known while the
customer is purchasing or consuming the service. While customers may possess some
information based on their own experience or the experience of others, they are likely
the re-evaluate these dimensions each time a purchase is made. Focus groups were not
able to accurately evaluate the service quality of two of the dimensions that fall into
the credence property category. They were competence (the possession of the
required skills and knowledge to perform the service) and security (freedom from risk
and danger). The proposition is:
“Consumers typically rely on experience properties when evaluating service quality”
Based on insights from the study it was found that when expectations are not met,
consumers perceive the quality as less than satisfactory. When expectations are met,
Stellenbosch University https://scholar.sun.ac.za

10
quality is perceived as satisfactory. When expectations are exceeded, quality is
perceived to be more than satisfactory (Parasuraman et al, 1985)
Other researchers have tested and used the SERVQUAL instrument in the healthcare
environment and reported their findings. Some of these findings are discussed below.
Tangibles
The study by Tateke, Woldie & Ololo (2012:10-11) found the perceived cleanliness
score of hospitals to be associated with the satisfaction score.
Responsiveness
In their study, Tateke, Woldie & Ololo (2012:10-11) came to the conclusion that
patients need to be well heard during consultations with healthcare providers. When
healthcare providers are responsive and allow for the adequate consultation duration,
they will know more about the patients and their health problems. The study found the
perceived adequacy of consultation duration was a determinant of patient satisfaction.
This implies the importance of healthcare providers demonstrating their
responsiveness by engaging in adequate patient satisfaction.
Assurance
In this study on the determinants of customer satisfaction with hospitals, it showed
that perceived competence of the hospital staff had the greatest impact on patient
satisfaction (Boureaux & O’Hea, 2004).
Empathy
In this study it was indicated that patients have a tendency to infer the level of
technical quality based on non-technical aspects, such as the care providers’
compassion and empathy, responsiveness and service coordination amongst
healthcare personnel (Syed, Nazlee, Shahjahan, 2007). In this study, it was found that
perceived technical competence and perceived empathy had a positive association
with patient satisfaction; this is similar to other findings (Boureaux & O’Hea, 2004).
The question which service quality factor is most important to customers appears in
literature. It is evident that that all five factors are considered critical when evaluating
service quality. It is evident also that customers rate reliability the highest and
tangibles the lowest, regardless of the service being studied. The message from
customers to service providers is to be reliable – do what you say you are going to do.
The advantages of measuring patient satisfaction, appears in literature. According to
Buttle (1994) SERVQUAL has the following advantages above other measuring
instruments:
It is an accepted standard for assessing the different dimensions of service quality.
It is known to be valid in a number of service situations.
It is known to be reliable.
The instrument has a limited number of items and it is quick and easy to complete.
The analytical procedure to aid interpretation and results is based on research and
it is standardised.
Stellenbosch University https://scholar.sun.ac.za

11
According to Anderson (1995) the results of her study at a public university clinic
showed all five dimensions of SERVQUAL measured negatively, assurance being the
most negative.
When Youssef, Nel and Bovaird (1995) measured service quality at an NHS hospital
using the five dimensions of SERVQUAL, they found that patients’ perception of
service did not meet their expectations. The lack of the expected reliability was the
biggest problem.
Zeithaml et al (1990) conducted further research into service quality and gained
insight into the role of management in service quality. Their findings are discussed in
more detail in the next section.
a. Management should use organisational research to gain a better understanding
of the expectations of their customers. Management should also strive to interact
with their customers to gain more insight into the expectations of their
customers. A failure to understand customer expectations, leads to a service
quality gap (Zeithaml et al, 1990:60-1).
b. Management should facilitate upward communication of service information
from staff in contact with customers. Contact personnel gather valuable
information when interacting with customers. This information should inform
management on changes in customer perceptions and expectations. Research
has revealed that this service information is seldom passed onto management
(Zeithaml et al, 1990:63).
c. Management should ensure that the organisational structure allows the flow of
service information across the different levels of the organisation. Too many
levels between contact personnel and management could result in managers not
knowing what customers expect from the organisation. Multiple organisational
levels place barriers between top management who set the standards for service
quality, and contact personnel who deliver service quality to customers. The
greater the number of organisational levels, the more likely information will be
lost or misinterpreted in each translation from level to level (Zeithaml et al,
1990:64-5).
d. Management should set service quality standards for the organisation. The
setting of service quality standards should be a managed process and should be
based on what customers expect from the organisation. Management should
take account of organisational resource constraints and the unwillingness of
staff to change their existing approach (Zeithaml et al, 1990:71)
e. Management should be committed to achieving the ideal level of service
quality. The pursuit of short-term accounting-driven measures of performance
such as cost reduction, instead of service quality shows a commitment to a self-
defined perspective instead of a customer perspective (Zeithaml et al, 1990:72-
74).
f. The middle management of an organisation should commit to operationalising
service standards. Top management will not realise its goal of maintaining
Stellenbosch University https://scholar.sun.ac.za

12
service standards if middle management do not commit. Top management
should avoid the “program-of-the-month” approach, which leads to middle
management fatigue and to a lack of commitment because there is not enough
time to build support for the program (Zeithaml et al, 1990:71-72).
g. Management should overcome the perception of infeasibility when setting
service standards to meet or exceed customers’ expectations. Infeasibility is a
managerial mind-set that may or may not be related to actual constraints in the
organisation. However, actual constraints should be recognised, for instance
when customer expectations are too rigid and unrealistic (Zeithaml et al,
1990:76-77).
h. Management should drive innovation and be receptive to better ways of
providing service quality. This drive is a part of a mindset that counters
infeasibility. Managers should believe anything the customer wants is feasible.
Successful managers are willing to invest time, money and effort to meet
customer expectations (Zeithaml et al, 1990:77-79).
i. The degree to which management are able to standardise tasks should translate
into service quality standards. Although it is perceived that standardising tasks
leads to services that are impersonal, inadequate and not in the customer’s best
interest, the use of hard and soft technology enables the organisation to break a
task down and set a service standard such as the length of time a transaction
takes and the accuracy with which operations are performed. The advantage of
improving work methods is that staff are freed up to personalise and to improve
services (Zeithaml et al, 1990: 79-80).
j. Service quality goals set by management that cover the critical service
dimensions should meet customer expectations, allow employees to understand
what is required of them, and enable employees to respond to realistic standards.
The way in which goals are defined should enable the providers to understand
what they expected to deliver. High performance is achieved when goals are
challenging but realistic. Unrealistic goals leave employees feeling dissatisfied
and frustrated when not achieving the goal (Zeithaml et al, 1990:84-86).
k. Management should ensure that employees have clearly defined organisational
roles that they play. An organisational role is the set of behaviours and activities
performed by a person occupying that position. The role is defined through the
expectations, demands and pressures communicated to the employee by
individuals who have a vested interest in how the employee performs the job.
An employee with experience role ambiguity when the person is unsure what
the manager expects from them and they not sure how to satisfy the expectation.
A manager can provide role clarity by providing accurate information on the
employees’ organisational role (Zeithaml et al, 1990: 90-94).
l. Management should give attention to the hiring and selection of staff.
Insufficient attention to this process leads to a mismatch of skills to the job and
causes the service quality performance gap to widen (Zeithaml et al, 1990:99).
Stellenbosch University https://scholar.sun.ac.za

13
m. Management should ensure that employees can access adequate tools and
technology to be able to grow into their jobs. Employees that have the
opportunity to grow into their jobs are more likely to be satisfied and loyal to
the company. To build growth into lower-level jobs, if possible the organisation
should offer employees the opportunity to cross-train for other positions
(Zeithaml et al, 1990:99-101).
n. In service situations where the manner in which the service is provided
determines customer satisfaction, management could implement a behavioural
observation system to monitor their staff. A behavioural observation system tied
to a reward system which is timely, simple, fair, and accurate should make a
positive contribution to staff morale (Zeithaml et al, 1990:102-4).
o. “Employees’ reactions to stressful situations depend on whether they feel they
can control those situations.” The perceived control of the employee is their
ability to respond to threatening situations and being able to choose the
outcome. Management should train staff how to control stressful situations and
reap the benefit of suffering from less stress. When employees perceive that
they can act flexibly rather than by rote, their perceived control increases and
performance improves (Zeithaml et al, 1990:104- 5)
p. Management should empower employees and help them to develop in their job.
Empowerment in the organisational sense means pushing decision-making
down to the lower levels of the organisation but still within the existing
governance framework. Empowerment in this sense also means reassessing
overly standardised and mechanistic approaches for dealing with customers and
replacing these approaches with a structured approach that allows the employee
to individualise their skills and methods (Zeithaml et al, 1990: 102-107).
q. Management should encourage employees to recognise the value of working as
a team and to strive to meet a common objective. Teamwork encourages
personal involvement and a strong belief in the organisation and it should be at
the core of management’s service-quality initiatives (Zeithaml et al, 1990:107-
9).
r. Management should manage service quality perceptions by ensuring that what
the organisation promises about its service is what it actually delivers. Corporate
communications should not overpromise or misrepresent what the organisation
offers (Zeithaml et al, 1990:115-134).
s. Management encourage corporate communication where employees explain the
excellent service they offer. Employees communicating excellence become a
standard for other employees to model their performance (Zeithaml et al,
1990:115-134).
t. In an organisation with multiple operating unit offering services, management
should develop a mechanism to drive uniformity in service quality (Zeithaml et
al, 1990:115-134).
Stellenbosch University https://scholar.sun.ac.za

14
2.5. PATIENT SATISFACTION
Patient satisfaction can be described as a substantial gap between a patient’s
expectation and perception of the care he/she receives (Glick, 2009). The patient’s
expectation of a hospital’s service could be influenced by a previous experience or
based on information obtained from others (Tateke Woldie & Ololo, 2012). Tateke
(2012) is of the opinion that the expectation of a patient at a public hospital is lower
than the expectation of a patient at a private hospital.
The term ‘patient-centredness’ (PC) coined by Balint emphasises that patients are
unique and it describes the manner in which physicians should interact and
communicate with their patients (Setlhare, Couper & Wright, 2014:1). The term has
grown to mean optimal patient-healthcare system interactions and described by
McWhinney (as quoted in Setlhare, Couper & Wright, 2014) as ‘seeing the illness
through the patients eyes’. The need for the physician to provide an environment that
is conducive to patients’ full and free expression (Setlhare, Couper & Wright,
2014:1).
In South Africa, the authoritarian approach to patient care has been replaced with a
patient-centred approach (Department of Health, 2000). The health department has
detailed this approach in the Patient’s Rights Charter to guide health workers
(Department of Health, 2000). The charter allows patients the right to complain about
the quality of health service they receive (Department of Health, 2000).
In the present day, patients assume a more active role in healthcare, instead of being
passive recipients. Patients educate themselves, they are aware of their rights, demand
better quality of service, and ask for more information if needed (Bediako, Nel &
Hiemstra, 2006:12). Healthcare providers are beginning to understand the importance
of the patient perspective using patient feedback methods (Phaswana-Mafuya, Peltzer
& Davids, 2011). Patient feedback informs health providers whether the level of care
offered is adequate (Peltzer, 2009). Feedback (by means of surveys) is often used to
measure the quality of care as a health outcome (Fitzpatrick, 1991). Historically,
healthcare providers adopted an authoritarian approach to healthcare and viewed
patients as passive recipients of healthcare (Larrabee, 1995). Health authorities shared
this view, and both concluded that patients lacked the technical knowledge to make
fully informed decisions on their own (Phaswana-Mafuya et al, 2011). Patient
satisfaction should be considered when quality of care is assessed (Bediako, Nel &
Hiemstra, 2006).
2.6 THE MEASUREMENT OF PATIENT SATISFACTION
According to Andaleeb (2001) patient views collected using patient satisfaction
surveys enable a better understanding of the drivers of quality health services.
According to Glick (2009:368) patient satisfaction surveys highlight aspects of care
that require improvement; simple and take little time administer; enable the
development of strategic measures; aid education by identifying achievements and
failures; promote the use of empirical knowledge instead of guesswork in decision-
making. They should require uncomplicated protocols for sampling and interviews,
and be simple and take little time to administer. They are mostly administered as an
exit survey but challenges regarding this approach are discussed further below.
Stellenbosch University https://scholar.sun.ac.za

15
Although the advocacy for surveys has grown, there has been concern about the
usefulness of surveys responses when trying to understand client satisfaction (Glick,
2009:368). The one reason user exit surveys typically show uniformly high
satisfaction (Lindelow & Wagstaff, 2003) with services is ‘courtesy bias’ where the
respondents are reluctant to express a negative opinion to a stranger, leading to an
overestimation of satisfaction. This situation is most likely when respondents are
interviewed at the health facility right after receiving care, they may associate the
interviewer with the health facility and may want to avoid a ‘disappointing response’.
A high level of satisfaction in surveys can reflect; the “Hawthorne effect’ where
healthcare practitioners perform better when they know they are being observed; and
patients judge services against very low expectations (Glick, 2009:369). It is possible
to obtain a more accurate measure of consumer perceptions by asking about specific
aspects of health facility quality or areas of improvement instead of asking general
questions about overall satisfaction (Bessinger & Bertrand, 2001). It has been
suggested that courtesy bias could be higher for subjective questions, for instance,
when a respondent rates their satisfaction when interacting with health facility staff, as
opposed to rating the objective attributes of a health facility (Glick, 2009:369). There
is a hypothesis that courtesy bias will more strongly affect estimates of highly
subjective indicators (Glick, 2009:373).
The recognition of the shortcomings in healthcare in developing countries (World
Bank Development Research Group, 2004) has motivated efforts to measure and
monitor health service quality using surveys of healthcare workers and their patients
(Lindelow & Wagstaff, 2003). Surveys are used to measure user satisfaction with, or
perception of overall service quality or specific aspects of quality. In addition to
measuring client satisfaction surveys identify health facility attributes or practices that
increase satisfaction (Glick, 2009:368).
2.7 OTHER MEASURES OF SERVICE QUALITY
2.7.1 The Gronroos model
Gronroos (1990) developed a model for use in marketing and healthcare. The model
that Gronroos (1990:97) offers of service quality distinguishes between functional and
technical quality, six criteria relating to functional quality are defined in the table
below.
Table 2.1: Gronroos’ dimensions of perceived service quality
Dimension Definition
Professionalism and skills Employees have the knowledge and skills
to solve the customers’ problems?
Attitudes and behaviours Employees show interest in solving
problems?
Accessibility and flexibility Is the set-up designed to enable easy
access?
Reliability and trustworthiness Rely on employees and systems to keep
promises and to act in best interests?
Recovery Rely on organisation to react to
unpredictable situations and to solve
problems?
Reputation and credibility Trust the operations to deliver?
Stellenbosch University https://scholar.sun.ac.za

16
Source: Gronroos, C. Service quality: Research perspectives (1990)
The typology of service quality above is from the customer’s point of view. The
typology serves as a framework for people measuring service quality and is designed
to be modified to serve specific needs (Schneider &White, 2004:38).
The dimensions in the Gronroos model are similar to the SERVQUAL dimensions of
Parasuraman et al (1985) used in marketing. Trust in the organisation and the
knowledge of its people is common to both models. Gronroos places more emphasis
on ease of accessing services and on the ability of the organisation to respond to
customer complaints. Other authors found that customers remembered failed services
favourably if they felt the organisation recovered well – offering a replacement
service. The other authors also found that a complaining customer can become a
committed customer if the customer could be persuaded to stay after a failed service
(Schneider & White, 2004:34-35).
Technical quality in healthcare is the accuracy of diagnosis and procedures and
functional quality refers to the manner of delivery of healthcare (Gronroos, 1990:97).
2.7.2 The Naumann and Giel model
The customer satisfaction measurement model proposed by Naumann and Giel
(1995:12) is a mechanism to determine the extent to which customer value is being
created and delivered. Customer-driven input to the organisation’s learning process is
acquired, analysed and utilised. The programme solicits customers’ ideas for
improvement and innovation. The programme removes the guesswork of determining
customers’ expectations and enables the organisation to gauge the level of customer
value and the extent to which expectations are met or exceeded. The programme is
valuable to the organisation if it is embedded in the organisational culture. The
programme captures inputs and ideas seldom found in traditional market research and
it generates empirical data on customer’s expectations and perceptions of
performance.
Naumann and Giel (1995:13) argue that usually the most profitable firms have the
highest customer satisfaction levels. Profitable firms usually have the lowest
employee and customer turnover rates. Profitable firms correlate customer
satisfaction, customer retention, and employee satisfaction.
Naumann and Giel (1995:13) see the design, implementation and utilisation of the
model as a sequential and iterative process. Although the model exists in a changing
environment, the model follows a clearly defined process.
According to Naumann and Giel (1995:5) customer value consists of product quality,
service quality and a price based on those elements. The environmental responsibility,
corporate citizenship and overall integrity of the organisation, correlate with product
and service quality. Customer expectations of value correlate with customer
satisfaction.
According to Naumann and Giel (1995:12), the true measure of customer-driven
performance is customer satisfaction measurement. The movement amongst
organisations to be more customer-driven is a trend in management practice across the
Stellenbosch University https://scholar.sun.ac.za

17
world. To be customer-driven, the organisation must focus on its core competence –
areas of distinct competence in creating value.
Perceived quality directly influences customer loyalty and customer satisfaction.
Therefore, customer satisfaction partially mediates the quality (Ball, Coelho &
Vilares, 2006; Boshoff and Gray, 2004). A study used perceived quality to assess
patient satisfaction and found a strong correlation between the variables (Choi, Lee,
Kim, Lee and Choi, 2004). Studies show that patient satisfaction is the key
determinant in the relationship between perceived healthcare quality and patient
loyalty intention (Donabedian, 1996).
2.8 CONCLUSION
The following conclusions were reached from the review of literature pertaining to
health service delivery and the measurement of the quality of the provisioning of these
services.
Services are intangible performances, heterogeneous in nature and most often
production and consumption of the service occur at the same time making it difficult
to measure service quality.
The occurrence of the concept service quality has been the subject of a number of
studies in different industries.
Based on the review of literature the researcher is of the view that variables and
criteria can be established to measure intangibles such as human expectation and
perception within a specific context. The observation of human behaviour offers
insights into the characteristics of the concept called patient satisfaction. There is a
strong correlation between the defined variables of patient satisfaction expressed as
service quality namely tangibles, reliability, responsiveness, assurance and empathy.
The satisfaction of a patient with the service they received is indicative of the capacity
of a hospital to meet patient needs. The extent of correlation between the variables of
patient satisfaction indicate that standards of service are valid and the researcher
disagrees with the view of weak correlation.
Having conceptualised patient satisfaction in this chapter, the incidence of patient
satisfaction will be examined within the context of South Africa and the Western
Cape.
Stellenbosch University https://scholar.sun.ac.za

18
CHAPTER 3: HEALTH SERVICES IN SOUTH AFRICA: A
WESTERN CAPE PERSPECTIVE
3.1 INTRODUCTION
This chapter places the study of health service delivery within the African context,
with emphasis on South Africa. The building blocks of health systems, policies,
legislation, institutions and the current reality are considered, and the package of
health services in the Western Cape is also discussed.
3.2 THE AFRICAN CONTEXT
To achieve patient satisfaction in Africa, the local health departments need to remain
in touch with the local context in which health services are delivered. A feature of this
continent is the cultural, religious and ethnic diversity of the population. It is also a
continent with income and social inequalities.
The participants at the 2nd
African Regional WONCA (World Organisation of Family
Doctors) Conference held in Rustenburg, South Africa in 2009 placed the delivery of
health services in Africa into context when they stated that the continent is a vast area
with its own unique cultural, religious and ethnic diversity. This diversity gives rise to
unique perceptions and beliefs around the delivery of healthcare. Although healthcare
is delivered in an environment marked by gross inequalities and disparities, the
continent shows its strength through extended family values and communal
accountability.
The participants at the conference were of the view that African medical practitioners
should operate in health systems where patients receive person-centred care with a
family and community orientation. The reality is that person-centred care is often
offered with limited human, financial and material resources. It was also noted that
health practitioners should acquire cultural competencies. This includes knowledge of
local languages, traditions and religious beliefs. It was also noted that African health
practitioners are expected to advocate for the poor and marginalised in society.
3.3 HEALTH GOVERNANCE AND LEADERHIP
The government should oversee leadership and governance in the private and public
health sector to achieve patient satisfaction.
According to the World Health Organisation (World Health Organisation, 2007:23)
the leadership and governance of health systems, called stewardship, is a critical
building block within the health system, it’s about the role of government in
healthcare. This involves overseeing and guiding the private and the public health
sectors to protect the public interest (World Health Organisation, 2007:23). It is the
experience of the World Health Organisation (WHO) that some of the leadership and
governance functions (World Health Organisation, 2007:23) listed below are common
to all health systems.
Policy guidance. Formulating sector strategies and technical policies; defining
goals and spending priorities across services; identifying roles for public and
private actors and the role for civil society.
Stellenbosch University https://scholar.sun.ac.za

19
Regulation. Designing regulations and ensuring they fairly enforced.
Accountability. Ensuring all private and public health sector actors are held
publicly accountable and promoting transparency to achieve greater
accountability.
A range of instruments and institutions exist to carry out the functions of effective
leadership and governance (World Health Organisation, 2007:24). These instruments
include sector policies, medium term expenditure frameworks, resource allocation
formulae, Patient’s Charters, government commitments and performance-based
contracts. The institutions performing these functions may include other government
departments and ministries, parliament and portfolio committees, statutory and
professional bodies, auditors and the news media.
Governance is a challenge in many countries, not only in SA. In their article on the
evolution of primary healthcare in Australia, Nicholson, Jackson, Marley & Wells
(2012:23) point out that leading the health system in a manner that all the stakeholders
understand the vision, and the need to accept mutual accountability to achieve a
higher performing health system, is a challenge.
The Constitution (Republic of South Africa, 1996) spells out the right of the citizens
of this country to healthcare that is accessible, equitable and affordable. This right is
dealt with under separate sections of the Act: section 27(2) grants this right to all
citizens; section 27(3) states that no one may be refused medical treatment when in
need and section 24(a) states that every child has the right to basic healthcare services.
Since 1994, the democratic government made strides by instilling an equitable
governance model to address gross inequalities in health infrastructure and health
services since (SADHS, 2003:4). The National Health Act 61 of 2003, published in
the Government Gazette on 23 July 2004 has the following objects: to regulate private
and public providers of health services; ensure that health services are delivered in an
equitable manner to all citizens using available resources; establish the rights and
duties of healthcare providers, health workers, health establishments and users; and
enforce the rights afforded by the Constitution. The Act provides the framework for a
structured health system in the South Africa. It replaced the Health Act, 1977, Act 63
of 1977 with the National Health Act 61 of 2003. The government reviewed several
Acts that complement the Health Act and amendments were passed such as: Medical
Schemes Amendment Act, 2002; the Health Professions Amendment Act, 2004; and
the Nursing Amendment Act, 2004. The purpose of reviewing legislation was to
ensure that the legislation promotes the right of people to healthcare (SADHS,
2003:5).
“The major policy focus remains the planned introduction of National Health
Insurance, for which a green paper was released for comment in August 2011.
Although missing many critical details, the draft policy document lays out the
pathway to implement universal coverage by 2025.” (SAHR, 2011)
The government’s decision taken to introduce a national health insurance by 2025 has
changed the health policy landscape fundamentally. The Green Paper on the NHI in
August 2011 (Republic of South Africa, 2011) followed on from the Discussion
Stellenbosch University https://scholar.sun.ac.za

20
Document on the NHI released after the 2010 National General Council of the African
National Congress in September 2010 (ANC National General Council, 2010).
In essence, the objective of the NHI, spelt out in the Green Paper, is to grant both
employed and unemployed people access to a health services procured on their behalf
through the use of a single pool of funds (SAHR, 2011:4-6). The Green Paper links
the provisioning of quality services to the securing of adequate funding. The funding
of the NHI will be significant and it was estimated at R255 billion in 2011 at current
allocations at the time. Yet, beside the intention to provide health services at an
affordable cost; the Green Paper does not deal with cost containment in any detail
that allows the reader to foresee the benefits of public provisioning as opposed to
private provisioning. The Green Paper spells out government’s intention to control
key financial resources to gain purchasing power to arrest spiralling costs.
The fact that the Health Department released a Green Paper on the NHI as opposed to
a more refined White Paper shows an element of caution. The department retained the
guiding principles that the NHI should: ensure the right to access healthcare as stated
in the Bills of Rights in the Constitution; ensure sufficient cross-subsidisation
between rich and poor, and the sick and healthy; provide care with strong
management and healthcare systems; promote equitable care which is affordable; and
minimise administrative structures across national, provincial and local structures.
The NHI will pool funds and use these funds to purchase health services on behalf of
the entire population from contracted public and private healthcare providers. Funding
for NHI would come from mandatory contributions by those employed and the
allocation of general tax revenue by the Treasury. There are few details on how the
NHI would be governed. The NHI policy acknowledges that existing structures and
systems are weak, that the quality of interventions needed to be improved, that more
staff and training are needed, and that procurement processes need to become more
robust.
3.4 HEALTH INSTITUTIONS
Institutions involved in the public health sector should institute measures to achieve
health outcomes and patient satisfaction.
National Department of Health
The National Department of Health is the custodian of the public health system. The
department decided to adopt the national outcome of “a long and healthy life for all
South Africans” (Department of Health, 2012). This outcome is one of twelve
national outcomes aimed at improving service delivery within the public sector. The
12 outcomes are defined within the Medium Term Strategic Framework (MTSF). To
give effect to the outcomes, the health minister concluded a Negotiated Service
Delivery Agreement (NSDA) with the President. In turn, the health minister
concluded agreements with the Health MEC’s of the nine provinces (Department of
Health, 2012). The four outputs (Department of Health, 2012) below are linked to the
outcome:
to increase the life expectancy of its citizens
to decrease maternal and child mortality
to combat HIV, AIDS and TB
to improve public health systems
Stellenbosch University https://scholar.sun.ac.za

21
The Health Department also has a mission to improve the health status of people by
preventing illness, promoting a healthy lifestyle, and improving the healthcare
delivery system (Department of Health, 2012). The achievements against target for
the four outcomes appear in the Annual Performance Report (APR).
The following statutory health councils exist
Health Professions Council of South Africa (HPCSA)
South African Pharmacy Council (SAPC)
The following is an overview of recent developments initiated by these institutions to
maintain and improve the competencies of their professionals.
Health Professions Council
The Health Professions Council of South Africa (HCPSA) is the statutory health
council for the health professions. The steady stream of regulations and board notices
have included rules relating to additional qualifications for oral hygienists and draft
rules for speech therapists, audiologists, biokineticists, medical and dental
practitioners, and medical technologists (SAHR, 2011:8). Although the HPCSA has
continued to fulfil its mandate of regulating the professions by instituting continuing
professional development (CPD) to ensure the competency of health professionals is
maintained, the focus on continuing to transform governing structures to represent the
ethnic majority of the population has gained momentum.
Pharmacy Council
The South African Pharmacy Council (SAPC) is the statutory health council for the
pharmacist profession. It instituted continuing professional development (CPD) to
maintain and improve competencies amongst pharmacists and it issued the regulations
in May 2011 SAHR, 2011:8). Since then, pharmacists have to maintain a portfolio of
evidence of CPD, a move which has been welcomed within the profession (SAHR,
2011:8). It is unlike the points-based system of the HPCSA and mandatory for all
registered pharmacists and pharmacist’s assistants (SAHR, 2011:8).
3.5 HEALTH STRATEGY
Patient satisfaction should be part of the strategy of the National Health Department.
The health services provided by health facilities form part of a health system (World
Health Organisation, 2007:2). Therefore, any strategy to strengthen health services
should not be considered in isolation, but placed within the context of “strengthening
health systems” (World Health Organisation, 2007:2). To implement a strategy, there
needs to be a shared perception of what a health system is, what the system is striving
to achieve, and to tell if the system is moving in the right direction (World Health
Organisation, 2007:2). A health system consists of all organisations, people and
actions whose primary intent is to strive to promote, restore and maintain health
(World Health Organisation, 2007:2). Health systems have multiple goals. The World
health report defined the overall health system goals as: improving health and health
equity in ways that are responsive, financially fair, and make the most efficient use of
resources and in the intermediate achieve greater access to and coverage for health
Stellenbosch University https://scholar.sun.ac.za

22
interventions without compromising provider quality (World Health Organisation,
2007:2).
The National Health Department has put a strategy in place to improve healthcare in
South Africa. The strategy follows an outcomes-based approach. The strategy relies
on a vision “a long and healthy life for all South Africans” to conceptualise this
approach is a manner that is understandable to everyone. The following are the four
key outputs of the approach: to increase the life expectancy of its citizens; to decrease
maternal and child mortality; to combat HIV, AIDS and TB and to improve public
health systems were defined in the NSDA, to be able to show measurable results
against the vision (SAHR, 2011:30).
Since 1994, the SA health system faced challenges and it progressed as well (Barron,
2008; Chopra, Lawn, Sanders, Barron et al, 2009).
Challenges
The accomplishment of greater parity in district health expenditure, of more clinics
and hospitals, of more immunisations and better malaria control, is being
overshadowed by poor quality of care, a lack of delegation of authority and
operational efficiency, poor health leadership and low worker morale (Harrison,
2009:2).
Harrison (2009:2) links improvements in service efficiency and quality of care to a
new funding formulas found in the proposed national health insurance system. One of
the biggest post-1994 accomplishments, the district health system, should make health
management more responsive to local conditions and distribute resources more
equitably, yet the implementation of the district-based system suffers from
inefficiencies due to poor leadership. Harrison (2009:5) suggests a ‘breakthrough
strategy’ in the form of a diagram below, to improve the state of the health system.
Stellenbosch University https://scholar.sun.ac.za

23
Figure 3.1: Health system improvement strategy, 2009
Source: Harrison, 2009
Health outputs
The National Health Department made a commitment to achieve specific health
outputs between 2010 and 2014. In October 2010, the Minister of Health, Dr A
Motsoaledi, signed a Negotiated Service Delivery Agreement (NSDA) with the
President. The agreement formalised the department’s commitment to National Health
Outcomes from 2010 to 2014. Furthermore, the health minister signed agreements
with other cabinet ministers and with the Members of Executive Council (MEC’s) in
the nine provinces. The minister passed on the responsibility of implementing the
NSDA to the National Health Council (Department of Health, 2012).
Stellenbosch University https://scholar.sun.ac.za

24
The progress in achieving the national health outputs is detailed in the Annual
Performance Plan (APP). Actual results for the four outputs are measured against
targets.
According to Harrison (2009:13), the five strategic instruments adopted by national
government after 1994: free primary healthcare; the essential drugs programme; the
choice on the termination of pregnancy; the anti-tobacco legislation; and the
imposition of community service for graduating health professionals, led to
significant gains in healthcare provisioning. Two of these strategies are dealt with in
more detail as they touch on themes with in this study.
1. Free primary healthcare for all. A theme in this study is the accessibility of
healthcare for the general population. On 24 May 1994, the President Mr
Nelson Mandela announced that pregnant women and children under the age of
6 would receive free care at public health facilities. The free care policy was
extended to all users in April 2006. A survey conducted in 1996 on health
inequalities found that a proportion of people delayed seeking medical attention
due to cost. By 1999, after the introduction of free services, 86% of people
using PHC facilities reported that no fee was incurred for the services received.
The increased burden on health workers resulted in a widespread nursing strike
in late 1995. The dramatic change in PHC usage pre and post the change in
strategy is shown in the figure below (Harrison, 2009:14).
Figure 3.2: Public clinic utilisation, 1993-5
2. Community service for graduating professionals. Increasing the number of
health professionals leads to more patient satisfaction. The one-year community
service (CS) for health professions significantly improved the availability of
public sector resources. The first intake of doctors, dentists and pharmacists
began in 2001. The intake of other professions began in 2004. The role of
community service in increasing human resources is illustrated in the figure on
doctor posts below:
Stellenbosch University https://scholar.sun.ac.za

25
Figure 3.3: Number of general practitioner posts, 2006-8
Community service posts filled 14% of general practitioner posts in 2006 and
12% in 2007. The small percentage of filled community service posts in 2008 is
due to the increase in CS for doctors from one to two years (Harrison, 2009:15).
3.6 HEALTH STANDARDS
Health service providers need to adhere to prescribed standards to improve their
quality of care and achieve patient satisfaction. The government should put measures
in place to enforce standards.
The national department of health continues to focus on strengthening health systems
to improve the quality of the health services (SAHR 2014: 26). The strengthening of
health systems will be achieved through, amongst others, standardising quality of care
by certifying health establishments (SAHR 2014: 26).
The legislative provisions to amend the National Health Act to establish the Office of
Standards Compliance (OSC) as a Schedule 3A Public Entity were finalised over a
three-year period. The mandate of the Office is to protect and promote the health and
safety of users of health services through monitoring, enforcing compliance with
prescribed standards and ensuring the investigation and closure of complaints (SAHR
2014:28).
To ensure that quality of care becomes the norm throughout the country, the national
health department created the OHSC within its departmental structure. To ensure the
legitimacy of its work, the OHSC based its work on the provisions set out in the
Stellenbosch University https://scholar.sun.ac.za

26
National Health Act. To develop the National Core Standards (NCS) appropriate to
the local context, the OHSC followed a participatory process over a five-year period,
followed by a dissemination and training initiative. The OHSC has offered facilities
support to apply the standards (SAHR 2014:26).
The NCS is divided into seven domains (SAHR 2014:27) reflecting a systems
approach. The first three domains relate to the core business of a health system and
the last four domains refer to the support system that ensures the core business is
delivered. The domains, subdivided into sub-domains, are as follows:
Table 3.1: NCS dimensions
Domain Explanation
Domain 1: Patient Rights How to ensure patient rights are respected and
upheld?
Domain 2: Patient Safety How to ensure quality care reduces unintended harm
to patients?
Domain 3: Clinical Support
Services
How to provide specific services that support clinical
care, such as health technology?
Domain 4: Public Health How should health facilities work within a
community to promote health?
Domain 5: Leadership and
Corporate Governance
How should senior management provide strategic
direction to departments and facilities?
Domain 6: Operational
Management
How to engage in daily activities such as patient care
and manage human resources and finances.
Domain 7: Facilities and
Infrastructure
How to provide physical infrastructure, hotel
services and waste disposal.
Six areas covering a subset of the standards have been identified as non-negotiable
(SAHR 2014:26), as follows:
Values and attitudes of staff, so that patients are treated in a respectful manner.
Reducing waiting times and queues for administration, assessment, diagnosis,
pharmacy.
Cleanliness of hospitals and clinics.
Keeping patients safe and providing reliable care by reducing adverse events
resulting from care.
Preventing infections from being passed on in hospitals and clinics, specifically
hospital-acquired infections.
Ensuring medication, supplies and equipment are available and that patients get
their medicine as prescribed.
The National Health Department with the assistance of it public sector partners
compiled and published the National Core Standards (NCS) for Health Establishments
in South Africa in 2011. The Standards provide detailed definitions of concepts used
in medical services and provide a framework to certify health establishments.
Compliance with the standards is measured using an audit tool setup in the District
Health Information System (DHIS) (Department of Health. Core standards, 2011:2).
The management of hospitals and clinics are expected to use the audit tool to assess
their compliance with the NCS. Management has to appoint quality champions to lead
quality improvement initiatives and close any gaps in service. In future, the
Stellenbosch University https://scholar.sun.ac.za

27
Inspectorate of the OHSC will do inspections to determine the degree of compliance
and issue a certificate’s of compliance with health establishment (Department of
Health. Core standards, 2011:2-3).
The NCS are in seven interdependent domains where service quality can be at risk. A
hospital that respects patients and upholds their rights, gives access to dignified
attention in an acceptable environment respects patient rights. In the second domain, a
hospital that is able to reduce unintended harm when faced with clinical risk is able to
offer patient safety, clinical governance and clinical care. Clinical support services
fall in the third domain.
The National Development Plan is a framework for the future. The National
Development Plan (NDP) 2030 is the first long-term plan for South Africa that was
developed by The Presidency. The National Treasury has stated that its budgets and
institutional planning would be better aligned to the NDP in future. The NDP deals
extensively with public healthcare (National Planning Commission, 2013).
The Outcomes Approach of the Presidency is a key framework. The National
Department of Health made a strong commitment to four key outcomes when the
minister signed the Negotiated Service Delivery Agreement (NSDA). The following
targets are linked to the four outcomes below
Table 3.2: Health NSDA targets till 2014
Output Target for 2014
1 Increase life expectancy Males (53.9 to 58 yrs); Females (57.2
to 60 yrs)
2 Decrease maternal and child mortality Maternal mortality (less than 100 per
1000); Under five (less than 20 per
1000); Infant (less than 18 per 1000)
3 Combat HIV and AIDS, TB HIV infections (reduce by 50%);
HAART therapy (80% access); TB
cure rate (over 85%)
4 Strengthen health system effectiveness Primary Healthcare (re-engineer);
NHI system (implement)
Source: National Department of Health, 2010
3.7 NATIONAL HEALTH SERVICE REALITY
The National Health Department adopted a broad-based approach to improve the
quality of care in the public sector. It implemented a number of initiatives in this
approach. However, not all the initiatives yielded the anticipated results.
Recently, the National Department of Health decided to adopt a broad-based approach
to improve the quality of care and to increase access to public health services in the
future. It made a commitment, increased access would not compromise the quality of
care provided at state health facilities.
According to results published in the South African Demographic and Health Survey
(SADHS, 2003), the major reasons for dissatisfaction in the public sector hospitals
and community health centres were long waiting times, staff attitudes, prescription
Stellenbosch University https://scholar.sun.ac.za

28
medication being not available and staff shortages (SADHS, 2003:1). At the time of
the survey, South Africa had enjoyed 10 years of democracy following the countries
break from the past of racial discrimination and social disruption (SADHS, 2003:1).
The first decade of democracy resulted in pervasive institutional transformation.
Efforts to deal with the legacy of Apartheid had been instituted in all sectors in all
sectors of society. The survey noted that government had introduced programmes to
redress the imbalances between the rich and the poor including free access to free
basic health services to pregnant women and children under six, education, shelter and
clean water. Although much had been achieved in the first ten years of democracy
service delivery was lacking in many areas.
3.7.1 Health facilities in SA
Patients are satisfied when there is strong evidence that their provincial health
department is taking steps to capacitate facilities under its control.
The number of public health facilities in the country? The national baseline audit
(HST Audit, 2012:11) of public sector facilities commissioned by the NDoH,
determined the actual number of public health facilities in 2012, see Table 1 below.
The facilities are listed according to their classification status not their functional
status, which could differ. Although the District Health Information System (DHIS)
of NDoH reflected 4300 public health facilities, the audit found 3880 facilities. The
twenty-one PHCs in the City of Cape Town which were not audited are not included
in the figures in Table 3.3 below (HST Audit, 2012:11). This is a 10% count error
against the DHIS.
Reasons for an audit count difference? The DHIS figures included; a number of
private health facilities; services as facilities; closed facilities; and duplicate counts, in
addition the DHIS excluded a number of new and existing facilities (HST Audit,
2012:11).
Table 3.3: Number of facilities by classification 2011
Health facility classification Number of facilities
Clinics
Clinic 3074
Satellite clinic 125
Specialised clinic 4
Hospitals
Children’s hospital 1
Chronic hospital 4
District hospital 253
National central hospital 6
Orthopaedic hospital 1
Private hospital 1
Psychiatric hospital 23
Regional hospital 55
Rehabilitation hospital 3
Tertiary hospital 10
Tuberculosis (TB) hospital 35
TB and psychiatric hospital 2
Stellenbosch University https://scholar.sun.ac.za

29
Other
Community day centre 44
Community health centre 238
Maternal obstetrics unit 1
3088
Source: Health Systems Trust, 2011.
3.7.2 Performance information in SA
To improve patient satisfaction, health department’s health facilities should have
information systems in place to gather management, staff and patient data. Data
enables the management of a health facility to monitor patient condition and health
outcomes.
Internationally, the public reporting of patient satisfaction data has been found to be
useful. A review of international literature offered insight into the use of patient
satisfaction information found in public reports. In their article on the impact of public
reporting of hospital patient satisfaction on hospital quality improvement, Barr et al
concluded that public reporting of comparative data on patient views can enhance and
reinforce quality improvement efforts in hospitals. They found that data from the
patient satisfaction surveys was used by hospitals to identify new quality
improvement initiatives. The intent of public reporting is, not only to provide
information for consumers, but also to stimulate quality improvement efforts at
hospitals.
In the US, several evaluations of public reports on hospital clinical measures suggest
that facilities do make changes in response to these reports. Hospitals in Pennsylvania
and New Jersey (Bentley & Nash, 1998) used public reports of performance to
develop new approaches to improve clinical indicators.
In 1998, the state of Rhode Island enacted legislation requiring public reporting of
clinical performance and patient satisfaction by all licensed healthcare facilities in the
state, with two major goals: public accountability and quality improvement. The state
wide external environment provided the context for the hospitals’ involvement in the
public reporting process. The external environment was viewed as a facilitator for the
adoption of a standardised approach to quality measurement.
Locally, provinces include the results of patient satisfaction survey in their public
reports. The Western Cape Department of Health reports the results of patient
satisfaction surveys for each of its three levels of hospitals.
The culture of reporting on performance should be entrenched in SA. The reporting of
performance information should be linked to the funding of health facilities, and the
performance data should be available for scrutiny (Van As & Blecher, 2003:592). To
maximise the use of performance information, the need exists for health information
to inform policies, priority setting and resources allocation (Garrib, Herbst, Dlamini,
McKenzie, Stoops, Govender, & Rohde, 2008:549). Health information systems
(HIS) should use health information appropriately to ensure resources are allocated
efficiently and effectively to improve health service performance (Garrib et al,
Stellenbosch University https://scholar.sun.ac.za

30
2008:549). HIS should convert reliable, accurate and timely data into information that
supports decision-making (Garrib et al, 2008:549-50).
The collection and reporting of health data has its own challenges in SA. Garrib et al
(2008) evaluated the implementation of the DHIS in 10 primary healthcare clinics in
northern KwaZulu-Natal. The evaluation designed around the steps in the information
cycle (Figure 3.4) assessed how well each step worked. The results of the evaluation
showed: data was duplicated at all clinics; the format of the paper-based registers
differed from one clinic to another, the registers were poorly designed; duplicate data
elements appeared on the monthly data collation forms; clinic staff rarely checked
their collated data; none of the clinic staff could calculate the indicators shown in
graphs on reports; reported data of the clinics was not discussed in staff meetings; the
clinic staff had little understanding on the usefulness of the data; and no feedback on
the data took place between the district office and the clinic supervisors.
A reliable health system should be in place to assist decision-making in SA. “A well-
functioning health information system is one that ensures the production, analysis,
dissemination and use of reliable and timely information on health determinants,
health system performance and health status” (World Health Organisation, 2007:3).
To support decentralised decision-making, the District Health information System
(DHIS) was introduced in 1996 and extended by 2001 to collect data from all public
health facilities (Garrib et al, 2008:550). To be able to predict performance against
targets to be assessed, the DHIS allows different levels of service to be analysed
(Garrib et al, 2008:550). To enable reporting of health data at district, provincial and
national level, DHIS data is collected using paper-based registers, tally sheets and
monthly data collation forms and sent to the district or sub-district office to be
captured (Garrib et al, 2008:550).
Patient feedback should be part of a HIS. Van As & Blecher (2003:591) suggest the
Stafford Beer system as a model for the South African healthcare system. The model
shows systems are far more complex than assumed. It stresses close coordination
between the three levels of care and coordination between the higher echelons and the
levels of care. Patient feedback to meet needs is prominent in the model. The authors
are of the view that information on patient satisfaction using feedback is as important
as information on outputs, quality and outcomes.
Figure 3.4: A value-adding model of the SA healthcare system
Source: Van As & Blecher, 2003
Stellenbosch University https://scholar.sun.ac.za

31
3.7.3 The health workforce in SA
Patients are satisfied when they are admitted to a hospital that is well staffed with
professionals that have knowledge, skills, and empathy. It is government’s
responsibility to ensure public hospitals receive sufficient funding to appoint
professionals that can deliver excellent health services. To ensure professionals re
retained, government should offer a package of benefits to its employees to compete
with the private health sector.
By ascertaining the level of satisfaction of its employees, the public health sector is
better able to face the complex issue of employee retention (De Jager & Swanepoel,
2008). The level of staff satisfaction at a hospital provides management with insight
into the existing culture at the health facility (De Jager & Swanepoel, 2008). De Jager
and Swanepoel (2008) observed that job satisfaction among healthcare providers
affected quality of service and organisational commitment. Low job satisfaction
contributes to the shortage of healthcare workers (De Jager & Swanepoel, 2008). It is
a major cause for the high turnover in healthcare providers (De Nobile & Mc
Cormick, 2008). Increased organisational commitment by staff leads to increased job
satisfaction, increased job performance and lower staff turnover. Job satisfaction is an
attitude. It generally develops over a period of time, as the employee gathers more and
more information about the organisation. It is dynamic and it can increase or decrease
rapidly. It is something managers need to pay attention to on a daily, weekly, monthly
and annual basis (Gounaris, 2006).
According to Czaplewski, Furguson and Milliman (2001) the lack of commitment and
skills in frontline employees who interact with customers contributes to the gap
between customer expectations and perceptions. According to Kotler and Andreasen
(1996) to ensure service encounters are not tainted, management should be vigilant to
unresponsive actions by frontline employees and ensure employees do not place their
and the organisation’s needs above the needs of the customer. To manage service
encounters well, management should ensure frontline staff is conversant with the
organisation’s mission, goals, strategies and organisational processes. To instil pride,
management should instil the belief of a superior organisation amongst frontline staff.
Customers sense a lack of belief amongst frontline staff in an organisation, this sense
affects their perception of the organisation.
According to Harrison (2009:27) the differential in human resources between the
public and private sector will remain until a uniform national health system is in
place. It is argued that although the levels of provisioning between the public and
private sector indicate disparities in access between rich and poor, it is better to assess
provisioning against service norms for planning purposes. The provisioning in the
private sector is based on the number of registrations with the Health Professions
Council of SA and provisioning in the public sector is based on the number of posts
on PERSAL. The estimated number of uninsured population using private general
practitioners is often not accounted for when calculating service provisioning.
Provisioning strategies
Harrison (2009:27-28) points out that some public sector provisioning strategies have
emerged over the last fifteen years:
The adoption of occupation-specific dispensation created greater parity of
remuneration for health professionals compared to other professions.
Stellenbosch University https://scholar.sun.ac.za
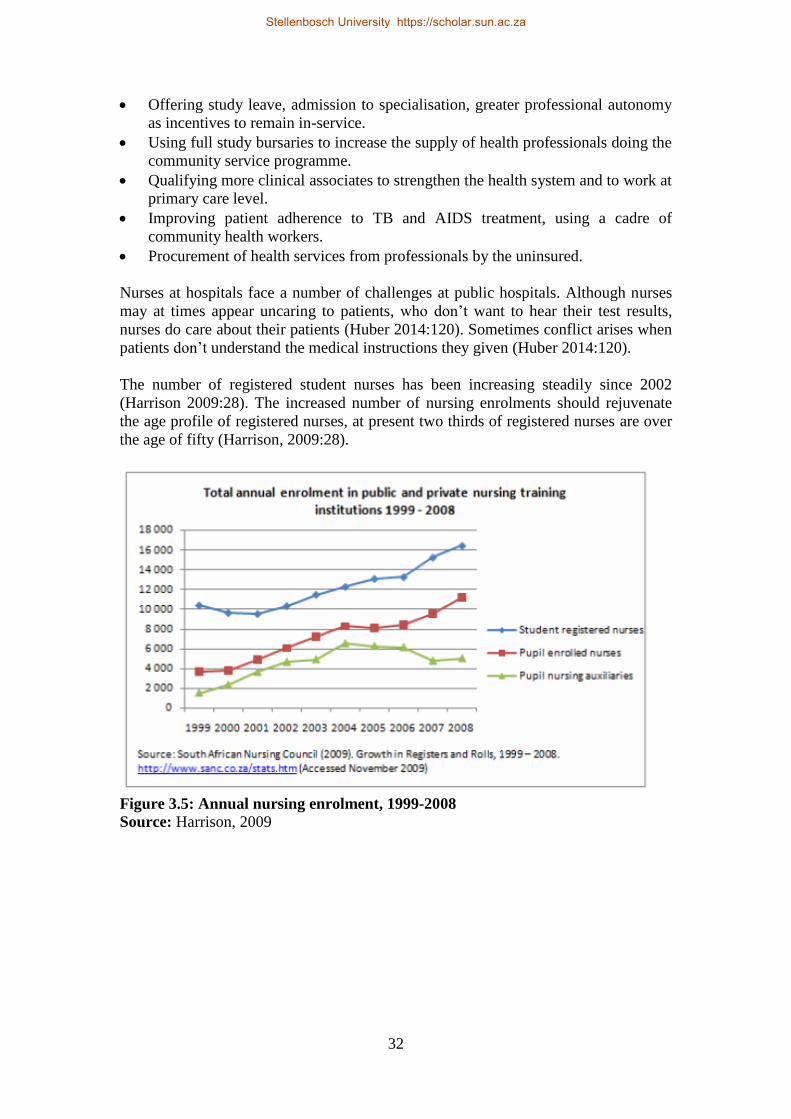
32
Offering study leave, admission to specialisation, greater professional autonomy
as incentives to remain in-service.
Using full study bursaries to increase the supply of health professionals doing the
community service programme.
Qualifying more clinical associates to strengthen the health system and to work at
primary care level.
Improving patient adherence to TB and AIDS treatment, using a cadre of
community health workers.
Procurement of health services from professionals by the uninsured.
Nurses at hospitals face a number of challenges at public hospitals. Although nurses
may at times appear uncaring to patients, who don’t want to hear their test results,
nurses do care about their patients (Huber 2014:120). Sometimes conflict arises when
patients don’t understand the medical instructions they given (Huber 2014:120).
The number of registered student nurses has been increasing steadily since 2002
(Harrison 2009:28). The increased number of nursing enrolments should rejuvenate
the age profile of registered nurses, at present two thirds of registered nurses are over
the age of fifty (Harrison, 2009:28).
Figure 3.5: Annual nursing enrolment, 1999-2008
Source: Harrison, 2009
Stellenbosch University https://scholar.sun.ac.za

33
Figure 3.6: Age distribution of nurses registered with SANC, 2009
Source: Harrison, 2009
3.7.4 Healthcare cost in SA
Patients are satisfied if they can access healthcare that is affordable. To enable access
to public health services, government must ensure these services are affordable to the
public. To meet the increasing demand for public health services, government should
invest in health resources, systems and infrastructure in a strategic manner. To deliver
on its public health strategy, the government needs to manage the economy diligently.
The link between the cost of a health service and the patient’s willingness to pay for
the service is termed ‘affordability’ (McLaughlin & Wysewianski, cited in Plaks &
Butler, 2012:130). Affordability is one of the ‘areas of congruence’ between the
patient and the healthcare provider (Penchansky & Thomas, cited in Plaks & Butler,
2012:130). Affordability is not a barrier preventing access to public healthcare (Plaks
& Butler, 2012:132). The cost of travelling to a public health facility is a factor of
affordability that limits access to healthcare (Plaks & Butler, 2012:133). In South
Africa, travelling costs pose a greater challenge to affordability than the cost of
treatment (Plaks & Butler, 2012:133).
The General Household Survey (GHS) data cited in Plaks & Butler (2012:149) also
suggests affordability does not act as a barrier to access healthcare for a large portion
of the population. This finding makes sense as pregnant women and children under
the age of six can access free healthcare in public facilities, and charges are means-
tested. Race has been used as a proxy for the ability to afford healthcare (Plaks &
Butler, 2012:149). The results shown in the table below, indicate that the percentage
of each race that has medical cover is skewed towards the white population, an
average of 65% of that group have medical aid coverage (Plaks & Butler, 2012:149).
The African or black population has the lowest proportion of medical aid coverage
(7.5%). Over all the groups, medical aid coverage was relatively constant in the
period 2002 – 2009. In the 2009 survey, 90.4% of the respondents that did not have
Stellenbosch University https://scholar.sun.ac.za

34
medical aid cover answered they could not afford the membership fees, of these
respondents 88.2% were African or black.
Domestic health expenditure compares well. It is estimated that public and private
expenditure exceeded R250 billion or about 8.6% of GDP in 2009-10. The level of
domestic health expenditure is comparable to spending by countries such as Brazil,
Spain, Italy and England (SAIRR, 2013).
Locally both the private and public sectors provide health services to the public.
Whereas, the public sector relies on funds from the state, the private sector relies on
funds from private investors seeking a return on investment, to provide health
services. The private sector competes with the public sector for patients and it draws
patients who have medical aid cover to its providers and facilities.
The value of private and public health expenditure was almost in equal proportion.
According to the Council of Medical Schemes, private health expenditure by eight
and half million people with medical aid cover, accounted for 52% of the total health
expenditure, public health expenditure by government on 80% of the population,
accounted for 48% of total health expenditure. Government spent R137.7 billion on
Health in that period (SAIRR, 2013). The table below shows total health expenditure
as a percentage of GDP.
Table 3.4: Total health expenditure as a proportion of GDP 1995-2011
Year %
1995 7%
1996 8%
1997 8%
1998 9%
1999 9%
2000 8%
2001 9%
2002 9%
2003 9%
2004 9%
2005 9%
2006 9%
2007 8%
2008 8%
2009 9%
2010 9%
2011 9%
Source: SAIRR, 2013
Table 3.5: Public and private health expenditure as a proportion of total health
expenditure 1995-2011
Year Public Private
1995 40% 60%
1996 36% 64%
1997 39% 61%
Stellenbosch University https://scholar.sun.ac.za

35
1998 39% 61%
1999 40% 60%
2000 41% 59%
2001 40% 60%
2002 40% 60%
2003 40% 60%
2004 37% 60%
2005 38% 62%
2006 40% 60%
2007 44% 56%
2008 46% 54%
2009 47% 53%
2010 47% 53%
2011 48% 52%
Source: SAIRR, 2013
Public hospital expenditure increased annually by 15% over the last five years from
R38.9 billion in 2007-08 to R73.1 billion in 2013-14. The increase is partially
attributable to the adoption of the Occupation Specific Dispensation (OSD) enforced
by National Health and to increased staffing in hospitals (SAHR, 2011:41). The
increased hospital expenditure is also partly attributable to changes in the number of
hospital admissions. Between 2007/08 and 2009/10, hospital admissions increased
from 3.5 million to 4 million (SAHR, 2011:41). The cost of daily patient care in
hospitals is increasing steadily. In 2009/10, the patient day equivalent (PDE) cost for
a district hospital was R1 349, a regional hospital was R1 665, and a tertiary/central
hospital was R3 207.
The National Treasury appropriates funding from the national purse to the three tiers
of government using legislation and regulations. Legislation and regulations aim to
enforce good administrative practice in government and to achieve better outcomes
for society. An economical, efficient and effective government should be able to
provide service delivery that meets the needs of the citizens (SAIRR, 2013).
The government showed its intention to change to heath-financing arrangements when
it released the Green Paper on NHI. The NHI will offer a predefined package of
services on a universal basis. In its proposal, government will implement NHI in
phases over a 14-year period. The following financing proposals were made:
Provide funding when piloting of the new system begins in 2012
Provide funding when pilot sites begin contracting with general practitioner and
pharmacy groups
Use funding to create the NHI Fund as a public entity
Allocate funds when the contracting mechanisms between the NHI Fund and
service providers come into operation
Secure funding using different tax mechanisms (payroll tax, VAT, personal
income tax).
In NHI the solidarity principle has the best chance of prevailing over market
principles. The principle of social solidarity means that healthcare should be financed
by individuals on the basis of their ability to pay, but should be available to all who
Stellenbosch University https://scholar.sun.ac.za

36
need it on roughly equal terms. It is therefore a form of shared responsibility (Amollo,
2009:15-16). Amollo (2009:16) argues that whereas the medical schemes turn
healthcare into a commodity, the NHI offers citizens protection against the vagaries of
demand and supply found in schemes. The NHI can be funded in two ways: general
taxation or compulsory health insurance (Amollo, 2009:16).
3.7.5 Access to healthcare in SA
According to the Constitution Act 108 of 1996 (Republic of South Africa, 1996:13),
“Everyone has the right to have access to healthcare services.” The Constitution
places the burden on the state to take reasonable legislative and other measures within
its available resources to achieve the progressive realisation of this right (Republic of
South Africa, 1996:13).
The post-1994 SA public health system has made recognisable gains by providing
greater access to significantly more people than before (Harrison, 2009:2). However,
he noted that these gains are being eroded by an increased burden of disease, weak
health systems management and low staff morale. In their study Plaks & Butler
(2012:146) identified general barriers to access healthcare. Their analysis of the
general barriers using the General Household Survey data of Statistics South Africa is
represented in the Figure 3.7 below. The figure below shows nearly half of the
respondents were unhappy about the time it took to consult with a healthcare provider
(Plaks & Butler 2012: 148).
Figure 3.7: Proportional patient problems at public health facilities, 2012
Source: SA Actuarial Journal, Vol:12, 2012
Access to healthcare can be defined in terms of areas of congruence between patient
and provider (Penchansky & Thomas, 1981:128). The five areas of congruence,
affordability, accessibility, accommodation, availability and acceptability require
providers to accommodate patient preferences to achieve patient satisfaction, hence
requires further discussion.
Stellenbosch University https://scholar.sun.ac.za
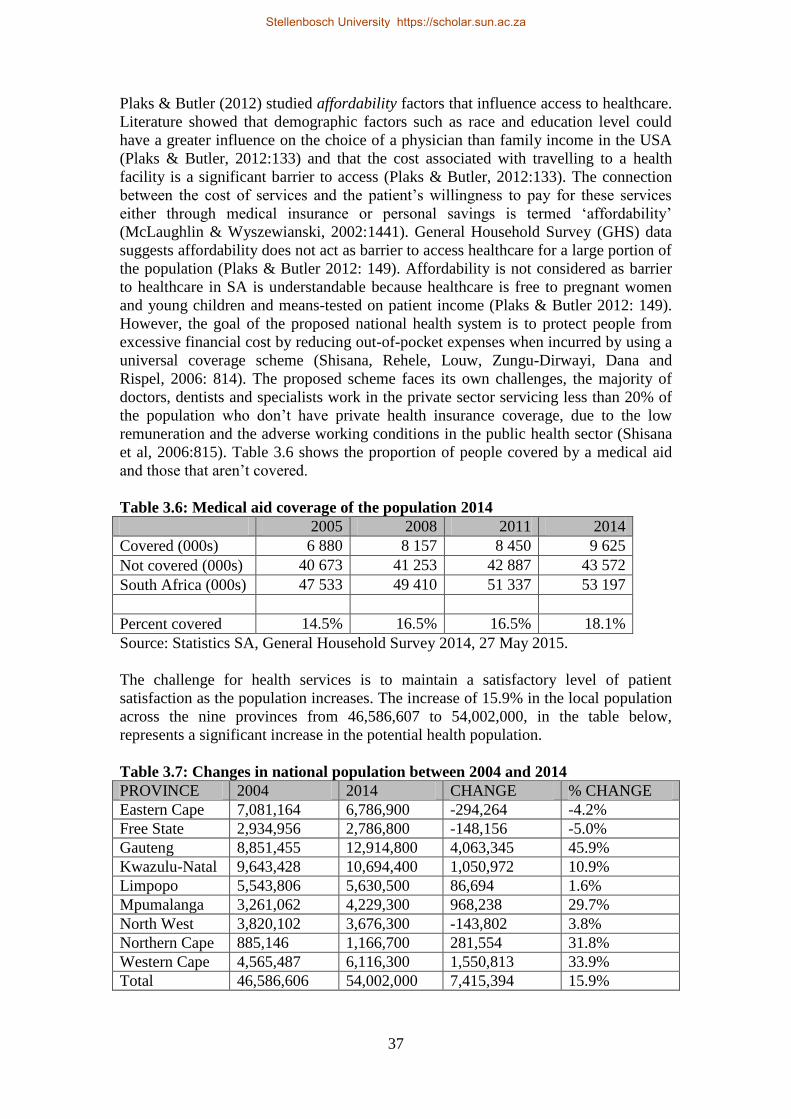
37
Plaks & Butler (2012) studied affordability factors that influence access to healthcare.
Literature showed that demographic factors such as race and education level could
have a greater influence on the choice of a physician than family income in the USA
(Plaks & Butler, 2012:133) and that the cost associated with travelling to a health
facility is a significant barrier to access (Plaks & Butler, 2012:133). The connection
between the cost of services and the patient’s willingness to pay for these services
either through medical insurance or personal savings is termed ‘affordability’
(McLaughlin & Wyszewianski, 2002:1441). General Household Survey (GHS) data
suggests affordability does not act as barrier to access healthcare for a large portion of
the population (Plaks & Butler 2012: 149). Affordability is not considered as barrier
to healthcare in SA is understandable because healthcare is free to pregnant women
and young children and means-tested on patient income (Plaks & Butler 2012: 149).
However, the goal of the proposed national health system is to protect people from
excessive financial cost by reducing out-of-pocket expenses when incurred by using a
universal coverage scheme (Shisana, Rehele, Louw, Zungu-Dirwayi, Dana and
Rispel, 2006: 814). The proposed scheme faces its own challenges, the majority of
doctors, dentists and specialists work in the private sector servicing less than 20% of
the population who don’t have private health insurance coverage, due to the low
remuneration and the adverse working conditions in the public health sector (Shisana
et al, 2006:815). Table 3.6 shows the proportion of people covered by a medical aid
and those that aren’t covered.
Table 3.6: Medical aid coverage of the population 2014
2005 2008 2011 2014
Covered (000s) 6 880 8 157 8 450 9 625
Not covered (000s) 40 673 41 253 42 887 43 572
South Africa (000s) 47 533 49 410 51 337 53 197
Percent covered 14.5% 16.5% 16.5% 18.1%
Source: Statistics SA, General Household Survey 2014, 27 May 2015.
The challenge for health services is to maintain a satisfactory level of patient
satisfaction as the population increases. The increase of 15.9% in the local population
across the nine provinces from 46,586,607 to 54,002,000, in the table below,
represents a significant increase in the potential health population.
Table 3.7: Changes in national population between 2004 and 2014
PROVINCE 2004 2014 CHANGE % CHANGE
Eastern Cape 7,081,164 6,786,900 -294,264 -4.2%
Free State 2,934,956 2,786,800 -148,156 -5.0%
Gauteng 8,851,455 12,914,800 4,063,345 45.9%
Kwazulu-Natal 9,643,428 10,694,400 1,050,972 10.9%
Limpopo 5,543,806 5,630,500 86,694 1.6%
Mpumalanga 3,261,062 4,229,300 968,238 29.7%
North West 3,820,102 3,676,300 -143,802 3.8%
Northern Cape 885,146 1,166,700 281,554 31.8%
Western Cape 4,565,487 6,116,300 1,550,813 33.9%
Total 46,586,606 54,002,000 7,415,394 15.9%
Stellenbosch University https://scholar.sun.ac.za

38
(Source: Statistics South Africa, mid-year population estimates, July 2009 & July
2014)
At a national level, the increase in local population has caused the demand for health
services to outstrip supply (NDoH). At district level, the estimated persons per clinic
of 13,718, exceeds the WHO norm of 10,000 people per clinic.
Geographic proximity has been shown to improve accessibility to specialist healthcare
in Israel for persons over 65 (Iecovich & Carmel, 2009) and result in a shorter travel
times to clinics which results in improved access in rural and semi-rural parts in the
USA ( Bice, Eichhorn & Fox, 1972). In South Africa it was also been found that the
distance travelled to a health facility for a patient has a significant effect on health
outcomes (Plaks & Butler 2012: 134). Overall, when patients travel of an hour or less,
the usage of those clinics are seldom affected, however travelling time of more than
an hour affects the usage of those clinics (Tanser, Gijsbertsen & Herbst, 2006).
Studies in the USA conclude that when accommodation becomes a barrier at the
primary healthcare level this can result in overcrowding at higher-level hospitals
(Guttman, Zimmerman & Nelson, 2003). Overcrowding at health facilities leads to
shortages in healthcare resources, such as radiology (Guttman et al, 2003). Research
in the USA and Europe conducted pointed to long waiting times for appointments to
see health providers, long waiting times in health facilities and inconvenient opening
times as the three most important accommodation problems (Guttman et al, 2003).
Although shorter appointment times result in shorter waiting times, studies in the
USA show that consultations shorter than 15 minutes lead to more patient
dissatisfaction, an increase in medical prescriptions, more malpractice claims, and a
greater number of referrals to specialists and higher-level hospitals (Dugdale, Epstein
& Pantilat, 1999). It has been suggested that telephone-based consultations may
reduce waiting times for chronic patients waiting to see their doctor (Dugdale et al,
1999). It was noted that telephone consultations are appropriate when a physical
examination is not required and when there is an existing relationship between the
physician and the patient (Berry, Seiders & Wilder, 2003). In South Africa most
patients are not content with the long waiting times to see doctors at public health
facilities (Plaks & Butler 2012: 153). This could be due to the demand for healthcare
being greater than the supply (Plaks & Butler 2012: 153). To address this problem, the
adoption of a flexible appointment system could spread the demand more evenly over
the working day and week.
In the USA, Penchansky & Thomas (1981) found a positive correlation between
patient satisfaction and availability and the number of years with the physician. The
supply of medical facilities and healthcare providers can be termed availability
(Penchansky & Thomas, 1981). It can further be defined as a measurement of the
degree to which the healthcare provider can meet the patient’s needs using available
resources, such as personnel and technology (McLaughlin & Wyszewianski, 2002:
1441). To measure the availability of healthcare services, traditional indicators such
as hospital beds and doctors per capita are often used (Gulliford, Figueroa-Munoz,
Morgan, Hughes, Gibson, Beech & Hudson, 2002).
Acceptability describes whether the patient is satisfied with certain features of the
healthcare provider (McLaughlin & Wyszewianski, 2002). Such features include the
Stellenbosch University https://scholar.sun.ac.za

39
provider’s race, culture, age and gender (Penchansky & Thomas, 1981). It also
describes whether the provider is comfortable with such characteristics of the patient
(Penchansky & Thomas, 1981). Lurie & Dubowitz (2007) view language as part of
acceptability, the patient should be able to communicate with the provider in his or
her own tongue and vice versa. Acceptability is also the decision by a patient to visit a
particular medical practitioner or hospital having taken social, political and economic
dimensions into account (Pol & Thomas, 2001).
3.8 HEALTH SERVICES IN THE WESTERN CAPE
3.8.1 Introduction
The decision to use the Western Cape as the context for the study was based on a
number of factors, including the increased health expenditure and population. The
province has the second highest health expenditure in the country. According to the
SAIRR (2013:216), education and health expenditure accounts for 73% of total
provincial expenditure. The Western Cape spent R14.59 billion, 36.5% of total of
total expenditure, on healthcare in 2012/13, the second highest by only .1% from
Gauteng 36.6%.
3.8.2 Health governance in the WC
The Western Cape Department of Health has a two prong approach to health
governance. Financial governance is the measures put in place to control spending
and clinical governance are the measures taken to provide assurance for the quality of
care.
The strategic objective for programme 1 (Administration) is to promote sound
financial governance to ensure the under/over spending of the annual equitable share
is within one per cent of the budget allocation (Western Cape Government Health,
2012:72).
Western Cape appointed family physicians to revitalise primary health care and to
take responsibility for clinical governance in the DHS (Western Cape Government
Health, 2012:24).
The Code of Conduct promotes ethical and acceptable behaviour by public servants
(Western Cape Government Health, 2013:283). During compulsory training, the
employees were trained in standards of acceptable and unacceptable behaviour as
described in the Public Sector Code of Conduct in 2012. It is the goal of the
Directorate: Labour Relations to distribute the code of conduct pocketbook at all
employees.
3.8.3 Health programme in the WC
The management of the department is highly decentralised. The high level of
decentralisation has the benefit of increased responsiveness to institutional needs but
adhering to prescripts is a challenge to decentralisation (Western Cape Government
Health, 2011:60). The core function and responsibility of the Western Cape
Department of Health is to deliver a comprehensive package of health service to the
people of the province (Western Cape Government Health, 2011:9).
Stellenbosch University https://scholar.sun.ac.za

40
The administrative functions of the department are structured into the following
budget programmes: (Western Cape Government Health, 2013:55).
1. Programme 1: Administration
2. Programme 2: District Health Services
3. Programme 3: Emergency Medical Services
4. Programme 4: Provincial Hospital Services
5. Programme 5: Central Hospital Services
6. Programme 6: Health Sciences and Training
7. Programme 7: Health Support Services
8. Programme 8: Health Facilities management
The administrative functions of the department provide strategic leadership, including
overall departmental strategy development, monitoring and evaluation and
organisational administration and governance using allocated resources (Western
Cape Government Health, 2011:57). One of the goals of the administrative program is
to provide the department with sufficient staff with the appropriate skills within each
occupational group (Western Cape Government Health, 2011:57).
3.8.4 Health strategy in the WC
The strategic goal statement “Improve the quality of health services and the patient
experience.”
It is the responsibility of the Western Cape Health Department to administer public
health services in the province. To be able to execute its mandate the department
created the vision a “quality health for all”. It linked the lengthy mission “we
undertake to provide equitable access to quality health services in partnership with the
relevant stakeholders within a balanced and well managed health system to the people
of the Western Cape and beyond” to this vision. The strategic framework Healthcare
2030 provides direction to health administration in the province for the next two
decades. The framework approved by the provincial cabinet in 2012/13 is a flexible
planning tool, matching service delivery targets to local community needs (Western
Cape Government Health, 2013:18).
The department uses a transversal approach to tackle health issues (Western Cape
Government Health, 2013:18). In the South African context a transversal approach
means a government department engages in inter-departmental cooperation with
another government department to achieve service delivery. The aim of this approach
is to achieve exemplary regional government (Western Cape Government Health,
2013:18).
Six focus areas are linked to the strategic objective “Increasing Wellness”. The six
focus areas are HIV/TB; healthy lifestyles; Injuries; mental health; women’s health
and children’s health (Western Cape Government Health, 2013:22). The department
linked strategic goals to their efforts. Improving the quality of health services and the
patient experience is a priority of both WCG: Health and NDoH (Western Cape
Government Health, 2013:46). The department developed and piloted a new incident
monitoring and response tool to address the challenge of infection control, which
impacts on the quality of care (Western Cape Government Health, 2013:51). The
department developed several strategies to improve the patient experience across all
areas of service. Patient-centric interventions were incorporated into reception areas,
Stellenbosch University https://scholar.sun.ac.za

41
clinical governance and plans for continuity of care using the involvement of family
and friends to aid patient recovery (Western Cape Government Health, 2013:52).
The department’s strategic objective is “increasing wellness” (Western Cape
Government Health, 2013:18). Like most other provinces, the strategic approach of
WC seeks to promote inter-departmental co-operation to achieve positive health
outcomes. WC attributed movement in the health indicators for life expectancy at
birth, TB cure rate and HIV mother to child transmission rate to adopting a strategic
focus.
Patient-centred care plays a role in the Western Cape Department of Health’s values-
driven vision and is a principle in the Healthcare 2030 strategic framework (Western
Cape Government Health, 2013:18).
The 2014/15 strategic objectives of the WCDoH for district hospital services
(Western Cape Government Health, 2013:77) are:
Achieve a 92% client satisfaction rate.
Achieve a district hospital expenditure of R1405 PDE.
Establish 2705 acute district hospital beds.
To provide focused health services, the district hospital service is in a separate
program. To demonstrate a commitment to quality of care, the objective of
programme 2 is to achieve a 70% client satisfaction rate by 2014/15. To cater for the
wide spectrum of patient needs, tiered levels of health services are offered to the
population at district-level. To achieve better coordination of services the district
health service is structured into a rural and metro component. To ensure well-
resourced management, each component has four district managers based at district
offices reporting to a chief director. To ensure adequate staffing, ninety-seven per cent
of the posts in the district hospital service were filled in the year.
The department developed Healthcare 2030 to plot a direction for healthcare in the
province until 2030. The planning timeframe is aligned to the national planning time
frame. The framework includes planning tools consisting of five domains:
Reception services
Clinical governance
Continuity of care
Community participation
Staff wellness.
The principles of Healthcare 2030 (Western Cape Government Health, 2013:44) are:
Patient-centred quality of care. To treat patients with respect and dignity within a
clean and safe environment.
Outcomes-based approach. To meet targets that achieve the millennium
development goals will be a priority.
Primary Healthcare philosophy. To provide a comprehensive service at
community level.
District Health Services model.
Equity.
Efficiency.
Stellenbosch University https://scholar.sun.ac.za

42
Strategic partnerships.
3.8.5 Health standards in the WC
The Western Cape Department of Health made great strides by ensuring the quality of
public healthcare in the province meets national standards. The results of the
compliance (six ministerial priority areas) findings (Department of Health. Fast track,
2011) are illustrated in Figure 3.8 below.
Figure 3.8: Western Cape: Compliance score on vital measures for the six
ministerial priority areas, 2011
3.8.6 Health facilities in the WC
The purpose of Programme 8: Health Facilities Management of WCDoH is to
construct new facilities and upgrade and maintain existing facilities. The strategic
objectives of the programme (Western Cape Government Health, 2011:216-7) show a
great many projects across all types of hospitals and facilities.
They are as follows:
Allocate sufficient funding to reduce the infrastructure backlog in the MTEF
period.
Complete the 10 PHC projects as planned by 2014/15.
Complete 9 ambulance station projects by 2014/15.
Complete the 14 district hospital projects by 2014/15.
Complete the 9 provincial hospital projects by 2014/15,
Complete the 8 central hospital projects by 2014/15.
Complete the 6 forensic mortuary and other projects by 2014/15.
The WCDoH reported in its Annual Report 10.5% of the Revitalisation Grant was not
spent mainly due to poor contractor performance in 2012/13 which is of great concern
(Western Cape Government Health, 2013:224).
Stellenbosch University https://scholar.sun.ac.za

43
3.8.7 Performance information in the WC
The Western Cape Department of Health reported the following patient satisfaction
results for hospitals under its three hospital programmes (District, Provincial and
Central) in 2013/14.
Table 3.8: WC patient satisfaction rates 2013/14
Programme Hospitals Planned target Actual Deviation
District District Level Hospitals 86.0% 90.0% 4.7%
Provincial Regional Level Hospitals 80.0% 89.2% 11.5%
Provincial TB Hospitals 85.6% 89.6% 4.7%
Provincial Psychiatric Hospitals 85.0% 84.5% (0.6%)
Provincial Rehabilitation Hospitals 92.8% 93.1% 0.3%
Central Central Level Hospitals 90.0% 89.3% (0.8%)
Central Groote Schuur Hospital 90.0% 88.2% (2.0%)
Central Tygerberg Hospital 90.0% 92.6% 2.9%
Central Red Cross WMC Hospital 90.0% 93.1% 3.5%
(Source: WCGH Annual Report 2013/14)
3.8.8 The health workforce in the WC
The department recognises that the shared vision and values of its competent, well-
trained and caring staff achieves superior patient experiences (Western Cape
Government Health, 2013:291). It is the responsibility of the capacitated and values-
driven workforce of the Department, to manage the burden of disease and ensure
quality of care and improve the patient experience (WCGH 2013/14:56). A gap
analysis was conducted by the Department to determine changes in the environment
that could impact the workforce (WCGH 2013/14:56).
The department strengthened its human resources, by increasing the headcount by
3.8% in 2012 and by 2.2% in 2013.
Table 3.9: Extract of number of public health personnel by category, 2011-3
Categories March 2013 March 2012 March 2011
Medical officers 1 956 1 899 1 881
Medical specialists 619 606 570
Dentists 87 70 66
Professional nurses 5 803 5 720 5 479
Total 30 502 29 842 28 723
Source: Western Cape Government Health Annual Reports
The shortage of professional nurses, mostly those with post basic qualifications in
intensive care, paediatrics, midwifery impacted on the Departments capacity to
provide specialised services (Western Cape Government Health, 2014:36). To deliver
these services, the Department incurred additional agency staff expenditure (Western
Cape Government Health, 2014:36). The insufficient number of nurses countered
efforts to reduce theatre waiting lists for certain procedures (Western Cape
Government Health, 2014:36). To improve the skills of key staff, the Department
provided training programmes (Western Cape Government Health, 2014:36).
Stellenbosch University https://scholar.sun.ac.za

44
The number of professional nurses on the payroll has increased by a small per cent in
the last three years, 1.45% in 2013 and 3.01% in 2014. The average annual cost per
post dropped by 5.6% in 2014. See the Table 3.10 below.
Table 3.10: WC professional nurse positions 2011-14
Financial Year Number employed Vacancy rate Average annual cost
2013/14 5978 4.5% 319 805
2012/13 5803 3.7% 338 877
2011/12 5720 4.6% 313 753
(Source: Western Cape Government Health Annual Reports 2013/14, 2012/13,
2011/12)
The Department has implemented a number of strategies to impact the recruitment
and retention of scarce skills (Western Cape Government Health, 2014:254). The
implementation of Occupational Specific Dispensations (OSDs) is a strategy aimed at
offering higher salaries to the workforce; however, it has its challenges (Western
Cape Government Health, 2013:299). The Department has found that the salary
structure on the OSD of certain professional occupational categories is not
competitive enough compared to the private sector, this limits the recruitment and
retention of staff (Western Cape Government Health, 2014:63). The personnel
expenditure over the 3 years 2010 – 2013 (Table 3.11 below) shows the department is
spending an increasing amount of its budget on its increasing workforce.
Table 3.11: WC personnel expenditure analysis 2010-13
2010/11 2011/12 2012/13
Total expenditure (TE)
(R’000) 12 344 628 13 387 763 14 600 857
Personnel expenditure (PE)
(R’000) 6 808 175 7 665 447 8 436 689
PE as % of TE 55% 57% 58%
Average PE per employee
(R’000) 241 263 280
Number of employees 28 261 29 158 30 172
(Source: Western Cape Government Health Annual Reports 2012/13, 2011/12,
2010/11)
3.8.9 Health funding in the WC
Budgets are allocated to achieve expected outcomes and optimal service at an
appropriate cost per patient (Western Cape Government Health, 2014:63). The budget
management instrument (BMI) and the approved post list (APL) are tools used to gain
financial efficiency and effectiveness (Western Cape Government Health, 2014:74).
The District Health Expenditure Review (DHER) tool is used to monitor equity of a
district and sub-district level (Western Cape Government Health, 2014:74). Table
3.12 below shows district health services programme receives the largest portion of
the budget.
Stellenbosch University https://scholar.sun.ac.za

45
Table 3.12: WC actual expenditure by programme 2012/13 2011/12 2010/11
R’000 % R’000 % R’000 %
Administration 445 048 3% 410 028 3% 321 481 3%
District health services 5 509 868 38% 4 875 956 36% 4 367 380 35%
Emergency health services 675 514 5% 637 208 5% 596 110 5%
Provincial hospital services 2 299 618 16% 2 149 535 16% 2 935 241 24%
Central hospital services 4 427 459 29% 4 011 137 30% 2 681 739 22%
Health sciences & training 276 551 2% 231 451 2% 241 374 2%
Healthcare support services 324 720 2% 272 962 2% 282 869 2%
Health facility management 822 079 6% 799 486 6% 918 434 7%
14 600 857 100% 13 387 763 100% 12 344 628 100%
Source: Annual Report: 2012/13:357; 2011/12:211; 2010/11:247-8
Table 3.13 below shows that employee compensation is the largest expenditure item
in the budget.
Table 3.13: WC actual expenditure by economic classification 2010-13 2012/13 2011/12 2010/11
R’000 % R’000 % R’000 %
Compensation: Employees 8 436 689 58% 7 665 447 57% 6 808 175 56%
Goods & services 4 499 855 31% 4 132 882 31% 3 826 487 31%
Interest (financial leases) - 0% 19 0% 16 0%
Financial transactions 4 670 0% 3 524 0% 12 046 0%
Transfers: Municipalities 322 613 2% 302 280 2% 263 107 2%
Transfers: Agencies 3 655 0% 15 651 0% 55 341 0%
Transfers: Ed. institutions 1 194 0% 6 025 0% 1 400 0%
Transfers: Non-profits 348 080 2% 313 931 3% 281 488 2%
Transfers: Households 108 440 1% 106 714 1% 118 599 1%
Gifts & donations - 0% 9 853 0% 4 624 0%
Buildings 522 567 4% 551 486 4% 740 528 6%
Machinery & equip. 352 054 2% 279 790 2% 232 674 2%
Software & intangibles 1 040 0% 161 0% 143 0%
14 600 857 100% 13 387 763 100% 12 344 628 100%
Source: Annual Report: 2012/13:357; 2011/12:211; 2010/11:247-8
3.8.10 Access to healthcare in WC
As stated earlier in this study, access to healthcare can be defined as the area of
congruence between patient and provider (Penchansky & Thomas, 1981:128). Of the
five areas of congruence, the WCDoH has shown great progress with accessibility.
The department has acknowledged that long waiting times limit the public’s access to
health facilities.
The WCDoH completed a service delivery improvement plan. The plan was in
response to areas of identified in the 2013 to 2016 SDIP (Western Cape Government
Health, 2014:38). A mock audit by the OHSC found that no standardised process had
been developed to measure waiting times at Khayelitsha District Hospital, as
expected. In response, the department has added this finding to the service delivery
improvement plan mentioned earlier in this paragraph (Western Cape Government
Health, 2014:39).
Stellenbosch University https://scholar.sun.ac.za
46
3.9 CONCLUSION
The following conclusions were reached about the delivery of health services in the
country and the Western Cape from a quality perspective.
a. National government adopted a governance and leadership framework to
oversee the provisioning of healthcare.
b. The government had passed amendment Acts and drafted new policies to
broaden access to healthcare. It has begun to lay the foundation for universal
health insurance for all.
c. The provincial health departments, in particular the Western Cape have
demonstrated their commitment to patient satisfaction using annual surveys and
achieving good satisfaction rates.
d. The government is allocating significant funds to build and upgrade health
infrastructure.
e. The government has not been able to cap or reduce the cost of public health
services.
These conclusions will provide the context for the empirical study that follows in the
next chapter.
Stellenbosch University https://scholar.sun.ac.za

47
CHAPTER 4 – MEASURING HEALTH SERVICES IN THE
WESTERN CAPE: A PERCEPTION-BASED ANALYSIS
4.1 INTRODUCTION
In this chapter, the research methodology, including the purpose of the study, the
sample framework, the measuring instrument for this study will be discussed.
The purpose of the structured questionnaire was to obtain primary data from a sample
of respondents at district hospitals. The study is set in the Western Cape, South
Africa. It is estimated that around 80% of the population of 5.7 million people depend
on public health services. The people have relatively good access to basic amenities; a
little more than 90% of households are electrified. A pilot study confirmed variables
of the theoretical construct measured in the main study are valid. A sample of 6 was
drawn from the list of 34 district hospitals to achieve a representative sample of
respondents. The application to access the sample of district hospitals lodged with
Western Cape Department of Health which approved 3 of the sites. The data
generated by the study was analysed using a statistical program. The statistical
measures used to test the association of the survey items to the dimensions of service
quality is discussed in the chapter.
4.2 STUDY DESIGN
The study adopted a quantitative approach using a cross-sectional descriptive design,
where the data was collected in the form of researcher-administered questionnaires. A
quantitative approach is best suited to measure the causality between the service
quality variables tangibility, reliability, responsiveness, assurance and empathy. These
measurements enable the extent of causality to be established and the measurements
enable the results of this study to be compared to studies of other researchers.
District hospitals in the Western Cape within a 200 km radius of Cape Town were
targeted.
4.3 STUDY SITES
The study was set in the Western Cape, which has six health districts: Cape
Metropole, West Coast, Cape Winelands, Overberg, Eden and Central Karoo. The
Cape Metropole, which represents the City of Cape Town, is further split into four
substructures and each substructure is split into two sub-districts.
The study was conducted in three of the six health districts (Cape Metrople, Cape
Winelands and Overberg) at three of the 34 district hospitals (Victoria, Stellenbosch
and Hermanus).
4.4 STUDY POPULATION
The target population was research subjects over the age of 18 admitted to a district
hospital within a 200 km radius from Cape Town in the Western Cape.
In 2011, the population of the Western Cape was estimated at 5 755 607. It was also
estimated that 83% of the provincial population were dependent on public health
services at that time. The Western Cape offers its residents good access to basic
Stellenbosch University https://scholar.sun.ac.za

48
amenities such as piped water, sanitation and electricity, where around 94% of
households are electrified, this access is a benefit to public health.
4.5 SAMPLE AND PROCEDURE
The unit of analysis (Welman, Kruger & Mitchell, 2005:52) is in-patients admitted to
a district hospital in the Western Cape. In-patients admitted to all the district hospitals
in the Western Cape are the units of analysis of the population of the study (Welman
et al, 2005:52). This collection of units of analysis (population) represents the full set
of cases from which the sample was taken (Welman et al, 2005:53). The conclusions
drawn in the study will be based on this population (Welman et al, 2005:52). The size
of the population makes it highly impractical to select all in-patients as subjects. For
that reason, the data obtained from a sample (Welman et al, 2005:55) of this target
population was analysed and discussed in the study.
To determine whether the variables could measure the theoretical construct (Welman
et al, 2005:115), a pilot study was conducted (Welman et al, 2005:148). However, the
pilot study was inconclusive whether the defined variables measured the construct
adequately.
Patients for the pilot study and the main study were selected using a convenience
sample (Welman et al, 2005:69) – respondents that were available at the time of the
study. A convenience sample is a non-probability research method where the
probability that a member of the population will be included in the sample cannot be
specified (Welman et al, 2005:56). The convenience sampling method is highly prone
to sampling error – the lack of fit between the characteristics of the sample and the
characteristics of the population (Welman et al, 2005:74).
Population
Population size is a factor when working with a relatively small and known group of
people. The population of in-patients at the three hospitals was 273, excluding
outpatients and the children’s wards.
Confidence interval
The confidence interval also called the margin of error is the plus or minus figure
added to the sample figure to determine the range of confidence.
Confidence level
The confidence level is expressed as a percentage. It is how often the true percentage
of the population who would choose an answer that lies within the confidence
interval. The 95% confidence level means the answer is 95% certain.
Percentage
The accuracy depends on the percentage of the sample that picks a particular answer.
When determining the sample size for a given level of accuracy the worst-case
scenario is chosen, in this case 50%.
Calculation of the sample size
a. The Survey System software was used to calculate the sample size.
b. Obtained the names of district hospitals listed in Table 1.
c. Confirmed the three district hospitals selected (Tables 2 – 4) appear on Table 1.
Stellenbosch University https://scholar.sun.ac.za

49
d. Calculated the total target number of respondents (273) based on the maximum
occupancy, excluding children under 18.
e. Set the confidence level at 95% and the confidence interval at 10.12 due to the
small population. The percentage used is standard at 50%.
f. Computed a sample size of 71 based on aforementioned population, confidence
interval, and confidence level.
Table 4.1: Western Cape district hospitals 2015
Name
1 Beaufort West Hospital
2 Booth Memorial Hospital
3 Caledon Hospital
4 Ceres Hospital
5 Citrusdal Hospital
6 Eerste River Hospital
7 False Bay Hospital
8 GF Jooste Hospital
9 Helderberg Hospital
10 Hermanus Hospital
11 Karl Bremer Hospital
12 Khayelitsha Hospital
13 Knysna Hospital
14 Ladismith Hospital
15 Laingsburg Hospital
16 Lapa Munnik Hospital
17 Mitchells Plain Hospital
18 Montagu Hospital
19 Mossel Bay Hospital
20 Murraysburg Hospital
21 Otto Du Plessis Hospital
22 Oudtshoorn Hospital
23 Prince Albert Hospital
24 Radie Kotze Hospital
25 Riversdale Hospital
26 Robertson Hospital
27 Stellenbosch Hospital
28 Swartland Hospital
29 Swellendam Hospital
30 Uniondale Hospital
31 Vredenburg Hospital
32 Vredendal Hospital
33 Victoria Hospital
34 Wesfleur Hospital
Source: Western Cape Government Health, 2014.
Stellenbosch University https://scholar.sun.ac.za

50
The researcher visited wards at the following hospitals.
Table 4.2: Wards at Hermanus Hospital 2015
Ward Beds Patients
Female medical ward 15 15
Male medical ward 15 14
Maternity ward 25 25
Children’s ward 12 12
Outpatients & Emergency 4 4
71 70
Source: Hermanus Hospital, 2015
Table 4.3: Wards at Stellenbosch Hospital 2015
Ward Beds Patients
Mixed general ward (A) 13 13
Mixed general ward (B) 19 15
Male general ward (C) 19 19
Maternity ward 16 3
Children’s ward 18 4
85 54
Source: Stellenbosch Hospital, 2015
Table 4.4: Wards at Victoria Hospital 2015
Ward Beds Patients
Male medical ward 35 35
Female medical ward 32 30
Male surgical ward 35 35
Female surgical ward 32 19
Mixed general ward 19 19
Children’s ward 25 20
High Care ward 3 3
181 161
Source: Victoria Hospital, 2015
The population estimates for the Western Cape are shown in Table 4.5 below. The
actual demographic profile was compared to the profile below.
Table 4.5: Population estimates of the Western Cape, 2014
Number Percentage
Gender:
Male 3 011 016 49.3%
Female 3 105 308 50.7%
Total 6 116 324 100.0%
Age:
20 – 34 years 1 533 239 38.6%
35 – 44 years 867 118 21.8%
Stellenbosch University https://scholar.sun.ac.za

51
45 – 54 years 719 839 18.1%
55 – 64 years 475 768 12.0%
65 years and older 377 877 9.5%
Total 3 973 841 100.0%
(Statistics South Africa, Mid-year population estimates 2014)
To examine whether or not the sample was representative of typical in-patients, the
profile of the respondents was compared to descriptions provided by the WCDoH.
Overall, the profile in the study was a good match with the typical in-patient in the
Western Cape.
4.6 MEASUREMENT
The measuring instrument (questionnaire) used in the study is based on the
SERVQUAL instrument, developed by Zeithaml et al (1990). The instrument
measures the gap between the quality of the service a customer expects and the
customer’s perception of the quality of the service delivered. Zeithaml et al (1990)
named the gap between service expectation and perception – service quality. In the
health sector, service quality has been labelled as patient satisfaction (De Souza,
Luna, De-Souza Junior & Szwarcwald, 2005).
To create effective surveys the following were considered important by Morrel-
Samuels (2002):
a. Ask questions related the behaviour, activities or tangibles that have been
observed, not thoughts or motives.
b. A third of the questions asked should have a negative response.
c. Questions that require ranking should be avoided.
d. Ensure the questionnaire can be completed in 20 minutes.
4.7 DATA COLLECTION METHOD
A questionnaire was used as the measuring instrument for the study. It has five
biographical items and 50 response items measured on a five point Lickert scale (-2 =
strongly disagree, -1 = disagree, 0 = unsure, 1 = agree, 2 = strongly agree). The
response items assess the five dimensions of service quality:
a. Tangibles
b. Reliability
c. Responsiveness
d. Assurance
e. Empathy
The item wording for the variables in first category dealing with patient expectations
was pre-fixed “At an excellent hospital…?. The item wording in the second category
dealing with patient perceptions was prefixed “At this hospital…” When responding
to a question (variable), the patient chose one of the five options on offer: -2 =
strongly disagree, -1 = disagree, 0 = unsure, 1 = agree, 2 = strongly agree. The
questions were whether: the hospital was well-maintained; the wards were neat and
tidy; the medical equipment worked; the nurses’ uniforms were neat and tidy; the care
received was more than expected; the toilets and basins worked regularly; the doctor
did rounds regularly; medications was given at the correct times; the nursing staff
Stellenbosch University https://scholar.sun.ac.za

52
checked patients’ condition regularly; administration was able to draw medical
records, admit a patient and inform the patient on payment due, without delay; the
provincial health department allocated sufficient resources to the hospital; it was well
managed; the nursing staff were courteous and well trained; the staff respected the
patients’ privacy; the doctor was polite to the patients, and the nursing staff appeared
too busy to assist, gave personal attention and listened to the medical problems of
patients.
The initial questionnaire was pre-tested on three patients at the Stellenbosch district
hospital in the town of Stellenbosch in August 2015. The patients were selected on a
convenience basis described by Cooper and Schindler (2006). It was found that the
home language of two of the subjects was Afrikaans. The subjects struggled to
understand the questions posed in English. When the researcher rephrased the
questions and explained their meaning in Afrikaans, the subjects were able to respond.
As the pilot progressed, it became apparent that the items in the questionnaire were
not answering the research questions. The researcher raised this issue with the
Supervisor. After consideration, the researcher was allowed to rephrase the questions
and develop an Afrikaans version of the questionnaire.
The following procedures were used to collect and capture the data:
Respondents were selected for interviews on a convenience basis at each hospital.
The researcher administered the instrument in face to face interviews at the
patient’s bedside.
The researcher introduced the survey to each respondent, explained the nature and
the purpose of the research, and captured the biographical details of the
respondent on the form.
Each respondent completed a separate informed consent form and signed it.
The researcher posed the questions to the respondent and captured their responses
on the questionnaire.
After surveying the respondents, the researcher coded the questionnaire data on a
MS Excel datasheet.
The data analyst at the University copied the data into the statistical program for
analysis and generated the statistical reports.
4.8 STATISICAL ANALYSIS
The Centre for Statistical Consultation Unit at Stellenbosch University performed the
statistical analysis for the researcher. The researcher coded the data from the
questionnaires on a Microsoft Excel 2011 worksheet. The Unit used the statistical
program Statistica version 10.1 to analyse the data on the worksheet.
4.8.1 Exploratory data analysis
The first stage of the analysis was a descriptive analysis of the extent of service
quality based a set of variables that expressed the patient’s extent of expectation and
perception according to a five point scale. The mean and standard deviations were
calculated for each of the variables. The demographic variables included six age
groups (18-35; 36-45; 46-55; 56-65; 66 and older)”, two gender groups (male and
female), two medical coverage groups (insured and uninsured) and five educational
groups (some primary; some high school, matriculation; diploma and degree). In
addition, the mean, median and mode of each variable were calculated. The expected
Stellenbosch University https://scholar.sun.ac.za

53
score and the perceived score was calculated for each item and dimension. Gap 5 was
calculated for each item and dimension and the results were tabulated.
The following gap scores by hospital were charted and discussed:
a. Comparative gap score by hospital.
b. Tangibility gap score by hospital
c. Reliability gap score by hospital
d. Responsiveness gap score by hospital
e. Assurance gap score by hospital
f. Empathy gap score by hospital
4.8.2 Factor analysis
Nomological validity is the validity of a construct. The degree to which a construct is
valid is determined by the extent to which empirical and theoretical measures of the
construct agree. Discriminant validity is the degree to which constructs that
theoretically should not be related, are unrelated. When using a factor analysis to test
the discriminant validity of constructs, each construct in a factor analysis should load
against a different factor.
A factor analysis was performed in this study to account for associations between the
variables and to better understand any relationships between them. The factors that
are the product of the analysis are represented by eigen values. The sum of all the
eigen values is equal to the total number of variables in the factor. Proportion
indicates the relative weight of each factor in the total variance.
A factor loading was performed to determine the weights and associations between
each variable and the factor and to determine uniqueness. Uniqueness is the variance
that is unique to each variable and not shared with other variables in the overall factor
model. The more unique a variable is the lower its relevance in the overall factor
model will be. The higher the load of a factor, the better defined its dimensionality.
The Kaiser criterion suggests that factors with eigen values equal to one and greater
are retained.
After the factor loading, a varimax rotation (rotated factor loading) of the retained
factors was performed. The rotation produced orthogonal factors (factors not related
to each other) with new values. These factors still explain the same total variance
observed before rotation. The pattern matrix of the variables offers a clearer view of
the relevance of each variable.
4.8.3 Boxplots
A boxplot graph is useful to display the location, spread and location of variables. The
median, quartiles and interquartile range, and outliers are shown in the graph. The box
extends from the lower quartile to the upper quartile showing the mid-50% of the
observations. The median is a thick line in the middle of the box. The whiskers extend
to the largest and smallest observations, indicating the range of the data. The boxplots
for the five dimensions allow for interpretation of the data.
Stellenbosch University https://scholar.sun.ac.za

54
4.8 ETHICAL CONSIDERATIONS
The researcher submitted the research proposal to the Departmental Ethics Screening
Committee (DESC) of the School of Public Leadership at Stellenbosch University for
approval. The DESC approved the proposal and submitted the following to the
Research Ethics Committee: Humanities (REC) for approval on 17 November 2014:
Informed consent form
DESC application
Research proposal
Western Cape Department of Health request to perform research application
Research questionnaire
The REC approved research proposal number DESC/Whitford/Nov2014/15, titled
Health Service Delivery in the Western Cape: A measurement of perceptions
(ADDENDUM 5), the approval period: 13 Nov 2014 – 12 Nov 2015. The REC
attached the Investigator responsibilities to protect human research participants
(ADDENDUM 6) to state the strict conditions under which the study is allowed. After
submitting further information and updates, the researcher obtained REC approval to
conduct the study on 1 December 2014.
The researcher submitted the following to the Western Cape Government: Health
Impact Assessment Directorate and requested approval to conduct the study on 2
November 2014:
Annexure 2: Proposal Summary
Research proposal
Stellenbosch University: REC approval
Informed consent form
In the Proposal Summary, the researcher requested access to the following hospitals:
Caledon Hospital
Hermanus Hospital
Montagu Hospital
Robertson Hospital
Stellenbosch Hospital
Victoria Hospital
The WCDoH considered the research application and granted access to four of the six
hospitals (Hermanus, Montagu, Robertson and Victoria) on 17 March 2015
(ADDENDUM 7) and granted access to Stellenbosch on 3 August 2015
(ADDENDUM 8). Access to Caledon was declined. The access to the hospitals is
conditional. The researcher has to provide the department with an electronic copy of
the final research report within six months of completion of the research. The
department approved the study under research number: 2014RP141.
The researcher contacted the Coordinators at the District Offices to confirm access to
the facilities. The researcher was informed that the hospitals at Robertson and
Montagu had declined access to their facilities on 27 July 2015. The CEO of Victoria
Hospital granted provisional access to the health facility on 13 August 2015, and later
confirmed. The Medical Manager of Stellenbosch Hospital granted access on
Stellenbosch University https://scholar.sun.ac.za

55
17 August 2015 and the Medical Manager of Hermanus Hospital granted access on
26 August 2015 to the facilities.
During fieldwork each respondent wrote their name on the Consent to participate in
research form on a Stellenbosch University letterhead, signed and dated it
(ADDENDUM 4). The researcher explained the contents of the form to each
respondent and asked each respondent if they understood the contents of the form.
Each respondent was assured their identity and response were confidential. The
researcher signed and dated each form agreeing to its terms.
The name and personal details of the patient was not recorded on the questionnaire in
English (ADDENDUM 2) or the questionnaire in Afrikaans (ADDENDUM 3). The
following biographical details: home language, age, gender, medical insurance status
and highest qualification of the respondent were recorded on the questionnaire. The
ward in which the questionnaire was administered was recorded on the form to track
the progress of the study against the timeline.
The researcher administered the questionnaire at each patient’s bedside to create as
little disruption as possible. The interview was conducted in a low voice and the
curtain was drawn if the respondent requested to maintain privacy. The researcher
assured each respondent their response was confidential and that their privacy would
be respected and no personal consequences would flow from the interview. The
completed informed consent forms and questionnaires have been stored in a safe
location.
To ensure the confidentiality of the data, only the researcher extracted data from the
completed questionnaires and captured it on a spreadsheet. The data is safely stored in
a folder on a laptop loaded with corporate level computer access and internet security
programs. The statistical data and datasheets are also stored in the same folder and on
secondary storage as a backup.
4.9 THE LIMITATIONS OF THE STUDY
Limitations to the study were anticipated. A review of the SA ePublications and the
EBSCOhost databases, using “patient satisfaction” and “district hospitals” as
keywords, revealed no other patient satisfaction surveys at public district hospitals,
using the 22 SERVQUAL variables grouped in the five dimensions, had been
conducted in this country. Therefore, it was not possible to compare the results of this
study with other local studies.
The study was conducted at only three of the 25 district hospitals in only one of the
nine provinces. For this reason, the result of this study could be seen as not being
representative of the estimated result at all district hospitals in the country. A future
study based on a selection of district hospitals in all nine provinces could yield more
representative results.
The study measured the service quality of health services delivered to patients, not the
quality of the health services delivered to patients. The measurement of service
quality relies on patient expectations and perceptions, whereas the delivery of quality
health services is governed by strict medical protocols and procedures.
Stellenbosch University https://scholar.sun.ac.za

56
The questionnaire was available in only two of the 11 official languages in SA. The
respondents could either respond to the English or Afrikaans questionnaire.
A cross-sectional design was used in the study to determine the association between
two or more variables at a point in time. The design did not seek to establish the
causality of the relationships between variables. It also did not gather observational
data on the variables over a period of time as in a longitudinal study.
The aim of the exclusion criteria was to limit occurrence of inaccurate and incomplete
data. Patients were excluded if their home language was not English or Afrikaans,
they were younger than 18, they were sleeping at the time of the visit, and they had an
infectious illness. The exclusions resulted in non-response bias.
The measurement of the expectations and perceptions of patients at private hospitals
in the Western Cape was not part of the study. A future study could determine patient
satisfaction at these hospitals.
The literature review showed that more recent service quality models exist than the
model of Parasuraman, Zeithaml and Berry which was developed in the 1980s.
Instead of using a newer satisfaction model, this study is based on a well-documented
model.
4.10 CONCLUSION
The various methods described above were all used to analyse the survey results. The
following chapter (5) discusses and illustrates the survey results.
Stellenbosch University https://scholar.sun.ac.za

57
CHAPTER 5 – FINDINGS, SUMMARY, CONCLUSIONS AND
RECOMMENDATIONS
5.1 INTRODUCTION
This chapter includes the analysis of the data originating from the structured
questionnaire which will be presented in narrative, graphical and tabular form. The
analytical results form the basis of findings which are summarised.
The conclusions drawn will be discussed, indicating how the research objectives have
been met. Areas where expectations have not been met are identified, and
recommendations are made how to address these areas.
5.2 FINDINGS
5.2.1 Exploratory analysis
The statistical program Stata 10 version 1.5 was used to analyse the data. The data
results below indicate the associations measured.
Table 5.1: Statistical results for Hermanus Hospital
Variable Valid
N
Mean Median Min.
Value
Max.
Value
Lower
Quartile
Upper
Quartile
Std.
Dev.
Tangibles 13 -0.55 -0.50 0.00 -1.50 -0.25 -0.75 0.45
Reliability 13 -0.60 -0.60 0.20 -2.00 -0.20 -0.80 0.58
Responsiveness 13 -1.00 -0.75 0.25 -2.75 -0.50 -1.50 0.94
Assurance 13 -0.73 -0.75 0.00 -1.50 -0.25 -1.25 0.53
Empathy 13 -0.40 -0.20 0.00 -1.40 -0.20 -0.60 0.43
Table 5.2: Statistical results for Stellenbosch Hospital
Variable Valid
N
Mean Median Min.
Value
Max.
Value
Lower
Quartile
Upper
Quartile
Std.
Dev.
Tangibles 19 -0.46 -0.25 0.50 -1.75 0.00 -0.75 0.54
Reliability 19 -0.37 -0.20 0.00 -1.20 0.00 -0.60 0.37
Responsiveness 19 -0.38 -0.25 0.50 -3.00 0.00 -0.50 0.77
Assurance 19 -0.39 -0.25 0.50 -1.75 0.00 -0.75 0.60
Empathy 19 -0.36 -0.20 0.00 -1.20 0.00 -0.60 0.39
Table 5.3: Statistical results for Victoria Hospital
Variable Valid
N
Mean Median Min.
Value
Max.
Value
Lower
Quartile
Upper
Quartile
Std.
Dev.
Tangibles 30 -0.63 -0.63 0.75 -1.75 -0.25 -1.00 0.56
Reliability 30 -0.58 -0.60 0.80 -1.80 -0.20 -0.80 0.56
Responsiveness 30 -0.62 -0.50 0.75 -3.00 -0.25 -1.00 0.64
Assurance 30 -0.65 -0.50 0.75 -2.50 -0.25 -1.00 0.65
Empathy 30 -0.39 -0.40 0.20 -2.20 0.00 -0.60 0.51
Stellenbosch University https://scholar.sun.ac.za

58
The predetermined model used in this study was tested extensively in other studies.
The dimensions in this study are applied according to the original model. The
integrity of the original model has been maintained, therefore, factor analysis is not
required in this analysis.
In this study, the Cronbach alpha scores range between 0.50 and 0.80. These scores
are acceptable in terms of previous research. The results show the alpha scores for
patient expectations are higher than the alphas of the patient perceptions. This could
be due to patients not fully understanding the questions before answering.
5.2.2 Survey response
The researcher collected 62 responses in the course of two weeks in August 2015. All
the responses were subject to data analysis as no data errors were found amongst the
responses. This high usability rate seemed to yield significant results. Figure 5.1
below compares the number of responses by hospital.
Figure 5.1: Number of survey responses by hospital
Table 5.4 shows the socio-demographic characteristics the respondents to the survey.
The information was obtained from each respondent in the study. The aggregated
information has a strong correlation with the socio-demographic profile determined
before the study began.
Table 5.4: Socio-demographic characteristics of respondents
Characteristics Frequency Percentage
Home language (n=62)
Afrikaans 29 47%
English 33 53%
Age (n=62)
18 - 35 14 23%
0
5
10
15
20
25
30
35
Hermanus Stellenbosch Victoria
Re
spo
nse
s
Stellenbosch University https://scholar.sun.ac.za

59
36 - 45 11 18%
46 - 55 14 23%
56 - 65 13 20%
66 years and older 10 16%
Gender (n=62)
Male 28 45%
Female 34 55%
Medical coverage (n=62)
Insured 5 8%
Uninsured 57 92%
Highest educational qualifications (n=62)
Some primary school 12 19%
Some high school 26 42%
Matriculation 12 19%
Diploma 9 15%
Degree 3 5%
5.2.3 Application of the SERVQUAL gap model
The researcher used the SERVQUAL method (Parasuraman et al, 1985) to calculate
the expected score and the perceived score for each variable across the five
dimensions and to calculate the gap between each of these scores. The gap between
the expected and perceived score is defined as GAP 5 by the authors. This method is
documented in detail in Chapter Two.
The figures for Table 5.5 below were compiled using the data from Statistica. The
negative results for Gap 5 (Perceptions – Expectations = Service Quality) indicate the
service quality at the three district hospitals did not meet or exceed patient
expectations on any variable or dimension.
The expected service statements were prefixed ‘At an excellent hospital…’ and
should be read using the text in italics but not enclosed in the bracket. The perceived
service statements were prefixed ‘At this hospital …’ and should read using the italic
text enclosed in the bracket ().
Table 5.5: GAP 5 scores
Expected Perceived GAP 5
Score Score Score
Tangibles: 1.93 1.37 -0.56
The hospital will be/(is) well maintained 1.91 1.17 -0.74
The hospital and the wards will be kept clean and
tidy 1.92 1.41 -0.51
The medical equipment in the ward will be
working 1.94 1.30 -0.64
The uniforms of the nursing staff will be neat and
tidy 1.94 1.60 -0.34
Stellenbosch University https://scholar.sun.ac.za

60
Reliability 1.87 1.35 -0.52
The care offered will be more than expected 1.83 1.46 -0.37
The toilets and basins will be working when they
used 1.86 1.04 -0.82
The doctor will do regular rounds to check the
condition of patients 1.84 1.30 -0.54
The patient will receive their medication at the
correct times 1.92 1.54 -0.38
The nursing staff will check on patients condition
regularly 1.89 1.42 -0.47
Responsiveness 1.82 1.19 -0.63
Administration will be able to draw the patients’
medical records without delay 1.88 1.34 -0.54
The administrative process to admit the patient
will not have delays 1.83 1.26 -0.57
On admission, administration will be able to tell
the patient if any payment is due 1.76 0.89 -0.87
The doctor will be able to admit the patient to the
hospital without delay 1.81 1.28 -0.53
Assurance 1.85 1.26 -0.59
The provincial health department will capacitate
the hospital to provide high quality care
1.78 0.99 -0.79
The hospital will be well managed 1.83 1.07 -0.76
The nursing staff will be well trained 1.94 1.51 -0.43
The nursing staff will be courteous 1.86 1.49 -0.37
Empathy 1.83 1.45 -0.38
The hospital will respect my privacy 1.84 1.31 -0.53
The doctor who treats me will be polite 1.91 1.62 -0.29
The nursing staff will not be too busy to assist me
when I ask
1.67 1.25 -0.42
The nursing staff will give me personal attention 1.83 1.57 -0.26
The nursing staff will listen to my problems 1.92 1.51 -0.41
The mean for each dimension was calculated by dividing the gap score for each item
within the dimension by the number of items within the dimension. The following
was observed from the resultant gap scores above.
Tangible dimension:
It was observed that patients have a very high expectation that equipment at a hospital
works and nursing staff wear clean clothing and keep a neat appearance, to the extent
that it is a given.
Most patients experienced two of the hospitals as old and in need of refurbishment.
They expected the state to allocate funding to refurbish these hospitals while
acknowledging the efforts of the hospital management to maintain the existing
buildings and keep the wards clean and tidy.
Stellenbosch University https://scholar.sun.ac.za

61
Reliability dimension:
It was observed on this dimension that the variance between the patients’ overall
expectation that was experienced, was the smallest. The response of patients shows
that the hospital management, the doctors, nurses and support staff are meeting the
expectations of the patients, to a greater degree on this item than on other items.
Responsiveness dimension:
It was observed, that most patients do not have as high an expectation of
administrative efficiency when compared to other dimensions. The fact that patients
do expect to queue and to wait for services at a public hospital could explain the low
score.
Ninety-two per cent of the respondents had no form of health insurance. These
respondents rely on the state to provide free medical services. They had little
expectation that any cost for medical services would be incurred and their experience
confirmed this thinking.
Assurance dimension:
It was observed, that patients expect nursing staff to be highly competent, the inherent
fear of illness and the high reliance on well trained nurses to recover from illness
could explain the high score.
Empathy dimension:
It was observed, that patients do experience doctors and nurses who have empathy for
them, they experienced doctors who are polite and with a good bed side manner. It
was found that the staffing levels at the hospitals are under strain. The staffing level at
the hospitals is directly affected by budget constraints. The patients expressed a level
of tolerance that nursing staff could not give them immediate attention when
requested; however, they were confident that nurses would assist them when they
were able to. The patients’ expectations took into account that staffing levels at a
public hospital could be lower than at a private hospital.
5.2.4 Overall gap scores by hospital
The gap scores by hospital show none of the hospitals met their patient’s expectations.
The lowest result was in the responsiveness dimension at the Hermanus Hospital
where expectations exceeded perceptions. The responsiveness dimension that showed
the greatest variation and the empathy variation showed the least variation.
Stellenbosch University https://scholar.sun.ac.za

62
Figure 5.2: Overall GAP score by hospital
5.2.5 Tangibility score by hospital
The test of the tangibility dimension of service quality showed relative uniformity
across the patient expectation and perception gaps.
Figure 5.3: Tangibility score by hospital
5.2.6 Reliability score by hospital
The test of the reliability dimension of service quality showed uniform patient
expectation and perception gaps.
-0.70
-0.60
-0.50
-0.40
-0.30
-0.20
-0.10
0.00
Hermanus Stellenbosch Victoria
Overall
Overall
-0.70
-0.60
-0.50
-0.40
-0.30
-0.20
-0.10
0.00
Hermanus Stellenbosch Victoria
Tangibles
Tangibles
Stellenbosch University https://scholar.sun.ac.za

63
Figure 5.4: Reliability score by hospital
5.2.7 Responsiveness score by hospital
The responsiveness dimension gap was relatively uniform across the different
hospitals.
Figure 5.5: Responsiveness score by hospital
5.2.8 Assurance score by hospital
The test of the assurance gap yielded results ranging from 0.50 to 1.80. The results
indicate arears for improvement. The expectation of space differed from the
perception of space experienced when visited.
-0.70
-0.60
-0.50
-0.40
-0.30
-0.20
-0.10
0.00
Hermanus Stellenbosch Victoria
Reliability
Reliability
-1.20
-1.00
-0.80
-0.60
-0.40
-0.20
0.00
Hermanus Stellenbosch Victoria
Responsiveness
Responsiveness
Stellenbosch University https://scholar.sun.ac.za

64
Figure 5.6: Assurance score by hospital
5.2.9 Empathy score by hospital
The average gap score for this dimension was higher than other dimensions. The
empathy dimension is a focus of the Department of Health; it should score higher than
other dimensions.
Figure 5.7: Empathy score by hospital
5.2.10 Reliability
The Cronbach alpha (Cronbach, 1951) is a coefficient of reliability. The Cronbach
alpha was calculated to determine the reliability of each of the scales of the five
dimensions before the factor analysis was performed. It is a function of the number of
-0.80
-0.70
-0.60
-0.50
-0.40
-0.30
-0.20
-0.10
0.00
Hermanus Stellenbosch Victoria
Assurance
Assurance
-0.41
-0.40
-0.39
-0.38
-0.37
-0.36
-0.35
-0.34
Hermanus Stellenbosch Victoria
Empathy
Empathy
Stellenbosch University https://scholar.sun.ac.za

65
items and the average inter-correlation (covariance) among the items, in a group. The
coefficient will be 1 if all the items are interrelated and 0 if not. A value of 0.7 or
higher for Cronbach’s alpha is generally accepted as evidence of internal consistency.
The results of the reliability analysis in Table 5.6 indicate the overall consistency
between the survey items and the five dimensions.
Table 5.6: Reliability analysis
Dimensions Cronbach’s alpha
Tangibles Expectation α = 0.706
Perception α = 0.631
Reliability Expectation α = 0.799
Perception α = 0.699
Responsiveness Expectation α = 0.870
Perception α = 0.760
Assurance Expectation α = 0.802
Perception α = 0.642
Empathy Expectation α = 0.739
Perception α = 0.716
5.2.11 Validity
The various factor analyses are provided in the tables below.
a. Tangibles
In this instance, factor 1 is mostly defined by the variables cleaning and equipment.
The majority of patients expect wards to be clean and tidy and medical equipment to
work.
Table 5.7: Tangibles factor analysis
Factor Eigenvalue Proportion
Factor 1 1.96450 0.4911
Factor 2 0.86729 0.2168
Factor 3 0.76259 0.1906
Factor 4 0.40563 0.1014
Table 5.8: Tangibles factor loadings
Variable Factor 1 Uniqueness
Maintenance gap 0.5420 0.7063
Cleaning gap 0.8440 0.2877
Equipment gap 0.7931 0.3710
Uniform gap 0.5740 0.6706
Stellenbosch University https://scholar.sun.ac.za

66
Table 5.9: Tangibles rotated factor loadings
Variable Factor 1 Uniqueness
Maintenance gap 0.5420 0.7063
Cleaning gap 0.8440 0.2877
Equipment gap 0.7931 0.3710
Uniform gap 0.5740 0.6706
b. Reliability
In this instance, factor 1 is mostly defined by the variables care, rounds and nursing.
The majority of patients expect the care on offer to meet expectations, the doctors to
make regular rounds and the nursing staff to check on their condition regularly.
Table 5.10: Reliability factor analysis
Factor Eigenvalue Proportion
Factor 1 2.06546 0.4131
Factor 2 0.97840 0.1957
Factor 3 0.85035 0.1701
Factor 4 0.74035 0.1481
Factor 5 0.36544 0.0731
Table 5.11: Reliability factor loadings
Variable Factor 1 Uniqueness
Care gap 0.6565 0.5690
Toilet gap 0.3838 0.8527
Rounds gap 0.8190 0.3292
Meds gap 0.5762 0.6680
Nursing gap 0.6959 0.5157
Table 5.12: Reliability rotated factor loadings
Variable Factor 1 Uniqueness
Care gap 0.6565 0.5690
Toilet gap 0.3838 0.8527
Rounds gap 0.8190 0.3292
Meds gap 0.5762 0.6680
Nursing gap 0.6959 0.5157
c. Responsiveness
In this instance, factor 1 is mostly defined by the variables file and admin. The
majority of patients expect Administration to draw their medical records and execute
the admission process with little delay.
Table 5.13: Responsiveness factor analysis
Factor Eigenvalue Proportion
Factor 1 1.91111 1.1303
Factor 2 -0.00697 -0.0041
Factor 3 -0.04174 -0.0247
Stellenbosch University https://scholar.sun.ac.za

67
Factor 4 -0.17159 -0.1015
Table 5.14: Responsiveness factor loadings
Variable Factor 1 Uniqueness
File gap 0.8579 0.2639
Admin gap 0.8160 0.3341
Fees gap 0.5235 0.7260
Delays gap 0.4849 0.7648
Table 5.15: Responsiveness rotated factor loadings
Variable Factor 1 Uniqueness
File gap 0.8579 0.2639
Admin gap 0.8160 0.3341
Fees gap 0.5235 0.7260
Delays gap 0.4849 0.7648
d. Assurance
In this instance, factor 1 is mostly defined by the variables management, training and
courtesy. The majority of patients expect the nursing staff to be well trained and
courteous and hospital management to manage the resources at their disposal
adequately.
Table 5.16: Assurance factor analysis
Factor Eigenvalue Proportion
Factor 1 2.08094 0.5202
Factor 2 0.94298 0.2357
Factor 3 0.58265 0.1457
Factor 4 0.39344 0.0984
Table 5.17: Assurance factor loadings
Variable Factor 1 Uniqueness
Prov gap 0.5593 0.6871
Management gap 0.7558 0.4288
Training gap 0.8270 0.3160
Courtesy gap 0.7162 0.4871
Table 5.18: Assurance rotated factor loadings
Variable Factor 1 Uniqueness
Prov gap 0.5593 0.6871
Management gap 0.7558 0.4288
Training gap 0.8270 0.3160
Courtesy gap 0.7162 0.4871
e. Empathy
In this instance factor 1 is mostly defined by the variables busy, personal and
problems. The majority of patients expect nursing staff to give them personal
Stellenbosch University https://scholar.sun.ac.za

68
attention, to attend to them as soon as time allows it and to listen to their medical
problems attentively.
Table 5.19: Empathy factor analysis
Factor Eigenvalue Proportion
Factor 1 2.11714 0.4234
Factor 2 0.98398 0.1968
Factor 3 0.91923 0.1838
Factor 4 0.64742 0.1295
Factor 5 0.33223 0.0664
Table 5.20: Empathy factor loadings
Variable Factor 1 Uniqueness
Privacy gap 0.4915 0.7584
Doctor gap 0.4607 0.7877
Busy gap 0.6975 0.5135
Personal gap 0.6657 0.5569
Problems gap 0.8565 0.2664
Table 5.21: Empathy rotated factor loadings
Variable Factor 1 Uniqueness
Privacy gap 0.4915 0.7584
Doctor gap 0.4607 0.7877
Busy gap 0.6975 0.5135
Personal gap 0.6657 0.5569
Problems gap 0.8565 0.2664
5.2.12 Boxplots
The boxplots below graphically illustrate the responses for each hospital on the five
dimensions of service quality.
The interpretation of the boxplots below is as follows:
a. Figure 5.8 – There is greater variation in the expectation and perceptions gaps
on the physical appearance at Victoria hospital compared to the two other
hospitals.
b. Figure 5.9 – The reliability of services met the expectations of more patients at
Stellenbosch Hospital than at the other hospitals.
c. Figure 5.10 – There is less agreement on the responsiveness of administration
and management amongst patients at Hermanus Hospital than at the other
hospitals.
d. Figure 5.11 – The number of in-patients could explain the greater lack of
agreement on the assurance of good service at Victoria Hospital compared to
others.
e. Figure 5.12 – The medical staff at Stellenbosch Hospital are as empathetic as
the staff at Victoria Hospital.
Stellenbosch University https://scholar.sun.ac.za

69
a. Tangibles
Figure 5.8: Tangibility boxplot by hospital
b. Reliability
Figure 5.9: Reliability boxplot by hospital
Stellenbosch University https://scholar.sun.ac.za

70
c. Responsiveness
Figure 5.10: Responsiveness boxplot by hospital
d. Assurance
Figure 5.11: Assurance boxplot by hospital
Stellenbosch University https://scholar.sun.ac.za

71
e. Empathy
Figure 5.12: Empathy boxplot by hospital
5.3 SUMMARY OF FINDINGS
The following section deals with significant findings arising from the empirical study,
and it draws on paragraphs in the literature study.
a. In general, the results indicate that, although the role of management is not
always apparent (par.5.2.3) due to the large proportion of the population that
relies on public health services (par.3.7.4), cost containment by hospitals is
important to keep services sustainable and patients satisfied (par.3.8.9).
b. The results are less clear with respect to how the role of the provincial Health
Department is viewed (par.5.2.3), the Department has to maintain its
institutional structures (par.3.8.6) build new facilities to meet demand and
upgrade existing facilities to prevent deterioration (par.3.8.5) increasing staffing
in specialist roles (par.3.8.8) to ensure patient satisfaction.
c. In general, the results indicate that the care offered at hospitals is not far from
what patients expect (par.5.2.3). This tendency could indicate that hospitals
monitor their patient satisfaction rates and adhere to the performance reporting
culture (3.8.7).
d. In the sample, the results indicate that patients have a sense of assurance that
nursing staff are well trained (par.5.2.3) and courteous (par.5.3.3). It could
indicate that hospitals and the department strive to meet the criteria set by the
National Core Standards (par.3.6), which satisfies patients.
Stellenbosch University https://scholar.sun.ac.za

72
e. Moreover, the results empirically validate that Stellenbosch Hospital, more than
the other two hospitals, offers health services that are closely associated with
what patients expect (par.5.2.4.).
f. The results of the factor loading reveal a significant relationship between the
tangible things person can see and touch such as clean toilets and medical
equipment that does not work and their sense of disappointment when their
expectation is not met (par.5.2.11).
5.4 DISCUSSION OF FINDINGS
Did the study measure satisfaction levels of patients at district hospitals and provide
results useful for planning purposes? The empirical results measured satisfaction
levels of patients and highlighted gaps between what is expected and experienced. In
order to overcome the shortcomings indicated in the analysis, hospital management
need to overcome:
Physical maintenance is not performed regularly.
Nurses are not able to attend to patients frequently.
The cost of attendance is not discussed with patients.
The provincial health department does not communicate its objectives and
achievements to patients.
Hospital management does not communicate its goals and achievements to
patients.
Not all nursing staff has empathy with patients.
To address the gaps above, hospital management should:
adopt a new management approach that highlights the benefits of striving for
service quality and communicating to its patients and staff.
engage in research to identify leading trends that can close the gaps above.
The research questions are discussed in the next section.
Do patients expect service quality at public district hospitals? The data of this study
suggests that patient expectations of service quality are upwardly biased, sometimes
significantly so.
Do patients perceive service quality at the public district hospitals they visit? The data
of this study suggests that patient perceptions of service quality are biased and that
surveys should be confined to certain kinds of questions to obtain more clarity.
However, the questions that seem to be answered with the least bias in the survey –
perceptions of the quality of the hospital infrastructure – are still useful. The
subjective perceptions of process of patients are unique – the behaviour of
management, doctors and nurses, the attitude of the nurse, and their overall
satisfaction with service quality. These subjective responses were unavoidable and
their bias is strong.
Which factors could give rise to the gap between patients’ expectations and
perceptions of service quality at district hospitals? The patient satisfaction data is
informative. The data suggests that satisfied patients can be differentiated from less
satisfied patients and places the spotlight on service characteristics that increase
patient satisfaction or perceptions of quality.
Stellenbosch University https://scholar.sun.ac.za

73
In chapter 1 the stated primary objective is to describe the expectations and
perceptions of service quality of patients at district hospitals and to recommend
measures to improve service quality.
The following conclusions were reached on each of the research objectives.
a. Does hospital management have an approach at its disposal that could improve
patient satisfaction? The literature study has shown this can be achieved by
adopting a management approach that uses a well-established standardised tool to
gather relevant patient information to inform health professionals, management,
government and stakeholders on service quality to improve patient satisfaction.
b. Does quantitative data show that patient experiences match their expectations? The
empirical quantitative research has shown that patients at district hospitals have
high service expectations and their experiences seldom meet those expectations
5.4 FUTURE RESEARCH
The confidence in the results could be strengthened with access to data on local
patient satisfaction rates that is not in the public domain. It would then be possible to
generate comparative studies that incorporate contextual information.
Also, future work could control for socio-demographic factors that might influence
patient perceptions.
5.5 CONCLUSION
The aim of the research to measure patient satisfaction at district hospitals in the
Western Cape was achieved.
The research process succeeded in answering the research questions. The gap scores
indicate that intangibles such as services are measurable using quantitative methods.
The project met its objectives and evidence indicated that a large body of knowledge
has been gathered on service quality in health services. However, there are specific
contexts that can be explored in more detail.
The research indicates that the service quality approach will assist hospital
management and health departments in becoming client-centred organisations. It is
therefore recommended that these institutions investigate the opportunity of becoming
service quality leaders.
Stellenbosch University https://scholar.sun.ac.za

74
REFERENCES
1. Amollo, R.2009. In pursuit of health equity in South Africa: A critique of the
proposed national health insurance. ESR Review 10(3): 14-17.
2. Andaleeb, S. 2001. Service quality perceptions and patient satisfaction: a study
of hospitals in a developing country. Soc Sci Med, 52:1359-1370.
3. ANC National General Council. 2010. Additional Discussion Documents:
National Health Insurance. Durban: African National Congress; 21 September
2010.
4. Anderson, E. 1995. Measuring service quality in a university health clinic.
International Journal of Health Care Quality Assurance, 8:2, 32-37.
5. Ball, D., Coelho, P.S. & Vilares, M.J. 2006. Service personalisation and loyalty.
Journal of Services Marketing 20(6): 391-403.
6. Barron, P. 2008. A fifteen year review of the health sector in South Africa.
Prepared for the Department of Health, unpublished (December 2008)/Barron P,
Strachan K (1997). The Year in Review. In Barron P (ed). South African Health
Review 1997. Health Systems Trust.
http://www.hst.org.za/uploads/files/sahr2007.pdf (Accessed November 2009)
7. Bediako, M.A., Nel, M. & Hiemstra, L.A. 2006. Patients’ satisfaction with
government health care and services in Taung district, North West Province.
Curationis, 29(2):12-15.
8. Bentley, J.M. & Nash, D.B., 1998. How Pennsylvania hospitals have responded
to publicly released reports on coronary artery bypass graft surgery. The Joint
Commission journal on quality improvement, 24(1), pp.40-49.
9. Berry, L.L., Seiders, K. & Wilder, S.S. 2003. Innovations in access to care: a
patient-centered approach. Annals of Internal Medicine 139(7), 568-74.
10. Berry, L.L. & Seltman, K.D. 2008. The enduring culture of the Mayo Clinic,
Mayo Clin Proc, 89(2):144-147.
11. Bessinger, R. E. & Bertrand, J. T. 2001. Monitoring quality of care in family
planning programs: a comparison of observations and client exit interviews.
International Family Planning Perspectives, 27(2), 63-70.
12. Bice, T.W., Eichhorn, R.L. & Fox, P.D. 1972. Socioeconomic status and the use
physician services: a reconsideration, Medical Care, 10(3):261-271.
Stellenbosch University https://scholar.sun.ac.za
75
13. Bleich, S.N., Ozaltin, E. & Murray, C. 2009. How does satisfaction with the
health-care system relate to patient experience? World Health Organisation
Bulletin, 87: 271-278.
14. Boshoff, C. & Gray, B. 2004. The relationship between service quality,
customer satisfaction and buying intentions in the private hospital industry.
South African Journal of Business Management, 35(4): 27-37.
15. Boureaux, E.D. & O’Hea, E.L. 2004. Patient satisfaction in the emergency
room: A review of the literature and implications for practice. JEM. 2004;
26:13-26.
16. Buttle, F. 1994. ‘What’s wrong with SERVQUAL?’, Working Paper No. 277,
Manchester Business School, Manchester.
17. Cadotte, E.R., Woodruff, R.B. & Jenkins, R.L. 1987. Expectations and norms of
customer satisfaction. Journal of Marketing Research, 24:305-314.
18. Choi, W.H., Lee, H., Kim, C., Lee, S. & Choi, H.S. 2004. The impact of visit
frequency on the relationship between service quality and outpatient
satisfaction: a South Korean study. Health Services Research, 39(11):13-33.
19. Chopra, M., Lawn, J., Sanders, D., Barron, P. et al. 2009. Achieving the health
Millennium Development Goals for South Africa: challenges and priorities. The
Lancet 374:1023-1031.
20. Cooper, D.R. & Schindler, P.S. 2006. Business research methods. 9th
ed. New
York: Irwin McGraw-Hill.
21. Cronbach, L.S. 1951. Coefficient alpha and the internal structure of tests.
Psychometrika, 16(3): 297-334.
22. Czaplewski, A.J., Ferguson, J.M. & Milliman, J.F. 2001. Southwest Airlines:
How internal marketing pilots success. Journal of Marketing Management, 14-
17.
23. Darby, M.R. & Karni, E. 1973. Free competition and the optimal amount of
fraud. Journal of Law and Economics, 16:67-86.
24. De Jager, J.W. & Swanepoel, S. 2008. Internal marketing strategy: Focusing on
staff orientation in health care in South Africa. Acta Commercii 2008. 181-193.
25. De Nobile, J.J. & McCormick, J. 2008. Job satisfaction of catholic primary
school staff: a study of biographical differences. International Journal of
Education Management, 22:135-150.
Stellenbosch University https://scholar.sun.ac.za

76
26. Department of Health. 2011. National core standards for health establishments
in South Africa. Government Printer: Pretoria.
27. Department of Health. 2011. Fast track to quality: The six most critical areas for
patient-centred care. Government Printer: Pretoria.
28. Department of Health. 2012. Annual Report 2011/12. Pretoria: Department of
Health.
29. Department of Health. 2013. Annual Report 2012/13. Pretoria: Department of
Health.
30. Department of Health. 2014. Annual Report 2013/14. Pretoria: Department of
Health.
31. Department of Health. 2000. The primary health care package for South Africa
a set of norms and standards. Available at:
http://www.doh.gov.za/docs/policy/norms/contents.html.
32. De Souza. W.W., Luna. C.F., De-Souza Junior. P.R.B. & Szwarcwald. C.L.
2005. Health care users’ satisfaction in Brazil. Cad Saude Publicia 2005.
21(Sup):S109-118.
33. Donabedian, A. 1996. The effectiveness of quality assurance. International
Journal of Quality Health, 18(4):401-407.
34. Dugdale, D.C., Epstein, R. & Pantilat, S.Z. 1999. Time and the patient-
physician relationship. Journal of General Internal Medicine 14(S1) 34-40.
35. Eiriz, V., & Figueiredo, J.A. 2005. Quality evaluation in healthcare services
based on the customer-provider relationship. International Journal of Health
Care Quality Assurance, 18(6), 404-412.
36. Fitzpatrick, R. 1991. Surveys of patient satisfaction: important general
considerations. British Medical Journal, 302:887-889.
37. Garrib, A., Herbst, K., Dlamini, L., McKenzie, A., Stoops, N., Govender, T. &
Rohde, J., 2008. An evaluation of the district health information system in rural
South Africa. SAMJ: South African Medical Journal, 98(7), pp.549-552.
38. Glick, P. 2009. How reliable are surveys of customer satisfaction with
healthcare services? Evidence from matched facility and household data in
Madagascar. Social Science & Medicine. 68(2), 368-79.
39. Gounaris, S. 2006. The notion of internal market orientation and employee
satisfaction: some preliminary evidence. Journal of Service Marketing,
22(1):68-69.
Stellenbosch University https://scholar.sun.ac.za

77
40. Gronroos, C. 1990. Service Management and Marketing. Massachusetts:
Lexington Books.
41. Gulliford, M., Figueroa-Munoz, J., Morgan, M., Hughes, D., Gibson, B., Beech,
R. & Hudson, M. 2002. What does ‘access to health care’ mean? Journal of
Health Services Research & Policy 7(3), 186-8.
42. Guttman, N., Zimmerman, D.R. & Nelson, M.S. 2003. The many faces of
access: Reasons for medically nonurgent emergency department visits. Journal
of Health Politics, Policy & Law 28(6), 1089-120.
43. Harrison, D. 2009. An overview of health and healthcare in South Africa 1994-
2010: Priorities, progress and prospects for new gains. A discussion document
commissioned by the Henry J. Kaiser family Foundation to help inform the
national health leaders retreat at Muldersdrift, January 24-26 2010.
44. HST Audit 2012;
Health Systems Trust. 2012. National health care facilities baseline audit:
National summary report. Durban: Health Systems Trust.
45. Huber, D.I. 2014. Leadership and nursing care management. Elsevier:St Louis.
46. Iecovich, E & Carmel, S. 2009. Differences in accessibility, affordability and
availability (AAA) of medical specialists among three age groups of elderly
people in Israel. Journal of Aging and Health, 21(5): 776-797.
47. Jost, T.S. 1992. Recent developments in medical quality assurance and audit,
cited in Quality and Regulation in Health Care by R. Dingwall and P. Fenn.
London: Routledge.
48. Kang, R. & Hasnian-Wynia, R. 2013. Hospital commitment to community
orientation and its association with quality of care and patient experience.
Journal of Healthcare Management 58:4 July/August 2013.
49. Kotler, P. & Andreasen, A.R. 1996. Strategic marketing for non-profit
organisations. 3rd
ed. Prentice Hall: Englewood Cliffs.
50. Larrabee, J.H. 1995. The changing roles of the consumer in health care quality.
Journal of Nursing Care Quality, 9(2):8-15.
51. Larsson, B.W., Larsson, G., Chantereau, M.W. & Stael van Holstein, K. 2005.
International comparisons of patients’ view on quality of care. International
Journal Health Care Quality Assurance, 18:62-73.
52. Lindelow, M. & Wagstaff, A. 2003. Health facility surveys: an introduction.
World Bank Policy Research Working Paper 2953.
Stellenbosch University https://scholar.sun.ac.za

78
Accessed from: http://www-wds.worldbank.org/
53. Lurie, N. and Dubowitz, T., 2007. Health disparities and access to health. Jama,
297(10), pp.1118-1121.
54. McLaughlin, C.J. & Wyszewianski, L.2002. Access to care: remembering old
lessons. Health Services Research 37(6):1441-3.
55. Morrel-Samuels, P., 2002. Getting the truth into workplace surveys. Harvard
Business Review, 80(2), pp.111-118.
56. National Planning Commission, 2013. National Development Plan Vision 2030.
https://nationalplanningcommission.wordpress.com/the-national-development-
plan/
57. Naumann, E. & Giel, K. 1995. Customer satisfaction measurement and
management: using the voice of the customer. Cincinnati: Thomson Executive
Press.
58. Nelson, P. 1970. Information and consumer behaviour. Journal of political
economy, 78(2):311-329.
59. Nicholson, C., Jackson, C.L., Marley, J.E. & Wells, R. 2012. An Australian
experiment: How primary health care organizations supported the evolution of a
primary health care system. JABFM, March – April 2012, 25:3.
60. O’Connor, S.J., Trinh, H.O. & Shewchuk, R.M. 2000. Perceptual gaps in
understanding patient’s expectations for health care service quality. Health Care
Management Review, 25(2):7-23.
61. Oliver, R.L. 1980. A cognitive model of antecedents and consequences of
satisfaction. Journal of Marketing Research. Vol. 17(4) 460-469.
62. Parasuraman, A., Zeithaml, V.A., & Berry, L.L. 1985. A conceptual model of
service quality and its implications for future research. Journal of Marketing,
49:4, 41-50.
63. Parasuraman, A., Zeithaml, V.A., & Berry, L.L. 1994. A reassessment of
expectation as a comparative standard in measuring service quality: implications
for future research. Journal of Marketing, 58(1):111-124.
64. Peltzer, K. 2009. Patient experiences and health system responsiveness in South
Africa. BMC Health Services Research, 9, 117, DOI:10.1186/1472-6963-9-117.
65. Penchansky, R. & Thomas, J. 1981. The concept of access: definition and
relationship to consumer satisfaction. Medical Care, 19(2):127-40.
Stellenbosch University https://scholar.sun.ac.za

79
66. Phaswana-Mafuya, N., Peltzer, K. & Davids, A.S. 2011. Patients’ perceptions of
health care services in the Eastern Cape, South Africa. African Journal for
Physical, Health Education, Recreation and Dance, 17(3):502-516.
67. Plaks, S. & Butler, M.B.J. 2012. Access to public healthcare in South Africa.
South African Actuarial Journal 2012, 12:129-64.
68. Pol, L.G. & Thomas, R.K. 2001. The plenum series on demographic methods
and population analysis: The demography of health and health care. New York:
Plenum Publishers.
http://books.google.co.za/books?hl=en&lr=&id=v9Us2CaB5uUC&oi=fnd&pg=
PA1&dq=%22health+demography%22&ots=EHB3Q5RUZ-
&sig=tq0SeJSGZj__h6JtQTbSikFhKyk#v=onepage&q=%22health%20demogr
aphy%22&f=false
69. Republic of South Africa. 1996. Constitution of the Republic of South Africa Act
108 of 1996. Pretoria: Government Printer.
70. Republic of South Africa. 2003. National Health Act 61 of 2003. Pretoria:
Government Printer.
71. Republic of South Africa. 2011. Department of Health. 2011. Green Paper on
National Health Insurance in South Africa. Government Gazette No. 34523, 12
August 2011.
72. Rohini, R. & Mahadevappa, B. 2006. Service quality in Bangalore hospitals –
an empirical study. Journal of Services Research, 6(1):60.
73. Schneider, B. & White, S.S. 2004. Service quality: Research perspectives.
California: Sage Publications Inc.
74. Setlhare, V., Couper, I. & Wright, A. 2014. Patient-centredness: Measuring and
propriety in the Botswana, African and non-Western contexts. African journal
of primary health care & family medicine, 6(1):1-4.
75. Shisana, O. Rehle, T. Louw, J. Zungu-Dirwayi, N. Dana, P. & Rispel, L. 2006.
Public perceptions on national health insurance: Moving towards universal
health coverage in South Africa. South African Medical Journal: 96(9): 814.
76. SADHS, 2003;
Department of Health. 2003. South African Demographic and Health Survey
2003, Full report. Pretoria: Department of Health.
77. SAHR, 2011;
Stellenbosch University https://scholar.sun.ac.za

80
Health Systems Trust. 2011. South African Health Review. Durban: Health
Systems Trust.
URL: http//www.hst.org.za/publications/south African health review 2011.
78. SAHR, 2014;
Health Systems Trust. 2014. South African Health Review. Durban: Health
Systems Trust.
URL: http//www.hst.org.za/publications/south African health review 2014.
79. South African Institute of Race Relations (SAIRR). 2013. Survey South Africa
2013, Johannesburg: South African Institute of Race Relations.
80. Syed, S.A., Nazlee, S. & Shahjahan, K. 2007. Patient satisfaction with health
services in Bangladesh, Health Policy Plan. 2007; 22:263-272.PMid:17999986.
81. Tateke, T., Woldie, M. & & Ololo, S. 2012. Determinants of patient satisfaction
with outpatient health services at public and private hospitals in Addis Ababa,
Ethiopia. Afr J Prm Health Care Fam Med.2012;4(1)
82. Tanser, F., Gijsbertsen, B. & Herbst, K. 2006. Modeling and understanding
primary health care accessibility and utilization in in rural South Africa: an
exploration using geographical information system. Social Science & Medicine
(1982) 63(3): 691-705.
83. Van As, A.B. & Blecher, M. 2003. Value can be added to the health care
system: Opinion. South African Medical Journal. August 2003.93(8). (Accessed
on 7 August 2015).
84. Van Deventer, C. & Sondzaba, N. 2012. The impact of brief quality
improvement (QI) projects by medical students in primary care. Afr J Prm
Health Care Fam Med. 2012.4(11): 6 pages. (Accessed on 4 September 2014).
85. Viljoen, R., Heunis, C., van Rensburg, E., van Rensburg, D., Engelbrecht, M.,
Fourie, A., Steyn, F. & Matebesi, Z. 2000. National primary health care
facilities survey. Bloemfontein: Centre for Health Systems Research &
Development. University of the Orange Free State.
86. Welman, C., Kruger, F. & Mitchell, B. 2005. Research methodology. Cape
Town: Oxford University Press Southern Africa.
87. Western Cape Government Health. 2014. Annual Report 2013/2014.Cape
Town: Western Cape Government. 30 May 2014.
88. Western Cape Government Health. 2013. Annual Report 2012/2013. Cape
Town: Western Cape Government. May 2013.
Stellenbosch University https://scholar.sun.ac.za

81
89. Western Cape Government Health. 2012. Annual Report 2011/2012.Cape
Town: Western Cape Government. 30 August 2012.
90. Western Cape Government Health. 2011. Annual Report 2010/2011.Cape
Town: Western Cape Government. 16 August 2011.
91. World Bank Development Research Group. 2004. Making services work for
poor people: A research program on public services. Washington DC: World
Bank/Development Research Group.
92. World Health Organisation. 2007. Everybody’s business: strengthening health
systems to improve health outcomes: WHO’s framework of action. Geneva:
WHO.
93. Youssef, F., Nel, D., & Bovaird, T. 1995. Service quality in NHS hospitals.
Journal of Management in Medicine, 9:1, 66-74.
94. Zeithaml, V., Parasuraman, A. & Berry, L.L. 1990. Delivering quality service:
balancing customer perceptions and expectations. New York: The Free Press.
Stellenbosch University https://scholar.sun.ac.za

82
ADDENDUMS
ADDENDUM 1: STRUCTURED QUESTIONNAIRE
Each statement was accompanied by a seven point scale anchored at the ends by the
labels Strongly Disagree (=1) and Strongly Agree (=7). The points in-between were
not labelled.
Expectations Section
Directions:
Indicate the extent to which excellent district hospitals have the features below.
By circling the 1 you strongly disagree that excellent district hospitals have that
feature.
By circling the 7 you strongly agree that excellent district hospitals have that
feature.
By circling a number between 1 and 7 you show how strong your feelings are.
There are now right or wrong answers, we interested in the number that best
indicates your expectations of the service quality at excellent district hospitals.
Tangibles
At an excellent district hospital:
1. The physical facilities will look appealing.
2. The staff will look like professionals.
3. The medical equipment will look modern.
4. The communications material will look interesting and informative.
Reliability
At an excellent district hospital:
1. The staff will have the best interest of the patient at heart.
2. The staff will show an interest in solving the problems of patients.
3. The medical account of the patient will be error-free.
4. The staff will provide the service right the first time
5. The staff will keep the commitments they make to patients.
Responsiveness
At an excellent district hospital:
1. The staff will tell patients when services will be performed.
2. The staff will give patients prompt services as soon as they can.
3. The staff will always be willing to help patients.
Stellenbosch University https://scholar.sun.ac.za

83
4. The staff will not appear to be too busy to respond to patient requests.
Assurance
At an excellent district hospital:
1. The behaviour of staff will instil confidence in patients.
2. The patients will feel safe when transacting with the hospital.
3. The staff will be consistently courteous.
4. The staff will have the knowledge to answers patient’s questions.
Empathy
At an excellent district hospital:
1. The operating hours will be convenient to you.
2. Patients will receive individual attention.
3. The staff will understand the need to give personal attention.
4. The need to take patient’s best interests to heart is understood.
5. The staff will understand the specific needs of patients.
Perceptions Section
Directions:
Indicate the extent to which XYZ district hospital has the features below.
By circling the 1 you strongly disagree that XYZ hospital has that feature.
By circling the 7 you strongly agree that XYZ hospital has that feature.
By circling the number between 1 and 7 you show how strong your feelings are.
There are now right or wrong answers, we interested in the number that best
indicates your perceptions about the service quality of XYZ hospital.
Tangibles
At XYZ district hospital:
1. The physical facilities are appealing.
2. The staff members look professional.
3. The medical equipment is modern.
4. The communications material is interesting and informative.
Reliability
At XYZ district hospital:
1. The staff members have the best interest of the patients at heart.
2. The staff members are interested in solving the problems of patients.
3. The medical accounts of patients are error-free.
4. The staff members provide services right the first time.
Stellenbosch University https://scholar.sun.ac.za

84
5. The staff members keep the commitments they make to patients.
Responsiveness
At XYZ district hospital:
1. The staff members tell patients when services will be performed.
2. The staff members render services as soon as they can.
3. The staff members are always willing to help patients.
4. The staff members are not too busy to respond to patient requests.
Assurance
At XYZ district hospital:
1. The behaviour of staff members instils patient confidence.
2. The patients feel safe when transacting with the hospital.
3. The staff members are consistently courteous.
4. The staff members are knowledgeable and are able to answers patient’s questions.
Empathy
At XYZ district hospital:
1. The operating hours are convenient.
2. Patients receive individual attention.
3. The staff members understand the need to give personal attention.
4. The need to take patient’s best interests to heart is understood.
5. The staff members understand the specific needs of patients.
Stellenbosch University https://scholar.sun.ac.za

85
ADDENDUM 2: REDRAFTED QUESTIONNAIRE (ENGLISH)
CLIENT SATISFACTION SURVEY QUESTIONNAIRE ENGLISH
Date (15-Aug-2015)
Inpatient location (Men’s medical ward)
Person number (1,2,3…)
Home language (English, Afrikaans, other)
Question Question Variable Coding
1 What is the name of this facility? Stellenbosch Hospital s
Victoria Hospital v
Hermanus Hospital a
2 What is your age? Value
3 What is your gender? Male m
Female f
4 Do you have private medical coverage? Insured y
Uninsured n
5 What is your highest education qualification? Some primary school p
Some high school h
Matriculation m
Diploma d
Degree g
Each statement is measured on a five point Likert scale anchored at the ends by the labels Strongly Disagree (-2) and Strongly Agree (2). The
points in-between are labelled Disagree (-1), Unsure (0), Agree (1).
Stellenbosch University https://scholar.sun.ac.za
Stellenbosch University https://scholar.sun.ac.za

86
Instructions:
The interviewer must indicate the response of the respondent to each question as follows:
By circling the -2 the respondent indicates they strongly disagree with the statement.
By circling the 2 the respondent indicate they strongly agree with the statement.
By circling a number between -2 and 2 the respondent indicates the extent to which they disagree or agree with a statement.
By circling the number 0 the respondent indicates they unsure and neither fully agree or disagree with the statement.
The respondent cannot make a right or wrong answer.
Expectations section
At an excellent hospital…?
Question Tangibles Strongly
Disagree Disagree Unsure Agree
Strongly
Agree
6 The hospital will be well maintained -2 -1 0 1 2
7 The hospital and the wards will be kept clean and tidy -2 -1 0 1 2
8 The medical equipment in the ward will be working -2 -1 0 1 2
9 The uniforms of the nursing staff will be neat and tidy -2 -1 0 1 2
At an excellent hospital…?
Question Reliability Strongly
Disagree Disagree Unsure Agree
Strongly
Agree
10 The care offered will be more than expected -2 -1 0 1 2
11 The toilets and basins will be working when they used -2 -1 0 1 2
Stellenbosch University https://scholar.sun.ac.za
Stellenbosch University https://scholar.sun.ac.za

87
12 The doctor will do regular rounds to check the condition of patients -2 -1 0 1 2
13 The patient will receive their medication at the correct times -2 -1 0 1 2
14 The nursing staff will check on the patients condition regularly -2 -1 0 1 2
At an excellent hospital …?
Question Responsiveness Strongly
Disagree Disagree Unsure Agree
Strongly
Agree
15 Administration will be able to draw the patient’s medical records
without delay -2 -1 0 1 2
16 The administrative process to admit a patient will not have delays -2 -1 0 1 2
17 On admission, administration will be able to tell the patient if any
payment is due -2 -1 0 1 2
18 The doctor will be able to admit the patient to the hospital without
delay -2 -1 0 1 2
At an excellent hospital …?
Question Assurance Strongly
Disagree Disagree Unsure Agree
Strongly
Agree
19 The provincial health department will capacitate the hospital to
provide high quality care -2 -1 0 1 2
20 The hospital will be well managed -2 -1 0 1 2
21 The nursing staff will be well trained -2 -1 0 1 2
22 The nursing staff will be courteous -2 -1 0 1 2
At an excellent hospital …?
Question Empathy Strongly
Disagree Disagree Unsure Agree
Strongly
Agree
Stellenbosch University https://scholar.sun.ac.za
Stellenbosch University https://scholar.sun.ac.za

88
23 The hospital will respect my privacy -2 -1 0 1 2
24 The doctor who treats me will be polite -2 -1 0 1 2
25 The nursing staff will not be too busy to assist me when I ask -2 -1 0 1 2
26 The nursing staff will give me personal attention -2 -1 0 1 2
27 The nursing staff will listen to my problems -2 -1 0 1 2
Perceptions section
At this hospital…?
Question Tangibles Strongly
Disagree Disagree Unsure Agree
Strongly
Agree
28 The hospital is well maintained -2 -1 0 1 2
29 The hospital and the wards are kept clean and tidy -2 -1 0 1 2
30 The medical equipment in the ward is working -2 -1 0 1 2
31 The uniforms of the nursing staff is neat and tidy -2 -1 0 1 2
At this hospital…?
Question Reliability Strongly
Disagree Disagree Unsure Agree
Strongly
Agree
32 The care I received was more than I expected -2 -1 0 1 2
33 The toilets and basins were working when I used them -2 -1 0 1 2
34 The doctor did regular rounds to check on my condition -2 -1 0 1 2
35 I received my medication at the correct times -2 -1 0 1 2
36 The nursing staff checked on my condition regularly -2 -1 0 1 2
Stellenbosch University https://scholar.sun.ac.za
Stellenbosch University https://scholar.sun.ac.za

89
At this hospital…?
Question Responsiveness Strongly
Disagree Disagree Unsure Agree
Strongly
Agree
37 Administration was able to draw my medical records without delays -2 -1 0 1 2
38 The administrative process to admit me had no delays -2 -1 0 1 2
39 On admission, administration was able to tell me if I any payment was
due -2 -1 0 1 2
40 The doctor was able to admit me to the hospital without delay -2 -1 0 1 2
At this hospital…?
Question Assurance Strongly
Disagree Disagree Unsure Agree
Strongly
Agree
41 The provincial health department has capacitated the hospital to
provide high quality care -2 -1 0 1 2
42 The hospital is well managed -2 -1 0 1 2
43 The nursing staff are well trained -2 -1 0 1 2
44 The nursing staff are courteous -2 -1 0 1 2
At this hospital…?
Question Empathy Strongly
Disagree Disagree Unsure Agree
Strongly
Agree
45 The hospital respected my privacy -2 -1 0 1 2
46 A doctor who treated me was polite -2 -1 0 1 2
47 The nursing staff were not too busy to assist me when asked -2 -1 0 1 2
48 The nursing staff gave me personal attention -2 -1 0 1 2
49 The nursing staff listened to my problems -2 -1 0 1 2
Stellenbosch University https://scholar.sun.ac.za
Stellenbosch University https://scholar.sun.ac.za

90
ADDENDUM 3: REDRAFTED QUESTIONNAIRE (AFRIKAANS)
CLIENT SATISFACTION SURVEY QUESTIONNAIRE AFRIKAANS
Datum (15-Aug-2015)
Inpatient lokaal (Mans saal)
Persoon nommer (1,2,3…)
Taal (English, Afrikaans, other)
Vraag Vraag Variable Kode
1 Wat is die naam van die fasiliteit? Stellenbosch Hospitaal s
Victoria Hospitaal v
Hermaus Hospitaal a
2 Wat is jou ouderdom? Value
3 Wat is jou geslag? Manlik m
Vroulik f
4 Het jy mediese dekking? Versekering y
Onversekering n
5 Wat is jou hoogste kwalifikasie? Party primere skool p
Party hoeskool h
Matriek m
Diploma d
Graad g
Elke verklaring is gemeet op n vyf put Likert skaal met die opskrif Sterk Nie Instem (-2) and Sterk Instem (2). TDie tussen punte se opskrif is
Nie Instem (-1), Onseker (0), Iinstem (1)
Stellenbosch University https://scholar.sun.ac.za
Stellenbosch University https://scholar.sun.ac.za

91
Instruksies:
Die ondervraer moet aandui wat die antwword op elke vraag is:
Deur n sirkel te trek om die -2 om Sterk Nie Instem aan te dui.
Deur n sirkel te trek om die 2 om Sterk Instem aan te dui.
Deur n sirkel te trek tussen -2 en 2 om die tussen stem ann te dui.
Deur n sirkel te trek om 0 om onsekerhuid aan te dui.
Die respondent kan nie n reg of verkeerd antwoord gee.
Verwagting afdeling
In n uitnemende hospitaal…?
Vraag Tangibles Sterk Nie
Instem
Nie
Instem Onseker Instem
Sterk
Instem
6 Die hospital sal goed instand wees -2 -1 0 1 2
7 Die hospitaal en die sale sal skoon en netjies wees -2 -1 0 1 2
8 The mediese toerusting in die saal sal werk -2 -1 0 1 2
9 The univorms van die verpleegsters sal skoon en netjies wees -2 -1 0 1 2
In n uitnemende hospitaal…?
Vraag Reliability Sterk Nie
Instem
Nie
Instem Onseker Instem
Sterk
Instem
10 Die sorg sal meer wees as wat n pasient verwag -2 -1 0 1 2
11 Die toilet en wasbakke sal werk wanneer die pasient dit gebruik -2 -1 0 1 2
Stellenbosch University https://scholar.sun.ac.za
Stellenbosch University https://scholar.sun.ac.za

92
12 Die doktor sal gereelde ronde doen on die pasient se kondisie te
waarneem -2 -1 0 1 2
13 Die pasient sal sy medikasie op die regte tye kry -2 -1 0 1 2
14 Die verpleegsters sal die pasient se kondisie gereeld waarneem -2 -1 0 1 2
In n uitnemende hospitaal…?
Vraag Responsiveness Sterk Nie
Instem
Nie
Instem Onseker Instem
Sterk
Instem
15 Administrasie sal die pasient se mediese rekords kan trek sonder enige
vertraging -2 -1 0 1 2
16 Daar sal geen vertraging in die Administratiewe proses met inname
wees -2 -1 0 1 2
17 Op inname, sal Administrasie die pasient kan inlig of enige fooie gehef
word -2 -1 0 1 2
18 Die doktor sal die pasient kan inneem in die hospital sonder enige
vertraging -2 -1 0 1 2
In n uitnemende hospitaal…?
Vraag Assurance Sterk Nie
Instem
Nie
Instem Onseker Instem
Sterk
Instem
19 Die provinsiale gesondheids afdeling sal die hospitaal in staat stel on
hoe kwalitieit sorg te lewer -2 -1 0 1 2
20 Die hospital sal onder goeie bestuur wees -2 -1 0 1 2
21 Die verpleegsters sal goed opgelei wees -2 -1 0 1 2
22 Die verpleegsgters sal beskaafd wees -2 -1 0 1 2
Stellenbosch University https://scholar.sun.ac.za
Stellenbosch University https://scholar.sun.ac.za

93
In n uitnemende hospitaal…?
Vraag Empathy Sterk Nie
Instem
Nie
Instem Onseker Instem
Sterk
Instem
23 Die hospital sal die privaatheid van die pasient respekteer -2 -1 0 1 2
24 Die doktor wie die pasient behandel sal goed gesind wees -2 -1 0 1 2
25 Die verpleegters sal nie te besig wees om die pasient te help as gevra -2 -1 0 1 2
26 Die verpleegsters sal die pasient persoonlike aandag gee -2 -1 0 1 2
27 Die verpleegsters sal luister na die pasient se probleme -2 -1 0 1 2
Persepsie afdeling
By die hospitaal…?
Vraag Tangibles Sterk Nie
Instem
Nie
Instem Onseker Instem
Sterk
Instem
28 Die hospital is goed instand gehou -2 -1 0 1 2
29 Die hospitaal en die sale is skoon en netjies -2 -1 0 1 2
30 The mediese toerusting in die saal werk -2 -1 0 1 2
31 The univorms van die verpleegsters is skoon en netjies -2 -1 0 1 2
By die hospitaal…?
Vraag Nie Saamstem Sterk Nie
Instem
Nie
Instem Onseker Instem
Sterk
Instem
32 Die sorg is meer as wat ek verwag het -2 -1 0 1 2
33 Die toilet en wasbakke werk wanneer ek dit gebruik -2 -1 0 1 2
Stellenbosch University https://scholar.sun.ac.za
Stellenbosch University https://scholar.sun.ac.za

94
34 Die doktor doen gereelde ronde on my kondisie te waarneem -2 -1 0 1 2
35 Ek kry my medikasie op die regte tye -2 -1 0 1 2
36 Die verpleegsters hou waarneming oor my my kondisie -2 -1 0 1 2
By die hospitaal…?
Vraag Responsiveness Sterk Nie
Instem
Nie
Instem Onseker Instem
Sterk
Instem
37 Administrasie het my mediease rekords getrek sonder enige vertraging -2 -1 0 1 2
38 Daar was geen vertraging in die Administratiewe proses met inname -2 -1 0 1 2
39 Op inname, Administrasie kon my inlig of enige fooie gehef is -2 -1 0 1 2
40 Die doktor kon my inneem in die hospital sonder enige vertraging -2 -1 0 1 2
By die hospitaal…?
Vraag Assurance Sterk Nie
Instem
Nie
Instem Onseker Instem
Sterk
Instem
41 Die provinsiale gesondheids afdeling het die hospitaal in staat gestel on
hoe kwalitieit sorg te lewer -2 -1 0 1 2
42 Die hospital is onder goeie bestuur -2 -1 0 1 2
43 Die verpleegsters is goed opgelei -2 -1 0 1 2
44 Die verpleegsgters is beskaafd -2 -1 0 1 2
By die hospitaal…?
Vraag Empathy Sterk Nie
Instem
Nie
Instem Onseker Instem
Sterk
Instem
45 Die hospital respekteer my privaatheid -2 -1 0 1 2
Stellenbosch University https://scholar.sun.ac.za
Stellenbosch University https://scholar.sun.ac.za

95
46 Die doktor wie my behandel is goed gesind -2 -1 0 1 2
47 Die verpleegters is nie te besig on my te help as ek vra -2 -1 0 1 2
48 Die verpleegsters gee my persoonlike aandag -2 -1 0 1 2
49 Die verpleegsters luister na my probleme -2 -1 0 1 2
Stellenbosch University https://scholar.sun.ac.za
Stellenbosch University https://scholar.sun.ac.za

96
ADDENDUM 4: CONSENT TO PARTICIPATE IN RESEARCH FORM
STELLENBOSCH UNIVERSITY
CONSENT TO PARTICIPATE IN RESEARCH
Health Service Delivery in the Western Cape: A Measurement of Perceptions
You are asked to participate in a research study conducted by F Whitford, HonsBPA, from the School of Public Leadership at Stellenbosch University. The results of the research will contribute to the completion of a thesis on patient perceptions at hospitals. You were selected as a possible participant in this
study because you were admitted to this hospital and would have experienced what the facility has to offer and the manner in which the staff care for
patients.
1. PURPOSE OF THE STUDY
To measure the service quality perceptions of hospital patients in the Western Cape
2. PROCEDURES
If you volunteer to participate in this study, we would ask you to do the following things:
1. Provide the researcher with the following biographical details: age, gender, medical cover status, and education status.
2. Answer the questions posed by the researcher who will complete the research questionnaire in an open and honest manner.
Stellenbosch University https://scholar.sun.ac.za
Stellenbosch University https://scholar.sun.ac.za

97
3. Ask for an explanation if any questions are unclear or difficult to understand, before answering. 4. Feel free to terminate the interview if any questions are considered too personal or they compromise your privacy.
5. After the interview, feel free to offer your opinion of the interview process. Your participation in the study is subject to the following:
1. You were randomly selected from all the patients admitted to the hospital. 2. The interview should not take more than ten minutes for your time. 3. Your interview is a once-off process and will not be repeated.
4. The hospital staff will indicate where you will be interviewed in the hospital.
3. POTENTIAL RISKS AND DISCOMFORTS
There will be no medical or emotional risk to you, if you take part in the survey. You are not required to discuss any matter other than your perceptions of
service quality as outlined in the questionnaire. Your response will be confidential and will not prejudice you or the staff of the hospital.
4. POTENTIAL BENEFITS TO SUBJECTS AND/OR TO SOCIETY
You will not receive any direct benefit by taking part in the study. However, the results of the study will enable recommendations to be made to the
provincial health department on how to achieve a better patient experience.
5. CONFIDENTIALITY
Any information that is obtained in connection with this study will remain confidential as required by law. Confidentiality of research data will be maintained
by means of secure storage on a database with reasonable network and folder security loaded. Data will be coded by the investigator using official forms
from the University and data will be processed by the Statistical Unit at the university.
If at any time information is disclosed to a third party, the disclosure will be meet the requirements set by the university.
No activity related to the study will be audio- or videotaped.
The results of the study will be published in a report under the copyright of the University.
Stellenbosch University https://scholar.sun.ac.za
Stellenbosch University https://scholar.sun.ac.za

98
6. PARTICIPATION AND WITHDRAWAL
You are free to choose whether or not to participate in this study and to withdraw at any time without any consequences. Your participation is anonymous and you may also refuse to answer some questions and still remain in the study.
The investigator may exit the interview if circumstances arise which warrant doing so.
7. IDENTIFICATION OF INVESTIGATORS
If you have any questions or concerns about the investigator or the study, please feel free to contact Prof. Erwin Schwella at the School of Public Leadership,
Stellenbosch University, at (021) 918 4122.
8. RIGHTS OF RESEARCH SUBJECTS
You may withdraw your consent to participate in the study at any time and without any penalty. You are not waiving any legal claims, rights or remedies
because of your participation in this research study. If you have questions regarding your rights as a research subject, contact Ms Maléne Fouché [[email protected]; 021 808 4622] at the Division for Research Development.
SIGNATURE OF RESEARCH SUBJECT OR LEGAL REPRESENTATIVE
The information above was described to me by F Whitford in English/Afrikaans and I am in command of this language or it was satisfactorily translated to
me. I was given the opportunity to ask questions and these questions were answered to my satisfaction.
I hereby consent voluntarily to participate in this study. I have been given a copy of this form.
________________________________________
Name of Subject/Participant
Stellenbosch University https://scholar.sun.ac.za
Stellenbosch University https://scholar.sun.ac.za

99
________________________________________ Name of Legal Representative (if applicable)
________________________________________ ______________
Signature of Subject/Participant or Legal Representative Date
SIGNATURE OF INVESTIGATOR
I declare that I explained the information given in this document to __________________ [name of the subject/participant] and/or [his/her] representative
____________________ [name of the representative]. [He/she] was encouraged and given ample time to ask me any questions. This conversation was
conducted in [Afrikaans/*English/*Xhosa/*Other] and [no translator was used/this conversation was translated into ___________ by
_______________________].
________________________________________ ______________
Signature of Investigator Date
Stellenbosch University https://scholar.sun.ac.za
Stellenbosch University https://scholar.sun.ac.za

100
ADDENDUM 5: STELLENBOSCH UNIVERISTY HUMANITIES ETHICS APPROVAL (1)
Approved with Stipulations New Application 17-Nov-2014
WHITFORD, Frederick John
Proposal #: DESC/Whitford/Nov2014/15
Title: Health Service Delivery in the Western Cape: A measurement of perceptions
Dear Mr Frederick WHITFORD,
Your New Application received on 06-Nov-2014, was reviewed
Please note the following information about your approved research proposal:
Proposal Approval Period: 13-Nov-2014 -12-Nov-2015
The following stipulations are relevant to the approval of your project and must be adhered to:
Regarding the informed consent form:
The researcher should re-draft the consent form in the second person, addressing the prospective participants in simple, friendly language at
a Grade 7 to 8 reading level. Please rephrase or avoid all technical terms throughout this document. Kindly submit the revised informed
consent form to the DESC and REC for review and approval.
Please provide a letter of response to all the points raised IN ADDITION to HIGHLIGHTING or using the TRACK CHANGES function to indicate
ALL the corrections/amendments of ALL DOCUMENTS clearly in order to allow rapid scrutiny and appraisal.
Please take note of the general Investigator Responsibilities attached to this letter. You may commence with your research after complying fully with
these guidelines.
Please remember to use your proposal number (DESC/Whitford/Nov2014/15) on any documents or correspondence with the REC concerning your
research proposal.
Please note that the REC has the prerogative and authority to ask further questions, seek additional information, require further modifications, or monitor
the conduct of your research and the consent process.
Also note that a progress report should be submitted to the Committee before the approval period has expired if a continuation is required. The
Committee will then consider the continuation of the project for a further year (if necessary).
This committee abides by the ethical norms and principles for research, established by the Declaration of Helsinki and the Guidelines for Ethical
Research: Principles Structures and Processes 2004 (Department of Health). Annually a number of projects may be selected randomly for an external
audit.
National Health Research Ethics Committee (NHREC) registration number REC-050411-032.
We wish you the best as you conduct your research.
If you have any questions or need further help, please contact the REC office at 218089183.
Included Documents:
Informed consent form
DESC application
Research proposal
WCDoH request for permission
Questionnaire
Sincerely,
Stellenbosch University https://scholar.sun.ac.za
Stellenbosch University https://scholar.sun.ac.za

101
Clarissa Graham
REC Coordinator
Research Ethics Committee: Human Research (Humanities)
Investigator Responsibilities Protection of Human Research Participants Some of the general responsibilities investigators have when conducting research involving human participants are listed below:
1.Conducting the Research. You are responsible for making sure that the research is conducted according to the REC approved research protocol. You are
also responsible for the actions of all your co-investigators and research staff involved with this research. You must also ensure that the research is
conducted within the standards of your field of research.
2.Participant Enrollment. You may not recruit or enroll participants prior to the REC approval date or after the expiration date of REC approval. All
recruitment materials for any form of media must be approved by the REC prior to their use. If you need to recruit more participants than was noted in
your REC approval letter, you must submit an amendment requesting an increase in the number of participants.
3.Informed Consent. You are responsible for obtaining and documenting effective informed consent using only the REC-approved consent documents,
and for ensuring that no human participants are involved in research prior to obtaining their informed consent. Please give all participants copies of the
signed informed consent documents. Keep the originals in your secured research files for at least five (5) years.
4.Continuing Review. The REC must review and approve all REC-approved research proposals at intervals appropriate to the degree of risk but not less
than once per year. There is no grace period. Prior to the date on which the REC approval of the research expires, it is your responsibility to submit
the continuing review report in a timely fashion to ensure a lapse in REC approval does not occur. If REC approval of your research lapses, you
must stop new participant enrollment, and contact the REC office immediately.
5.Amendments and Changes. If you wish to amend or change any aspect of your research (such as research design, interventions or procedures, number
of participants, participant population, informed consent document, instruments, surveys or recruiting material), you must submit the amendment to the
REC for review using the current Amendment Form. You may not initiate any amendments or changes to your research without first obtaining written
REC review and approval. The only exception is when it is necessary to eliminate apparent immediate hazards to participants and the REC should be
immediately informed of this necessity.
6.Adverse or Unanticipated Events. Any serious adverse events, participant complaints, and all unanticipated problems that involve risks to participants
or others, as well as any research related injuries, occurring at this institution or at other performance sites must be reported to Malene Fouch within five
(5) days of discovery of the incident. You must also report any instances of serious or continuing problems, or non-compliance with the RECs
requirements for protecting human research participants. The only exception to this policy is that the death of a research participant must be reported in
accordance with the Stellenbosch Universtiy Research Ethics Committee Standard Operating Procedures. All reportable events should be submitted to
the REC using the Serious Adverse Event Report Form.
7.Research Record Keeping. You must keep the following research related records, at a minimum, in a secure location for a minimum of five years: the
REC approved research proposal and all amendments; all informed consent documents; recruiting materials; continuing review reports; adverse or
unanticipated events; and all correspondence from the REC
8.Provision of Counselling or emergency support. When a dedicated counsellor or psychologist provides support to a participant without prior REC
review and approval, to the extent permitted by law, such activities will not be recognised as research nor the data used in support of research. Such
cases should be indicated in the progress report or final report.
9.Final reports. When you have completed (no further participant enrollment, interactions, interventions or data analysis) or stopped work on your
research, you must submit a Final Report to the REC.
10.On-Site Evaluations, Inspections, or Audits. If you are notified that your research will be reviewed or audited by the sponsor or any other external
agency or any internal group, you must inform the REC immediately of the impending audit/evaluation.
Stellenbosch University https://scholar.sun.ac.za
Stellenbosch University https://scholar.sun.ac.za

102
ADDENDUM 6: STELLENBOSCH UNIVERISTY HUMANITIES ETHICS
APPROVAL (2)
Stellenbosch University https://scholar.sun.ac.za

103
ADDENDUM 7: WC HEALTH APPROVAL TO ACCESS HOSPITALS (1)
Stellenbosch University https://scholar.sun.ac.za

104
ADDENDUM 8: WC HEALTH APPROVAL TO ACCESS HOSPITALS (2)
Stellenbosch University https://scholar.sun.ac.za

105
ADDENDUM 9: CLASSIFICATION OF FACILITIES
1. Clinic
Is a permanent structure offering a range of Primary Healthcare (PHC) services, at
least eight hours a day, four days a week.
2. Satellite Clinic
Is a permanent structure where one or more rooms are equipped to provide PHC
services, at least eight hours a day, four days a week.
3. Community Day Centre
Is a permanent facility offering a broad range of PHC services, including accident
and emergency services, but excluding midwifery and surgery under general
anaesthesia. It is not a 24-hour facility.
4. Community Health Centre
Isa permanent facility offering a broad range of PHC services on a 24-hour basis,
including accident and emergency and midwifery, but excluding surgery under
general anaesthesia.
5. Specialised Health Centre (SHC)
Is a facility offering specialised care to a specific group of patients. A Maternal
Obstetric Unit is a common SHC.
6. District Hospital (Level 1 Hospital)
Isa facility offering inpatient and outpatient services within the scope of general
practitioners. The facility has operating theatres where surgery under general
anaesthesia is performed.
7. Regional Hospital (Level 2 Hospital)
Is a facility where care is provided by medical practitioners and specialists. The
specialist care would be in surgery, medicine, orthopaedics, paediatrics, obstetrics,
gynaecology and psychiatry.
8. Tertiary Hospital (Level 3 Hospital)
In addition to the services offered at a regional hospital, the tertiary hospital offers
intensive care services, receives referrals from regional hospitals and is not limited
by provincial boundaries.
9. National Central Hospital (Level 3 Hospital)
In addition to the services provided by tertiary hospitals, the central hospital
provides central and national referral services. A central hospital is attached to a
medical school and is a research centre.
10. Specialised Hospital
Isa hospital focused on one or more specialities, for instance psychiatry and TB.
(Source: HST Audit, 2012)
Stellenbosch University https://scholar.sun.ac.za