health professional shortage area (hpsa) join the hpsa tour
TRANSCRIPT

Health Professional Shortage Area (HPSA)
Join the HPSA Tour
Shortage Designation Program (SDP) Introduces
W E L C O M E

Topics to be Covered
2
Differences between all 3 Disciplines
Introduction amp Overview
Similarites between all 3 Disciplines
RSA amp MSSA
MUA amp MUP Designations
HPSA Scores Auto HPSAs Acronyms amp Resources
Purpose and Training Objectives
3
To identify areas of greatest need so limited resources can be prioritized and directed to the people in those areas
To increase the understanding of the HPSA and MUAMUP criteria and application process
To increase the quality and completeness of applications submitted for designations and therefore reduce the time period from submission to final determination
To foster collaboration among community participants
Purpose of Designations
Training Objectives
Shortage Designations
4
Health Professional Shortage Area (HPSA) designation which is a prerequisite to apply for National Health Service Corps (NHSC) recruitment assistance The HPSA designation disciplines are primary medical care mental health and dental care
Shortage designations are based on the evaluation of criteria established through regulation to identify geographic areas or population groups with a shortage of primary health care services There are two types of shortage designations each linked to the federal Bureau of Health Workforce (BHW) activity or function
Medically Underserved AreaMedically Underserved Population (MUAMUP)designation which is a prerequisite to requesting grant awards to plan develop and operate a community health center under Section 330 of the Public Health Service Act
Other Federal and State programs also use these shortage designations
Primary Care Officersquos (PCO) Role
5
Identify areas with underserved populations limited access to health professionals or health disparities
Development
Technical Assistance
Assist applicants in developing designation applications
Provide technical assistance to entities within the State preparing designation applications
Provide information within the State on types of designations
Oversight
Validate information contained in applications
Assure that all appropriate entities receive copies of designation applications such as County officials Primary Care Association Medical Dental and Mental Societies etc
Submit updated information (annual review process) by the SDB due dates
Coordinate with other State offices to obtain State databases for designation purposes eg licensure lists state population estimates physician database and Geographic Information System (GIS) database development
Primary Care Officersquos (PCO) Staff
6
Prim
ary
Care
Offi
ce
Liz Martin Chief Access to Care Section Telephone (916) 326-3706 Email LizMartinoshpdcagov
Hovik Khosrovian ManagerShortage Designation Program Telephone (916) 326-3734 Email HovikKhosrovianoshpdcagov
Kyra van den Bogert Program AnalystProactive Shortage Designations Telephone (916) 326-3632Email KyraVanDenBogertoshpdcagov
Richard Creer Program Analyst Mental Health Shortage Designations Telephone (916) 326-3715 Email RichardCreeroshpdcagov
Bally Nagra Program Analyst Proactive Shortage Designations Telephone (916) 326-3714 Email BaljinderNagraoshpdcagov
Carol Petuela Program Analyst Shortage Designation ProgramTelephone (916) 326-3716 Email CarolPetuelaoshpdcagov
PCO Number916-326-3700
Call for information on current designations copies of guidelines criteria HPSA or MUAMUP list etc
Authority
7
Prim
ary
Care
Offi
ce Original legislation enacted by Congress in 1970s Sections 330 (MUAP) and 332 (HPSA) of the
US Public Health Service Act (as amended) Health Care Safety Net Amendments authorized automatic facility HPSA process for FQHCs and RHCs
Development
Criteria
Authorizes the Secretary of US Department of Health and Human Services (DHHS) to designate shortage areas delegated to HRSA
Developed to implement legislation required to publish in Federal Register requiredSecretary of DHHS and Office of Management Budget approval
First issued 1970s periodic revisions - last revision 1992 (mental health)
Administrative policies and procedures to implement program
Issued by HRSA
Guidelines
Ratio
nal S
ervi
ce A
rea
Shortage Designation Option NHSC RHC J-1 Visa Waiver
Medicare Incentive
FQHCs amp LALsCHCs New Start Expansion
Primary Care (area only) X X X X
Primary Care (pop only) X X X
Dental Health(area amp pop)
X
Mental Health (area only) X X X
Mental Health (pop only) X X
Facility X X
MUA X X X
MUP X X
State Governorrsquos Certified Eligible Area (for RHC purposes only)
X(Not in CA)
Selected Federal Programs
8
HPSA required
HPSA MUA or MUP required
Medicare Rural Hospital Flexibility Program Small Rural Hospital Improvement ProgramRural Health Services Development Program (DHCS)Seasonal Agricultural amp Migratory Workers Program (DHCS)
NHSCState Loan Repayment Program (OSHPD)J-1 Visa Waiver Program (DHCS)
HPSA required
NHSC (BHPr)
10 Medicare Incentive Payment (CMS)
MUA or MUP required
CHCs (BPHC)
New StartExpansion (BPHC)
FQHCs Look-Alike (BPHC)
MUA or MUP required
J-1 Visa Waiver Program (HRSA)
HPSA or MUA required
Rural Health Clinic Certification (CMS)
These programs are no longer funded by the State of California
Designation Requirements
Federal Programs State Programs
9
Health Professions Education Foundation (HPEF) Programs (wwwoshpdcagovhpef)
Overlap
Exceed travel time between population centers
Be smaller than a census tract
Types of Rational Service Areas
10
Applies to all types HPSA and MUAMUP designations
Sub-County MSSA
Whole County MSSA
Medical Service Study Areas (MSSAs) ndash recognized by HRSArsquos Office of Shortage Designation (OSD) as rational services areas
Have more than one HPSA designation per discipline (eg geographic and low-income population)
Have interior portions carved out
RSAs Cannot
Type
s of
RSA
s
Types of RSAs
MSSAs will not cross county lines
Population range 75000 to 125000
Reflect recognized community and neighborhood boundaries
Each MSSA is composed of one or more complete census tracts
All population centers within the MSSA are within 30 minutes travel time to the largest population center
11
Adopted by the California Healthcare Workforce Policy Commission on May 29 2013
Similar demographic and socio-economic characteristics
Population density of less than 250 persons per square mile
No population center exceed 50000
Population density of less than 11 persons per square mile
What is an MSSA
Rural MSSAUrban MSSA
Frontier MSSA
MSSA Definitions
US Public Health Service recognizes MSSAs as ldquorational service areasrdquo for purposes of determining Health Professional Shortage Areas (HPSAs) and Medically Underserved AreasMedically Underserved Populations (MUAsMUPs)
Major Uses of MSSAs
12
MSSAs are a principal component for display of large databases through OSHPDrsquos Geographic Information System (GIS)
MSSAs have the potential for assisting in needs assessment health planning and health policy development
Whole County MSSA
Sub-County MSSA
Major Uses of MSSAsTypes of MSSAs
Origin National Health Service Corps (NHSC) (Measures the shortage of health professionals in an area)
a Geographic Areab Population Groupc Facility
Rational Service Areas (HPSAs ndash RSAs)
The criteria used to determine if a service area is rationalThe characteristics of a HPSARSA
Objective
Health Professional Shortage Area
Components
a Rational Service Area (RSA)b Population to Provider Ratioc Contiguous Area Analysis
Disciplines
a Primary Medical Careb Dental Health Carec Mental Health Care
Type of Designations
13
HPSAs amp RSAs
14
Primary Care - Humboldt County
15
Dental Health - Humboldt County
16
Mental Health - Humboldt County
Three Disciplines ndash Similarites amp Differences
Similarities amp Differences
Primary Care
Dental Health
Mental Health
17
Similaritiesthe
Three Disciplines ndash The Similarities
18
Contiguous Area Analysis
The Nearest Source of Care
Non-Responder Calculation
MFW Tourists Seasonal Residents amp Homeless Geographic Designations amp Population Designations
Identify the boundaries amp Determine the available resources
Geographic Designation Can be in a Low-Income HPSA
Can be Excessively Distant
Cannot have a Disparity
Can be Overutilized
What FTE to includeexclude in your survey
Population Designation Cannot be a HPSA of any type
Geographic Designations
Migrant FarmworkersData from the 2000 Migrant and Seasonal Farmworker Enumeration Profiles Study or other approved source (must include methodology)
Homeless Local data (must include methodology)
Seasonal Residents Those who maintain a residence in the area but inhabit it
for only 2-8 month year (Use census or local data which must include methodology)
Tourists Formula 025 X [fraction of year present] X [average daily number of tourists] (Use local data which must include methodology and length of stay)
Resident Civilian Population = Total permanent population in the service area (non-institutionalized population)
Source 2010 US Census and 5-year American Community Survey Population Estimates
Inmates or individuals in institutions (eg nursing homes prisons college dormitories military installations Native Americans on reservations etc)
Can Add
MFW Tourists Seasonal Residents amp Homeless
Exclude
19
Source 2010 US Census and 5-year American Community Survey
Population Estimates Note cannot add MFW Tourists Seasonal Residents or Homeless to Mental Health
Note adding any of the above will increase the Pop to Provider Ratio
of the proposed area
Population Designations
20
Can Add
Number of individuals in the service area that are at or below 200 of the Federal poverty level Must be gt 30 of the population in the service area
Source 2012 5-year ACS Population estimates
Migrant FarmworkersData from the 2000 Migrant and
Seasonal Farmworker Enumeration Profiles Study or other approved source (must include methodology)
Number of individuals in the service area who are migrant farmworkers adjusted for the fraction of the year they are in the service area
Source Statelocal data amp 2000 Migrant amp Seasonal Farmworker Enumeration Profiles Study
Number of individuals in the service area that are Native Americans or Native AlaskansSource 2000 census data
Homeless Local data (must include
methodology)
Must be of the population in the service area
Migrant Farmworker Population
Native AmericanAlaskan Population
MFW Tourists Seasonal Residents amp Homeless
Low-Income Population
gt 30
California All Agricultural Workers Estimates
21
County
Adjusted MSFWFarmworker
EstimatesMigrant
FarmworkersSeasonal
Farmworkers
Non-FarmworkersIn Migrant
Households
Non-FarmworkersIn SeasonalHouseholds
MSFWFarmworkers
And Non-Farmworkers
Alameda 1148 531 616 195 699 2043Alpine 0 0 0 0 0 0Amador 737 341 396 125 449 1311Butte 7263 3363 3900 1236 4426 12925Calaveras 135 63 73 23 83 241Colusa 13932 6450 7481 2371 8490 24792Contra Costa 2470 1144 1326 420 1505 4395Del Norte 604 280 325 103 368 1076El Dorado 960 444 515 163 585 1708Fresno 145919 67561 78359 24828 88917 259665Glenn 3747 1735 2012 638 2283 6668Humboldt 935 433 502 159 570 1664Imperial 29312 13572 15741 4988 17862 52162Inyo 71 33 38 12 43 126Kern 92142 42662 49480 15678 56148 163968Kings 16592 7682 8910 2823 10111 29526Lake 2911 1348 1563 495 1774 5181Lassen 544 252 292 93 331 968Los Angeles 14180 6566 7615 2413 8641 25234
Migrant Farmworkers (MFW)
22
Add 1396 MFW to 100 civilian population
MFW calculation for proposed area MSSA 71 in Butte County
200 Poverty MFW
MFW for Butte county from enumeration study 3363
200 poverty for proposed area MSSA 71 38376
200 poverty for entire Butte county 84764
Calculation
Divide the 200 poverty for proposed area by the 200 poverty for the entire county
38376 84764 = 4527
Multiply the MFW for county by percentage above 3363 4527 = 1523
Divide the number of months the MFW works per year by the total months in the year (if less than 12)
11 12 = 9166
Multiply the MFW by the percentage above 1523 9166 = 1396
Contiguous Area Analysis
23
Participants will understand how to identify the contiguous areas determine if they have resources and if the resources are inaccessible to the population of the area proposed for designation
Objective amp Purpose
The Steps (determine the available resources)
Are there significant socio-economicdemographic disparities or physical barriers
Determine if the contiguous arearsquos providers are located gt 3040 minutes away from the population center of the proposed area and therefore are excessively distant
Determine if the resources in the contiguous area exceed the population-to-provider ratio and therefore are overutilized
If the contiguous area cannot be ruled-out by one of these
methods the proposed area cannot be designated
Is the contiguous area a HPSA The next slide will explain more about what HPSAs to rule out
Is the Contiguous Area a HPSA
24
Check the HPSA status of each contiguous area to determine if this type of HPSA is inaccessible to the proposed area
Geographic without high needs
Then the contiguous area is inaccessible if it is a Geographic HPSA
Geographic with high needs
Then the contiguous area is inaccessible if it is a Geographic HPSA (this is a significant change)
Low-Income HPSA
Then the contiguous area is inaccessible if it is a Geographic HPSA or Low-Income HPSA
If the proposed service area is Contiguous
Areas
Calculating Disparities for Percentages gt 15
25
Significant demographic disparities between the population in the service area and the population in the contiguous area result in the population being isolated from nearby resources
Use (2 N) to determine a disparity between the population in the service area and the population in the contiguous area
MSSA 35bClovis WestFresno East in Fresno County
Proposed Area Civilian Pop
White BlackNative
American AsianPacific
Islander Hispanic 100 200
Compareeach contiguous area to the proposed
area in the same category
If the highest number is greaterThan 2 the lowest number
then a disparity exist
93336 6021 5374 120 1243 057 3221 1594 3242
Contiguous Area Desig Pop White BlackNative
American AsianPacific
Islander Hispanic 100 200
MSSA 35dFresno E 65008 3978 2614 143 1698 007 5869 3411 6500
The lowest = 2614 2 = 5228 Is the higher 5374
greater than 5228 if yes = Disparity Exist
MSSA 35eFresno S 52848 4522 1049 105 1164 013 6031 3114 6031
The lowest = 1594 2 = 3188Is the higher 3114
greater than 3188If no = Disparity does not Exist
MSSA 35aFresno NW 29861 2791 431 045 1154 003 2247 599 1889
The lowest = 2791 2 = 5582Is the higher 6021 greater than 5582
If yes = Disparity Exist
Black
100
White
Note Using the lower number between proposed area and contiguous area for calculating disparity is suggested
Calculating Disparities for Percentages lt 15
26
Significant demographic disparities between the population in the service area and the population in the contiguous area result in the population being isolated from nearby resourcesPlus 15 to determine a disparity between the population in the service area and the population in the contiguous area
MSSA 35bClovis WestFresno East in Fresno County
Proposed Area Civilian
Pop White BlackNative
American AsianPacific
Islander Hispanic 100 200
Compareeach contiguous area to the proposed
area in the same category
If the highest number is greaterThan the lowest number plus 15
then a disparity exist
93336 6021 5374 120 1243 057 3221 1294 3242
Contiguous Area Desig Pop White BlackNative
American AsianPacific
Islander Hispanic 100 200
MSSA 35dFresno E 65008 3978 1485 143 1698 007 5869 3411 6500
The lowest = 1485 + 15 = 2985Is the higher 5374greater than 2985
if yes = Disparity Exist
MSSA 35eFresno S 52848 4522 1049 105 1164 013 6031 2114 6031
The lowest = 1294 + 15 = 2794Is the higher 2114
greater than 2794If no = Disparity does not Exist
MSSA 35aFresno NW 29861 671 431 045 1154 003 2247 599 1889
The lowest = 671 + 15 = 2171Is the higher 6021 greater than 2171
If yes = Disparity Exist
Black
100
White
Note Using the lower number between proposed area and contiguous area for calculating disparity is suggested
Determine the closest provider in each contiguous area
Map the office location for the provider in the contiguous area to the population center in the proposed area
The Contiguous area will be measured from the same starting point (which is the population center of the proposed area)
Road Type Miles Min
Interstate Roads
25 x 12 = 30
Primary Roads 20 x 15 = 30
Secondary Roads
15 x 20 = 30
Road Type Miles Min
Interstate Roads
30 x 133 = 40
Primary Roads 25 x 160 = 40
Secondary Roads
20 x 200 = 40
Providers gt 3040 minutes depending on discipline from the population center are excessively distant
Are Providers Excessively Distant
27
Providers are excessively distant if they are gt 30 minutes from the population center
Providers are excessively distant if they are gt 40 minutes from the population center
Dental Mental Health
Primary CareDetermine the closest provider
Map their office locations
Use the same starting point
Contiguous
Area
Distance is based on time using public transportation during non-rush hour (either 10am or 2pm)
Bus routes and schedules must be described (provide narrative description and include bus schedule if possible)
If the MSSA doesnrsquot meet this requirement the next step is to show that there is a 30 or greater public transportation ridership in the MSSA (provide documentation to back up the claim)
Excessively Distant (cont)
28
Public Transportation can be used only in Inner CityMetro areas for Geographic designations where the 100 poverty rate is ge 20 or for Population
designations regardless of the 100 poverty rate
Public Transportation
Is the Contiguous Area Overutilized
29
Calculate FTE using same method as used for the proposed service area
If needed survey providers and determine FTE serving the population Use same surveying method as used for the proposed service area If applying for low-income designation gather Medi-Cal and Sliding Fee Scale percentages to calculate low-income FTE
Explain how the information was obtained and calculated and include population total FTE and population to provider ratio
Calculate the population to provider ratio counting each provider as 10 FTE
Overutilized
Low-Income will need to be surveyed to obtain the Medi-cal amp Sliding Fee Scale percentages
If area meets ratio of Primary Care gt 20001Dental Health gt 30001
Mental Health gt 200001 psychiatrists or30001 CMHP including psychiatrists and gt 100001 psychiatrists
do not survey (Applies to Geographic only)
Geographic Designation Can be in a Low-Income HPSA
Can be excessively distant
Cannot have significant socio-economicdemographic differences or physical barriers
Nearest Source of Non-Designated Care
30
Can be overutilized
Provide a road map with the proposed service area and contiguous areas outlined
On the map indicate the population center of the proposed service area the nearest source of care and the route between these points
Provide the name and address of the nearest source of care route miles and minutes
For inner portions of Metropolitan Areas include Bus route information from the population center of the
proposed area to the nearest source of care Provide miles amp minutes of travel time
Population Designation Cannot be a HPSA of any type
Non-Responder Calculation
31
Responders Non-Responders
Response Rate Responder FTE
Avg Responder FTE
Non-Responder FTE
15 5 1520=75 95 63 127
Survey all physicians in service area Must attempt to contact the provider
Response rate (RespondersTotal Responders = Response Rate [1520 = 75])
Divide FTE of responders from the survey (95) by the number of responders (15) for the average FTE of responders (63)
Multiply number of non-responders (5) by the average FTE of responders (5 x 63 = 316=32)
Add FTE of responders (95) and non-responders (32) for total FTE = 127
The Calculation
at least three (3) times Minimum two-thirds response rate required Average response rate applied to non-responders
What FTE to includeexclude in survey
32
Providers engaged solely in administration research or teaching
Providers who are Federal providers (eg Commissioned Officers at Indian Health Services or Bureau of Prisons)
Providers who are planning on retiring within six months but are still seeing patients
Providers who serve in the NHSC Scholarship or Federal Loan Repayment Programs
All providers who provide direct patient care in the service area including those who
Serve in State Scholarship or Loan Repayment Programs
Serve at Indian Health Clinics and are not Federal providers
Plan on retiring from 6 months to 1 year but are still seeing patients
Do not count FTE
Include in survey but reduce FTE to zero
Hospital staff physicians involved exclusively in inpatient or emergency room care
Locum tenens serving less than 1 year on contract
Physicians who serve under a J-1 or H-1B waiver
Physicians who are suspended under provisions of the Medicaid-Medicare Anti-Fraud and Abuse Act for a period of 18 months or more and Mid-levels
Count FTE
What are the Differencesunique to Primary Care
(MD amp DO)
Health Professional Shortage Area (HPSA)
33
Primary Care
Population to Provider Ratios
34
Determine the population to provider ratios for geographic and population designations
A rational service area plus meets the requirements of the specific designation category (eg low-income homeless etc)
More than 20 of the population has incomes at or below 100 of the Federal poverty level or
A rational service area county or sub-county (MSSA)
More than 100 births per year per 1000 women ages 15-44 or
More than 20 infant deaths per 1000 live births1 or
Meets insufficient capacity criteria
Geographic Area gt 35001
Geographic Area wUnusually High Needs gt 30001
Population Groups gt 30001
Contiguous Areas are Overutilized if gt 20001
A rational service area plus one of the following
Prim
ary
Care
Sur
vey
Geographic Designation FTE
35
Physician Name SP Location of PracticeCT Census Track
Hrs of Direct Patient
CareWk
Hosp Hours
FTE
L McCoy DO GP 19 Main Street City CA 90001 531 48 Incld 10(4840=12=10)
D Scully MD 1 Ped 11 Park Place City CA 90001 540 30 Incld 08(3040=75=8)
B Spock MD 2 IM 6 Muldar Ave City CA 90002 538 15 Incld 04(1540=375=4)
M Welby MD3 OBG 3306 Russia Blvd City CA 90002
543 25 Not Incld
625(2540=625=6)
Y Zhivago DO 4
FP 99 Bones Drive City CA 90003 539 0 --- 00(040=0)
Total Physicians 5 Total FTE 2825 = 301 ndash Dr Scully spends 10 hours a week doing research2 ndash Dr Spock chooses to work only 15 hoursweek 3 ndash Dr Welby ndash chooses to work to work 25 hours4 ndash Dr Zhivago spends full-time in administration
Low-Income Designation FTE
36
Physician Name Hours of Direct Pt CareWk
Hosp
Hours
FTE
Medi -Cal
SFS
of Low-Income Total Low-Income
FTE
L McCoy DO 48 Incld 4840 =12=10
64 15 79(64+15=79)
079(79 x 10 = 79 )
D Scully MD 1 30 Incld 3040 = 075 35 8 43(35+8=43)
032(43 x 75 = 322)
B Spock MD 2 15 Incld 1540=0375 60 40 100(60+40=100)
375(1 x 375 = 375)
M Welby MD 3 25 Not Incld
2540=625 13 0 13 008(13 x 625=08)
Y Zhivago DO 4
0 Incld 00 0 0 0 000
Total Physicians 5 Total Low-Inc FTE 1565 = 16 1 ndash Dr Scully spends 10 hours a week doing research2 ndash Dr Spock chooses to work only 15 hours a week3 ndash Dr Welby chooses to work 25 hours a week4 ndash Dr Zhivago spends full-time in administration
40 hours = 10 FTE
Every 4 hours (12 day) = 01 FTE
40+ hours = 10 FTE
Interns amp residents = 01 FTE
Only the total FTE is rounded to the nearest tenth of a percent
FT
E
For each provider include the number of hours of direct patient care provided office and hospital inpatient in the service area
Rounding Examples
0875 = 09 0817 = 08083 = 08 085 = 09
The FTE for low-income
population designations is
based on the average
number of hours
Medicaid and Sliding
per week
spent
with
Fee Scale (SFS) patients
Prim
ary
Care
FTE Calculation
37
What are the Differencesunique to Dental Health
(DDS amp DMD)
Health Professional Shortage Area (HPSA)
Dental Health
38
A rational service area plus meets the requirements of the specific designation category (eg low-income homeless etc)
A rational service area plusMore than 20 of the population has incomes at or below 100 of the Federal poverty level or
A rational service area county or sub-county (MSSA)
More than 50 of the population has no fluoridated water or
Meets insufficient capacity criteria
Population to Provider Ratios
39
Geographic Area gt 50001
Geographic Area wHigh Needs gt 40001
Population Groups gt 40001
Contiguous Areas are overutilized if gt 30001
Dentist Name Age Location of Practice
of Aux
Hours of Direct Pt CareWk
FTE Based on Hours
Total FTE
M Incisor DDS 29 789 Crown StTooth Fairy CA 99864
1=1
45 10(4540= 11=1)
10(10 x 1=10)
R Wisdom DDS1 78 789 Crown StTooth Fairy CA 99864
1=7
15 375 (1540= 375)
026(375 x 7= 26)
A Canine DDS2 40 33 Halitosis RdSmile City CA 99918
3=14
37 925(3740= 925)
129(925 x 14=129)
B Crown DDS3 39 103 Molar LaneChompers CA 99918
2=12
25 625(2540=625)
075(625 x 12= 75)
C Buck DDS4 32 66 Cavity PlaceMouthtown CA 99918
2=12
25 625(2540= 625)
075(625 x 12 =75)
Den
tal H
ealth
Geographic Dental Survey
40
1 ndash Dr Wisdom works 25 hoursweek in another location 2 ndash Dr Canine spends 3 hoursweek in administrative activities 3 ndash Dr Crown chooses to work 25 hoursweek 4 ndash Dr Buck spends 15 hoursweek in childcare activities
Total FTEs 405 = 41
Low-Income Dental Survey
41
1 ndash Dr Wisdom works 25 hours a week in another location 2 ndash Dr Canine spends 3 hours a week in administrative activities 3 ndash Dr Crown chooses to work 25 hours a week 4 ndash Dr Buck spends 15 hours a week in childcare activities
Total FTEs 1756 = 18
Dentist Name Hours of Direct Pt CareWeek
FTE Based on Hours
Total FTE Medi-Cal
SFS of Low- Income
Total Low-Income FTE
M Incisor DDS 45(4540= 11=1)
10 10(1x1= 1)
10 2 12(10+02=12)
012(12 x 1 = 12)
R Wisdom DDS
15(1540=375)
375 0262(375x07= 262)
00 0 0 00(0 x 262 = 0)
A Canine DDS 37(3740= 925)
925 129(925x14=129)
50 10 60(50+10=60)
0774(6 x 129 = 774)
B Crown DDS 25(2540=625)
625 075(625x12= 75)
20 20 40(20+20=40)
03(4 x 75 = 3)
C Buck DDS 25(2540= 625)
625 075(625x12 =75)
60 15 75(60+15=75)
05625(75 x 75 = 5625)
Den
tal H
ealth
Auxiliaries lt 55 55 ndash 59 60 ndash 64 65+
0 08 07 06 05
1 10 09 08 07
2 12 10 10 08
3 14 12 10 10
gt4 15 15 13 12
If an auxiliary is less than full-time round to the nearest whole number (04 = 0 05 = 1)
If more than one auxiliary works less than full time add total hours divide by 40 and round if not a whole number ([16+20] + [3240]) = 17 = 2
If of auxiliaries is not available Use weight lt55 = 12 55-59 = 09 60-64 = 08 and gt 65= 06
If dentistrsquos age and the number of auxiliaries are not available Use weight of 12
Auxiliaries are non-dentists assisting in dental caresuch as dental assistants hygienists etc
Auxiliaries amp Age
42
To determine the maximum allowable FTE divide the Civilian Population by the Ratio
Miles Minutes
Interstate Roads
30 x 133 =
40
Primary Roads
25x 160 =
40
Secondary Roads
20x 200 =
40
Travel Time and Max FTE
Geographic DesignationCivilian Population = 70000
Population to Provider Ratio 50001 Maximum FTE (700005000) = 140
Geographic Designation (High Needs) Civilian Population = 80000
Population to Provider Ratio 40001 Maximum FTE (800004000) = 200
Contiguous AreaCivilian Population = 75000
Population to Provider Ratio 30001 Maximum FTE (750003000) = 250
Providers gt 40 minutes from the population center are
excessively distant
Travel Time Calculating the Maximum FTE
43
Unique to Mental Health(Psychiatrists amp CMHP)
Health Professional Shortage Area (HPSA)
What are the Differences
Mental Health
44
Determine the population to provider ratios for geographic
and population designations
A rational service area plus one of the following
A rational service area can combine 1 or more MSSAs or whole countygt 300001 psychiatrists orgt 90001 CMHP including psychiatrists orgt 60001 CMHP including psychiatrists and gt 20000 psychiatrists
20 or more population is lt 100 of the poverty level or
The youth ratio ( of persons lt 18 to the of adults ages 18 - 64) is greater than 06 or
The elderly ratio ( of persons gt 65 to the of adults ages 18 - 64) is greater than 025 or
Alcohol or substance abuse prevalence data showing the area to be in the worst quartile of the region
gt 200001 psychiatrists orgt 60001 CMHP including psychiatrists orgt 45001 CMHP including psychiatrists and gt 150001 psychiatrists
Population to Provider Ratios
45
Geographic Area gt 300001
Geographic Area wHigh Needs gt 200001
Men
tal H
ealth
Number of individuals in the service area that are at or below 200 of the Federal poverty level
Must be gt30 of the population in the service area
gt 200001 psychiatrists orgt 60001 CMHP including psychiatrists orgt 45001 CMHP including psychiatrists and gt 150001 psychiatrists
200001 psychiatrists
or gt 30001 CMHP including psychiatrists and gt 100001 psychiatrists
Population to Provider Ratios
46
Low-Income Population gt 200001
Contiguous Areas are Overutilized if
Mental Health Designations
47
PsychiatristsClinical PsychologistsClinical Social WorkersPsychiatric Nurse SpecialistsMarriage and Family Therapists
Psychiatrists Only or Core Mental Health Providers (CMHP) including
must include all of the disciplines for this type of designation
Mental health providers engaged solely in administration research or teaching
Mental health hospital staff physicians involved exclusively in inpatient or emergency room care
Mental health providers who are suspended under provisions of the Medicaid-Medicare Anti-Fraud and Abuse Act for a period of 18 months or more
Mental health providers with full-time staff positions in correctional institutions youth detention facilities residential treatment centers for children with emotional or developmental disabilities and inpatient units of State or County mental hospitals
Exclusions from Survey
Note
Travel Times amp Survey
48
Road Type Miles Minutes
Interstate Roads
30 x 133 = 40
Primary Roads
25x 16 = 40
Secondary Roads
20x 20 = 40
Travel Times
Mental health providers who serve in the NHSC Scholarship or Loan Repayment Programs (FTEs will include State Loan Repayment Program recipients)
Physicians who are graduates of foreign medical schoolwho are not citizens or lawful permanent residents(including those with J-1or H-1B visas)
Mental health providers who are Federal providers
Mental health providers who are planning on retiring after 6 months but are still seeing patients
All providers who meet these qualifications should be listed even if their FTE will be zero
Include in Survey but Exclude FTE
Provider Name Specialty Location of Practice
Hrs of DirectPt CareWk1
FTE Based on Hours
Total FTE
S Freud MD Psychiatry 5 Oedipal LaneCity CA 90001
20 05(2040=5)
05
C Jung MD1 Psychiatry 11 Dream DriveCity CA 90001
40 05(4040=10105=5)
05
H Lecter PhD ClinicalPsychology
6 Can Street City CA 90021
26 65(2640=65)
065
M Houlihan RN PsychiatricNursing
1400 Captain Ave City CA 90003
55 1375(5540=1375=10)
10
R Weisheimer MFT
Marriage FamCounseling
69 Shex StreetCity CA 90009
10 25(1040=25)
025
L Schlessinger MSW
Clinical Social Work
1 Radio RoadCity CA 90006
6 015(640=15)
015
Total Psychiatrists 2 Total Psychiatrist FTE = 10Total Core Mental Health Providers 6 Total Core Mental Health FTE 305= 31
1 - Dr Jung is in his last year of residency and is therefore counted as 05
Geographic Mental Health Survey
49
Provider Name Specialty Location of Practice
Hours of Direct
Patient CareWk
FTE Based on Hours
Medi-
Cal
SFS
of L-I
Total L-IFTE
S Freud MD Psychiatry 5 Oedipal LaneCity CA 90001
20 05 0 0 0 00
C Jung MD Psychiatry 11 Dream DriveCity CA 90001
40 05 30 15 45 225(5 x 45 = 225)
H LecterPhD ClinicalPsychology
6 Can Street City CA 90021
26 65 0 85 85 55(65 x 85 = 5525)
M Houlihan RN
PsychiatricNursing
1400 Captain Avenue City CA 90003
55 10 50 10 60 6 (10 x 6 = 6)
R WeisheimerMS
MarriageFamCounseling
69 Shex StreetCity CA 90009
10 25 25 5 30 0075(25 x 3 = 075)
L Schlessinger MSW
Clinical Social Work
1 Radio RoadCity CA 90006
6 015 0 10 10 015(15 x 1 = 015)
Low-Income Mental Health Survey
50
Total Psychiatrists 2 Total L-I Psychiatrist FTE 0225 = 2
Total Core Mental Health Providers 6 Total L-I Core Mental Health FTE 1465 =15
Alcohol and Drug Use
51
Indicator State Rank of Counties Result Qualifies1 34 44 34 44 = 77 77 gt 75 = Yes2 30 49 30 49 = 61 61 lt 75 = No3 25 58 25 58 = 43 43 lt 75 = No4 57 58 57 58 = 98 98 gt 75 = Yes5 48 58 48 58 = 83 83 gt 75 = Yes6 15 50 1558 = 2 2 lt 75 = No7 45 58 4558 = 78 78 gt 75 = YesDoes the county have 4 out of 7 indicators Yes
The table for Key Indicators of Community Alcohol and Drug Use can be used to determine if the MSSA is located in a county that is in the lowest quartile in the state There are 7 key indicators The county must have 4 out of 7 indicators to qualify for a Geographic HPSA with high needs The web site is located at httpwwwadpcagovPreventionrisk_indicators_2010shtml
Formula State Rank of Counties = State Rank If the State Rank is gt 75 = Qualifies
The ldquo of Countiesrdquo participating in gathering the data is located directly underneath the Indicator Number third line down
Located to the right of each indicator under the last (or only) year the data was compiled is the ldquoState Rankrdquo for that indicator (third number down) (Note Do not use the Three Year Average)
Key Indicators of Community Alcohol
and Drug Use
This is unique to Mental HPSAs
Los Angeles County
The information required for a complete submission
How each factor is weighted and scored to determine a final Index of Medical Underservice (IMU) Score
The difference between MUAs amp MUPs
Measures the degree of underservice of an area (MUA) or a population (MUP)
Determine the Rational Service Area (RSA) (use MSSA)
Determine the Criteria amp Weighted Values of
Percent of Population at 100 Poverty
Percent of Population gt 65
Participants will understand
Infant Mortality Rate (IMR)
Primary Care Physicians per 1000 Population
Compute the Index of Medical Underservice ScoreValue must be lt 620
MUA = Medically Underserved Area
MUP Only ndash Primary Care Physicians serving the low-income population at 200 poverty level per 1000 low-income population
MUA amp MUP Designations
Objective MUA amp MUP Criteria
MUP = Medically Underserved Pop
52
Percent Population at 100 Poverty
53
Percent Below Poverty
WeightedValue
Percent Below Poverty
WeightedValue
Percent Below Poverty
WeightedValue
0 251 181-200 149 381-400 21
01-20 246 201-220 136 401-420 13
21-40 237 221-240 122 421-440 10
41-60 228 241-260 109 441-460 07
61-80 219 261-280 93 461-480 04
81-100 210 281-300 78 481-500 01
101-120 200 301-320 66 50 + 0
121-140 187 321-340 56 381-400 21
141-160 174 341-360 47 401-420 13
161-180 162 361-380 34 421-440 10
Determine the of the population in the area at the 100 poverty level
Calculate100 Poverty
Determine the weighed value
Note The weighted value is
the same for MUAs amp MUPs
See table
Use latest available data (2012 ACS Population Estimates)
Number at 100 Federal Poverty Level
Civilian Population
Divided By
Percentage of Population gt 65
54
of Pop gt 65
WeightedValue
of Pop gt 65
WeightedValue
of Pop gt 65
WeightedValue
0 ndash70 202 161-170 161 261-270 40
71-80 201 171-180 144 271-280 28
81-90 199 181-190 128 281-290 17
91-100 198 191-200 111 291-300 06
101-110 196 211-210 98 30 + 0
111-120 194 221-220 89 261-270 40
121-130 191 221-230 80 271-280 28
131-140 189 231-240 70 281-290 17
141-150 187 241-250 61 291-300 06
151-160 178 251-260 51 30 + 0
Determine the percentage of the in the area gt 65 years old
Determine the weighed value
Calculate percent for gt65 years old
Use the latest available data (2012 ACS Population Estimates)
See table
Note The weighted value is the same for MUAs amp MUPs
Number gt 65 yrs old
Civilian Population
Divided By
Infant Mortality Rate (IMR)
55
Infant Mortality
Rate
WeightedValue
Infant Mortality
Rate
WeightedValue
Infant Mortality
Rate
WeightedValue
Infant Mortality
Rate
WeightedValue
0-8 260 171-180 175 271-280 61 371-390 20
81-90 256 181-190 164 281-290 54 391-410 14
91-100 248 191-200 153 291-300 50 411-430 08
101-110 240 201-210 142 301-310 47 431-450 02
111-120 232 211-220 131 311-320 43 451+ 0
121-130 224 221-230 119 321-330 40
131-140 215 231-240 108 331-340 36
141-150 205 241-250 96 341-350 33
151-160 195 251-260 85 351-360 30
161-170 185 261-270 73 361-370 26
Use the OSD available data(5-year avg) or
OSD-approved State Department of Health data
Use the IMR for the county
Determine the weighed value
Calculation for gt65 years old
Note The weighted value is the same for MUAs amp MUPs
See table
Department of Public Healthrsquos Center for Health Statistics website httpwwwcdphcagovcertlicbirthdeathmarPagesdefaultaspx
of Infant Death
of Live Births
X 1000
Divided By
Providers per 1000 Population
Total FTECivilian Population x 1000
MUA
MUP Total FTEPop to be designated x 1000
All physicians must be counted (including J-1 Visa physicians NHSC physicians etc)
For MUA designations the HPSA adjustment factor for the FTE is not used
MUA ndash All primary care physicians are counted
MUA = civilian population
MUP ndash All primary care physicians servicing the population group are counted
MUP = number in that population group (eg low-income pop = pop at or below the 200 poverty)
Must collect inpatient and outpatient hours of the outpatient Doctors
(not hospitalists)
Determine the FTE
Determine the Population
Calculation
Determine the Weighted Value(see table)
56
Geographic Designation - FTEs
57
Provider Name Specialty Location of PracticeHours of Direct
Pt CareWk FTE Based on Hours
A Liver MD1 General Practice
86 N Onion StreetCity State Zip
48(4840=12=10)
10
B Spleen MD2 Pediatrics 103 Sanfgroid DrCity State Zip
30(3040=75)
075
C Heart MD Internal Medicine
777 Stopper AveCity State Zip
40 10
D Kidney DO OB-GYN 3306 Stone DriveCity State Zip
40 10
E Lung DO3 Family Practice 99 Airborne BlvdCity State Zip
25(2540=625)
0625
Total Physicians = 5 Total FTE = 4375 = 44
1 Dr Liver is an NHSC loan repayment recipient counted as 10 FTE
2 Dr Spleen spends 10 hoursweek doing research
3 Dr Lung spends 15 hours week in administration
Provider Name Specialty Location of Practice Hours of Direct
Pt CareWk
FTE Based on Hours
Medi-Cal
Sliding
Fee
of Low
Income
Total Low Income
FTE
A Liver MD GP 86 N Onion StCity State Zip
48 10 64 15 79 079
B Spleen MD PED 103 Sanfgroid DrCity State Zip
30 075 35 8 43 03225
C Heart MD IM 777 Stopper AveCity State Zip
40 10 60 40 100 10
D Kidney DO OB GYN 3306 Stone DriveCity State Zip
40 10 13 0 13 013
E Lung DO FP 99 Airborne BlvdCity State Zip
25 0625 7 0 7 004375
Total Physicians 5 Total Low-Income FTE 228625 = 23
Low-Income Population Designation - FTEs
58
Providers per 1000 Population
59
Prov per 1000 pop
WeightedValue
Prov per 1000 pop
WeightedValue
Prov per 1000 pop
WeightedValue
0-05 0 401-450 107 801-850 243
051-100 05 451-500 126 851-900 253
101-150 15 501-550 148 901-950 259
151-200 28 551-600 169 951-1000 266
201-250 41 601-650 191 1001-1050 272
251-300 57 651-700 207 1051-1100 277
301-350 73 701-750 219 1101-1150 280
351-400 90 751-800 231 1151-1200 283
1201-1250 286
Over 1250 287
find the range which includes
the ratio of primary care
physicians per 1000 population
for the area being examined
See table
Note The weighted value is the same for MUAs amp MUPs
Left Column
Index of Medical Underserved Score
60
Qualifies for designation as an MUAMUP
The IMU Score is determined by adding the values of each of the four factors
Percent of Population at 100 Poverty
Infant Mortality Rate (IMU)
Primary Care Physicians per 1000 Population
+Percent of Population gt 65
+
+
Does not qualify for designation as an MUAMUP
Before surveying providers check the IMU score of the first 3 variables
If V1 + V2 + V3 are gt 620 the area will not designate as an MUA or MUP
If the IMU gt 62 then review rational service area to determine if other boundaries would be appropriate
If not an MUA check if area would designate as an MUP
The IMU Score IMU lt 620
IMU gt 620
Time Saving Tips
MUAMUP Designation Worksheet
61
MUAMUP Designation Map
62
The orange area is a designated MUA and part of the designation is in MSSA 66a and part is in MSSA 63 Because of this the whole designation can be thrown out
MU
AM
UP
Map
HPSA Scores
63
HPSA scores are critical for US HRSA administered programs such as
National Health Service Corps (NHSC) Scholar Placements and Loan Repayment
J1-Visa Waiver Ready Responders
These programs rely on HPSA scores to prioritize resource allocation and level of assistance
DisciplinesPrimary Medical Care HPSA (4 factors = 25 points)
Dental Care HPSA (4 factors = 26 points)
Mental Health HPSA ( 7 factors = 26 points)
Note There is nothing in writing from the Feds on Mental Health
Primary Care HPSA Scores
64
Factor 1 ndash Population to Provider Ratio Score(x2)
gt100001 and the de-designation threshold is gt0
or there is no physicians and a population gt2500
5
lt100001 but gt50001 and the de-designation threshold is gt0
or there is no physicians and a population gt2000
4
lt50001 but gt40001 and the de-designation threshold is gt0
or there is no physicians and a population gt1500
3
lt40001 but gt35001 and the de-designation threshold is gt0
or there is no physicians and a population gt1000
2
lt35001 but gt30001 and the de-designation threshold is gt0
or there is no physicians and a population gt500
1
Factor 2 ndash 100 Poverty Rate
Score
gt50 5
lt50 but gt40 4
lt40 but gt30 3
lt30 but gt20 2
lt20 but gt15 1
For Primary Care there are 4 Factors for a total of 25 Points
100 Poverty RatePopulation to Provider Ratio
Factor 1Factor 2
Primary Care HPSA Scores (cont)
65
Infant Mortality
Rate
Low Birth Weight Rate
Score
gt200 or gt13 5
lt20 but gt18 or lt13 but gt11 4
lt18 but gt15 or lt11 but gt10 3
lt15 but gt12 or lt10 but gt9 2
lt12 but gt10 or lt9 but gt7 1
Time Distance Score
gt60 minutes gt50 miles 5
lt60 but gt50 minutes lt50 but gt40 miles 4
lt50 but gt40 minutes lt40 but gt30 miles 3
lt40 but gt30 minutes lt30 but gt20 miles 2
lt30 but gt20 minutes lt20 but gt10 miles 1
Average Travel Time or Distance to Nearest Source of Non-Designated Accessible Care (choose largest)
Infant Health Index (choose largest)
Factor 3Factor 4
Dental Health HPSA Scores
66
Factor 1 ndash Population to Provider Ratio Score(x2)
gt100001 and a de-designation threshold of gt0
or there is no dentists and a population gt3000
5
lt100001 but gt80001 and a de-designation threshold of gt0
or there is no dentists and a population gt2500
4
lt80001 but gt60001 and a de-designation threshold of gt0
or there is no dentists and a population gt2000
3
lt60001 but gt50001 and a de-designation threshold of gt0
or there is no dentists and a population gt1500
2
lt50001 but gt40001 and a de-designation threshold of gt0
or there is no dentists and a population gt1000
1
Factor 2 ndash 100 Poverty Rate
Score(x2)
gt50 5
lt50 but gt 40 4
lt40 but gt30 3
lt30 but gt20 2
lt20 but gt15 1
For Dental Health there are 4 Factors for a total of 26 Points
100 Poverty Rate
Population to Dentist Ratio
Factor 1Factor 2
Dental Health HPSA Scores (cont)
67
Water Not Fluoridated = Score of 1 point
Time Distance Score
gt90 minutes gt60 miles 5
lt90 but gt75 minutes lt60 but gt50 miles 4
lt75 but gt60 minutes lt50 but gt40 miles 3
lt60 but gt45 minutes lt40 but gt30 miles 2
lt45 but gt30 minutes lt30 but gt20 miles 1
Average Travel Time or Distance to Nearest Source of Non-Designated Accessible Care (choose largest)
Fluoridated Water
Factor 3 Factor 4
Mental Health HPSA Scores
68
Factor 1 ndash Population to Mental Provider Ratio Score
Psychiatrists Ratio Core Mental Health Ratiogt 450000 AND gt 45000 8
gt 45001 and lt 60001 7
lt 200001 and gt 150001 AND gt 60001 and lt 90001 6
lt 300001 and gt 150001 OR gt 45001 and LT 60001 5
lt 450001 and gt 200001 AND gt 45000 and LT 60000 4
gt 200001 AND gt 60001 3
gt 300001 2
gt 90001 1
Factor 2 ndash 100 Poverty Rate
Score
P() GE 50 5
50 gt P() GE 40 4
40 gt P() GE 30 3
30 gt P() GE 20 2
20 gt P() GE 15 1
P() lt 15 0
For Mental Health there are 7 Factors for a total of 26 Points
100 Poverty Rate
Population to Mental Provider Ratio
Factor 1
Factor 2
Mental Health HPSA Scores (cont)
69
Time Score
Time GE 60 minutes 5lt 60 min and gt50 minutes 4lt50 minutes and gt 40 minutes 3lt40 minutes and gt30 minutes 2lt30 minutes and gt20 minutes 1
Avg Travel Time or Distance to the Nearest Source of Non-Designated Accessible Care (choose largest)
Youth Ratio Ratio of Children under 18 to Adults 18-64
Score
gt25 3
lt25 and gt15 2
lt15 and gt10 1
Time Score
gt60 3
lt60 and gt40 2
lt40 and gt20 1
Score
Yes 1
No 0
Elderly Ratio Ratio of Adults over 65 to Adults 18-64
Substance Abuse prevalence Arearsquos rate is in worst quartile for nation region or state
Alcohol Abuse prevalence Arearsquos rate is in worst quartile for nation region or state
Score
Yes 1
No 0
Factor 3
Factor 4
Factor 5
Factor 6
Factor 7
Automatic HPSA
70
Legislation in 2002 created a new class of HPSAs not based on data but based on status as a certain type of facility
Statute
Federally Qualified Health Centers (FQHCs) that werenrsquot located in HPSAs still wanted access to NHSC Clinicians
Who is CoveredFederally Qualified Health Centers (FQHC)Community Health Centers
FQHC Look-A-Likes
Rural Health Clinics (RHCs) who submit the required application
Indian Health Service (IHS) and IHS ContractCompact Sites ndashTribal and Urban Indian Sites
IF THE SITE IS NOT ONE OF THESE IT DOES NOT QUALIFY FOR AUTO HPSA
Automatic HPSA
71
Scores
Important Note
No data no scoreDeveloped as a way to estimate using the national data Results were often no score or very low scoresOption to increase scores with alternative data available-posted on the websiteChanges in the loan repayment program with graduated payments and tiered funding has led to increased requests for score changes
We caution people that a high score is no guarantee given the small number of clinicians available so donrsquot waste too much energy
The HPSA applies to all sites that are a part of the FQHC or Look-A-Like
They have the same UDS but a different ALPHA code at the end now they have the BCHMIS
They are only listed under the ldquoMOTHER SITErdquo name and location which may be in a different county from a satellite site This information is listed on HPSAFIND website Recently HRSArsquos Office of Information Technology (OIT) created a tool that allows you to identify FQHCs and their Satellite sites See URL listed on ldquoResourcerdquo slide
Rural Health Clinics have to apply for each individual site
Automatic HPSA
72
Data Used to Compute Scores
Partial Scores
The current scoring methodology for primary care includes four factors
Population-to-Primary Care Physician RatioPercent of the Population with incomes below 100 of the Poverty LevelInfant Mortality Rate or Low Birth Weight (whichever score is higher) andTravel Time or Distance to the nearest available source of care (whichever score is higher)
There is a transformation scale that allows computation of partial scores for the four factors
The sum of these partial scores form the total HPSA score except that the partial score for Population-to-Primary Care Physician Ratio is double weighted because HPSA designations are primarily intended to measure the shortage of primary care providers within the HPSA For Dental HPSAs the poverty factor is also doubled
Automatic HPSA
73
Population to Primary Care Physician Ratio
For the FQHC grantees FQHC Look-a-Likes and RHCs these ratios were calculated for the following
Defined Primary Care Service Area (PCSA) which included the location of the facility
As an approximation to the service area of the facility and
Resident civilian population data from the census were used and primary care physician data were taken from the combined AMAAOA files used by the Office of Shortage Designation
For the IHS Service Units and the Alaska Native facilities Native American or Alaska Native population
Figures from the IHS or the Alaska Native Health System were used and
Physician data represent the non-federal providers in the area as reported by the IHS or the Alaska Native Health System
Automatic HPSA
74
Percent of the population with incomes below 100 of the poverty level
For FQHC granteesInitially 2002 Uniform Data System (UDS)-reported data on percent of users with incomes below 100 of poverty were used more recent UDS data used subsequently
For FQHC Look-a-likes and Rural Health Clinics (RHCs)The 2000 census poverty data for the county of location were used We now have UDS Data for FQHC Look-a-Likes
For the IHS and Alaska Native areas The census poverty data for Native American populations within those areas were used or data supplied by the IHS
Automatic HPSA
75
Travel Time or Distance to the Nearest Available Source of CareFor FQHC grantees FQHC Look-a-Likes and RHCs
Travel time and distance were calculated from the population-weighted center of the PCSA in which the entity was located to the population-weighted center of the nearest PCSA with a population-to-primary care physician ratio of at least 20001 using average road speeds and travel time for each road segment involved
For IHS and Alaska Natives Data reported by the IHS or the Alaska Native Health System were used
Infant Mortality Rate or Low Birth Weight (IMRLBW)For FQHC grantees FQHC Look-a-Likes and RHCs
IMRLBW rates for the PCSAs including the FQHC or RHC were used
For IHS and Alaska Native scoring Service unit data for the appropriate populations were used
Acronyms
76
Acronym and MeaningALOS Average Length of Stay CHMPC California Healthcare Workforce Policy
Commission
AMA American Medical Association CDPH California Department of Public Health
ASAPS Application Submission and Processing System CMHP Core Mental Health ProvidersProfessionals
BHCDANET
Bureau of Health Care Delivery and Assistance (NET)
CMS Center for MedicaidMedicare Services (formerly HCFA)
BHW Bureau of Health Workforce CPCA California Primary Care Association
BPHC Bureau of Primary Health Care CT Census Tract
BOP Bureau of Prisons DHHS Department of Health and Human Services
CA Cooperative Agreement DHCS Department of Health Care Services
CCD County Census Division DT Dental
CFR Code of Federal Register FQHC Federally Qualified Health Center
CHC Community Health Center FTE Full-Time Equivalent
Acronyms (cont)
77
Acronym and MeaningGIS Geographic Information System MSSA Medical Service Study Areas
HMO Health Maintenance Organization MUA Medically Underserved Areas
HPSA Health Professional Shortage Areas MUP Medically Underserved Populations
HRSA Health Resources and Services Administration NHSC National Health Service Corps
IHP Indian Health Program PC Primary Care
IHS Indian Health Services PCA Primary Care Association
IMR Infant Mortality Rate PCO Primary Care Office
IMU Index of Medical Underservice RHC Rural Health Clinic
MCD Minor Civil Division RSA Rational Service Area
MFW Migrant Farmworker SFS Sliding Fee Scale
MSFW Migrant Seasonal Farmworker SLRP State Loan Repayment Program
MH Mental Health TA Technical Assistance
Other Resources
78
SLRP httposhpdcagovHWDDSLRPhtml
OSHPD httpwwwoshpdcagov
NHSC httpnhschrsagov
Address Lookup httpgeooshpdcagovhpsa-search-by-address
CalHealth httpswwwfacebookcomCalHealthWorkforce
Twitter httpstwittercomHealthProfCAgov
J1-Visa Waiver Program httpwwwdhcscagovservicesruralPagesJ-1VisaWaiveraspx
HPSA Find httphpsafindhrsagov
HRSA Data Warehouse httpwwwhrsagovdata-statisticsindexhtml
Shortage Designation Program httpwwwoshpdcagovHWDDShortage_Designation_Proghtml
Geographic Information Systems (GIS) httpwwwoshpdcagovHWDDResearch_Policy_Planning_GIShtml
MSFW Enumeration Profiles Estimates httpwwwncfhorgenumerationPDF220Californiapdf
Health Professional Shortage Area (HPSA)
Join the HPSA Tour
Shortage Designation Program (SDP) Concludes
HOPE TO SEE YOU AGAIN
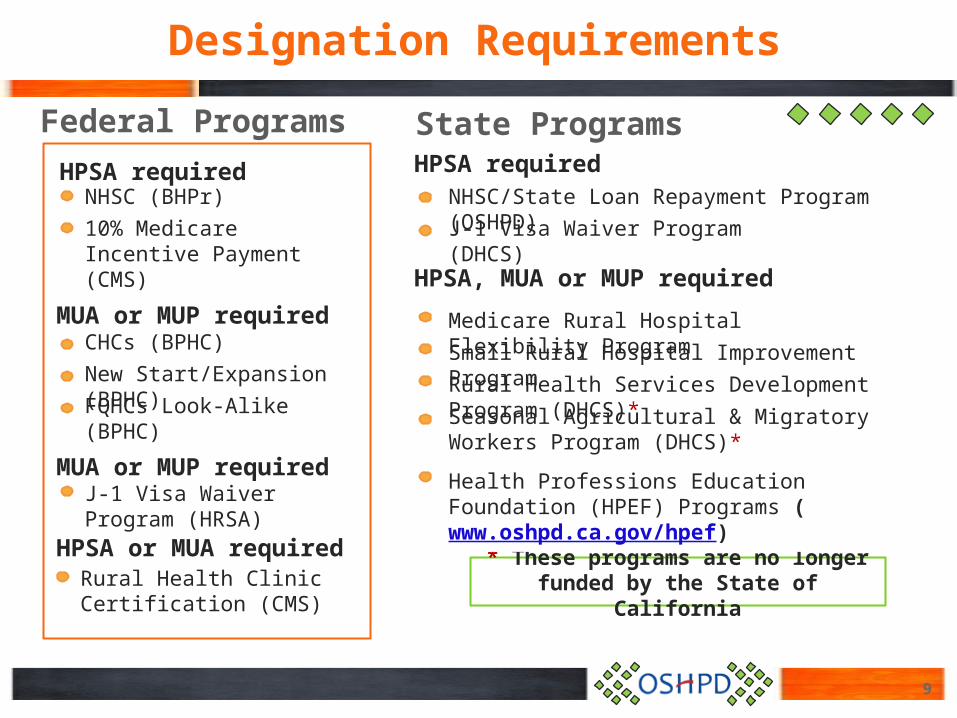
HPSA required
HPSA MUA or MUP required
Medicare Rural Hospital Flexibility Program Small Rural Hospital Improvement ProgramRural Health Services Development Program (DHCS)Seasonal Agricultural amp Migratory Workers Program (DHCS)
NHSCState Loan Repayment Program (OSHPD)J-1 Visa Waiver Program (DHCS)
HPSA required
NHSC (BHPr)
10 Medicare Incentive Payment (CMS)
MUA or MUP required
CHCs (BPHC)
New StartExpansion (BPHC)
FQHCs Look-Alike (BPHC)
MUA or MUP required
J-1 Visa Waiver Program (HRSA)
HPSA or MUA required
Rural Health Clinic Certification (CMS)
These programs are no longer funded by the State of California
Designation Requirements
Federal Programs State Programs
9
Health Professions Education Foundation (HPEF) Programs (wwwoshpdcagovhpef)
Overlap
Exceed travel time between population centers
Be smaller than a census tract
Types of Rational Service Areas
10
Applies to all types HPSA and MUAMUP designations
Sub-County MSSA
Whole County MSSA
Medical Service Study Areas (MSSAs) ndash recognized by HRSArsquos Office of Shortage Designation (OSD) as rational services areas
Have more than one HPSA designation per discipline (eg geographic and low-income population)
Have interior portions carved out
RSAs Cannot
Type
s of
RSA
s
Types of RSAs
MSSAs will not cross county lines
Population range 75000 to 125000
Reflect recognized community and neighborhood boundaries
Each MSSA is composed of one or more complete census tracts
All population centers within the MSSA are within 30 minutes travel time to the largest population center
11
Adopted by the California Healthcare Workforce Policy Commission on May 29 2013
Similar demographic and socio-economic characteristics
Population density of less than 250 persons per square mile
No population center exceed 50000
Population density of less than 11 persons per square mile
What is an MSSA
Rural MSSAUrban MSSA
Frontier MSSA
MSSA Definitions
US Public Health Service recognizes MSSAs as ldquorational service areasrdquo for purposes of determining Health Professional Shortage Areas (HPSAs) and Medically Underserved AreasMedically Underserved Populations (MUAsMUPs)
Major Uses of MSSAs
12
MSSAs are a principal component for display of large databases through OSHPDrsquos Geographic Information System (GIS)
MSSAs have the potential for assisting in needs assessment health planning and health policy development
Whole County MSSA
Sub-County MSSA
Major Uses of MSSAsTypes of MSSAs
Origin National Health Service Corps (NHSC) (Measures the shortage of health professionals in an area)
a Geographic Areab Population Groupc Facility
Rational Service Areas (HPSAs ndash RSAs)
The criteria used to determine if a service area is rationalThe characteristics of a HPSARSA
Objective
Health Professional Shortage Area
Components
a Rational Service Area (RSA)b Population to Provider Ratioc Contiguous Area Analysis
Disciplines
a Primary Medical Careb Dental Health Carec Mental Health Care
Type of Designations
13
HPSAs amp RSAs
14
Primary Care - Humboldt County
15
Dental Health - Humboldt County
16
Mental Health - Humboldt County
Three Disciplines ndash Similarites amp Differences
Similarities amp Differences
Primary Care
Dental Health
Mental Health
17
Similaritiesthe
Three Disciplines ndash The Similarities
18
Contiguous Area Analysis
The Nearest Source of Care
Non-Responder Calculation
MFW Tourists Seasonal Residents amp Homeless Geographic Designations amp Population Designations
Identify the boundaries amp Determine the available resources
Geographic Designation Can be in a Low-Income HPSA
Can be Excessively Distant
Cannot have a Disparity
Can be Overutilized
What FTE to includeexclude in your survey
Population Designation Cannot be a HPSA of any type
Geographic Designations
Migrant FarmworkersData from the 2000 Migrant and Seasonal Farmworker Enumeration Profiles Study or other approved source (must include methodology)
Homeless Local data (must include methodology)
Seasonal Residents Those who maintain a residence in the area but inhabit it
for only 2-8 month year (Use census or local data which must include methodology)
Tourists Formula 025 X [fraction of year present] X [average daily number of tourists] (Use local data which must include methodology and length of stay)
Resident Civilian Population = Total permanent population in the service area (non-institutionalized population)
Source 2010 US Census and 5-year American Community Survey Population Estimates
Inmates or individuals in institutions (eg nursing homes prisons college dormitories military installations Native Americans on reservations etc)
Can Add
MFW Tourists Seasonal Residents amp Homeless
Exclude
19
Source 2010 US Census and 5-year American Community Survey
Population Estimates Note cannot add MFW Tourists Seasonal Residents or Homeless to Mental Health
Note adding any of the above will increase the Pop to Provider Ratio
of the proposed area
Population Designations
20
Can Add
Number of individuals in the service area that are at or below 200 of the Federal poverty level Must be gt 30 of the population in the service area
Source 2012 5-year ACS Population estimates
Migrant FarmworkersData from the 2000 Migrant and
Seasonal Farmworker Enumeration Profiles Study or other approved source (must include methodology)
Number of individuals in the service area who are migrant farmworkers adjusted for the fraction of the year they are in the service area
Source Statelocal data amp 2000 Migrant amp Seasonal Farmworker Enumeration Profiles Study
Number of individuals in the service area that are Native Americans or Native AlaskansSource 2000 census data
Homeless Local data (must include
methodology)
Must be of the population in the service area
Migrant Farmworker Population
Native AmericanAlaskan Population
MFW Tourists Seasonal Residents amp Homeless
Low-Income Population
gt 30
California All Agricultural Workers Estimates
21
County
Adjusted MSFWFarmworker
EstimatesMigrant
FarmworkersSeasonal
Farmworkers
Non-FarmworkersIn Migrant
Households
Non-FarmworkersIn SeasonalHouseholds
MSFWFarmworkers
And Non-Farmworkers
Alameda 1148 531 616 195 699 2043Alpine 0 0 0 0 0 0Amador 737 341 396 125 449 1311Butte 7263 3363 3900 1236 4426 12925Calaveras 135 63 73 23 83 241Colusa 13932 6450 7481 2371 8490 24792Contra Costa 2470 1144 1326 420 1505 4395Del Norte 604 280 325 103 368 1076El Dorado 960 444 515 163 585 1708Fresno 145919 67561 78359 24828 88917 259665Glenn 3747 1735 2012 638 2283 6668Humboldt 935 433 502 159 570 1664Imperial 29312 13572 15741 4988 17862 52162Inyo 71 33 38 12 43 126Kern 92142 42662 49480 15678 56148 163968Kings 16592 7682 8910 2823 10111 29526Lake 2911 1348 1563 495 1774 5181Lassen 544 252 292 93 331 968Los Angeles 14180 6566 7615 2413 8641 25234
Migrant Farmworkers (MFW)
22
Add 1396 MFW to 100 civilian population
MFW calculation for proposed area MSSA 71 in Butte County
200 Poverty MFW
MFW for Butte county from enumeration study 3363
200 poverty for proposed area MSSA 71 38376
200 poverty for entire Butte county 84764
Calculation
Divide the 200 poverty for proposed area by the 200 poverty for the entire county
38376 84764 = 4527
Multiply the MFW for county by percentage above 3363 4527 = 1523
Divide the number of months the MFW works per year by the total months in the year (if less than 12)
11 12 = 9166
Multiply the MFW by the percentage above 1523 9166 = 1396
Contiguous Area Analysis
23
Participants will understand how to identify the contiguous areas determine if they have resources and if the resources are inaccessible to the population of the area proposed for designation
Objective amp Purpose
The Steps (determine the available resources)
Are there significant socio-economicdemographic disparities or physical barriers
Determine if the contiguous arearsquos providers are located gt 3040 minutes away from the population center of the proposed area and therefore are excessively distant
Determine if the resources in the contiguous area exceed the population-to-provider ratio and therefore are overutilized
If the contiguous area cannot be ruled-out by one of these
methods the proposed area cannot be designated
Is the contiguous area a HPSA The next slide will explain more about what HPSAs to rule out
Is the Contiguous Area a HPSA
24
Check the HPSA status of each contiguous area to determine if this type of HPSA is inaccessible to the proposed area
Geographic without high needs
Then the contiguous area is inaccessible if it is a Geographic HPSA
Geographic with high needs
Then the contiguous area is inaccessible if it is a Geographic HPSA (this is a significant change)
Low-Income HPSA
Then the contiguous area is inaccessible if it is a Geographic HPSA or Low-Income HPSA
If the proposed service area is Contiguous
Areas
Calculating Disparities for Percentages gt 15
25
Significant demographic disparities between the population in the service area and the population in the contiguous area result in the population being isolated from nearby resources
Use (2 N) to determine a disparity between the population in the service area and the population in the contiguous area
MSSA 35bClovis WestFresno East in Fresno County
Proposed Area Civilian Pop
White BlackNative
American AsianPacific
Islander Hispanic 100 200
Compareeach contiguous area to the proposed
area in the same category
If the highest number is greaterThan 2 the lowest number
then a disparity exist
93336 6021 5374 120 1243 057 3221 1594 3242
Contiguous Area Desig Pop White BlackNative
American AsianPacific
Islander Hispanic 100 200
MSSA 35dFresno E 65008 3978 2614 143 1698 007 5869 3411 6500
The lowest = 2614 2 = 5228 Is the higher 5374
greater than 5228 if yes = Disparity Exist
MSSA 35eFresno S 52848 4522 1049 105 1164 013 6031 3114 6031
The lowest = 1594 2 = 3188Is the higher 3114
greater than 3188If no = Disparity does not Exist
MSSA 35aFresno NW 29861 2791 431 045 1154 003 2247 599 1889
The lowest = 2791 2 = 5582Is the higher 6021 greater than 5582
If yes = Disparity Exist
Black
100
White
Note Using the lower number between proposed area and contiguous area for calculating disparity is suggested
Calculating Disparities for Percentages lt 15
26
Significant demographic disparities between the population in the service area and the population in the contiguous area result in the population being isolated from nearby resourcesPlus 15 to determine a disparity between the population in the service area and the population in the contiguous area
MSSA 35bClovis WestFresno East in Fresno County
Proposed Area Civilian
Pop White BlackNative
American AsianPacific
Islander Hispanic 100 200
Compareeach contiguous area to the proposed
area in the same category
If the highest number is greaterThan the lowest number plus 15
then a disparity exist
93336 6021 5374 120 1243 057 3221 1294 3242
Contiguous Area Desig Pop White BlackNative
American AsianPacific
Islander Hispanic 100 200
MSSA 35dFresno E 65008 3978 1485 143 1698 007 5869 3411 6500
The lowest = 1485 + 15 = 2985Is the higher 5374greater than 2985
if yes = Disparity Exist
MSSA 35eFresno S 52848 4522 1049 105 1164 013 6031 2114 6031
The lowest = 1294 + 15 = 2794Is the higher 2114
greater than 2794If no = Disparity does not Exist
MSSA 35aFresno NW 29861 671 431 045 1154 003 2247 599 1889
The lowest = 671 + 15 = 2171Is the higher 6021 greater than 2171
If yes = Disparity Exist
Black
100
White
Note Using the lower number between proposed area and contiguous area for calculating disparity is suggested
Determine the closest provider in each contiguous area
Map the office location for the provider in the contiguous area to the population center in the proposed area
The Contiguous area will be measured from the same starting point (which is the population center of the proposed area)
Road Type Miles Min
Interstate Roads
25 x 12 = 30
Primary Roads 20 x 15 = 30
Secondary Roads
15 x 20 = 30
Road Type Miles Min
Interstate Roads
30 x 133 = 40
Primary Roads 25 x 160 = 40
Secondary Roads
20 x 200 = 40
Providers gt 3040 minutes depending on discipline from the population center are excessively distant
Are Providers Excessively Distant
27
Providers are excessively distant if they are gt 30 minutes from the population center
Providers are excessively distant if they are gt 40 minutes from the population center
Dental Mental Health
Primary CareDetermine the closest provider
Map their office locations
Use the same starting point
Contiguous
Area
Distance is based on time using public transportation during non-rush hour (either 10am or 2pm)
Bus routes and schedules must be described (provide narrative description and include bus schedule if possible)
If the MSSA doesnrsquot meet this requirement the next step is to show that there is a 30 or greater public transportation ridership in the MSSA (provide documentation to back up the claim)
Excessively Distant (cont)
28
Public Transportation can be used only in Inner CityMetro areas for Geographic designations where the 100 poverty rate is ge 20 or for Population
designations regardless of the 100 poverty rate
Public Transportation
Is the Contiguous Area Overutilized
29
Calculate FTE using same method as used for the proposed service area
If needed survey providers and determine FTE serving the population Use same surveying method as used for the proposed service area If applying for low-income designation gather Medi-Cal and Sliding Fee Scale percentages to calculate low-income FTE
Explain how the information was obtained and calculated and include population total FTE and population to provider ratio
Calculate the population to provider ratio counting each provider as 10 FTE
Overutilized
Low-Income will need to be surveyed to obtain the Medi-cal amp Sliding Fee Scale percentages
If area meets ratio of Primary Care gt 20001Dental Health gt 30001
Mental Health gt 200001 psychiatrists or30001 CMHP including psychiatrists and gt 100001 psychiatrists
do not survey (Applies to Geographic only)
Geographic Designation Can be in a Low-Income HPSA
Can be excessively distant
Cannot have significant socio-economicdemographic differences or physical barriers
Nearest Source of Non-Designated Care
30
Can be overutilized
Provide a road map with the proposed service area and contiguous areas outlined
On the map indicate the population center of the proposed service area the nearest source of care and the route between these points
Provide the name and address of the nearest source of care route miles and minutes
For inner portions of Metropolitan Areas include Bus route information from the population center of the
proposed area to the nearest source of care Provide miles amp minutes of travel time
Population Designation Cannot be a HPSA of any type
Non-Responder Calculation
31
Responders Non-Responders
Response Rate Responder FTE
Avg Responder FTE
Non-Responder FTE
15 5 1520=75 95 63 127
Survey all physicians in service area Must attempt to contact the provider
Response rate (RespondersTotal Responders = Response Rate [1520 = 75])
Divide FTE of responders from the survey (95) by the number of responders (15) for the average FTE of responders (63)
Multiply number of non-responders (5) by the average FTE of responders (5 x 63 = 316=32)
Add FTE of responders (95) and non-responders (32) for total FTE = 127
The Calculation
at least three (3) times Minimum two-thirds response rate required Average response rate applied to non-responders
What FTE to includeexclude in survey
32
Providers engaged solely in administration research or teaching
Providers who are Federal providers (eg Commissioned Officers at Indian Health Services or Bureau of Prisons)
Providers who are planning on retiring within six months but are still seeing patients
Providers who serve in the NHSC Scholarship or Federal Loan Repayment Programs
All providers who provide direct patient care in the service area including those who
Serve in State Scholarship or Loan Repayment Programs
Serve at Indian Health Clinics and are not Federal providers
Plan on retiring from 6 months to 1 year but are still seeing patients
Do not count FTE
Include in survey but reduce FTE to zero
Hospital staff physicians involved exclusively in inpatient or emergency room care
Locum tenens serving less than 1 year on contract
Physicians who serve under a J-1 or H-1B waiver
Physicians who are suspended under provisions of the Medicaid-Medicare Anti-Fraud and Abuse Act for a period of 18 months or more and Mid-levels
Count FTE
What are the Differencesunique to Primary Care
(MD amp DO)
Health Professional Shortage Area (HPSA)
33
Primary Care
Population to Provider Ratios
34
Determine the population to provider ratios for geographic and population designations
A rational service area plus meets the requirements of the specific designation category (eg low-income homeless etc)
More than 20 of the population has incomes at or below 100 of the Federal poverty level or
A rational service area county or sub-county (MSSA)
More than 100 births per year per 1000 women ages 15-44 or
More than 20 infant deaths per 1000 live births1 or
Meets insufficient capacity criteria
Geographic Area gt 35001
Geographic Area wUnusually High Needs gt 30001
Population Groups gt 30001
Contiguous Areas are Overutilized if gt 20001
A rational service area plus one of the following
Prim
ary
Care
Sur
vey
Geographic Designation FTE
35
Physician Name SP Location of PracticeCT Census Track
Hrs of Direct Patient
CareWk
Hosp Hours
FTE
L McCoy DO GP 19 Main Street City CA 90001 531 48 Incld 10(4840=12=10)
D Scully MD 1 Ped 11 Park Place City CA 90001 540 30 Incld 08(3040=75=8)
B Spock MD 2 IM 6 Muldar Ave City CA 90002 538 15 Incld 04(1540=375=4)
M Welby MD3 OBG 3306 Russia Blvd City CA 90002
543 25 Not Incld
625(2540=625=6)
Y Zhivago DO 4
FP 99 Bones Drive City CA 90003 539 0 --- 00(040=0)
Total Physicians 5 Total FTE 2825 = 301 ndash Dr Scully spends 10 hours a week doing research2 ndash Dr Spock chooses to work only 15 hoursweek 3 ndash Dr Welby ndash chooses to work to work 25 hours4 ndash Dr Zhivago spends full-time in administration
Low-Income Designation FTE
36
Physician Name Hours of Direct Pt CareWk
Hosp
Hours
FTE
Medi -Cal
SFS
of Low-Income Total Low-Income
FTE
L McCoy DO 48 Incld 4840 =12=10
64 15 79(64+15=79)
079(79 x 10 = 79 )
D Scully MD 1 30 Incld 3040 = 075 35 8 43(35+8=43)
032(43 x 75 = 322)
B Spock MD 2 15 Incld 1540=0375 60 40 100(60+40=100)
375(1 x 375 = 375)
M Welby MD 3 25 Not Incld
2540=625 13 0 13 008(13 x 625=08)
Y Zhivago DO 4
0 Incld 00 0 0 0 000
Total Physicians 5 Total Low-Inc FTE 1565 = 16 1 ndash Dr Scully spends 10 hours a week doing research2 ndash Dr Spock chooses to work only 15 hours a week3 ndash Dr Welby chooses to work 25 hours a week4 ndash Dr Zhivago spends full-time in administration
40 hours = 10 FTE
Every 4 hours (12 day) = 01 FTE
40+ hours = 10 FTE
Interns amp residents = 01 FTE
Only the total FTE is rounded to the nearest tenth of a percent
FT
E
For each provider include the number of hours of direct patient care provided office and hospital inpatient in the service area
Rounding Examples
0875 = 09 0817 = 08083 = 08 085 = 09
The FTE for low-income
population designations is
based on the average
number of hours
Medicaid and Sliding
per week
spent
with
Fee Scale (SFS) patients
Prim
ary
Care
FTE Calculation
37
What are the Differencesunique to Dental Health
(DDS amp DMD)
Health Professional Shortage Area (HPSA)
Dental Health
38
A rational service area plus meets the requirements of the specific designation category (eg low-income homeless etc)
A rational service area plusMore than 20 of the population has incomes at or below 100 of the Federal poverty level or
A rational service area county or sub-county (MSSA)
More than 50 of the population has no fluoridated water or
Meets insufficient capacity criteria
Population to Provider Ratios
39
Geographic Area gt 50001
Geographic Area wHigh Needs gt 40001
Population Groups gt 40001
Contiguous Areas are overutilized if gt 30001
Dentist Name Age Location of Practice
of Aux
Hours of Direct Pt CareWk
FTE Based on Hours
Total FTE
M Incisor DDS 29 789 Crown StTooth Fairy CA 99864
1=1
45 10(4540= 11=1)
10(10 x 1=10)
R Wisdom DDS1 78 789 Crown StTooth Fairy CA 99864
1=7
15 375 (1540= 375)
026(375 x 7= 26)
A Canine DDS2 40 33 Halitosis RdSmile City CA 99918
3=14
37 925(3740= 925)
129(925 x 14=129)
B Crown DDS3 39 103 Molar LaneChompers CA 99918
2=12
25 625(2540=625)
075(625 x 12= 75)
C Buck DDS4 32 66 Cavity PlaceMouthtown CA 99918
2=12
25 625(2540= 625)
075(625 x 12 =75)
Den
tal H
ealth
Geographic Dental Survey
40
1 ndash Dr Wisdom works 25 hoursweek in another location 2 ndash Dr Canine spends 3 hoursweek in administrative activities 3 ndash Dr Crown chooses to work 25 hoursweek 4 ndash Dr Buck spends 15 hoursweek in childcare activities
Total FTEs 405 = 41
Low-Income Dental Survey
41
1 ndash Dr Wisdom works 25 hours a week in another location 2 ndash Dr Canine spends 3 hours a week in administrative activities 3 ndash Dr Crown chooses to work 25 hours a week 4 ndash Dr Buck spends 15 hours a week in childcare activities
Total FTEs 1756 = 18
Dentist Name Hours of Direct Pt CareWeek
FTE Based on Hours
Total FTE Medi-Cal
SFS of Low- Income
Total Low-Income FTE
M Incisor DDS 45(4540= 11=1)
10 10(1x1= 1)
10 2 12(10+02=12)
012(12 x 1 = 12)
R Wisdom DDS
15(1540=375)
375 0262(375x07= 262)
00 0 0 00(0 x 262 = 0)
A Canine DDS 37(3740= 925)
925 129(925x14=129)
50 10 60(50+10=60)
0774(6 x 129 = 774)
B Crown DDS 25(2540=625)
625 075(625x12= 75)
20 20 40(20+20=40)
03(4 x 75 = 3)
C Buck DDS 25(2540= 625)
625 075(625x12 =75)
60 15 75(60+15=75)
05625(75 x 75 = 5625)
Den
tal H
ealth
Auxiliaries lt 55 55 ndash 59 60 ndash 64 65+
0 08 07 06 05
1 10 09 08 07
2 12 10 10 08
3 14 12 10 10
gt4 15 15 13 12
If an auxiliary is less than full-time round to the nearest whole number (04 = 0 05 = 1)
If more than one auxiliary works less than full time add total hours divide by 40 and round if not a whole number ([16+20] + [3240]) = 17 = 2
If of auxiliaries is not available Use weight lt55 = 12 55-59 = 09 60-64 = 08 and gt 65= 06
If dentistrsquos age and the number of auxiliaries are not available Use weight of 12
Auxiliaries are non-dentists assisting in dental caresuch as dental assistants hygienists etc
Auxiliaries amp Age
42
To determine the maximum allowable FTE divide the Civilian Population by the Ratio
Miles Minutes
Interstate Roads
30 x 133 =
40
Primary Roads
25x 160 =
40
Secondary Roads
20x 200 =
40
Travel Time and Max FTE
Geographic DesignationCivilian Population = 70000
Population to Provider Ratio 50001 Maximum FTE (700005000) = 140
Geographic Designation (High Needs) Civilian Population = 80000
Population to Provider Ratio 40001 Maximum FTE (800004000) = 200
Contiguous AreaCivilian Population = 75000
Population to Provider Ratio 30001 Maximum FTE (750003000) = 250
Providers gt 40 minutes from the population center are
excessively distant
Travel Time Calculating the Maximum FTE
43
Unique to Mental Health(Psychiatrists amp CMHP)
Health Professional Shortage Area (HPSA)
What are the Differences
Mental Health
44
Determine the population to provider ratios for geographic
and population designations
A rational service area plus one of the following
A rational service area can combine 1 or more MSSAs or whole countygt 300001 psychiatrists orgt 90001 CMHP including psychiatrists orgt 60001 CMHP including psychiatrists and gt 20000 psychiatrists
20 or more population is lt 100 of the poverty level or
The youth ratio ( of persons lt 18 to the of adults ages 18 - 64) is greater than 06 or
The elderly ratio ( of persons gt 65 to the of adults ages 18 - 64) is greater than 025 or
Alcohol or substance abuse prevalence data showing the area to be in the worst quartile of the region
gt 200001 psychiatrists orgt 60001 CMHP including psychiatrists orgt 45001 CMHP including psychiatrists and gt 150001 psychiatrists
Population to Provider Ratios
45
Geographic Area gt 300001
Geographic Area wHigh Needs gt 200001
Men
tal H
ealth
Number of individuals in the service area that are at or below 200 of the Federal poverty level
Must be gt30 of the population in the service area
gt 200001 psychiatrists orgt 60001 CMHP including psychiatrists orgt 45001 CMHP including psychiatrists and gt 150001 psychiatrists
200001 psychiatrists
or gt 30001 CMHP including psychiatrists and gt 100001 psychiatrists
Population to Provider Ratios
46
Low-Income Population gt 200001
Contiguous Areas are Overutilized if
Mental Health Designations
47
PsychiatristsClinical PsychologistsClinical Social WorkersPsychiatric Nurse SpecialistsMarriage and Family Therapists
Psychiatrists Only or Core Mental Health Providers (CMHP) including
must include all of the disciplines for this type of designation
Mental health providers engaged solely in administration research or teaching
Mental health hospital staff physicians involved exclusively in inpatient or emergency room care
Mental health providers who are suspended under provisions of the Medicaid-Medicare Anti-Fraud and Abuse Act for a period of 18 months or more
Mental health providers with full-time staff positions in correctional institutions youth detention facilities residential treatment centers for children with emotional or developmental disabilities and inpatient units of State or County mental hospitals
Exclusions from Survey
Note
Travel Times amp Survey
48
Road Type Miles Minutes
Interstate Roads
30 x 133 = 40
Primary Roads
25x 16 = 40
Secondary Roads
20x 20 = 40
Travel Times
Mental health providers who serve in the NHSC Scholarship or Loan Repayment Programs (FTEs will include State Loan Repayment Program recipients)
Physicians who are graduates of foreign medical schoolwho are not citizens or lawful permanent residents(including those with J-1or H-1B visas)
Mental health providers who are Federal providers
Mental health providers who are planning on retiring after 6 months but are still seeing patients
All providers who meet these qualifications should be listed even if their FTE will be zero
Include in Survey but Exclude FTE
Provider Name Specialty Location of Practice
Hrs of DirectPt CareWk1
FTE Based on Hours
Total FTE
S Freud MD Psychiatry 5 Oedipal LaneCity CA 90001
20 05(2040=5)
05
C Jung MD1 Psychiatry 11 Dream DriveCity CA 90001
40 05(4040=10105=5)
05
H Lecter PhD ClinicalPsychology
6 Can Street City CA 90021
26 65(2640=65)
065
M Houlihan RN PsychiatricNursing
1400 Captain Ave City CA 90003
55 1375(5540=1375=10)
10
R Weisheimer MFT
Marriage FamCounseling
69 Shex StreetCity CA 90009
10 25(1040=25)
025
L Schlessinger MSW
Clinical Social Work
1 Radio RoadCity CA 90006
6 015(640=15)
015
Total Psychiatrists 2 Total Psychiatrist FTE = 10Total Core Mental Health Providers 6 Total Core Mental Health FTE 305= 31
1 - Dr Jung is in his last year of residency and is therefore counted as 05
Geographic Mental Health Survey
49
Provider Name Specialty Location of Practice
Hours of Direct
Patient CareWk
FTE Based on Hours
Medi-
Cal
SFS
of L-I
Total L-IFTE
S Freud MD Psychiatry 5 Oedipal LaneCity CA 90001
20 05 0 0 0 00
C Jung MD Psychiatry 11 Dream DriveCity CA 90001
40 05 30 15 45 225(5 x 45 = 225)
H LecterPhD ClinicalPsychology
6 Can Street City CA 90021
26 65 0 85 85 55(65 x 85 = 5525)
M Houlihan RN
PsychiatricNursing
1400 Captain Avenue City CA 90003
55 10 50 10 60 6 (10 x 6 = 6)
R WeisheimerMS
MarriageFamCounseling
69 Shex StreetCity CA 90009
10 25 25 5 30 0075(25 x 3 = 075)
L Schlessinger MSW
Clinical Social Work
1 Radio RoadCity CA 90006
6 015 0 10 10 015(15 x 1 = 015)
Low-Income Mental Health Survey
50
Total Psychiatrists 2 Total L-I Psychiatrist FTE 0225 = 2
Total Core Mental Health Providers 6 Total L-I Core Mental Health FTE 1465 =15
Alcohol and Drug Use
51
Indicator State Rank of Counties Result Qualifies1 34 44 34 44 = 77 77 gt 75 = Yes2 30 49 30 49 = 61 61 lt 75 = No3 25 58 25 58 = 43 43 lt 75 = No4 57 58 57 58 = 98 98 gt 75 = Yes5 48 58 48 58 = 83 83 gt 75 = Yes6 15 50 1558 = 2 2 lt 75 = No7 45 58 4558 = 78 78 gt 75 = YesDoes the county have 4 out of 7 indicators Yes
The table for Key Indicators of Community Alcohol and Drug Use can be used to determine if the MSSA is located in a county that is in the lowest quartile in the state There are 7 key indicators The county must have 4 out of 7 indicators to qualify for a Geographic HPSA with high needs The web site is located at httpwwwadpcagovPreventionrisk_indicators_2010shtml
Formula State Rank of Counties = State Rank If the State Rank is gt 75 = Qualifies
The ldquo of Countiesrdquo participating in gathering the data is located directly underneath the Indicator Number third line down
Located to the right of each indicator under the last (or only) year the data was compiled is the ldquoState Rankrdquo for that indicator (third number down) (Note Do not use the Three Year Average)
Key Indicators of Community Alcohol
and Drug Use
This is unique to Mental HPSAs
Los Angeles County
The information required for a complete submission
How each factor is weighted and scored to determine a final Index of Medical Underservice (IMU) Score
The difference between MUAs amp MUPs
Measures the degree of underservice of an area (MUA) or a population (MUP)
Determine the Rational Service Area (RSA) (use MSSA)
Determine the Criteria amp Weighted Values of
Percent of Population at 100 Poverty
Percent of Population gt 65
Participants will understand
Infant Mortality Rate (IMR)
Primary Care Physicians per 1000 Population
Compute the Index of Medical Underservice ScoreValue must be lt 620
MUA = Medically Underserved Area
MUP Only ndash Primary Care Physicians serving the low-income population at 200 poverty level per 1000 low-income population
MUA amp MUP Designations
Objective MUA amp MUP Criteria
MUP = Medically Underserved Pop
52
Percent Population at 100 Poverty
53
Percent Below Poverty
WeightedValue
Percent Below Poverty
WeightedValue
Percent Below Poverty
WeightedValue
0 251 181-200 149 381-400 21
01-20 246 201-220 136 401-420 13
21-40 237 221-240 122 421-440 10
41-60 228 241-260 109 441-460 07
61-80 219 261-280 93 461-480 04
81-100 210 281-300 78 481-500 01
101-120 200 301-320 66 50 + 0
121-140 187 321-340 56 381-400 21
141-160 174 341-360 47 401-420 13
161-180 162 361-380 34 421-440 10
Determine the of the population in the area at the 100 poverty level
Calculate100 Poverty
Determine the weighed value
Note The weighted value is
the same for MUAs amp MUPs
See table
Use latest available data (2012 ACS Population Estimates)
Number at 100 Federal Poverty Level
Civilian Population
Divided By
Percentage of Population gt 65
54
of Pop gt 65
WeightedValue
of Pop gt 65
WeightedValue
of Pop gt 65
WeightedValue
0 ndash70 202 161-170 161 261-270 40
71-80 201 171-180 144 271-280 28
81-90 199 181-190 128 281-290 17
91-100 198 191-200 111 291-300 06
101-110 196 211-210 98 30 + 0
111-120 194 221-220 89 261-270 40
121-130 191 221-230 80 271-280 28
131-140 189 231-240 70 281-290 17
141-150 187 241-250 61 291-300 06
151-160 178 251-260 51 30 + 0
Determine the percentage of the in the area gt 65 years old
Determine the weighed value
Calculate percent for gt65 years old
Use the latest available data (2012 ACS Population Estimates)
See table
Note The weighted value is the same for MUAs amp MUPs
Number gt 65 yrs old
Civilian Population
Divided By
Infant Mortality Rate (IMR)
55
Infant Mortality
Rate
WeightedValue
Infant Mortality
Rate
WeightedValue
Infant Mortality
Rate
WeightedValue
Infant Mortality
Rate
WeightedValue
0-8 260 171-180 175 271-280 61 371-390 20
81-90 256 181-190 164 281-290 54 391-410 14
91-100 248 191-200 153 291-300 50 411-430 08
101-110 240 201-210 142 301-310 47 431-450 02
111-120 232 211-220 131 311-320 43 451+ 0
121-130 224 221-230 119 321-330 40
131-140 215 231-240 108 331-340 36
141-150 205 241-250 96 341-350 33
151-160 195 251-260 85 351-360 30
161-170 185 261-270 73 361-370 26
Use the OSD available data(5-year avg) or
OSD-approved State Department of Health data
Use the IMR for the county
Determine the weighed value
Calculation for gt65 years old
Note The weighted value is the same for MUAs amp MUPs
See table
Department of Public Healthrsquos Center for Health Statistics website httpwwwcdphcagovcertlicbirthdeathmarPagesdefaultaspx
of Infant Death
of Live Births
X 1000
Divided By
Providers per 1000 Population
Total FTECivilian Population x 1000
MUA
MUP Total FTEPop to be designated x 1000
All physicians must be counted (including J-1 Visa physicians NHSC physicians etc)
For MUA designations the HPSA adjustment factor for the FTE is not used
MUA ndash All primary care physicians are counted
MUA = civilian population
MUP ndash All primary care physicians servicing the population group are counted
MUP = number in that population group (eg low-income pop = pop at or below the 200 poverty)
Must collect inpatient and outpatient hours of the outpatient Doctors
(not hospitalists)
Determine the FTE
Determine the Population
Calculation
Determine the Weighted Value(see table)
56
Geographic Designation - FTEs
57
Provider Name Specialty Location of PracticeHours of Direct
Pt CareWk FTE Based on Hours
A Liver MD1 General Practice
86 N Onion StreetCity State Zip
48(4840=12=10)
10
B Spleen MD2 Pediatrics 103 Sanfgroid DrCity State Zip
30(3040=75)
075
C Heart MD Internal Medicine
777 Stopper AveCity State Zip
40 10
D Kidney DO OB-GYN 3306 Stone DriveCity State Zip
40 10
E Lung DO3 Family Practice 99 Airborne BlvdCity State Zip
25(2540=625)
0625
Total Physicians = 5 Total FTE = 4375 = 44
1 Dr Liver is an NHSC loan repayment recipient counted as 10 FTE
2 Dr Spleen spends 10 hoursweek doing research
3 Dr Lung spends 15 hours week in administration
Provider Name Specialty Location of Practice Hours of Direct
Pt CareWk
FTE Based on Hours
Medi-Cal
Sliding
Fee
of Low
Income
Total Low Income
FTE
A Liver MD GP 86 N Onion StCity State Zip
48 10 64 15 79 079
B Spleen MD PED 103 Sanfgroid DrCity State Zip
30 075 35 8 43 03225
C Heart MD IM 777 Stopper AveCity State Zip
40 10 60 40 100 10
D Kidney DO OB GYN 3306 Stone DriveCity State Zip
40 10 13 0 13 013
E Lung DO FP 99 Airborne BlvdCity State Zip
25 0625 7 0 7 004375
Total Physicians 5 Total Low-Income FTE 228625 = 23
Low-Income Population Designation - FTEs
58
Providers per 1000 Population
59
Prov per 1000 pop
WeightedValue
Prov per 1000 pop
WeightedValue
Prov per 1000 pop
WeightedValue
0-05 0 401-450 107 801-850 243
051-100 05 451-500 126 851-900 253
101-150 15 501-550 148 901-950 259
151-200 28 551-600 169 951-1000 266
201-250 41 601-650 191 1001-1050 272
251-300 57 651-700 207 1051-1100 277
301-350 73 701-750 219 1101-1150 280
351-400 90 751-800 231 1151-1200 283
1201-1250 286
Over 1250 287
find the range which includes
the ratio of primary care
physicians per 1000 population
for the area being examined
See table
Note The weighted value is the same for MUAs amp MUPs
Left Column
Index of Medical Underserved Score
60
Qualifies for designation as an MUAMUP
The IMU Score is determined by adding the values of each of the four factors
Percent of Population at 100 Poverty
Infant Mortality Rate (IMU)
Primary Care Physicians per 1000 Population
+Percent of Population gt 65
+
+
Does not qualify for designation as an MUAMUP
Before surveying providers check the IMU score of the first 3 variables
If V1 + V2 + V3 are gt 620 the area will not designate as an MUA or MUP
If the IMU gt 62 then review rational service area to determine if other boundaries would be appropriate
If not an MUA check if area would designate as an MUP
The IMU Score IMU lt 620
IMU gt 620
Time Saving Tips
MUAMUP Designation Worksheet
61
MUAMUP Designation Map
62
The orange area is a designated MUA and part of the designation is in MSSA 66a and part is in MSSA 63 Because of this the whole designation can be thrown out
MU
AM
UP
Map
HPSA Scores
63
HPSA scores are critical for US HRSA administered programs such as
National Health Service Corps (NHSC) Scholar Placements and Loan Repayment
J1-Visa Waiver Ready Responders
These programs rely on HPSA scores to prioritize resource allocation and level of assistance
DisciplinesPrimary Medical Care HPSA (4 factors = 25 points)
Dental Care HPSA (4 factors = 26 points)
Mental Health HPSA ( 7 factors = 26 points)
Note There is nothing in writing from the Feds on Mental Health
Primary Care HPSA Scores
64
Factor 1 ndash Population to Provider Ratio Score(x2)
gt100001 and the de-designation threshold is gt0
or there is no physicians and a population gt2500
5
lt100001 but gt50001 and the de-designation threshold is gt0
or there is no physicians and a population gt2000
4
lt50001 but gt40001 and the de-designation threshold is gt0
or there is no physicians and a population gt1500
3
lt40001 but gt35001 and the de-designation threshold is gt0
or there is no physicians and a population gt1000
2
lt35001 but gt30001 and the de-designation threshold is gt0
or there is no physicians and a population gt500
1
Factor 2 ndash 100 Poverty Rate
Score
gt50 5
lt50 but gt40 4
lt40 but gt30 3
lt30 but gt20 2
lt20 but gt15 1
For Primary Care there are 4 Factors for a total of 25 Points
100 Poverty RatePopulation to Provider Ratio
Factor 1Factor 2
Primary Care HPSA Scores (cont)
65
Infant Mortality
Rate
Low Birth Weight Rate
Score
gt200 or gt13 5
lt20 but gt18 or lt13 but gt11 4
lt18 but gt15 or lt11 but gt10 3
lt15 but gt12 or lt10 but gt9 2
lt12 but gt10 or lt9 but gt7 1
Time Distance Score
gt60 minutes gt50 miles 5
lt60 but gt50 minutes lt50 but gt40 miles 4
lt50 but gt40 minutes lt40 but gt30 miles 3
lt40 but gt30 minutes lt30 but gt20 miles 2
lt30 but gt20 minutes lt20 but gt10 miles 1
Average Travel Time or Distance to Nearest Source of Non-Designated Accessible Care (choose largest)
Infant Health Index (choose largest)
Factor 3Factor 4
Dental Health HPSA Scores
66
Factor 1 ndash Population to Provider Ratio Score(x2)
gt100001 and a de-designation threshold of gt0
or there is no dentists and a population gt3000
5
lt100001 but gt80001 and a de-designation threshold of gt0
or there is no dentists and a population gt2500
4
lt80001 but gt60001 and a de-designation threshold of gt0
or there is no dentists and a population gt2000
3
lt60001 but gt50001 and a de-designation threshold of gt0
or there is no dentists and a population gt1500
2
lt50001 but gt40001 and a de-designation threshold of gt0
or there is no dentists and a population gt1000
1
Factor 2 ndash 100 Poverty Rate
Score(x2)
gt50 5
lt50 but gt 40 4
lt40 but gt30 3
lt30 but gt20 2
lt20 but gt15 1
For Dental Health there are 4 Factors for a total of 26 Points
100 Poverty Rate
Population to Dentist Ratio
Factor 1Factor 2
Dental Health HPSA Scores (cont)
67
Water Not Fluoridated = Score of 1 point
Time Distance Score
gt90 minutes gt60 miles 5
lt90 but gt75 minutes lt60 but gt50 miles 4
lt75 but gt60 minutes lt50 but gt40 miles 3
lt60 but gt45 minutes lt40 but gt30 miles 2
lt45 but gt30 minutes lt30 but gt20 miles 1
Average Travel Time or Distance to Nearest Source of Non-Designated Accessible Care (choose largest)
Fluoridated Water
Factor 3 Factor 4
Mental Health HPSA Scores
68
Factor 1 ndash Population to Mental Provider Ratio Score
Psychiatrists Ratio Core Mental Health Ratiogt 450000 AND gt 45000 8
gt 45001 and lt 60001 7
lt 200001 and gt 150001 AND gt 60001 and lt 90001 6
lt 300001 and gt 150001 OR gt 45001 and LT 60001 5
lt 450001 and gt 200001 AND gt 45000 and LT 60000 4
gt 200001 AND gt 60001 3
gt 300001 2
gt 90001 1
Factor 2 ndash 100 Poverty Rate
Score
P() GE 50 5
50 gt P() GE 40 4
40 gt P() GE 30 3
30 gt P() GE 20 2
20 gt P() GE 15 1
P() lt 15 0
For Mental Health there are 7 Factors for a total of 26 Points
100 Poverty Rate
Population to Mental Provider Ratio
Factor 1
Factor 2
Mental Health HPSA Scores (cont)
69
Time Score
Time GE 60 minutes 5lt 60 min and gt50 minutes 4lt50 minutes and gt 40 minutes 3lt40 minutes and gt30 minutes 2lt30 minutes and gt20 minutes 1
Avg Travel Time or Distance to the Nearest Source of Non-Designated Accessible Care (choose largest)
Youth Ratio Ratio of Children under 18 to Adults 18-64
Score
gt25 3
lt25 and gt15 2
lt15 and gt10 1
Time Score
gt60 3
lt60 and gt40 2
lt40 and gt20 1
Score
Yes 1
No 0
Elderly Ratio Ratio of Adults over 65 to Adults 18-64
Substance Abuse prevalence Arearsquos rate is in worst quartile for nation region or state
Alcohol Abuse prevalence Arearsquos rate is in worst quartile for nation region or state
Score
Yes 1
No 0
Factor 3
Factor 4
Factor 5
Factor 6
Factor 7
Automatic HPSA
70
Legislation in 2002 created a new class of HPSAs not based on data but based on status as a certain type of facility
Statute
Federally Qualified Health Centers (FQHCs) that werenrsquot located in HPSAs still wanted access to NHSC Clinicians
Who is CoveredFederally Qualified Health Centers (FQHC)Community Health Centers
FQHC Look-A-Likes
Rural Health Clinics (RHCs) who submit the required application
Indian Health Service (IHS) and IHS ContractCompact Sites ndashTribal and Urban Indian Sites
IF THE SITE IS NOT ONE OF THESE IT DOES NOT QUALIFY FOR AUTO HPSA
Automatic HPSA
71
Scores
Important Note
No data no scoreDeveloped as a way to estimate using the national data Results were often no score or very low scoresOption to increase scores with alternative data available-posted on the websiteChanges in the loan repayment program with graduated payments and tiered funding has led to increased requests for score changes
We caution people that a high score is no guarantee given the small number of clinicians available so donrsquot waste too much energy
The HPSA applies to all sites that are a part of the FQHC or Look-A-Like
They have the same UDS but a different ALPHA code at the end now they have the BCHMIS
They are only listed under the ldquoMOTHER SITErdquo name and location which may be in a different county from a satellite site This information is listed on HPSAFIND website Recently HRSArsquos Office of Information Technology (OIT) created a tool that allows you to identify FQHCs and their Satellite sites See URL listed on ldquoResourcerdquo slide
Rural Health Clinics have to apply for each individual site
Automatic HPSA
72
Data Used to Compute Scores
Partial Scores
The current scoring methodology for primary care includes four factors
Population-to-Primary Care Physician RatioPercent of the Population with incomes below 100 of the Poverty LevelInfant Mortality Rate or Low Birth Weight (whichever score is higher) andTravel Time or Distance to the nearest available source of care (whichever score is higher)
There is a transformation scale that allows computation of partial scores for the four factors
The sum of these partial scores form the total HPSA score except that the partial score for Population-to-Primary Care Physician Ratio is double weighted because HPSA designations are primarily intended to measure the shortage of primary care providers within the HPSA For Dental HPSAs the poverty factor is also doubled
Automatic HPSA
73
Population to Primary Care Physician Ratio
For the FQHC grantees FQHC Look-a-Likes and RHCs these ratios were calculated for the following
Defined Primary Care Service Area (PCSA) which included the location of the facility
As an approximation to the service area of the facility and
Resident civilian population data from the census were used and primary care physician data were taken from the combined AMAAOA files used by the Office of Shortage Designation
For the IHS Service Units and the Alaska Native facilities Native American or Alaska Native population
Figures from the IHS or the Alaska Native Health System were used and
Physician data represent the non-federal providers in the area as reported by the IHS or the Alaska Native Health System
Automatic HPSA
74
Percent of the population with incomes below 100 of the poverty level
For FQHC granteesInitially 2002 Uniform Data System (UDS)-reported data on percent of users with incomes below 100 of poverty were used more recent UDS data used subsequently
For FQHC Look-a-likes and Rural Health Clinics (RHCs)The 2000 census poverty data for the county of location were used We now have UDS Data for FQHC Look-a-Likes
For the IHS and Alaska Native areas The census poverty data for Native American populations within those areas were used or data supplied by the IHS
Automatic HPSA
75
Travel Time or Distance to the Nearest Available Source of CareFor FQHC grantees FQHC Look-a-Likes and RHCs
Travel time and distance were calculated from the population-weighted center of the PCSA in which the entity was located to the population-weighted center of the nearest PCSA with a population-to-primary care physician ratio of at least 20001 using average road speeds and travel time for each road segment involved
For IHS and Alaska Natives Data reported by the IHS or the Alaska Native Health System were used
Infant Mortality Rate or Low Birth Weight (IMRLBW)For FQHC grantees FQHC Look-a-Likes and RHCs
IMRLBW rates for the PCSAs including the FQHC or RHC were used
For IHS and Alaska Native scoring Service unit data for the appropriate populations were used
Acronyms
76
Acronym and MeaningALOS Average Length of Stay CHMPC California Healthcare Workforce Policy
Commission
AMA American Medical Association CDPH California Department of Public Health
ASAPS Application Submission and Processing System CMHP Core Mental Health ProvidersProfessionals
BHCDANET
Bureau of Health Care Delivery and Assistance (NET)
CMS Center for MedicaidMedicare Services (formerly HCFA)
BHW Bureau of Health Workforce CPCA California Primary Care Association
BPHC Bureau of Primary Health Care CT Census Tract
BOP Bureau of Prisons DHHS Department of Health and Human Services
CA Cooperative Agreement DHCS Department of Health Care Services
CCD County Census Division DT Dental
CFR Code of Federal Register FQHC Federally Qualified Health Center
CHC Community Health Center FTE Full-Time Equivalent
Acronyms (cont)
77
Acronym and MeaningGIS Geographic Information System MSSA Medical Service Study Areas
HMO Health Maintenance Organization MUA Medically Underserved Areas
HPSA Health Professional Shortage Areas MUP Medically Underserved Populations
HRSA Health Resources and Services Administration NHSC National Health Service Corps
IHP Indian Health Program PC Primary Care
IHS Indian Health Services PCA Primary Care Association
IMR Infant Mortality Rate PCO Primary Care Office
IMU Index of Medical Underservice RHC Rural Health Clinic
MCD Minor Civil Division RSA Rational Service Area
MFW Migrant Farmworker SFS Sliding Fee Scale
MSFW Migrant Seasonal Farmworker SLRP State Loan Repayment Program
MH Mental Health TA Technical Assistance
Other Resources
78
SLRP httposhpdcagovHWDDSLRPhtml
OSHPD httpwwwoshpdcagov
NHSC httpnhschrsagov
Address Lookup httpgeooshpdcagovhpsa-search-by-address
CalHealth httpswwwfacebookcomCalHealthWorkforce
Twitter httpstwittercomHealthProfCAgov
J1-Visa Waiver Program httpwwwdhcscagovservicesruralPagesJ-1VisaWaiveraspx
HPSA Find httphpsafindhrsagov
HRSA Data Warehouse httpwwwhrsagovdata-statisticsindexhtml
Shortage Designation Program httpwwwoshpdcagovHWDDShortage_Designation_Proghtml
Geographic Information Systems (GIS) httpwwwoshpdcagovHWDDResearch_Policy_Planning_GIShtml
MSFW Enumeration Profiles Estimates httpwwwncfhorgenumerationPDF220Californiapdf
Health Professional Shortage Area (HPSA)
Join the HPSA Tour
Shortage Designation Program (SDP) Concludes
HOPE TO SEE YOU AGAIN
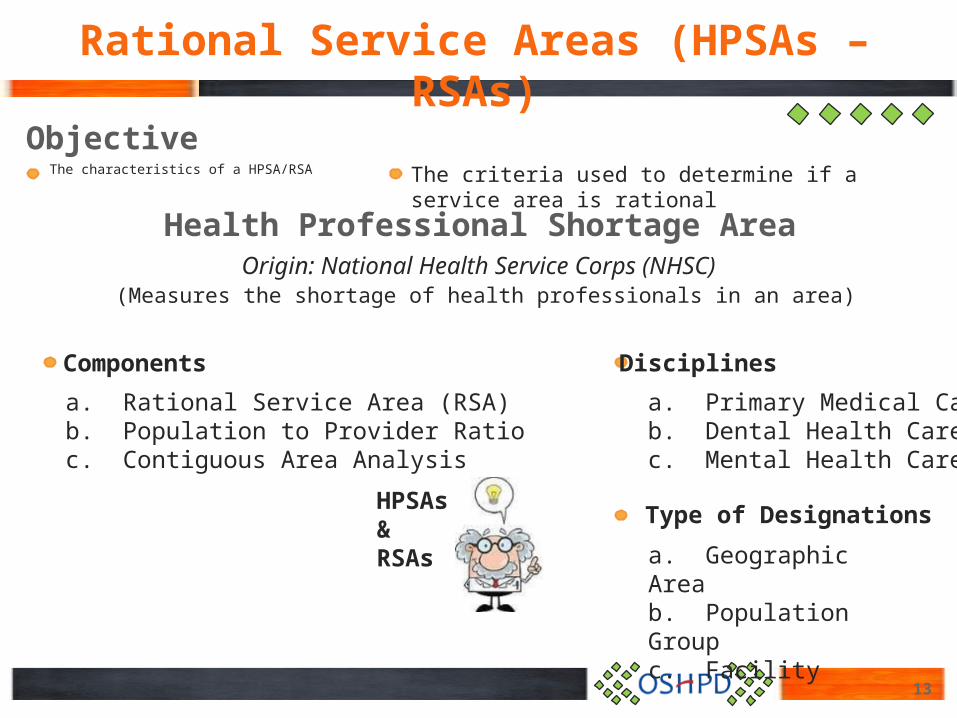
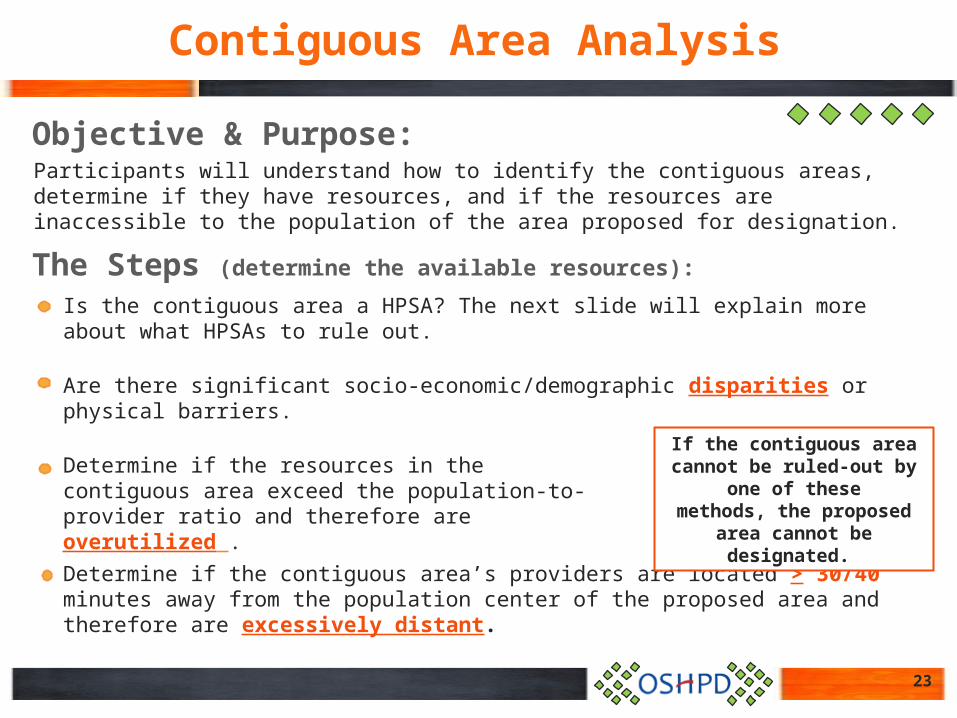
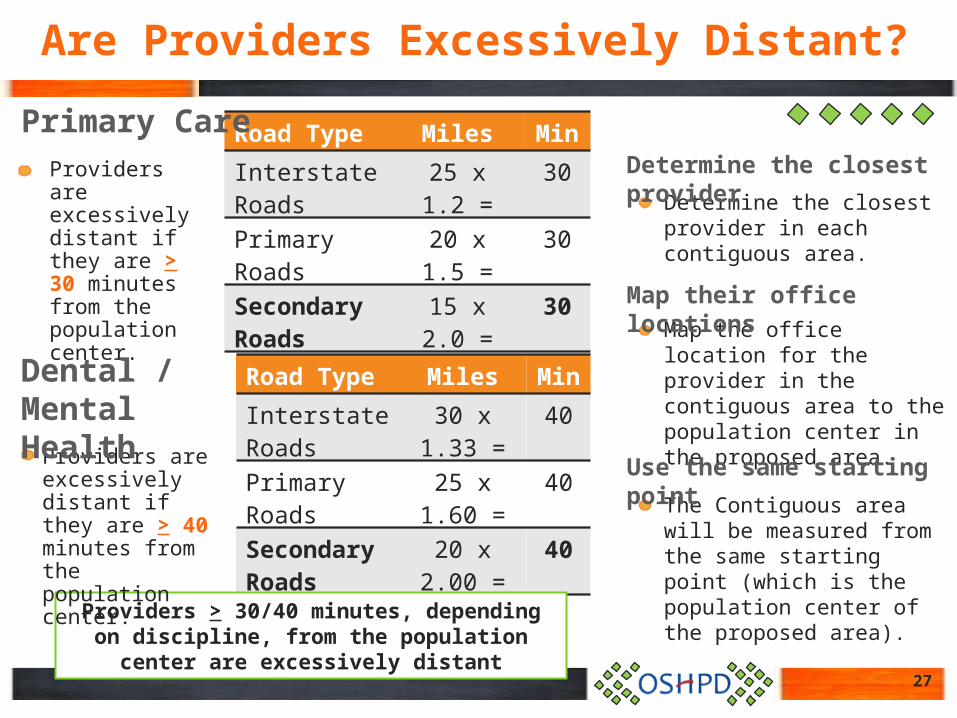

Population to Provider Ratios
34
Determine the population to provider ratios for geographic and population designations
A rational service area plus meets the requirements of the specific designation category (eg low-income homeless etc)
More than 20 of the population has incomes at or below 100 of the Federal poverty level or
A rational service area county or sub-county (MSSA)
More than 100 births per year per 1000 women ages 15-44 or
More than 20 infant deaths per 1000 live births1 or
Meets insufficient capacity criteria
Geographic Area gt 35001
Geographic Area wUnusually High Needs gt 30001
Population Groups gt 30001
Contiguous Areas are Overutilized if gt 20001
A rational service area plus one of the following
Prim
ary
Care
Sur
vey
Geographic Designation FTE
35
Physician Name SP Location of PracticeCT Census Track
Hrs of Direct Patient
CareWk
Hosp Hours
FTE
L McCoy DO GP 19 Main Street City CA 90001 531 48 Incld 10(4840=12=10)
D Scully MD 1 Ped 11 Park Place City CA 90001 540 30 Incld 08(3040=75=8)
B Spock MD 2 IM 6 Muldar Ave City CA 90002 538 15 Incld 04(1540=375=4)
M Welby MD3 OBG 3306 Russia Blvd City CA 90002
543 25 Not Incld
625(2540=625=6)
Y Zhivago DO 4
FP 99 Bones Drive City CA 90003 539 0 --- 00(040=0)
Total Physicians 5 Total FTE 2825 = 301 ndash Dr Scully spends 10 hours a week doing research2 ndash Dr Spock chooses to work only 15 hoursweek 3 ndash Dr Welby ndash chooses to work to work 25 hours4 ndash Dr Zhivago spends full-time in administration
Low-Income Designation FTE
36
Physician Name Hours of Direct Pt CareWk
Hosp
Hours
FTE
Medi -Cal
SFS
of Low-Income Total Low-Income
FTE
L McCoy DO 48 Incld 4840 =12=10
64 15 79(64+15=79)
079(79 x 10 = 79 )
D Scully MD 1 30 Incld 3040 = 075 35 8 43(35+8=43)
032(43 x 75 = 322)
B Spock MD 2 15 Incld 1540=0375 60 40 100(60+40=100)
375(1 x 375 = 375)
M Welby MD 3 25 Not Incld
2540=625 13 0 13 008(13 x 625=08)
Y Zhivago DO 4
0 Incld 00 0 0 0 000
Total Physicians 5 Total Low-Inc FTE 1565 = 16 1 ndash Dr Scully spends 10 hours a week doing research2 ndash Dr Spock chooses to work only 15 hours a week3 ndash Dr Welby chooses to work 25 hours a week4 ndash Dr Zhivago spends full-time in administration
40 hours = 10 FTE
Every 4 hours (12 day) = 01 FTE
40+ hours = 10 FTE
Interns amp residents = 01 FTE
Only the total FTE is rounded to the nearest tenth of a percent
FT
E
For each provider include the number of hours of direct patient care provided office and hospital inpatient in the service area
Rounding Examples
0875 = 09 0817 = 08083 = 08 085 = 09
The FTE for low-income
population designations is
based on the average
number of hours
Medicaid and Sliding
per week
spent
with
Fee Scale (SFS) patients
Prim
ary
Care
FTE Calculation
37
What are the Differencesunique to Dental Health
(DDS amp DMD)
Health Professional Shortage Area (HPSA)
Dental Health
38
A rational service area plus meets the requirements of the specific designation category (eg low-income homeless etc)
A rational service area plusMore than 20 of the population has incomes at or below 100 of the Federal poverty level or
A rational service area county or sub-county (MSSA)
More than 50 of the population has no fluoridated water or
Meets insufficient capacity criteria
Population to Provider Ratios
39
Geographic Area gt 50001
Geographic Area wHigh Needs gt 40001
Population Groups gt 40001
Contiguous Areas are overutilized if gt 30001
Dentist Name Age Location of Practice
of Aux
Hours of Direct Pt CareWk
FTE Based on Hours
Total FTE
M Incisor DDS 29 789 Crown StTooth Fairy CA 99864
1=1
45 10(4540= 11=1)
10(10 x 1=10)
R Wisdom DDS1 78 789 Crown StTooth Fairy CA 99864
1=7
15 375 (1540= 375)
026(375 x 7= 26)
A Canine DDS2 40 33 Halitosis RdSmile City CA 99918
3=14
37 925(3740= 925)
129(925 x 14=129)
B Crown DDS3 39 103 Molar LaneChompers CA 99918
2=12
25 625(2540=625)
075(625 x 12= 75)
C Buck DDS4 32 66 Cavity PlaceMouthtown CA 99918
2=12
25 625(2540= 625)
075(625 x 12 =75)
Den
tal H
ealth
Geographic Dental Survey
40
1 ndash Dr Wisdom works 25 hoursweek in another location 2 ndash Dr Canine spends 3 hoursweek in administrative activities 3 ndash Dr Crown chooses to work 25 hoursweek 4 ndash Dr Buck spends 15 hoursweek in childcare activities
Total FTEs 405 = 41
Low-Income Dental Survey
41
1 ndash Dr Wisdom works 25 hours a week in another location 2 ndash Dr Canine spends 3 hours a week in administrative activities 3 ndash Dr Crown chooses to work 25 hours a week 4 ndash Dr Buck spends 15 hours a week in childcare activities
Total FTEs 1756 = 18
Dentist Name Hours of Direct Pt CareWeek
FTE Based on Hours
Total FTE Medi-Cal
SFS of Low- Income
Total Low-Income FTE
M Incisor DDS 45(4540= 11=1)
10 10(1x1= 1)
10 2 12(10+02=12)
012(12 x 1 = 12)
R Wisdom DDS
15(1540=375)
375 0262(375x07= 262)
00 0 0 00(0 x 262 = 0)
A Canine DDS 37(3740= 925)
925 129(925x14=129)
50 10 60(50+10=60)
0774(6 x 129 = 774)
B Crown DDS 25(2540=625)
625 075(625x12= 75)
20 20 40(20+20=40)
03(4 x 75 = 3)
C Buck DDS 25(2540= 625)
625 075(625x12 =75)
60 15 75(60+15=75)
05625(75 x 75 = 5625)
Den
tal H
ealth
Auxiliaries lt 55 55 ndash 59 60 ndash 64 65+
0 08 07 06 05
1 10 09 08 07
2 12 10 10 08
3 14 12 10 10
gt4 15 15 13 12
If an auxiliary is less than full-time round to the nearest whole number (04 = 0 05 = 1)
If more than one auxiliary works less than full time add total hours divide by 40 and round if not a whole number ([16+20] + [3240]) = 17 = 2
If of auxiliaries is not available Use weight lt55 = 12 55-59 = 09 60-64 = 08 and gt 65= 06
If dentistrsquos age and the number of auxiliaries are not available Use weight of 12
Auxiliaries are non-dentists assisting in dental caresuch as dental assistants hygienists etc
Auxiliaries amp Age
42
To determine the maximum allowable FTE divide the Civilian Population by the Ratio
Miles Minutes
Interstate Roads
30 x 133 =
40
Primary Roads
25x 160 =
40
Secondary Roads
20x 200 =
40
Travel Time and Max FTE
Geographic DesignationCivilian Population = 70000
Population to Provider Ratio 50001 Maximum FTE (700005000) = 140
Geographic Designation (High Needs) Civilian Population = 80000
Population to Provider Ratio 40001 Maximum FTE (800004000) = 200
Contiguous AreaCivilian Population = 75000
Population to Provider Ratio 30001 Maximum FTE (750003000) = 250
Providers gt 40 minutes from the population center are
excessively distant
Travel Time Calculating the Maximum FTE
43
Unique to Mental Health(Psychiatrists amp CMHP)
Health Professional Shortage Area (HPSA)
What are the Differences
Mental Health
44
Determine the population to provider ratios for geographic
and population designations
A rational service area plus one of the following
A rational service area can combine 1 or more MSSAs or whole countygt 300001 psychiatrists orgt 90001 CMHP including psychiatrists orgt 60001 CMHP including psychiatrists and gt 20000 psychiatrists
20 or more population is lt 100 of the poverty level or
The youth ratio ( of persons lt 18 to the of adults ages 18 - 64) is greater than 06 or
The elderly ratio ( of persons gt 65 to the of adults ages 18 - 64) is greater than 025 or
Alcohol or substance abuse prevalence data showing the area to be in the worst quartile of the region
gt 200001 psychiatrists orgt 60001 CMHP including psychiatrists orgt 45001 CMHP including psychiatrists and gt 150001 psychiatrists
Population to Provider Ratios
45
Geographic Area gt 300001
Geographic Area wHigh Needs gt 200001
Men
tal H
ealth
Number of individuals in the service area that are at or below 200 of the Federal poverty level
Must be gt30 of the population in the service area
gt 200001 psychiatrists orgt 60001 CMHP including psychiatrists orgt 45001 CMHP including psychiatrists and gt 150001 psychiatrists
200001 psychiatrists
or gt 30001 CMHP including psychiatrists and gt 100001 psychiatrists
Population to Provider Ratios
46
Low-Income Population gt 200001
Contiguous Areas are Overutilized if
Mental Health Designations
47
PsychiatristsClinical PsychologistsClinical Social WorkersPsychiatric Nurse SpecialistsMarriage and Family Therapists
Psychiatrists Only or Core Mental Health Providers (CMHP) including
must include all of the disciplines for this type of designation
Mental health providers engaged solely in administration research or teaching
Mental health hospital staff physicians involved exclusively in inpatient or emergency room care
Mental health providers who are suspended under provisions of the Medicaid-Medicare Anti-Fraud and Abuse Act for a period of 18 months or more
Mental health providers with full-time staff positions in correctional institutions youth detention facilities residential treatment centers for children with emotional or developmental disabilities and inpatient units of State or County mental hospitals
Exclusions from Survey
Note
Travel Times amp Survey
48
Road Type Miles Minutes
Interstate Roads
30 x 133 = 40
Primary Roads
25x 16 = 40
Secondary Roads
20x 20 = 40
Travel Times
Mental health providers who serve in the NHSC Scholarship or Loan Repayment Programs (FTEs will include State Loan Repayment Program recipients)
Physicians who are graduates of foreign medical schoolwho are not citizens or lawful permanent residents(including those with J-1or H-1B visas)
Mental health providers who are Federal providers
Mental health providers who are planning on retiring after 6 months but are still seeing patients
All providers who meet these qualifications should be listed even if their FTE will be zero
Include in Survey but Exclude FTE
Provider Name Specialty Location of Practice
Hrs of DirectPt CareWk1
FTE Based on Hours
Total FTE
S Freud MD Psychiatry 5 Oedipal LaneCity CA 90001
20 05(2040=5)
05
C Jung MD1 Psychiatry 11 Dream DriveCity CA 90001
40 05(4040=10105=5)
05
H Lecter PhD ClinicalPsychology
6 Can Street City CA 90021
26 65(2640=65)
065
M Houlihan RN PsychiatricNursing
1400 Captain Ave City CA 90003
55 1375(5540=1375=10)
10
R Weisheimer MFT
Marriage FamCounseling
69 Shex StreetCity CA 90009
10 25(1040=25)
025
L Schlessinger MSW
Clinical Social Work
1 Radio RoadCity CA 90006
6 015(640=15)
015
Total Psychiatrists 2 Total Psychiatrist FTE = 10Total Core Mental Health Providers 6 Total Core Mental Health FTE 305= 31
1 - Dr Jung is in his last year of residency and is therefore counted as 05
Geographic Mental Health Survey
49
Provider Name Specialty Location of Practice
Hours of Direct
Patient CareWk
FTE Based on Hours
Medi-
Cal
SFS
of L-I
Total L-IFTE
S Freud MD Psychiatry 5 Oedipal LaneCity CA 90001
20 05 0 0 0 00
C Jung MD Psychiatry 11 Dream DriveCity CA 90001
40 05 30 15 45 225(5 x 45 = 225)
H LecterPhD ClinicalPsychology
6 Can Street City CA 90021
26 65 0 85 85 55(65 x 85 = 5525)
M Houlihan RN
PsychiatricNursing
1400 Captain Avenue City CA 90003
55 10 50 10 60 6 (10 x 6 = 6)
R WeisheimerMS
MarriageFamCounseling
69 Shex StreetCity CA 90009
10 25 25 5 30 0075(25 x 3 = 075)
L Schlessinger MSW
Clinical Social Work
1 Radio RoadCity CA 90006
6 015 0 10 10 015(15 x 1 = 015)
Low-Income Mental Health Survey
50
Total Psychiatrists 2 Total L-I Psychiatrist FTE 0225 = 2
Total Core Mental Health Providers 6 Total L-I Core Mental Health FTE 1465 =15
Alcohol and Drug Use
51
Indicator State Rank of Counties Result Qualifies1 34 44 34 44 = 77 77 gt 75 = Yes2 30 49 30 49 = 61 61 lt 75 = No3 25 58 25 58 = 43 43 lt 75 = No4 57 58 57 58 = 98 98 gt 75 = Yes5 48 58 48 58 = 83 83 gt 75 = Yes6 15 50 1558 = 2 2 lt 75 = No7 45 58 4558 = 78 78 gt 75 = YesDoes the county have 4 out of 7 indicators Yes
The table for Key Indicators of Community Alcohol and Drug Use can be used to determine if the MSSA is located in a county that is in the lowest quartile in the state There are 7 key indicators The county must have 4 out of 7 indicators to qualify for a Geographic HPSA with high needs The web site is located at httpwwwadpcagovPreventionrisk_indicators_2010shtml
Formula State Rank of Counties = State Rank If the State Rank is gt 75 = Qualifies
The ldquo of Countiesrdquo participating in gathering the data is located directly underneath the Indicator Number third line down
Located to the right of each indicator under the last (or only) year the data was compiled is the ldquoState Rankrdquo for that indicator (third number down) (Note Do not use the Three Year Average)
Key Indicators of Community Alcohol
and Drug Use
This is unique to Mental HPSAs
Los Angeles County
The information required for a complete submission
How each factor is weighted and scored to determine a final Index of Medical Underservice (IMU) Score
The difference between MUAs amp MUPs
Measures the degree of underservice of an area (MUA) or a population (MUP)
Determine the Rational Service Area (RSA) (use MSSA)
Determine the Criteria amp Weighted Values of
Percent of Population at 100 Poverty
Percent of Population gt 65
Participants will understand
Infant Mortality Rate (IMR)
Primary Care Physicians per 1000 Population
Compute the Index of Medical Underservice ScoreValue must be lt 620
MUA = Medically Underserved Area
MUP Only ndash Primary Care Physicians serving the low-income population at 200 poverty level per 1000 low-income population
MUA amp MUP Designations
Objective MUA amp MUP Criteria
MUP = Medically Underserved Pop
52
Percent Population at 100 Poverty
53
Percent Below Poverty
WeightedValue
Percent Below Poverty
WeightedValue
Percent Below Poverty
WeightedValue
0 251 181-200 149 381-400 21
01-20 246 201-220 136 401-420 13
21-40 237 221-240 122 421-440 10
41-60 228 241-260 109 441-460 07
61-80 219 261-280 93 461-480 04
81-100 210 281-300 78 481-500 01
101-120 200 301-320 66 50 + 0
121-140 187 321-340 56 381-400 21
141-160 174 341-360 47 401-420 13
161-180 162 361-380 34 421-440 10
Determine the of the population in the area at the 100 poverty level
Calculate100 Poverty
Determine the weighed value
Note The weighted value is
the same for MUAs amp MUPs
See table
Use latest available data (2012 ACS Population Estimates)
Number at 100 Federal Poverty Level
Civilian Population
Divided By
Percentage of Population gt 65
54
of Pop gt 65
WeightedValue
of Pop gt 65
WeightedValue
of Pop gt 65
WeightedValue
0 ndash70 202 161-170 161 261-270 40
71-80 201 171-180 144 271-280 28
81-90 199 181-190 128 281-290 17
91-100 198 191-200 111 291-300 06
101-110 196 211-210 98 30 + 0
111-120 194 221-220 89 261-270 40
121-130 191 221-230 80 271-280 28
131-140 189 231-240 70 281-290 17
141-150 187 241-250 61 291-300 06
151-160 178 251-260 51 30 + 0
Determine the percentage of the in the area gt 65 years old
Determine the weighed value
Calculate percent for gt65 years old
Use the latest available data (2012 ACS Population Estimates)
See table
Note The weighted value is the same for MUAs amp MUPs
Number gt 65 yrs old
Civilian Population
Divided By
Infant Mortality Rate (IMR)
55
Infant Mortality
Rate
WeightedValue
Infant Mortality
Rate
WeightedValue
Infant Mortality
Rate
WeightedValue
Infant Mortality
Rate
WeightedValue
0-8 260 171-180 175 271-280 61 371-390 20
81-90 256 181-190 164 281-290 54 391-410 14
91-100 248 191-200 153 291-300 50 411-430 08
101-110 240 201-210 142 301-310 47 431-450 02
111-120 232 211-220 131 311-320 43 451+ 0
121-130 224 221-230 119 321-330 40
131-140 215 231-240 108 331-340 36
141-150 205 241-250 96 341-350 33
151-160 195 251-260 85 351-360 30
161-170 185 261-270 73 361-370 26
Use the OSD available data(5-year avg) or
OSD-approved State Department of Health data
Use the IMR for the county
Determine the weighed value
Calculation for gt65 years old
Note The weighted value is the same for MUAs amp MUPs
See table
Department of Public Healthrsquos Center for Health Statistics website httpwwwcdphcagovcertlicbirthdeathmarPagesdefaultaspx
of Infant Death
of Live Births
X 1000
Divided By
Providers per 1000 Population
Total FTECivilian Population x 1000
MUA
MUP Total FTEPop to be designated x 1000
All physicians must be counted (including J-1 Visa physicians NHSC physicians etc)
For MUA designations the HPSA adjustment factor for the FTE is not used
MUA ndash All primary care physicians are counted
MUA = civilian population
MUP ndash All primary care physicians servicing the population group are counted
MUP = number in that population group (eg low-income pop = pop at or below the 200 poverty)
Must collect inpatient and outpatient hours of the outpatient Doctors
(not hospitalists)
Determine the FTE
Determine the Population
Calculation
Determine the Weighted Value(see table)
56
Geographic Designation - FTEs
57
Provider Name Specialty Location of PracticeHours of Direct
Pt CareWk FTE Based on Hours
A Liver MD1 General Practice
86 N Onion StreetCity State Zip
48(4840=12=10)
10
B Spleen MD2 Pediatrics 103 Sanfgroid DrCity State Zip
30(3040=75)
075
C Heart MD Internal Medicine
777 Stopper AveCity State Zip
40 10
D Kidney DO OB-GYN 3306 Stone DriveCity State Zip
40 10
E Lung DO3 Family Practice 99 Airborne BlvdCity State Zip
25(2540=625)
0625
Total Physicians = 5 Total FTE = 4375 = 44
1 Dr Liver is an NHSC loan repayment recipient counted as 10 FTE
2 Dr Spleen spends 10 hoursweek doing research
3 Dr Lung spends 15 hours week in administration
Provider Name Specialty Location of Practice Hours of Direct
Pt CareWk
FTE Based on Hours
Medi-Cal
Sliding
Fee
of Low
Income
Total Low Income
FTE
A Liver MD GP 86 N Onion StCity State Zip
48 10 64 15 79 079
B Spleen MD PED 103 Sanfgroid DrCity State Zip
30 075 35 8 43 03225
C Heart MD IM 777 Stopper AveCity State Zip
40 10 60 40 100 10
D Kidney DO OB GYN 3306 Stone DriveCity State Zip
40 10 13 0 13 013
E Lung DO FP 99 Airborne BlvdCity State Zip
25 0625 7 0 7 004375
Total Physicians 5 Total Low-Income FTE 228625 = 23
Low-Income Population Designation - FTEs
58
Providers per 1000 Population
59
Prov per 1000 pop
WeightedValue
Prov per 1000 pop
WeightedValue
Prov per 1000 pop
WeightedValue
0-05 0 401-450 107 801-850 243
051-100 05 451-500 126 851-900 253
101-150 15 501-550 148 901-950 259
151-200 28 551-600 169 951-1000 266
201-250 41 601-650 191 1001-1050 272
251-300 57 651-700 207 1051-1100 277
301-350 73 701-750 219 1101-1150 280
351-400 90 751-800 231 1151-1200 283
1201-1250 286
Over 1250 287
find the range which includes
the ratio of primary care
physicians per 1000 population
for the area being examined
See table
Note The weighted value is the same for MUAs amp MUPs
Left Column
Index of Medical Underserved Score
60
Qualifies for designation as an MUAMUP
The IMU Score is determined by adding the values of each of the four factors
Percent of Population at 100 Poverty
Infant Mortality Rate (IMU)
Primary Care Physicians per 1000 Population
+Percent of Population gt 65
+
+
Does not qualify for designation as an MUAMUP
Before surveying providers check the IMU score of the first 3 variables
If V1 + V2 + V3 are gt 620 the area will not designate as an MUA or MUP
If the IMU gt 62 then review rational service area to determine if other boundaries would be appropriate
If not an MUA check if area would designate as an MUP
The IMU Score IMU lt 620
IMU gt 620
Time Saving Tips
MUAMUP Designation Worksheet
61
MUAMUP Designation Map
62
The orange area is a designated MUA and part of the designation is in MSSA 66a and part is in MSSA 63 Because of this the whole designation can be thrown out
MU
AM
UP
Map
HPSA Scores
63
HPSA scores are critical for US HRSA administered programs such as
National Health Service Corps (NHSC) Scholar Placements and Loan Repayment
J1-Visa Waiver Ready Responders
These programs rely on HPSA scores to prioritize resource allocation and level of assistance
DisciplinesPrimary Medical Care HPSA (4 factors = 25 points)
Dental Care HPSA (4 factors = 26 points)
Mental Health HPSA ( 7 factors = 26 points)
Note There is nothing in writing from the Feds on Mental Health
Primary Care HPSA Scores
64
Factor 1 ndash Population to Provider Ratio Score(x2)
gt100001 and the de-designation threshold is gt0
or there is no physicians and a population gt2500
5
lt100001 but gt50001 and the de-designation threshold is gt0
or there is no physicians and a population gt2000
4
lt50001 but gt40001 and the de-designation threshold is gt0
or there is no physicians and a population gt1500
3
lt40001 but gt35001 and the de-designation threshold is gt0
or there is no physicians and a population gt1000
2
lt35001 but gt30001 and the de-designation threshold is gt0
or there is no physicians and a population gt500
1
Factor 2 ndash 100 Poverty Rate
Score
gt50 5
lt50 but gt40 4
lt40 but gt30 3
lt30 but gt20 2
lt20 but gt15 1
For Primary Care there are 4 Factors for a total of 25 Points
100 Poverty RatePopulation to Provider Ratio
Factor 1Factor 2
Primary Care HPSA Scores (cont)
65
Infant Mortality
Rate
Low Birth Weight Rate
Score
gt200 or gt13 5
lt20 but gt18 or lt13 but gt11 4
lt18 but gt15 or lt11 but gt10 3
lt15 but gt12 or lt10 but gt9 2
lt12 but gt10 or lt9 but gt7 1
Time Distance Score
gt60 minutes gt50 miles 5
lt60 but gt50 minutes lt50 but gt40 miles 4
lt50 but gt40 minutes lt40 but gt30 miles 3
lt40 but gt30 minutes lt30 but gt20 miles 2
lt30 but gt20 minutes lt20 but gt10 miles 1
Average Travel Time or Distance to Nearest Source of Non-Designated Accessible Care (choose largest)
Infant Health Index (choose largest)
Factor 3Factor 4
Dental Health HPSA Scores
66
Factor 1 ndash Population to Provider Ratio Score(x2)
gt100001 and a de-designation threshold of gt0
or there is no dentists and a population gt3000
5
lt100001 but gt80001 and a de-designation threshold of gt0
or there is no dentists and a population gt2500
4
lt80001 but gt60001 and a de-designation threshold of gt0
or there is no dentists and a population gt2000
3
lt60001 but gt50001 and a de-designation threshold of gt0
or there is no dentists and a population gt1500
2
lt50001 but gt40001 and a de-designation threshold of gt0
or there is no dentists and a population gt1000
1
Factor 2 ndash 100 Poverty Rate
Score(x2)
gt50 5
lt50 but gt 40 4
lt40 but gt30 3
lt30 but gt20 2
lt20 but gt15 1
For Dental Health there are 4 Factors for a total of 26 Points
100 Poverty Rate
Population to Dentist Ratio
Factor 1Factor 2
Dental Health HPSA Scores (cont)
67
Water Not Fluoridated = Score of 1 point
Time Distance Score
gt90 minutes gt60 miles 5
lt90 but gt75 minutes lt60 but gt50 miles 4
lt75 but gt60 minutes lt50 but gt40 miles 3
lt60 but gt45 minutes lt40 but gt30 miles 2
lt45 but gt30 minutes lt30 but gt20 miles 1
Average Travel Time or Distance to Nearest Source of Non-Designated Accessible Care (choose largest)
Fluoridated Water
Factor 3 Factor 4
Mental Health HPSA Scores
68
Factor 1 ndash Population to Mental Provider Ratio Score
Psychiatrists Ratio Core Mental Health Ratiogt 450000 AND gt 45000 8
gt 45001 and lt 60001 7
lt 200001 and gt 150001 AND gt 60001 and lt 90001 6
lt 300001 and gt 150001 OR gt 45001 and LT 60001 5
lt 450001 and gt 200001 AND gt 45000 and LT 60000 4
gt 200001 AND gt 60001 3
gt 300001 2
gt 90001 1
Factor 2 ndash 100 Poverty Rate
Score
P() GE 50 5
50 gt P() GE 40 4
40 gt P() GE 30 3
30 gt P() GE 20 2
20 gt P() GE 15 1
P() lt 15 0
For Mental Health there are 7 Factors for a total of 26 Points
100 Poverty Rate
Population to Mental Provider Ratio
Factor 1
Factor 2
Mental Health HPSA Scores (cont)
69
Time Score
Time GE 60 minutes 5lt 60 min and gt50 minutes 4lt50 minutes and gt 40 minutes 3lt40 minutes and gt30 minutes 2lt30 minutes and gt20 minutes 1
Avg Travel Time or Distance to the Nearest Source of Non-Designated Accessible Care (choose largest)
Youth Ratio Ratio of Children under 18 to Adults 18-64
Score
gt25 3
lt25 and gt15 2
lt15 and gt10 1
Time Score
gt60 3
lt60 and gt40 2
lt40 and gt20 1
Score
Yes 1
No 0
Elderly Ratio Ratio of Adults over 65 to Adults 18-64
Substance Abuse prevalence Arearsquos rate is in worst quartile for nation region or state
Alcohol Abuse prevalence Arearsquos rate is in worst quartile for nation region or state
Score
Yes 1
No 0
Factor 3
Factor 4
Factor 5
Factor 6
Factor 7
Automatic HPSA
70
Legislation in 2002 created a new class of HPSAs not based on data but based on status as a certain type of facility
Statute
Federally Qualified Health Centers (FQHCs) that werenrsquot located in HPSAs still wanted access to NHSC Clinicians
Who is CoveredFederally Qualified Health Centers (FQHC)Community Health Centers
FQHC Look-A-Likes
Rural Health Clinics (RHCs) who submit the required application
Indian Health Service (IHS) and IHS ContractCompact Sites ndashTribal and Urban Indian Sites
IF THE SITE IS NOT ONE OF THESE IT DOES NOT QUALIFY FOR AUTO HPSA
Automatic HPSA
71
Scores
Important Note
No data no scoreDeveloped as a way to estimate using the national data Results were often no score or very low scoresOption to increase scores with alternative data available-posted on the websiteChanges in the loan repayment program with graduated payments and tiered funding has led to increased requests for score changes
We caution people that a high score is no guarantee given the small number of clinicians available so donrsquot waste too much energy
The HPSA applies to all sites that are a part of the FQHC or Look-A-Like
They have the same UDS but a different ALPHA code at the end now they have the BCHMIS
They are only listed under the ldquoMOTHER SITErdquo name and location which may be in a different county from a satellite site This information is listed on HPSAFIND website Recently HRSArsquos Office of Information Technology (OIT) created a tool that allows you to identify FQHCs and their Satellite sites See URL listed on ldquoResourcerdquo slide
Rural Health Clinics have to apply for each individual site
Automatic HPSA
72
Data Used to Compute Scores
Partial Scores
The current scoring methodology for primary care includes four factors
Population-to-Primary Care Physician RatioPercent of the Population with incomes below 100 of the Poverty LevelInfant Mortality Rate or Low Birth Weight (whichever score is higher) andTravel Time or Distance to the nearest available source of care (whichever score is higher)
There is a transformation scale that allows computation of partial scores for the four factors
The sum of these partial scores form the total HPSA score except that the partial score for Population-to-Primary Care Physician Ratio is double weighted because HPSA designations are primarily intended to measure the shortage of primary care providers within the HPSA For Dental HPSAs the poverty factor is also doubled
Automatic HPSA
73
Population to Primary Care Physician Ratio
For the FQHC grantees FQHC Look-a-Likes and RHCs these ratios were calculated for the following
Defined Primary Care Service Area (PCSA) which included the location of the facility
As an approximation to the service area of the facility and
Resident civilian population data from the census were used and primary care physician data were taken from the combined AMAAOA files used by the Office of Shortage Designation
For the IHS Service Units and the Alaska Native facilities Native American or Alaska Native population
Figures from the IHS or the Alaska Native Health System were used and
Physician data represent the non-federal providers in the area as reported by the IHS or the Alaska Native Health System
Automatic HPSA
74
Percent of the population with incomes below 100 of the poverty level
For FQHC granteesInitially 2002 Uniform Data System (UDS)-reported data on percent of users with incomes below 100 of poverty were used more recent UDS data used subsequently
For FQHC Look-a-likes and Rural Health Clinics (RHCs)The 2000 census poverty data for the county of location were used We now have UDS Data for FQHC Look-a-Likes
For the IHS and Alaska Native areas The census poverty data for Native American populations within those areas were used or data supplied by the IHS
Automatic HPSA
75
Travel Time or Distance to the Nearest Available Source of CareFor FQHC grantees FQHC Look-a-Likes and RHCs
Travel time and distance were calculated from the population-weighted center of the PCSA in which the entity was located to the population-weighted center of the nearest PCSA with a population-to-primary care physician ratio of at least 20001 using average road speeds and travel time for each road segment involved
For IHS and Alaska Natives Data reported by the IHS or the Alaska Native Health System were used
Infant Mortality Rate or Low Birth Weight (IMRLBW)For FQHC grantees FQHC Look-a-Likes and RHCs
IMRLBW rates for the PCSAs including the FQHC or RHC were used
For IHS and Alaska Native scoring Service unit data for the appropriate populations were used
Acronyms
76
Acronym and MeaningALOS Average Length of Stay CHMPC California Healthcare Workforce Policy
Commission
AMA American Medical Association CDPH California Department of Public Health
ASAPS Application Submission and Processing System CMHP Core Mental Health ProvidersProfessionals
BHCDANET
Bureau of Health Care Delivery and Assistance (NET)
CMS Center for MedicaidMedicare Services (formerly HCFA)
BHW Bureau of Health Workforce CPCA California Primary Care Association
BPHC Bureau of Primary Health Care CT Census Tract
BOP Bureau of Prisons DHHS Department of Health and Human Services
CA Cooperative Agreement DHCS Department of Health Care Services
CCD County Census Division DT Dental
CFR Code of Federal Register FQHC Federally Qualified Health Center
CHC Community Health Center FTE Full-Time Equivalent
Acronyms (cont)
77
Acronym and MeaningGIS Geographic Information System MSSA Medical Service Study Areas
HMO Health Maintenance Organization MUA Medically Underserved Areas
HPSA Health Professional Shortage Areas MUP Medically Underserved Populations
HRSA Health Resources and Services Administration NHSC National Health Service Corps
IHP Indian Health Program PC Primary Care
IHS Indian Health Services PCA Primary Care Association
IMR Infant Mortality Rate PCO Primary Care Office
IMU Index of Medical Underservice RHC Rural Health Clinic
MCD Minor Civil Division RSA Rational Service Area
MFW Migrant Farmworker SFS Sliding Fee Scale
MSFW Migrant Seasonal Farmworker SLRP State Loan Repayment Program
MH Mental Health TA Technical Assistance
Other Resources
78
SLRP httposhpdcagovHWDDSLRPhtml
OSHPD httpwwwoshpdcagov
NHSC httpnhschrsagov
Address Lookup httpgeooshpdcagovhpsa-search-by-address
CalHealth httpswwwfacebookcomCalHealthWorkforce
Twitter httpstwittercomHealthProfCAgov
J1-Visa Waiver Program httpwwwdhcscagovservicesruralPagesJ-1VisaWaiveraspx
HPSA Find httphpsafindhrsagov
HRSA Data Warehouse httpwwwhrsagovdata-statisticsindexhtml
Shortage Designation Program httpwwwoshpdcagovHWDDShortage_Designation_Proghtml
Geographic Information Systems (GIS) httpwwwoshpdcagovHWDDResearch_Policy_Planning_GIShtml
MSFW Enumeration Profiles Estimates httpwwwncfhorgenumerationPDF220Californiapdf
Health Professional Shortage Area (HPSA)
Join the HPSA Tour
Shortage Designation Program (SDP) Concludes
HOPE TO SEE YOU AGAIN

Prim
ary
Care
Sur
vey
Geographic Designation FTE
35
Physician Name SP Location of PracticeCT Census Track
Hrs of Direct Patient
CareWk
Hosp Hours
FTE
L McCoy DO GP 19 Main Street City CA 90001 531 48 Incld 10(4840=12=10)
D Scully MD 1 Ped 11 Park Place City CA 90001 540 30 Incld 08(3040=75=8)
B Spock MD 2 IM 6 Muldar Ave City CA 90002 538 15 Incld 04(1540=375=4)
M Welby MD3 OBG 3306 Russia Blvd City CA 90002
543 25 Not Incld
625(2540=625=6)
Y Zhivago DO 4
FP 99 Bones Drive City CA 90003 539 0 --- 00(040=0)
Total Physicians 5 Total FTE 2825 = 301 ndash Dr Scully spends 10 hours a week doing research2 ndash Dr Spock chooses to work only 15 hoursweek 3 ndash Dr Welby ndash chooses to work to work 25 hours4 ndash Dr Zhivago spends full-time in administration
Low-Income Designation FTE
36
Physician Name Hours of Direct Pt CareWk
Hosp
Hours
FTE
Medi -Cal
SFS
of Low-Income Total Low-Income
FTE
L McCoy DO 48 Incld 4840 =12=10
64 15 79(64+15=79)
079(79 x 10 = 79 )
D Scully MD 1 30 Incld 3040 = 075 35 8 43(35+8=43)
032(43 x 75 = 322)
B Spock MD 2 15 Incld 1540=0375 60 40 100(60+40=100)
375(1 x 375 = 375)
M Welby MD 3 25 Not Incld
2540=625 13 0 13 008(13 x 625=08)
Y Zhivago DO 4
0 Incld 00 0 0 0 000
Total Physicians 5 Total Low-Inc FTE 1565 = 16 1 ndash Dr Scully spends 10 hours a week doing research2 ndash Dr Spock chooses to work only 15 hours a week3 ndash Dr Welby chooses to work 25 hours a week4 ndash Dr Zhivago spends full-time in administration
40 hours = 10 FTE
Every 4 hours (12 day) = 01 FTE
40+ hours = 10 FTE
Interns amp residents = 01 FTE
Only the total FTE is rounded to the nearest tenth of a percent
FT
E
For each provider include the number of hours of direct patient care provided office and hospital inpatient in the service area
Rounding Examples
0875 = 09 0817 = 08083 = 08 085 = 09
The FTE for low-income
population designations is
based on the average
number of hours
Medicaid and Sliding
per week
spent
with
Fee Scale (SFS) patients
Prim
ary
Care
FTE Calculation
37
What are the Differencesunique to Dental Health
(DDS amp DMD)
Health Professional Shortage Area (HPSA)
Dental Health
38
A rational service area plus meets the requirements of the specific designation category (eg low-income homeless etc)
A rational service area plusMore than 20 of the population has incomes at or below 100 of the Federal poverty level or
A rational service area county or sub-county (MSSA)
More than 50 of the population has no fluoridated water or
Meets insufficient capacity criteria
Population to Provider Ratios
39
Geographic Area gt 50001
Geographic Area wHigh Needs gt 40001
Population Groups gt 40001
Contiguous Areas are overutilized if gt 30001
Dentist Name Age Location of Practice
of Aux
Hours of Direct Pt CareWk
FTE Based on Hours
Total FTE
M Incisor DDS 29 789 Crown StTooth Fairy CA 99864
1=1
45 10(4540= 11=1)
10(10 x 1=10)
R Wisdom DDS1 78 789 Crown StTooth Fairy CA 99864
1=7
15 375 (1540= 375)
026(375 x 7= 26)
A Canine DDS2 40 33 Halitosis RdSmile City CA 99918
3=14
37 925(3740= 925)
129(925 x 14=129)
B Crown DDS3 39 103 Molar LaneChompers CA 99918
2=12
25 625(2540=625)
075(625 x 12= 75)
C Buck DDS4 32 66 Cavity PlaceMouthtown CA 99918
2=12
25 625(2540= 625)
075(625 x 12 =75)
Den
tal H
ealth
Geographic Dental Survey
40
1 ndash Dr Wisdom works 25 hoursweek in another location 2 ndash Dr Canine spends 3 hoursweek in administrative activities 3 ndash Dr Crown chooses to work 25 hoursweek 4 ndash Dr Buck spends 15 hoursweek in childcare activities
Total FTEs 405 = 41
Low-Income Dental Survey
41
1 ndash Dr Wisdom works 25 hours a week in another location 2 ndash Dr Canine spends 3 hours a week in administrative activities 3 ndash Dr Crown chooses to work 25 hours a week 4 ndash Dr Buck spends 15 hours a week in childcare activities
Total FTEs 1756 = 18
Dentist Name Hours of Direct Pt CareWeek
FTE Based on Hours
Total FTE Medi-Cal
SFS of Low- Income
Total Low-Income FTE
M Incisor DDS 45(4540= 11=1)
10 10(1x1= 1)
10 2 12(10+02=12)
012(12 x 1 = 12)
R Wisdom DDS
15(1540=375)
375 0262(375x07= 262)
00 0 0 00(0 x 262 = 0)
A Canine DDS 37(3740= 925)
925 129(925x14=129)
50 10 60(50+10=60)
0774(6 x 129 = 774)
B Crown DDS 25(2540=625)
625 075(625x12= 75)
20 20 40(20+20=40)
03(4 x 75 = 3)
C Buck DDS 25(2540= 625)
625 075(625x12 =75)
60 15 75(60+15=75)
05625(75 x 75 = 5625)
Den
tal H
ealth
Auxiliaries lt 55 55 ndash 59 60 ndash 64 65+
0 08 07 06 05
1 10 09 08 07
2 12 10 10 08
3 14 12 10 10
gt4 15 15 13 12
If an auxiliary is less than full-time round to the nearest whole number (04 = 0 05 = 1)
If more than one auxiliary works less than full time add total hours divide by 40 and round if not a whole number ([16+20] + [3240]) = 17 = 2
If of auxiliaries is not available Use weight lt55 = 12 55-59 = 09 60-64 = 08 and gt 65= 06
If dentistrsquos age and the number of auxiliaries are not available Use weight of 12
Auxiliaries are non-dentists assisting in dental caresuch as dental assistants hygienists etc
Auxiliaries amp Age
42
To determine the maximum allowable FTE divide the Civilian Population by the Ratio
Miles Minutes
Interstate Roads
30 x 133 =
40
Primary Roads
25x 160 =
40
Secondary Roads
20x 200 =
40
Travel Time and Max FTE
Geographic DesignationCivilian Population = 70000
Population to Provider Ratio 50001 Maximum FTE (700005000) = 140
Geographic Designation (High Needs) Civilian Population = 80000
Population to Provider Ratio 40001 Maximum FTE (800004000) = 200
Contiguous AreaCivilian Population = 75000
Population to Provider Ratio 30001 Maximum FTE (750003000) = 250
Providers gt 40 minutes from the population center are
excessively distant
Travel Time Calculating the Maximum FTE
43
Unique to Mental Health(Psychiatrists amp CMHP)
Health Professional Shortage Area (HPSA)
What are the Differences
Mental Health
44
Determine the population to provider ratios for geographic
and population designations
A rational service area plus one of the following
A rational service area can combine 1 or more MSSAs or whole countygt 300001 psychiatrists orgt 90001 CMHP including psychiatrists orgt 60001 CMHP including psychiatrists and gt 20000 psychiatrists
20 or more population is lt 100 of the poverty level or
The youth ratio ( of persons lt 18 to the of adults ages 18 - 64) is greater than 06 or
The elderly ratio ( of persons gt 65 to the of adults ages 18 - 64) is greater than 025 or
Alcohol or substance abuse prevalence data showing the area to be in the worst quartile of the region
gt 200001 psychiatrists orgt 60001 CMHP including psychiatrists orgt 45001 CMHP including psychiatrists and gt 150001 psychiatrists
Population to Provider Ratios
45
Geographic Area gt 300001
Geographic Area wHigh Needs gt 200001
Men
tal H
ealth
Number of individuals in the service area that are at or below 200 of the Federal poverty level
Must be gt30 of the population in the service area
gt 200001 psychiatrists orgt 60001 CMHP including psychiatrists orgt 45001 CMHP including psychiatrists and gt 150001 psychiatrists
200001 psychiatrists
or gt 30001 CMHP including psychiatrists and gt 100001 psychiatrists
Population to Provider Ratios
46
Low-Income Population gt 200001
Contiguous Areas are Overutilized if
Mental Health Designations
47
PsychiatristsClinical PsychologistsClinical Social WorkersPsychiatric Nurse SpecialistsMarriage and Family Therapists
Psychiatrists Only or Core Mental Health Providers (CMHP) including
must include all of the disciplines for this type of designation
Mental health providers engaged solely in administration research or teaching
Mental health hospital staff physicians involved exclusively in inpatient or emergency room care
Mental health providers who are suspended under provisions of the Medicaid-Medicare Anti-Fraud and Abuse Act for a period of 18 months or more
Mental health providers with full-time staff positions in correctional institutions youth detention facilities residential treatment centers for children with emotional or developmental disabilities and inpatient units of State or County mental hospitals
Exclusions from Survey
Note
Travel Times amp Survey
48
Road Type Miles Minutes
Interstate Roads
30 x 133 = 40
Primary Roads
25x 16 = 40
Secondary Roads
20x 20 = 40
Travel Times
Mental health providers who serve in the NHSC Scholarship or Loan Repayment Programs (FTEs will include State Loan Repayment Program recipients)
Physicians who are graduates of foreign medical schoolwho are not citizens or lawful permanent residents(including those with J-1or H-1B visas)
Mental health providers who are Federal providers
Mental health providers who are planning on retiring after 6 months but are still seeing patients
All providers who meet these qualifications should be listed even if their FTE will be zero
Include in Survey but Exclude FTE
Provider Name Specialty Location of Practice
Hrs of DirectPt CareWk1
FTE Based on Hours
Total FTE
S Freud MD Psychiatry 5 Oedipal LaneCity CA 90001
20 05(2040=5)
05
C Jung MD1 Psychiatry 11 Dream DriveCity CA 90001
40 05(4040=10105=5)
05
H Lecter PhD ClinicalPsychology
6 Can Street City CA 90021
26 65(2640=65)
065
M Houlihan RN PsychiatricNursing
1400 Captain Ave City CA 90003
55 1375(5540=1375=10)
10
R Weisheimer MFT
Marriage FamCounseling
69 Shex StreetCity CA 90009
10 25(1040=25)
025
L Schlessinger MSW
Clinical Social Work
1 Radio RoadCity CA 90006
6 015(640=15)
015
Total Psychiatrists 2 Total Psychiatrist FTE = 10Total Core Mental Health Providers 6 Total Core Mental Health FTE 305= 31
1 - Dr Jung is in his last year of residency and is therefore counted as 05
Geographic Mental Health Survey
49
Provider Name Specialty Location of Practice
Hours of Direct
Patient CareWk
FTE Based on Hours
Medi-
Cal
SFS
of L-I
Total L-IFTE
S Freud MD Psychiatry 5 Oedipal LaneCity CA 90001
20 05 0 0 0 00
C Jung MD Psychiatry 11 Dream DriveCity CA 90001
40 05 30 15 45 225(5 x 45 = 225)
H LecterPhD ClinicalPsychology
6 Can Street City CA 90021
26 65 0 85 85 55(65 x 85 = 5525)
M Houlihan RN
PsychiatricNursing
1400 Captain Avenue City CA 90003
55 10 50 10 60 6 (10 x 6 = 6)
R WeisheimerMS
MarriageFamCounseling
69 Shex StreetCity CA 90009
10 25 25 5 30 0075(25 x 3 = 075)
L Schlessinger MSW
Clinical Social Work
1 Radio RoadCity CA 90006
6 015 0 10 10 015(15 x 1 = 015)
Low-Income Mental Health Survey
50
Total Psychiatrists 2 Total L-I Psychiatrist FTE 0225 = 2
Total Core Mental Health Providers 6 Total L-I Core Mental Health FTE 1465 =15
Alcohol and Drug Use
51
Indicator State Rank of Counties Result Qualifies1 34 44 34 44 = 77 77 gt 75 = Yes2 30 49 30 49 = 61 61 lt 75 = No3 25 58 25 58 = 43 43 lt 75 = No4 57 58 57 58 = 98 98 gt 75 = Yes5 48 58 48 58 = 83 83 gt 75 = Yes6 15 50 1558 = 2 2 lt 75 = No7 45 58 4558 = 78 78 gt 75 = YesDoes the county have 4 out of 7 indicators Yes
The table for Key Indicators of Community Alcohol and Drug Use can be used to determine if the MSSA is located in a county that is in the lowest quartile in the state There are 7 key indicators The county must have 4 out of 7 indicators to qualify for a Geographic HPSA with high needs The web site is located at httpwwwadpcagovPreventionrisk_indicators_2010shtml
Formula State Rank of Counties = State Rank If the State Rank is gt 75 = Qualifies
The ldquo of Countiesrdquo participating in gathering the data is located directly underneath the Indicator Number third line down
Located to the right of each indicator under the last (or only) year the data was compiled is the ldquoState Rankrdquo for that indicator (third number down) (Note Do not use the Three Year Average)
Key Indicators of Community Alcohol
and Drug Use
This is unique to Mental HPSAs
Los Angeles County
The information required for a complete submission
How each factor is weighted and scored to determine a final Index of Medical Underservice (IMU) Score
The difference between MUAs amp MUPs
Measures the degree of underservice of an area (MUA) or a population (MUP)
Determine the Rational Service Area (RSA) (use MSSA)
Determine the Criteria amp Weighted Values of
Percent of Population at 100 Poverty
Percent of Population gt 65
Participants will understand
Infant Mortality Rate (IMR)
Primary Care Physicians per 1000 Population
Compute the Index of Medical Underservice ScoreValue must be lt 620
MUA = Medically Underserved Area
MUP Only ndash Primary Care Physicians serving the low-income population at 200 poverty level per 1000 low-income population
MUA amp MUP Designations
Objective MUA amp MUP Criteria
MUP = Medically Underserved Pop
52
Percent Population at 100 Poverty
53
Percent Below Poverty
WeightedValue
Percent Below Poverty
WeightedValue
Percent Below Poverty
WeightedValue
0 251 181-200 149 381-400 21
01-20 246 201-220 136 401-420 13
21-40 237 221-240 122 421-440 10
41-60 228 241-260 109 441-460 07
61-80 219 261-280 93 461-480 04
81-100 210 281-300 78 481-500 01
101-120 200 301-320 66 50 + 0
121-140 187 321-340 56 381-400 21
141-160 174 341-360 47 401-420 13
161-180 162 361-380 34 421-440 10
Determine the of the population in the area at the 100 poverty level
Calculate100 Poverty
Determine the weighed value
Note The weighted value is
the same for MUAs amp MUPs
See table
Use latest available data (2012 ACS Population Estimates)
Number at 100 Federal Poverty Level
Civilian Population
Divided By
Percentage of Population gt 65
54
of Pop gt 65
WeightedValue
of Pop gt 65
WeightedValue
of Pop gt 65
WeightedValue
0 ndash70 202 161-170 161 261-270 40
71-80 201 171-180 144 271-280 28
81-90 199 181-190 128 281-290 17
91-100 198 191-200 111 291-300 06
101-110 196 211-210 98 30 + 0
111-120 194 221-220 89 261-270 40
121-130 191 221-230 80 271-280 28
131-140 189 231-240 70 281-290 17
141-150 187 241-250 61 291-300 06
151-160 178 251-260 51 30 + 0
Determine the percentage of the in the area gt 65 years old
Determine the weighed value
Calculate percent for gt65 years old
Use the latest available data (2012 ACS Population Estimates)
See table
Note The weighted value is the same for MUAs amp MUPs
Number gt 65 yrs old
Civilian Population
Divided By
Infant Mortality Rate (IMR)
55
Infant Mortality
Rate
WeightedValue
Infant Mortality
Rate
WeightedValue
Infant Mortality
Rate
WeightedValue
Infant Mortality
Rate
WeightedValue
0-8 260 171-180 175 271-280 61 371-390 20
81-90 256 181-190 164 281-290 54 391-410 14
91-100 248 191-200 153 291-300 50 411-430 08
101-110 240 201-210 142 301-310 47 431-450 02
111-120 232 211-220 131 311-320 43 451+ 0
121-130 224 221-230 119 321-330 40
131-140 215 231-240 108 331-340 36
141-150 205 241-250 96 341-350 33
151-160 195 251-260 85 351-360 30
161-170 185 261-270 73 361-370 26
Use the OSD available data(5-year avg) or
OSD-approved State Department of Health data
Use the IMR for the county
Determine the weighed value
Calculation for gt65 years old
Note The weighted value is the same for MUAs amp MUPs
See table
Department of Public Healthrsquos Center for Health Statistics website httpwwwcdphcagovcertlicbirthdeathmarPagesdefaultaspx
of Infant Death
of Live Births
X 1000
Divided By
Providers per 1000 Population
Total FTECivilian Population x 1000
MUA
MUP Total FTEPop to be designated x 1000
All physicians must be counted (including J-1 Visa physicians NHSC physicians etc)
For MUA designations the HPSA adjustment factor for the FTE is not used
MUA ndash All primary care physicians are counted
MUA = civilian population
MUP ndash All primary care physicians servicing the population group are counted
MUP = number in that population group (eg low-income pop = pop at or below the 200 poverty)
Must collect inpatient and outpatient hours of the outpatient Doctors
(not hospitalists)
Determine the FTE
Determine the Population
Calculation
Determine the Weighted Value(see table)
56
Geographic Designation - FTEs
57
Provider Name Specialty Location of PracticeHours of Direct
Pt CareWk FTE Based on Hours
A Liver MD1 General Practice
86 N Onion StreetCity State Zip
48(4840=12=10)
10
B Spleen MD2 Pediatrics 103 Sanfgroid DrCity State Zip
30(3040=75)
075
C Heart MD Internal Medicine
777 Stopper AveCity State Zip
40 10
D Kidney DO OB-GYN 3306 Stone DriveCity State Zip
40 10
E Lung DO3 Family Practice 99 Airborne BlvdCity State Zip
25(2540=625)
0625
Total Physicians = 5 Total FTE = 4375 = 44
1 Dr Liver is an NHSC loan repayment recipient counted as 10 FTE
2 Dr Spleen spends 10 hoursweek doing research
3 Dr Lung spends 15 hours week in administration
Provider Name Specialty Location of Practice Hours of Direct
Pt CareWk
FTE Based on Hours
Medi-Cal
Sliding
Fee
of Low
Income
Total Low Income
FTE
A Liver MD GP 86 N Onion StCity State Zip
48 10 64 15 79 079
B Spleen MD PED 103 Sanfgroid DrCity State Zip
30 075 35 8 43 03225
C Heart MD IM 777 Stopper AveCity State Zip
40 10 60 40 100 10
D Kidney DO OB GYN 3306 Stone DriveCity State Zip
40 10 13 0 13 013
E Lung DO FP 99 Airborne BlvdCity State Zip
25 0625 7 0 7 004375
Total Physicians 5 Total Low-Income FTE 228625 = 23
Low-Income Population Designation - FTEs
58
Providers per 1000 Population
59
Prov per 1000 pop
WeightedValue
Prov per 1000 pop
WeightedValue
Prov per 1000 pop
WeightedValue
0-05 0 401-450 107 801-850 243
051-100 05 451-500 126 851-900 253
101-150 15 501-550 148 901-950 259
151-200 28 551-600 169 951-1000 266
201-250 41 601-650 191 1001-1050 272
251-300 57 651-700 207 1051-1100 277
301-350 73 701-750 219 1101-1150 280
351-400 90 751-800 231 1151-1200 283
1201-1250 286
Over 1250 287
find the range which includes
the ratio of primary care
physicians per 1000 population
for the area being examined
See table
Note The weighted value is the same for MUAs amp MUPs
Left Column
Index of Medical Underserved Score
60
Qualifies for designation as an MUAMUP
The IMU Score is determined by adding the values of each of the four factors
Percent of Population at 100 Poverty
Infant Mortality Rate (IMU)
Primary Care Physicians per 1000 Population
+Percent of Population gt 65
+
+
Does not qualify for designation as an MUAMUP
Before surveying providers check the IMU score of the first 3 variables
If V1 + V2 + V3 are gt 620 the area will not designate as an MUA or MUP
If the IMU gt 62 then review rational service area to determine if other boundaries would be appropriate
If not an MUA check if area would designate as an MUP
The IMU Score IMU lt 620
IMU gt 620
Time Saving Tips
MUAMUP Designation Worksheet
61
MUAMUP Designation Map
62
The orange area is a designated MUA and part of the designation is in MSSA 66a and part is in MSSA 63 Because of this the whole designation can be thrown out
MU
AM
UP
Map
HPSA Scores
63
HPSA scores are critical for US HRSA administered programs such as
National Health Service Corps (NHSC) Scholar Placements and Loan Repayment
J1-Visa Waiver Ready Responders
These programs rely on HPSA scores to prioritize resource allocation and level of assistance
DisciplinesPrimary Medical Care HPSA (4 factors = 25 points)
Dental Care HPSA (4 factors = 26 points)
Mental Health HPSA ( 7 factors = 26 points)
Note There is nothing in writing from the Feds on Mental Health
Primary Care HPSA Scores
64
Factor 1 ndash Population to Provider Ratio Score(x2)
gt100001 and the de-designation threshold is gt0
or there is no physicians and a population gt2500
5
lt100001 but gt50001 and the de-designation threshold is gt0
or there is no physicians and a population gt2000
4
lt50001 but gt40001 and the de-designation threshold is gt0
or there is no physicians and a population gt1500
3
lt40001 but gt35001 and the de-designation threshold is gt0
or there is no physicians and a population gt1000
2
lt35001 but gt30001 and the de-designation threshold is gt0
or there is no physicians and a population gt500
1
Factor 2 ndash 100 Poverty Rate
Score
gt50 5
lt50 but gt40 4
lt40 but gt30 3
lt30 but gt20 2
lt20 but gt15 1
For Primary Care there are 4 Factors for a total of 25 Points
100 Poverty RatePopulation to Provider Ratio
Factor 1Factor 2
Primary Care HPSA Scores (cont)
65
Infant Mortality
Rate
Low Birth Weight Rate
Score
gt200 or gt13 5
lt20 but gt18 or lt13 but gt11 4
lt18 but gt15 or lt11 but gt10 3
lt15 but gt12 or lt10 but gt9 2
lt12 but gt10 or lt9 but gt7 1
Time Distance Score
gt60 minutes gt50 miles 5
lt60 but gt50 minutes lt50 but gt40 miles 4
lt50 but gt40 minutes lt40 but gt30 miles 3
lt40 but gt30 minutes lt30 but gt20 miles 2
lt30 but gt20 minutes lt20 but gt10 miles 1
Average Travel Time or Distance to Nearest Source of Non-Designated Accessible Care (choose largest)
Infant Health Index (choose largest)
Factor 3Factor 4
Dental Health HPSA Scores
66
Factor 1 ndash Population to Provider Ratio Score(x2)
gt100001 and a de-designation threshold of gt0
or there is no dentists and a population gt3000
5
lt100001 but gt80001 and a de-designation threshold of gt0
or there is no dentists and a population gt2500
4
lt80001 but gt60001 and a de-designation threshold of gt0
or there is no dentists and a population gt2000
3
lt60001 but gt50001 and a de-designation threshold of gt0
or there is no dentists and a population gt1500
2
lt50001 but gt40001 and a de-designation threshold of gt0
or there is no dentists and a population gt1000
1
Factor 2 ndash 100 Poverty Rate
Score(x2)
gt50 5
lt50 but gt 40 4
lt40 but gt30 3
lt30 but gt20 2
lt20 but gt15 1
For Dental Health there are 4 Factors for a total of 26 Points
100 Poverty Rate
Population to Dentist Ratio
Factor 1Factor 2
Dental Health HPSA Scores (cont)
67
Water Not Fluoridated = Score of 1 point
Time Distance Score
gt90 minutes gt60 miles 5
lt90 but gt75 minutes lt60 but gt50 miles 4
lt75 but gt60 minutes lt50 but gt40 miles 3
lt60 but gt45 minutes lt40 but gt30 miles 2
lt45 but gt30 minutes lt30 but gt20 miles 1
Average Travel Time or Distance to Nearest Source of Non-Designated Accessible Care (choose largest)
Fluoridated Water
Factor 3 Factor 4
Mental Health HPSA Scores
68
Factor 1 ndash Population to Mental Provider Ratio Score
Psychiatrists Ratio Core Mental Health Ratiogt 450000 AND gt 45000 8
gt 45001 and lt 60001 7
lt 200001 and gt 150001 AND gt 60001 and lt 90001 6
lt 300001 and gt 150001 OR gt 45001 and LT 60001 5
lt 450001 and gt 200001 AND gt 45000 and LT 60000 4
gt 200001 AND gt 60001 3
gt 300001 2
gt 90001 1
Factor 2 ndash 100 Poverty Rate
Score
P() GE 50 5
50 gt P() GE 40 4
40 gt P() GE 30 3
30 gt P() GE 20 2
20 gt P() GE 15 1
P() lt 15 0
For Mental Health there are 7 Factors for a total of 26 Points
100 Poverty Rate
Population to Mental Provider Ratio
Factor 1
Factor 2
Mental Health HPSA Scores (cont)
69
Time Score
Time GE 60 minutes 5lt 60 min and gt50 minutes 4lt50 minutes and gt 40 minutes 3lt40 minutes and gt30 minutes 2lt30 minutes and gt20 minutes 1
Avg Travel Time or Distance to the Nearest Source of Non-Designated Accessible Care (choose largest)
Youth Ratio Ratio of Children under 18 to Adults 18-64
Score
gt25 3
lt25 and gt15 2
lt15 and gt10 1
Time Score
gt60 3
lt60 and gt40 2
lt40 and gt20 1
Score
Yes 1
No 0
Elderly Ratio Ratio of Adults over 65 to Adults 18-64
Substance Abuse prevalence Arearsquos rate is in worst quartile for nation region or state
Alcohol Abuse prevalence Arearsquos rate is in worst quartile for nation region or state
Score
Yes 1
No 0
Factor 3
Factor 4
Factor 5
Factor 6
Factor 7
Automatic HPSA
70
Legislation in 2002 created a new class of HPSAs not based on data but based on status as a certain type of facility
Statute
Federally Qualified Health Centers (FQHCs) that werenrsquot located in HPSAs still wanted access to NHSC Clinicians
Who is CoveredFederally Qualified Health Centers (FQHC)Community Health Centers
FQHC Look-A-Likes
Rural Health Clinics (RHCs) who submit the required application
Indian Health Service (IHS) and IHS ContractCompact Sites ndashTribal and Urban Indian Sites
IF THE SITE IS NOT ONE OF THESE IT DOES NOT QUALIFY FOR AUTO HPSA
Automatic HPSA
71
Scores
Important Note
No data no scoreDeveloped as a way to estimate using the national data Results were often no score or very low scoresOption to increase scores with alternative data available-posted on the websiteChanges in the loan repayment program with graduated payments and tiered funding has led to increased requests for score changes
We caution people that a high score is no guarantee given the small number of clinicians available so donrsquot waste too much energy
The HPSA applies to all sites that are a part of the FQHC or Look-A-Like
They have the same UDS but a different ALPHA code at the end now they have the BCHMIS
They are only listed under the ldquoMOTHER SITErdquo name and location which may be in a different county from a satellite site This information is listed on HPSAFIND website Recently HRSArsquos Office of Information Technology (OIT) created a tool that allows you to identify FQHCs and their Satellite sites See URL listed on ldquoResourcerdquo slide
Rural Health Clinics have to apply for each individual site
Automatic HPSA
72
Data Used to Compute Scores
Partial Scores
The current scoring methodology for primary care includes four factors
Population-to-Primary Care Physician RatioPercent of the Population with incomes below 100 of the Poverty LevelInfant Mortality Rate or Low Birth Weight (whichever score is higher) andTravel Time or Distance to the nearest available source of care (whichever score is higher)
There is a transformation scale that allows computation of partial scores for the four factors
The sum of these partial scores form the total HPSA score except that the partial score for Population-to-Primary Care Physician Ratio is double weighted because HPSA designations are primarily intended to measure the shortage of primary care providers within the HPSA For Dental HPSAs the poverty factor is also doubled
Automatic HPSA
73
Population to Primary Care Physician Ratio
For the FQHC grantees FQHC Look-a-Likes and RHCs these ratios were calculated for the following
Defined Primary Care Service Area (PCSA) which included the location of the facility
As an approximation to the service area of the facility and
Resident civilian population data from the census were used and primary care physician data were taken from the combined AMAAOA files used by the Office of Shortage Designation
For the IHS Service Units and the Alaska Native facilities Native American or Alaska Native population
Figures from the IHS or the Alaska Native Health System were used and
Physician data represent the non-federal providers in the area as reported by the IHS or the Alaska Native Health System
Automatic HPSA
74
Percent of the population with incomes below 100 of the poverty level
For FQHC granteesInitially 2002 Uniform Data System (UDS)-reported data on percent of users with incomes below 100 of poverty were used more recent UDS data used subsequently
For FQHC Look-a-likes and Rural Health Clinics (RHCs)The 2000 census poverty data for the county of location were used We now have UDS Data for FQHC Look-a-Likes
For the IHS and Alaska Native areas The census poverty data for Native American populations within those areas were used or data supplied by the IHS
Automatic HPSA
75
Travel Time or Distance to the Nearest Available Source of CareFor FQHC grantees FQHC Look-a-Likes and RHCs
Travel time and distance were calculated from the population-weighted center of the PCSA in which the entity was located to the population-weighted center of the nearest PCSA with a population-to-primary care physician ratio of at least 20001 using average road speeds and travel time for each road segment involved
For IHS and Alaska Natives Data reported by the IHS or the Alaska Native Health System were used
Infant Mortality Rate or Low Birth Weight (IMRLBW)For FQHC grantees FQHC Look-a-Likes and RHCs
IMRLBW rates for the PCSAs including the FQHC or RHC were used
For IHS and Alaska Native scoring Service unit data for the appropriate populations were used
Acronyms
76
Acronym and MeaningALOS Average Length of Stay CHMPC California Healthcare Workforce Policy
Commission
AMA American Medical Association CDPH California Department of Public Health
ASAPS Application Submission and Processing System CMHP Core Mental Health ProvidersProfessionals
BHCDANET
Bureau of Health Care Delivery and Assistance (NET)
CMS Center for MedicaidMedicare Services (formerly HCFA)
BHW Bureau of Health Workforce CPCA California Primary Care Association
BPHC Bureau of Primary Health Care CT Census Tract
BOP Bureau of Prisons DHHS Department of Health and Human Services
CA Cooperative Agreement DHCS Department of Health Care Services
CCD County Census Division DT Dental
CFR Code of Federal Register FQHC Federally Qualified Health Center
CHC Community Health Center FTE Full-Time Equivalent
Acronyms (cont)
77
Acronym and MeaningGIS Geographic Information System MSSA Medical Service Study Areas
HMO Health Maintenance Organization MUA Medically Underserved Areas
HPSA Health Professional Shortage Areas MUP Medically Underserved Populations
HRSA Health Resources and Services Administration NHSC National Health Service Corps
IHP Indian Health Program PC Primary Care
IHS Indian Health Services PCA Primary Care Association
IMR Infant Mortality Rate PCO Primary Care Office
IMU Index of Medical Underservice RHC Rural Health Clinic
MCD Minor Civil Division RSA Rational Service Area
MFW Migrant Farmworker SFS Sliding Fee Scale
MSFW Migrant Seasonal Farmworker SLRP State Loan Repayment Program
MH Mental Health TA Technical Assistance
Other Resources
78
SLRP httposhpdcagovHWDDSLRPhtml
OSHPD httpwwwoshpdcagov
NHSC httpnhschrsagov
Address Lookup httpgeooshpdcagovhpsa-search-by-address
CalHealth httpswwwfacebookcomCalHealthWorkforce
Twitter httpstwittercomHealthProfCAgov
J1-Visa Waiver Program httpwwwdhcscagovservicesruralPagesJ-1VisaWaiveraspx
HPSA Find httphpsafindhrsagov
HRSA Data Warehouse httpwwwhrsagovdata-statisticsindexhtml
Shortage Designation Program httpwwwoshpdcagovHWDDShortage_Designation_Proghtml
Geographic Information Systems (GIS) httpwwwoshpdcagovHWDDResearch_Policy_Planning_GIShtml
MSFW Enumeration Profiles Estimates httpwwwncfhorgenumerationPDF220Californiapdf
Health Professional Shortage Area (HPSA)
Join the HPSA Tour
Shortage Designation Program (SDP) Concludes
HOPE TO SEE YOU AGAIN
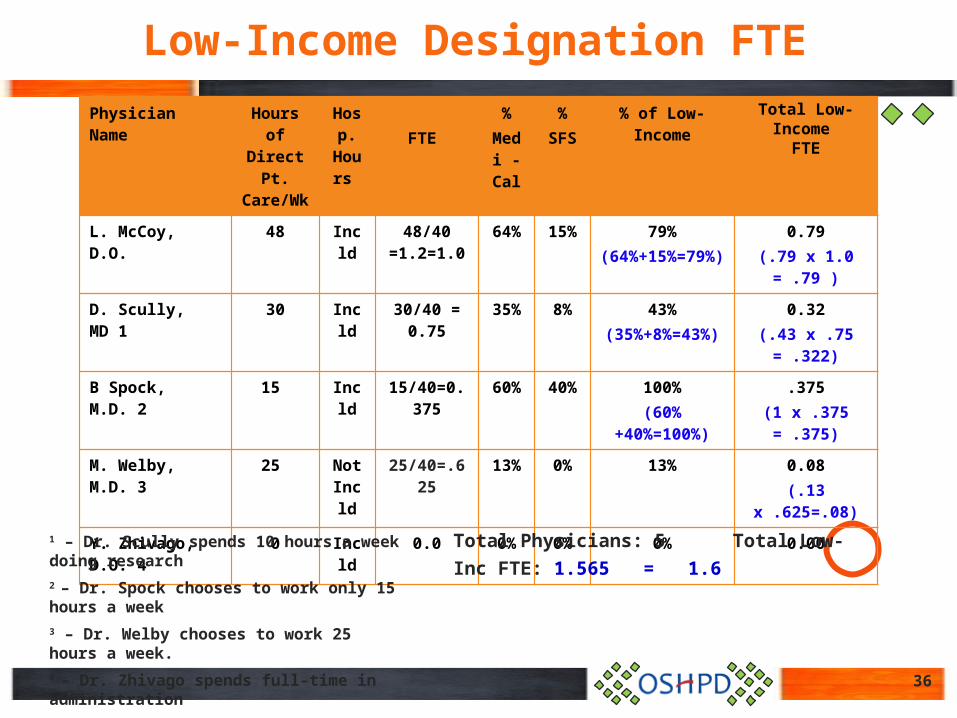
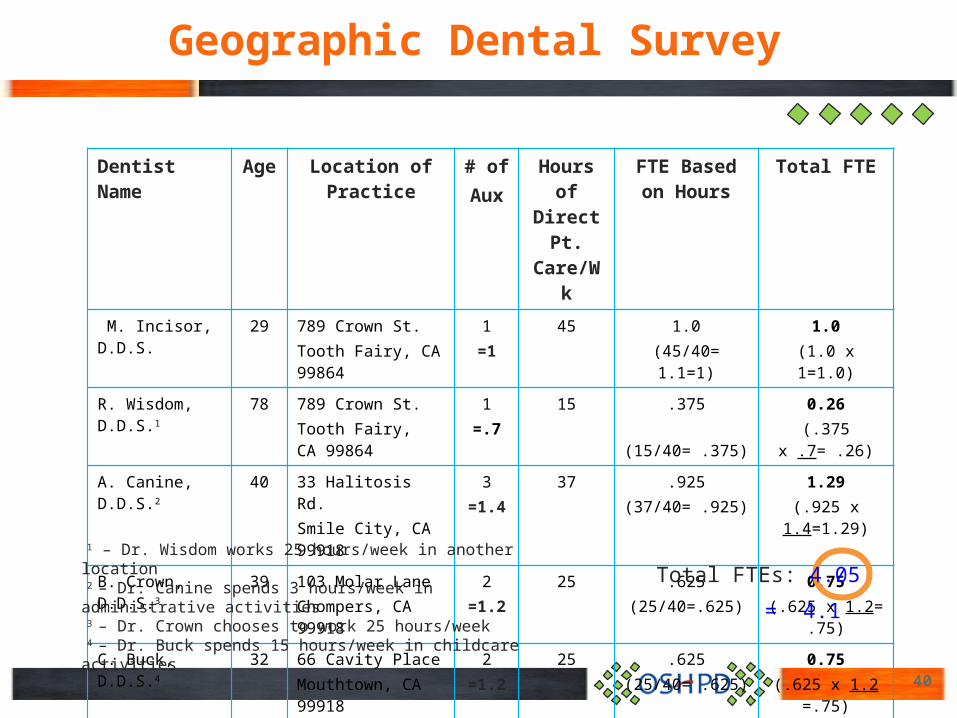
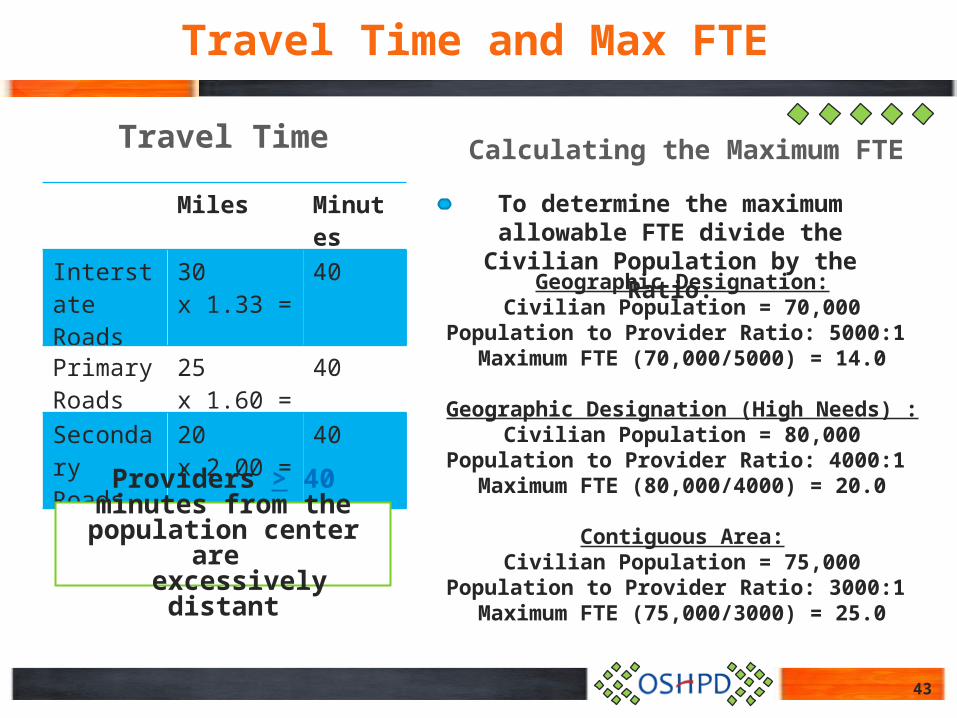

Provider Name Specialty Location of Practice
Hours of Direct
Patient CareWk
FTE Based on Hours
Medi-
Cal
SFS
of L-I
Total L-IFTE
S Freud MD Psychiatry 5 Oedipal LaneCity CA 90001
20 05 0 0 0 00
C Jung MD Psychiatry 11 Dream DriveCity CA 90001
40 05 30 15 45 225(5 x 45 = 225)
H LecterPhD ClinicalPsychology
6 Can Street City CA 90021
26 65 0 85 85 55(65 x 85 = 5525)
M Houlihan RN
PsychiatricNursing
1400 Captain Avenue City CA 90003
55 10 50 10 60 6 (10 x 6 = 6)
R WeisheimerMS
MarriageFamCounseling
69 Shex StreetCity CA 90009
10 25 25 5 30 0075(25 x 3 = 075)
L Schlessinger MSW
Clinical Social Work
1 Radio RoadCity CA 90006
6 015 0 10 10 015(15 x 1 = 015)
Low-Income Mental Health Survey
50
Total Psychiatrists 2 Total L-I Psychiatrist FTE 0225 = 2
Total Core Mental Health Providers 6 Total L-I Core Mental Health FTE 1465 =15
Alcohol and Drug Use
51
Indicator State Rank of Counties Result Qualifies1 34 44 34 44 = 77 77 gt 75 = Yes2 30 49 30 49 = 61 61 lt 75 = No3 25 58 25 58 = 43 43 lt 75 = No4 57 58 57 58 = 98 98 gt 75 = Yes5 48 58 48 58 = 83 83 gt 75 = Yes6 15 50 1558 = 2 2 lt 75 = No7 45 58 4558 = 78 78 gt 75 = YesDoes the county have 4 out of 7 indicators Yes
The table for Key Indicators of Community Alcohol and Drug Use can be used to determine if the MSSA is located in a county that is in the lowest quartile in the state There are 7 key indicators The county must have 4 out of 7 indicators to qualify for a Geographic HPSA with high needs The web site is located at httpwwwadpcagovPreventionrisk_indicators_2010shtml
Formula State Rank of Counties = State Rank If the State Rank is gt 75 = Qualifies
The ldquo of Countiesrdquo participating in gathering the data is located directly underneath the Indicator Number third line down
Located to the right of each indicator under the last (or only) year the data was compiled is the ldquoState Rankrdquo for that indicator (third number down) (Note Do not use the Three Year Average)
Key Indicators of Community Alcohol
and Drug Use
This is unique to Mental HPSAs
Los Angeles County
The information required for a complete submission
How each factor is weighted and scored to determine a final Index of Medical Underservice (IMU) Score
The difference between MUAs amp MUPs
Measures the degree of underservice of an area (MUA) or a population (MUP)
Determine the Rational Service Area (RSA) (use MSSA)
Determine the Criteria amp Weighted Values of
Percent of Population at 100 Poverty
Percent of Population gt 65
Participants will understand
Infant Mortality Rate (IMR)
Primary Care Physicians per 1000 Population
Compute the Index of Medical Underservice ScoreValue must be lt 620
MUA = Medically Underserved Area
MUP Only ndash Primary Care Physicians serving the low-income population at 200 poverty level per 1000 low-income population
MUA amp MUP Designations
Objective MUA amp MUP Criteria
MUP = Medically Underserved Pop
52
Percent Population at 100 Poverty
53
Percent Below Poverty
WeightedValue
Percent Below Poverty
WeightedValue
Percent Below Poverty
WeightedValue
0 251 181-200 149 381-400 21
01-20 246 201-220 136 401-420 13
21-40 237 221-240 122 421-440 10
41-60 228 241-260 109 441-460 07
61-80 219 261-280 93 461-480 04
81-100 210 281-300 78 481-500 01
101-120 200 301-320 66 50 + 0
121-140 187 321-340 56 381-400 21
141-160 174 341-360 47 401-420 13
161-180 162 361-380 34 421-440 10
Determine the of the population in the area at the 100 poverty level
Calculate100 Poverty
Determine the weighed value
Note The weighted value is
the same for MUAs amp MUPs
See table
Use latest available data (2012 ACS Population Estimates)
Number at 100 Federal Poverty Level
Civilian Population
Divided By
Percentage of Population gt 65
54
of Pop gt 65
WeightedValue
of Pop gt 65
WeightedValue
of Pop gt 65
WeightedValue
0 ndash70 202 161-170 161 261-270 40
71-80 201 171-180 144 271-280 28
81-90 199 181-190 128 281-290 17
91-100 198 191-200 111 291-300 06
101-110 196 211-210 98 30 + 0
111-120 194 221-220 89 261-270 40
121-130 191 221-230 80 271-280 28
131-140 189 231-240 70 281-290 17
141-150 187 241-250 61 291-300 06
151-160 178 251-260 51 30 + 0
Determine the percentage of the in the area gt 65 years old
Determine the weighed value
Calculate percent for gt65 years old
Use the latest available data (2012 ACS Population Estimates)
See table
Note The weighted value is the same for MUAs amp MUPs
Number gt 65 yrs old
Civilian Population
Divided By
Infant Mortality Rate (IMR)
55
Infant Mortality
Rate
WeightedValue
Infant Mortality
Rate
WeightedValue
Infant Mortality
Rate
WeightedValue
Infant Mortality
Rate
WeightedValue
0-8 260 171-180 175 271-280 61 371-390 20
81-90 256 181-190 164 281-290 54 391-410 14
91-100 248 191-200 153 291-300 50 411-430 08
101-110 240 201-210 142 301-310 47 431-450 02
111-120 232 211-220 131 311-320 43 451+ 0
121-130 224 221-230 119 321-330 40
131-140 215 231-240 108 331-340 36
141-150 205 241-250 96 341-350 33
151-160 195 251-260 85 351-360 30
161-170 185 261-270 73 361-370 26
Use the OSD available data(5-year avg) or
OSD-approved State Department of Health data
Use the IMR for the county
Determine the weighed value
Calculation for gt65 years old
Note The weighted value is the same for MUAs amp MUPs
See table
Department of Public Healthrsquos Center for Health Statistics website httpwwwcdphcagovcertlicbirthdeathmarPagesdefaultaspx
of Infant Death
of Live Births
X 1000
Divided By
Providers per 1000 Population
Total FTECivilian Population x 1000
MUA
MUP Total FTEPop to be designated x 1000
All physicians must be counted (including J-1 Visa physicians NHSC physicians etc)
For MUA designations the HPSA adjustment factor for the FTE is not used
MUA ndash All primary care physicians are counted
MUA = civilian population
MUP ndash All primary care physicians servicing the population group are counted
MUP = number in that population group (eg low-income pop = pop at or below the 200 poverty)
Must collect inpatient and outpatient hours of the outpatient Doctors
(not hospitalists)
Determine the FTE
Determine the Population
Calculation
Determine the Weighted Value(see table)
56
Geographic Designation - FTEs
57
Provider Name Specialty Location of PracticeHours of Direct
Pt CareWk FTE Based on Hours
A Liver MD1 General Practice
86 N Onion StreetCity State Zip
48(4840=12=10)
10
B Spleen MD2 Pediatrics 103 Sanfgroid DrCity State Zip
30(3040=75)
075
C Heart MD Internal Medicine
777 Stopper AveCity State Zip
40 10
D Kidney DO OB-GYN 3306 Stone DriveCity State Zip
40 10
E Lung DO3 Family Practice 99 Airborne BlvdCity State Zip
25(2540=625)
0625
Total Physicians = 5 Total FTE = 4375 = 44
1 Dr Liver is an NHSC loan repayment recipient counted as 10 FTE
2 Dr Spleen spends 10 hoursweek doing research
3 Dr Lung spends 15 hours week in administration
Provider Name Specialty Location of Practice Hours of Direct
Pt CareWk
FTE Based on Hours
Medi-Cal
Sliding
Fee
of Low
Income
Total Low Income
FTE
A Liver MD GP 86 N Onion StCity State Zip
48 10 64 15 79 079
B Spleen MD PED 103 Sanfgroid DrCity State Zip
30 075 35 8 43 03225
C Heart MD IM 777 Stopper AveCity State Zip
40 10 60 40 100 10
D Kidney DO OB GYN 3306 Stone DriveCity State Zip
40 10 13 0 13 013
E Lung DO FP 99 Airborne BlvdCity State Zip
25 0625 7 0 7 004375
Total Physicians 5 Total Low-Income FTE 228625 = 23
Low-Income Population Designation - FTEs
58
Providers per 1000 Population
59
Prov per 1000 pop
WeightedValue
Prov per 1000 pop
WeightedValue
Prov per 1000 pop
WeightedValue
0-05 0 401-450 107 801-850 243
051-100 05 451-500 126 851-900 253
101-150 15 501-550 148 901-950 259
151-200 28 551-600 169 951-1000 266
201-250 41 601-650 191 1001-1050 272
251-300 57 651-700 207 1051-1100 277
301-350 73 701-750 219 1101-1150 280
351-400 90 751-800 231 1151-1200 283
1201-1250 286
Over 1250 287
find the range which includes
the ratio of primary care
physicians per 1000 population
for the area being examined
See table
Note The weighted value is the same for MUAs amp MUPs
Left Column
Index of Medical Underserved Score
60
Qualifies for designation as an MUAMUP
The IMU Score is determined by adding the values of each of the four factors
Percent of Population at 100 Poverty
Infant Mortality Rate (IMU)
Primary Care Physicians per 1000 Population
+Percent of Population gt 65
+
+
Does not qualify for designation as an MUAMUP
Before surveying providers check the IMU score of the first 3 variables
If V1 + V2 + V3 are gt 620 the area will not designate as an MUA or MUP
If the IMU gt 62 then review rational service area to determine if other boundaries would be appropriate
If not an MUA check if area would designate as an MUP
The IMU Score IMU lt 620
IMU gt 620
Time Saving Tips
MUAMUP Designation Worksheet
61
MUAMUP Designation Map
62
The orange area is a designated MUA and part of the designation is in MSSA 66a and part is in MSSA 63 Because of this the whole designation can be thrown out
MU
AM
UP
Map
HPSA Scores
63
HPSA scores are critical for US HRSA administered programs such as
National Health Service Corps (NHSC) Scholar Placements and Loan Repayment
J1-Visa Waiver Ready Responders
These programs rely on HPSA scores to prioritize resource allocation and level of assistance
DisciplinesPrimary Medical Care HPSA (4 factors = 25 points)
Dental Care HPSA (4 factors = 26 points)
Mental Health HPSA ( 7 factors = 26 points)
Note There is nothing in writing from the Feds on Mental Health
Primary Care HPSA Scores
64
Factor 1 ndash Population to Provider Ratio Score(x2)
gt100001 and the de-designation threshold is gt0
or there is no physicians and a population gt2500
5
lt100001 but gt50001 and the de-designation threshold is gt0
or there is no physicians and a population gt2000
4
lt50001 but gt40001 and the de-designation threshold is gt0
or there is no physicians and a population gt1500
3
lt40001 but gt35001 and the de-designation threshold is gt0
or there is no physicians and a population gt1000
2
lt35001 but gt30001 and the de-designation threshold is gt0
or there is no physicians and a population gt500
1
Factor 2 ndash 100 Poverty Rate
Score
gt50 5
lt50 but gt40 4
lt40 but gt30 3
lt30 but gt20 2
lt20 but gt15 1
For Primary Care there are 4 Factors for a total of 25 Points
100 Poverty RatePopulation to Provider Ratio
Factor 1Factor 2
Primary Care HPSA Scores (cont)
65
Infant Mortality
Rate
Low Birth Weight Rate
Score
gt200 or gt13 5
lt20 but gt18 or lt13 but gt11 4
lt18 but gt15 or lt11 but gt10 3
lt15 but gt12 or lt10 but gt9 2
lt12 but gt10 or lt9 but gt7 1
Time Distance Score
gt60 minutes gt50 miles 5
lt60 but gt50 minutes lt50 but gt40 miles 4
lt50 but gt40 minutes lt40 but gt30 miles 3
lt40 but gt30 minutes lt30 but gt20 miles 2
lt30 but gt20 minutes lt20 but gt10 miles 1
Average Travel Time or Distance to Nearest Source of Non-Designated Accessible Care (choose largest)
Infant Health Index (choose largest)
Factor 3Factor 4
Dental Health HPSA Scores
66
Factor 1 ndash Population to Provider Ratio Score(x2)
gt100001 and a de-designation threshold of gt0
or there is no dentists and a population gt3000
5
lt100001 but gt80001 and a de-designation threshold of gt0
or there is no dentists and a population gt2500
4
lt80001 but gt60001 and a de-designation threshold of gt0
or there is no dentists and a population gt2000
3
lt60001 but gt50001 and a de-designation threshold of gt0
or there is no dentists and a population gt1500
2
lt50001 but gt40001 and a de-designation threshold of gt0
or there is no dentists and a population gt1000
1
Factor 2 ndash 100 Poverty Rate
Score(x2)
gt50 5
lt50 but gt 40 4
lt40 but gt30 3
lt30 but gt20 2
lt20 but gt15 1
For Dental Health there are 4 Factors for a total of 26 Points
100 Poverty Rate
Population to Dentist Ratio
Factor 1Factor 2
Dental Health HPSA Scores (cont)
67
Water Not Fluoridated = Score of 1 point
Time Distance Score
gt90 minutes gt60 miles 5
lt90 but gt75 minutes lt60 but gt50 miles 4
lt75 but gt60 minutes lt50 but gt40 miles 3
lt60 but gt45 minutes lt40 but gt30 miles 2
lt45 but gt30 minutes lt30 but gt20 miles 1
Average Travel Time or Distance to Nearest Source of Non-Designated Accessible Care (choose largest)
Fluoridated Water
Factor 3 Factor 4
Mental Health HPSA Scores
68
Factor 1 ndash Population to Mental Provider Ratio Score
Psychiatrists Ratio Core Mental Health Ratiogt 450000 AND gt 45000 8
gt 45001 and lt 60001 7
lt 200001 and gt 150001 AND gt 60001 and lt 90001 6
lt 300001 and gt 150001 OR gt 45001 and LT 60001 5
lt 450001 and gt 200001 AND gt 45000 and LT 60000 4
gt 200001 AND gt 60001 3
gt 300001 2
gt 90001 1
Factor 2 ndash 100 Poverty Rate
Score
P() GE 50 5
50 gt P() GE 40 4
40 gt P() GE 30 3
30 gt P() GE 20 2
20 gt P() GE 15 1
P() lt 15 0
For Mental Health there are 7 Factors for a total of 26 Points
100 Poverty Rate
Population to Mental Provider Ratio
Factor 1
Factor 2
Mental Health HPSA Scores (cont)
69
Time Score
Time GE 60 minutes 5lt 60 min and gt50 minutes 4lt50 minutes and gt 40 minutes 3lt40 minutes and gt30 minutes 2lt30 minutes and gt20 minutes 1
Avg Travel Time or Distance to the Nearest Source of Non-Designated Accessible Care (choose largest)
Youth Ratio Ratio of Children under 18 to Adults 18-64
Score
gt25 3
lt25 and gt15 2
lt15 and gt10 1
Time Score
gt60 3
lt60 and gt40 2
lt40 and gt20 1
Score
Yes 1
No 0
Elderly Ratio Ratio of Adults over 65 to Adults 18-64
Substance Abuse prevalence Arearsquos rate is in worst quartile for nation region or state
Alcohol Abuse prevalence Arearsquos rate is in worst quartile for nation region or state
Score
Yes 1
No 0
Factor 3
Factor 4
Factor 5
Factor 6
Factor 7
Automatic HPSA
70
Legislation in 2002 created a new class of HPSAs not based on data but based on status as a certain type of facility
Statute
Federally Qualified Health Centers (FQHCs) that werenrsquot located in HPSAs still wanted access to NHSC Clinicians
Who is CoveredFederally Qualified Health Centers (FQHC)Community Health Centers
FQHC Look-A-Likes
Rural Health Clinics (RHCs) who submit the required application
Indian Health Service (IHS) and IHS ContractCompact Sites ndashTribal and Urban Indian Sites
IF THE SITE IS NOT ONE OF THESE IT DOES NOT QUALIFY FOR AUTO HPSA
Automatic HPSA
71
Scores
Important Note
No data no scoreDeveloped as a way to estimate using the national data Results were often no score or very low scoresOption to increase scores with alternative data available-posted on the websiteChanges in the loan repayment program with graduated payments and tiered funding has led to increased requests for score changes
We caution people that a high score is no guarantee given the small number of clinicians available so donrsquot waste too much energy
The HPSA applies to all sites that are a part of the FQHC or Look-A-Like
They have the same UDS but a different ALPHA code at the end now they have the BCHMIS
They are only listed under the ldquoMOTHER SITErdquo name and location which may be in a different county from a satellite site This information is listed on HPSAFIND website Recently HRSArsquos Office of Information Technology (OIT) created a tool that allows you to identify FQHCs and their Satellite sites See URL listed on ldquoResourcerdquo slide
Rural Health Clinics have to apply for each individual site
Automatic HPSA
72
Data Used to Compute Scores
Partial Scores
The current scoring methodology for primary care includes four factors
Population-to-Primary Care Physician RatioPercent of the Population with incomes below 100 of the Poverty LevelInfant Mortality Rate or Low Birth Weight (whichever score is higher) andTravel Time or Distance to the nearest available source of care (whichever score is higher)
There is a transformation scale that allows computation of partial scores for the four factors
The sum of these partial scores form the total HPSA score except that the partial score for Population-to-Primary Care Physician Ratio is double weighted because HPSA designations are primarily intended to measure the shortage of primary care providers within the HPSA For Dental HPSAs the poverty factor is also doubled
Automatic HPSA
73
Population to Primary Care Physician Ratio
For the FQHC grantees FQHC Look-a-Likes and RHCs these ratios were calculated for the following
Defined Primary Care Service Area (PCSA) which included the location of the facility
As an approximation to the service area of the facility and
Resident civilian population data from the census were used and primary care physician data were taken from the combined AMAAOA files used by the Office of Shortage Designation
For the IHS Service Units and the Alaska Native facilities Native American or Alaska Native population
Figures from the IHS or the Alaska Native Health System were used and
Physician data represent the non-federal providers in the area as reported by the IHS or the Alaska Native Health System
Automatic HPSA
74
Percent of the population with incomes below 100 of the poverty level
For FQHC granteesInitially 2002 Uniform Data System (UDS)-reported data on percent of users with incomes below 100 of poverty were used more recent UDS data used subsequently
For FQHC Look-a-likes and Rural Health Clinics (RHCs)The 2000 census poverty data for the county of location were used We now have UDS Data for FQHC Look-a-Likes
For the IHS and Alaska Native areas The census poverty data for Native American populations within those areas were used or data supplied by the IHS
Automatic HPSA
75
Travel Time or Distance to the Nearest Available Source of CareFor FQHC grantees FQHC Look-a-Likes and RHCs
Travel time and distance were calculated from the population-weighted center of the PCSA in which the entity was located to the population-weighted center of the nearest PCSA with a population-to-primary care physician ratio of at least 20001 using average road speeds and travel time for each road segment involved
For IHS and Alaska Natives Data reported by the IHS or the Alaska Native Health System were used
Infant Mortality Rate or Low Birth Weight (IMRLBW)For FQHC grantees FQHC Look-a-Likes and RHCs
IMRLBW rates for the PCSAs including the FQHC or RHC were used
For IHS and Alaska Native scoring Service unit data for the appropriate populations were used
Acronyms
76
Acronym and MeaningALOS Average Length of Stay CHMPC California Healthcare Workforce Policy
Commission
AMA American Medical Association CDPH California Department of Public Health
ASAPS Application Submission and Processing System CMHP Core Mental Health ProvidersProfessionals
BHCDANET
Bureau of Health Care Delivery and Assistance (NET)
CMS Center for MedicaidMedicare Services (formerly HCFA)
BHW Bureau of Health Workforce CPCA California Primary Care Association
BPHC Bureau of Primary Health Care CT Census Tract
BOP Bureau of Prisons DHHS Department of Health and Human Services
CA Cooperative Agreement DHCS Department of Health Care Services
CCD County Census Division DT Dental
CFR Code of Federal Register FQHC Federally Qualified Health Center
CHC Community Health Center FTE Full-Time Equivalent
Acronyms (cont)
77
Acronym and MeaningGIS Geographic Information System MSSA Medical Service Study Areas
HMO Health Maintenance Organization MUA Medically Underserved Areas
HPSA Health Professional Shortage Areas MUP Medically Underserved Populations
HRSA Health Resources and Services Administration NHSC National Health Service Corps
IHP Indian Health Program PC Primary Care
IHS Indian Health Services PCA Primary Care Association
IMR Infant Mortality Rate PCO Primary Care Office
IMU Index of Medical Underservice RHC Rural Health Clinic
MCD Minor Civil Division RSA Rational Service Area
MFW Migrant Farmworker SFS Sliding Fee Scale
MSFW Migrant Seasonal Farmworker SLRP State Loan Repayment Program
MH Mental Health TA Technical Assistance
Other Resources
78
SLRP httposhpdcagovHWDDSLRPhtml
OSHPD httpwwwoshpdcagov
NHSC httpnhschrsagov
Address Lookup httpgeooshpdcagovhpsa-search-by-address
CalHealth httpswwwfacebookcomCalHealthWorkforce
Twitter httpstwittercomHealthProfCAgov
J1-Visa Waiver Program httpwwwdhcscagovservicesruralPagesJ-1VisaWaiveraspx
HPSA Find httphpsafindhrsagov
HRSA Data Warehouse httpwwwhrsagovdata-statisticsindexhtml
Shortage Designation Program httpwwwoshpdcagovHWDDShortage_Designation_Proghtml
Geographic Information Systems (GIS) httpwwwoshpdcagovHWDDResearch_Policy_Planning_GIShtml
MSFW Enumeration Profiles Estimates httpwwwncfhorgenumerationPDF220Californiapdf
Health Professional Shortage Area (HPSA)
Join the HPSA Tour
Shortage Designation Program (SDP) Concludes
HOPE TO SEE YOU AGAIN

Providers per 1000 Population
Total FTECivilian Population x 1000
MUA
MUP Total FTEPop to be designated x 1000
All physicians must be counted (including J-1 Visa physicians NHSC physicians etc)
For MUA designations the HPSA adjustment factor for the FTE is not used
MUA ndash All primary care physicians are counted
MUA = civilian population
MUP ndash All primary care physicians servicing the population group are counted
MUP = number in that population group (eg low-income pop = pop at or below the 200 poverty)
Must collect inpatient and outpatient hours of the outpatient Doctors
(not hospitalists)
Determine the FTE
Determine the Population
Calculation
Determine the Weighted Value(see table)
56
Geographic Designation - FTEs
57
Provider Name Specialty Location of PracticeHours of Direct
Pt CareWk FTE Based on Hours
A Liver MD1 General Practice
86 N Onion StreetCity State Zip
48(4840=12=10)
10
B Spleen MD2 Pediatrics 103 Sanfgroid DrCity State Zip
30(3040=75)
075
C Heart MD Internal Medicine
777 Stopper AveCity State Zip
40 10
D Kidney DO OB-GYN 3306 Stone DriveCity State Zip
40 10
E Lung DO3 Family Practice 99 Airborne BlvdCity State Zip
25(2540=625)
0625
Total Physicians = 5 Total FTE = 4375 = 44
1 Dr Liver is an NHSC loan repayment recipient counted as 10 FTE
2 Dr Spleen spends 10 hoursweek doing research
3 Dr Lung spends 15 hours week in administration
Provider Name Specialty Location of Practice Hours of Direct
Pt CareWk
FTE Based on Hours
Medi-Cal
Sliding
Fee
of Low
Income
Total Low Income
FTE
A Liver MD GP 86 N Onion StCity State Zip
48 10 64 15 79 079
B Spleen MD PED 103 Sanfgroid DrCity State Zip
30 075 35 8 43 03225
C Heart MD IM 777 Stopper AveCity State Zip
40 10 60 40 100 10
D Kidney DO OB GYN 3306 Stone DriveCity State Zip
40 10 13 0 13 013
E Lung DO FP 99 Airborne BlvdCity State Zip
25 0625 7 0 7 004375
Total Physicians 5 Total Low-Income FTE 228625 = 23
Low-Income Population Designation - FTEs
58
Providers per 1000 Population
59
Prov per 1000 pop
WeightedValue
Prov per 1000 pop
WeightedValue
Prov per 1000 pop
WeightedValue
0-05 0 401-450 107 801-850 243
051-100 05 451-500 126 851-900 253
101-150 15 501-550 148 901-950 259
151-200 28 551-600 169 951-1000 266
201-250 41 601-650 191 1001-1050 272
251-300 57 651-700 207 1051-1100 277
301-350 73 701-750 219 1101-1150 280
351-400 90 751-800 231 1151-1200 283
1201-1250 286
Over 1250 287
find the range which includes
the ratio of primary care
physicians per 1000 population
for the area being examined
See table
Note The weighted value is the same for MUAs amp MUPs
Left Column
Index of Medical Underserved Score
60
Qualifies for designation as an MUAMUP
The IMU Score is determined by adding the values of each of the four factors
Percent of Population at 100 Poverty
Infant Mortality Rate (IMU)
Primary Care Physicians per 1000 Population
+Percent of Population gt 65
+
+
Does not qualify for designation as an MUAMUP
Before surveying providers check the IMU score of the first 3 variables
If V1 + V2 + V3 are gt 620 the area will not designate as an MUA or MUP
If the IMU gt 62 then review rational service area to determine if other boundaries would be appropriate
If not an MUA check if area would designate as an MUP
The IMU Score IMU lt 620
IMU gt 620
Time Saving Tips
MUAMUP Designation Worksheet
61
MUAMUP Designation Map
62
The orange area is a designated MUA and part of the designation is in MSSA 66a and part is in MSSA 63 Because of this the whole designation can be thrown out
MU
AM
UP
Map
HPSA Scores
63
HPSA scores are critical for US HRSA administered programs such as
National Health Service Corps (NHSC) Scholar Placements and Loan Repayment
J1-Visa Waiver Ready Responders
These programs rely on HPSA scores to prioritize resource allocation and level of assistance
DisciplinesPrimary Medical Care HPSA (4 factors = 25 points)
Dental Care HPSA (4 factors = 26 points)
Mental Health HPSA ( 7 factors = 26 points)
Note There is nothing in writing from the Feds on Mental Health
Primary Care HPSA Scores
64
Factor 1 ndash Population to Provider Ratio Score(x2)
gt100001 and the de-designation threshold is gt0
or there is no physicians and a population gt2500
5
lt100001 but gt50001 and the de-designation threshold is gt0
or there is no physicians and a population gt2000
4
lt50001 but gt40001 and the de-designation threshold is gt0
or there is no physicians and a population gt1500
3
lt40001 but gt35001 and the de-designation threshold is gt0
or there is no physicians and a population gt1000
2
lt35001 but gt30001 and the de-designation threshold is gt0
or there is no physicians and a population gt500
1
Factor 2 ndash 100 Poverty Rate
Score
gt50 5
lt50 but gt40 4
lt40 but gt30 3
lt30 but gt20 2
lt20 but gt15 1
For Primary Care there are 4 Factors for a total of 25 Points
100 Poverty RatePopulation to Provider Ratio
Factor 1Factor 2
Primary Care HPSA Scores (cont)
65
Infant Mortality
Rate
Low Birth Weight Rate
Score
gt200 or gt13 5
lt20 but gt18 or lt13 but gt11 4
lt18 but gt15 or lt11 but gt10 3
lt15 but gt12 or lt10 but gt9 2
lt12 but gt10 or lt9 but gt7 1
Time Distance Score
gt60 minutes gt50 miles 5
lt60 but gt50 minutes lt50 but gt40 miles 4
lt50 but gt40 minutes lt40 but gt30 miles 3
lt40 but gt30 minutes lt30 but gt20 miles 2
lt30 but gt20 minutes lt20 but gt10 miles 1
Average Travel Time or Distance to Nearest Source of Non-Designated Accessible Care (choose largest)
Infant Health Index (choose largest)
Factor 3Factor 4
Dental Health HPSA Scores
66
Factor 1 ndash Population to Provider Ratio Score(x2)
gt100001 and a de-designation threshold of gt0
or there is no dentists and a population gt3000
5
lt100001 but gt80001 and a de-designation threshold of gt0
or there is no dentists and a population gt2500
4
lt80001 but gt60001 and a de-designation threshold of gt0
or there is no dentists and a population gt2000
3
lt60001 but gt50001 and a de-designation threshold of gt0
or there is no dentists and a population gt1500
2
lt50001 but gt40001 and a de-designation threshold of gt0
or there is no dentists and a population gt1000
1
Factor 2 ndash 100 Poverty Rate
Score(x2)
gt50 5
lt50 but gt 40 4
lt40 but gt30 3
lt30 but gt20 2
lt20 but gt15 1
For Dental Health there are 4 Factors for a total of 26 Points
100 Poverty Rate
Population to Dentist Ratio
Factor 1Factor 2
Dental Health HPSA Scores (cont)
67
Water Not Fluoridated = Score of 1 point
Time Distance Score
gt90 minutes gt60 miles 5
lt90 but gt75 minutes lt60 but gt50 miles 4
lt75 but gt60 minutes lt50 but gt40 miles 3
lt60 but gt45 minutes lt40 but gt30 miles 2
lt45 but gt30 minutes lt30 but gt20 miles 1
Average Travel Time or Distance to Nearest Source of Non-Designated Accessible Care (choose largest)
Fluoridated Water
Factor 3 Factor 4
Mental Health HPSA Scores
68
Factor 1 ndash Population to Mental Provider Ratio Score
Psychiatrists Ratio Core Mental Health Ratiogt 450000 AND gt 45000 8
gt 45001 and lt 60001 7
lt 200001 and gt 150001 AND gt 60001 and lt 90001 6
lt 300001 and gt 150001 OR gt 45001 and LT 60001 5
lt 450001 and gt 200001 AND gt 45000 and LT 60000 4
gt 200001 AND gt 60001 3
gt 300001 2
gt 90001 1
Factor 2 ndash 100 Poverty Rate
Score
P() GE 50 5
50 gt P() GE 40 4
40 gt P() GE 30 3
30 gt P() GE 20 2
20 gt P() GE 15 1
P() lt 15 0
For Mental Health there are 7 Factors for a total of 26 Points
100 Poverty Rate
Population to Mental Provider Ratio
Factor 1
Factor 2
Mental Health HPSA Scores (cont)
69
Time Score
Time GE 60 minutes 5lt 60 min and gt50 minutes 4lt50 minutes and gt 40 minutes 3lt40 minutes and gt30 minutes 2lt30 minutes and gt20 minutes 1
Avg Travel Time or Distance to the Nearest Source of Non-Designated Accessible Care (choose largest)
Youth Ratio Ratio of Children under 18 to Adults 18-64
Score
gt25 3
lt25 and gt15 2
lt15 and gt10 1
Time Score
gt60 3
lt60 and gt40 2
lt40 and gt20 1
Score
Yes 1
No 0
Elderly Ratio Ratio of Adults over 65 to Adults 18-64
Substance Abuse prevalence Arearsquos rate is in worst quartile for nation region or state
Alcohol Abuse prevalence Arearsquos rate is in worst quartile for nation region or state
Score
Yes 1
No 0
Factor 3
Factor 4
Factor 5
Factor 6
Factor 7
Automatic HPSA
70
Legislation in 2002 created a new class of HPSAs not based on data but based on status as a certain type of facility
Statute
Federally Qualified Health Centers (FQHCs) that werenrsquot located in HPSAs still wanted access to NHSC Clinicians
Who is CoveredFederally Qualified Health Centers (FQHC)Community Health Centers
FQHC Look-A-Likes
Rural Health Clinics (RHCs) who submit the required application
Indian Health Service (IHS) and IHS ContractCompact Sites ndashTribal and Urban Indian Sites
IF THE SITE IS NOT ONE OF THESE IT DOES NOT QUALIFY FOR AUTO HPSA
Automatic HPSA
71
Scores
Important Note
No data no scoreDeveloped as a way to estimate using the national data Results were often no score or very low scoresOption to increase scores with alternative data available-posted on the websiteChanges in the loan repayment program with graduated payments and tiered funding has led to increased requests for score changes
We caution people that a high score is no guarantee given the small number of clinicians available so donrsquot waste too much energy
The HPSA applies to all sites that are a part of the FQHC or Look-A-Like
They have the same UDS but a different ALPHA code at the end now they have the BCHMIS
They are only listed under the ldquoMOTHER SITErdquo name and location which may be in a different county from a satellite site This information is listed on HPSAFIND website Recently HRSArsquos Office of Information Technology (OIT) created a tool that allows you to identify FQHCs and their Satellite sites See URL listed on ldquoResourcerdquo slide
Rural Health Clinics have to apply for each individual site
Automatic HPSA
72
Data Used to Compute Scores
Partial Scores
The current scoring methodology for primary care includes four factors
Population-to-Primary Care Physician RatioPercent of the Population with incomes below 100 of the Poverty LevelInfant Mortality Rate or Low Birth Weight (whichever score is higher) andTravel Time or Distance to the nearest available source of care (whichever score is higher)
There is a transformation scale that allows computation of partial scores for the four factors
The sum of these partial scores form the total HPSA score except that the partial score for Population-to-Primary Care Physician Ratio is double weighted because HPSA designations are primarily intended to measure the shortage of primary care providers within the HPSA For Dental HPSAs the poverty factor is also doubled
Automatic HPSA
73
Population to Primary Care Physician Ratio
For the FQHC grantees FQHC Look-a-Likes and RHCs these ratios were calculated for the following
Defined Primary Care Service Area (PCSA) which included the location of the facility
As an approximation to the service area of the facility and
Resident civilian population data from the census were used and primary care physician data were taken from the combined AMAAOA files used by the Office of Shortage Designation
For the IHS Service Units and the Alaska Native facilities Native American or Alaska Native population
Figures from the IHS or the Alaska Native Health System were used and
Physician data represent the non-federal providers in the area as reported by the IHS or the Alaska Native Health System
Automatic HPSA
74
Percent of the population with incomes below 100 of the poverty level
For FQHC granteesInitially 2002 Uniform Data System (UDS)-reported data on percent of users with incomes below 100 of poverty were used more recent UDS data used subsequently
For FQHC Look-a-likes and Rural Health Clinics (RHCs)The 2000 census poverty data for the county of location were used We now have UDS Data for FQHC Look-a-Likes
For the IHS and Alaska Native areas The census poverty data for Native American populations within those areas were used or data supplied by the IHS
Automatic HPSA
75
Travel Time or Distance to the Nearest Available Source of CareFor FQHC grantees FQHC Look-a-Likes and RHCs
Travel time and distance were calculated from the population-weighted center of the PCSA in which the entity was located to the population-weighted center of the nearest PCSA with a population-to-primary care physician ratio of at least 20001 using average road speeds and travel time for each road segment involved
For IHS and Alaska Natives Data reported by the IHS or the Alaska Native Health System were used
Infant Mortality Rate or Low Birth Weight (IMRLBW)For FQHC grantees FQHC Look-a-Likes and RHCs
IMRLBW rates for the PCSAs including the FQHC or RHC were used
For IHS and Alaska Native scoring Service unit data for the appropriate populations were used
Acronyms
76
Acronym and MeaningALOS Average Length of Stay CHMPC California Healthcare Workforce Policy
Commission
AMA American Medical Association CDPH California Department of Public Health
ASAPS Application Submission and Processing System CMHP Core Mental Health ProvidersProfessionals
BHCDANET
Bureau of Health Care Delivery and Assistance (NET)
CMS Center for MedicaidMedicare Services (formerly HCFA)
BHW Bureau of Health Workforce CPCA California Primary Care Association
BPHC Bureau of Primary Health Care CT Census Tract
BOP Bureau of Prisons DHHS Department of Health and Human Services
CA Cooperative Agreement DHCS Department of Health Care Services
CCD County Census Division DT Dental
CFR Code of Federal Register FQHC Federally Qualified Health Center
CHC Community Health Center FTE Full-Time Equivalent
Acronyms (cont)
77
Acronym and MeaningGIS Geographic Information System MSSA Medical Service Study Areas
HMO Health Maintenance Organization MUA Medically Underserved Areas
HPSA Health Professional Shortage Areas MUP Medically Underserved Populations
HRSA Health Resources and Services Administration NHSC National Health Service Corps
IHP Indian Health Program PC Primary Care
IHS Indian Health Services PCA Primary Care Association
IMR Infant Mortality Rate PCO Primary Care Office
IMU Index of Medical Underservice RHC Rural Health Clinic
MCD Minor Civil Division RSA Rational Service Area
MFW Migrant Farmworker SFS Sliding Fee Scale
MSFW Migrant Seasonal Farmworker SLRP State Loan Repayment Program
MH Mental Health TA Technical Assistance
Other Resources
78
SLRP httposhpdcagovHWDDSLRPhtml
OSHPD httpwwwoshpdcagov
NHSC httpnhschrsagov
Address Lookup httpgeooshpdcagovhpsa-search-by-address
CalHealth httpswwwfacebookcomCalHealthWorkforce
Twitter httpstwittercomHealthProfCAgov
J1-Visa Waiver Program httpwwwdhcscagovservicesruralPagesJ-1VisaWaiveraspx
HPSA Find httphpsafindhrsagov
HRSA Data Warehouse httpwwwhrsagovdata-statisticsindexhtml
Shortage Designation Program httpwwwoshpdcagovHWDDShortage_Designation_Proghtml
Geographic Information Systems (GIS) httpwwwoshpdcagovHWDDResearch_Policy_Planning_GIShtml
MSFW Enumeration Profiles Estimates httpwwwncfhorgenumerationPDF220Californiapdf
Health Professional Shortage Area (HPSA)
Join the HPSA Tour
Shortage Designation Program (SDP) Concludes
HOPE TO SEE YOU AGAIN
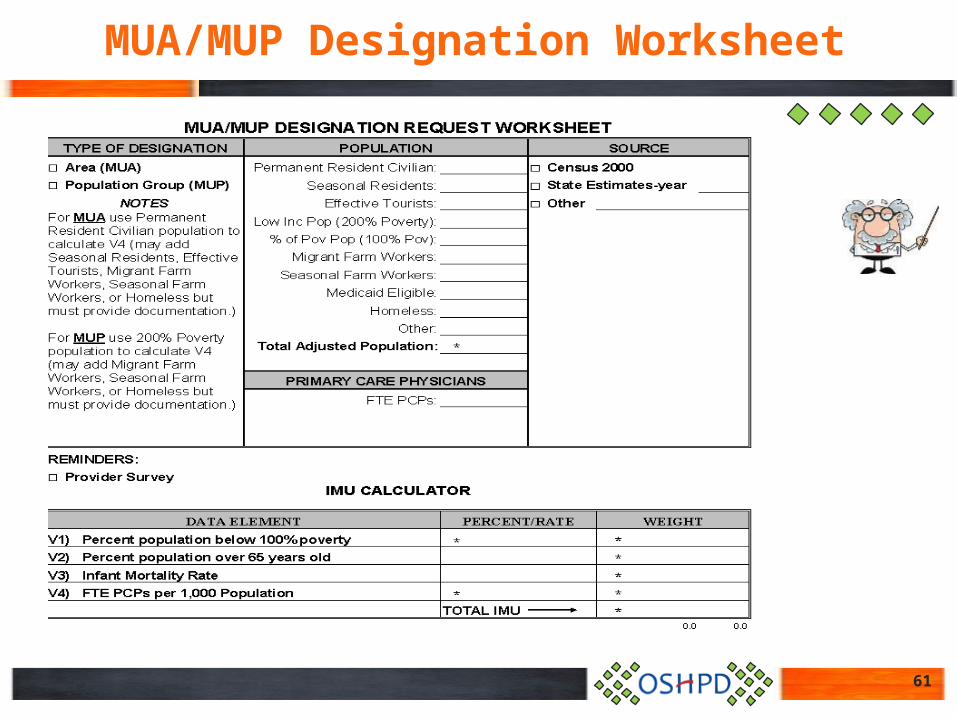
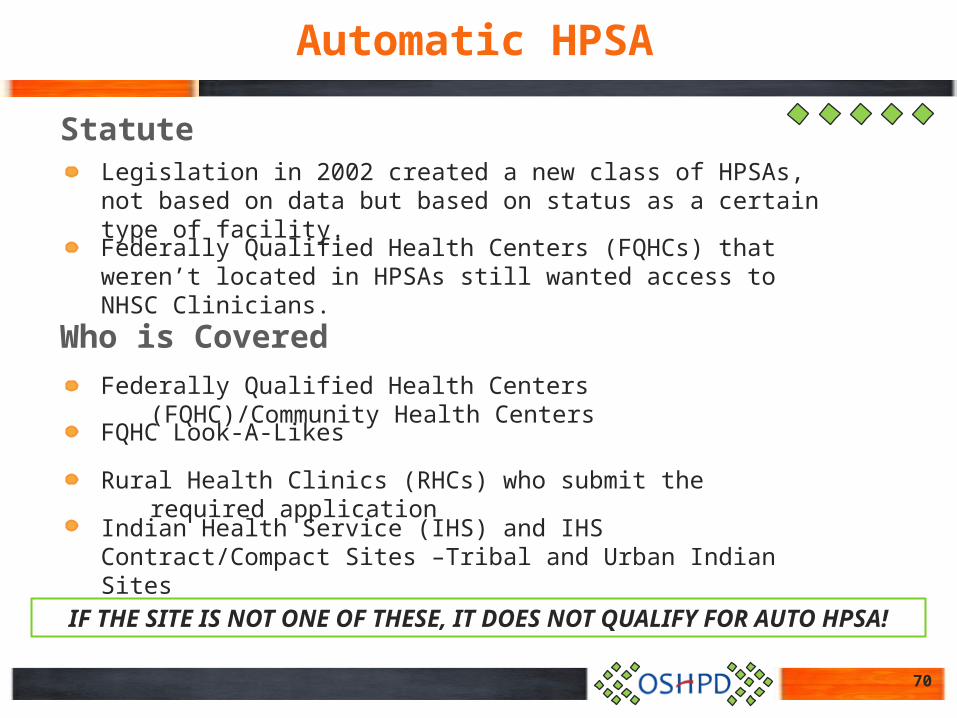
Automatic HPSA
71
Scores
Important Note
No data no scoreDeveloped as a way to estimate using the national data Results were often no score or very low scoresOption to increase scores with alternative data available-posted on the websiteChanges in the loan repayment program with graduated payments and tiered funding has led to increased requests for score changes
We caution people that a high score is no guarantee given the small number of clinicians available so donrsquot waste too much energy
The HPSA applies to all sites that are a part of the FQHC or Look-A-Like
They have the same UDS but a different ALPHA code at the end now they have the BCHMIS
They are only listed under the ldquoMOTHER SITErdquo name and location which may be in a different county from a satellite site This information is listed on HPSAFIND website Recently HRSArsquos Office of Information Technology (OIT) created a tool that allows you to identify FQHCs and their Satellite sites See URL listed on ldquoResourcerdquo slide
Rural Health Clinics have to apply for each individual site
Automatic HPSA
72
Data Used to Compute Scores
Partial Scores
The current scoring methodology for primary care includes four factors
Population-to-Primary Care Physician RatioPercent of the Population with incomes below 100 of the Poverty LevelInfant Mortality Rate or Low Birth Weight (whichever score is higher) andTravel Time or Distance to the nearest available source of care (whichever score is higher)
There is a transformation scale that allows computation of partial scores for the four factors
The sum of these partial scores form the total HPSA score except that the partial score for Population-to-Primary Care Physician Ratio is double weighted because HPSA designations are primarily intended to measure the shortage of primary care providers within the HPSA For Dental HPSAs the poverty factor is also doubled
Automatic HPSA
73
Population to Primary Care Physician Ratio
For the FQHC grantees FQHC Look-a-Likes and RHCs these ratios were calculated for the following
Defined Primary Care Service Area (PCSA) which included the location of the facility
As an approximation to the service area of the facility and
Resident civilian population data from the census were used and primary care physician data were taken from the combined AMAAOA files used by the Office of Shortage Designation
For the IHS Service Units and the Alaska Native facilities Native American or Alaska Native population
Figures from the IHS or the Alaska Native Health System were used and
Physician data represent the non-federal providers in the area as reported by the IHS or the Alaska Native Health System
Automatic HPSA
74
Percent of the population with incomes below 100 of the poverty level
For FQHC granteesInitially 2002 Uniform Data System (UDS)-reported data on percent of users with incomes below 100 of poverty were used more recent UDS data used subsequently
For FQHC Look-a-likes and Rural Health Clinics (RHCs)The 2000 census poverty data for the county of location were used We now have UDS Data for FQHC Look-a-Likes
For the IHS and Alaska Native areas The census poverty data for Native American populations within those areas were used or data supplied by the IHS
Automatic HPSA
75
Travel Time or Distance to the Nearest Available Source of CareFor FQHC grantees FQHC Look-a-Likes and RHCs
Travel time and distance were calculated from the population-weighted center of the PCSA in which the entity was located to the population-weighted center of the nearest PCSA with a population-to-primary care physician ratio of at least 20001 using average road speeds and travel time for each road segment involved
For IHS and Alaska Natives Data reported by the IHS or the Alaska Native Health System were used
Infant Mortality Rate or Low Birth Weight (IMRLBW)For FQHC grantees FQHC Look-a-Likes and RHCs
IMRLBW rates for the PCSAs including the FQHC or RHC were used
For IHS and Alaska Native scoring Service unit data for the appropriate populations were used
Acronyms
76
Acronym and MeaningALOS Average Length of Stay CHMPC California Healthcare Workforce Policy
Commission
AMA American Medical Association CDPH California Department of Public Health
ASAPS Application Submission and Processing System CMHP Core Mental Health ProvidersProfessionals
BHCDANET
Bureau of Health Care Delivery and Assistance (NET)
CMS Center for MedicaidMedicare Services (formerly HCFA)
BHW Bureau of Health Workforce CPCA California Primary Care Association
BPHC Bureau of Primary Health Care CT Census Tract
BOP Bureau of Prisons DHHS Department of Health and Human Services
CA Cooperative Agreement DHCS Department of Health Care Services
CCD County Census Division DT Dental
CFR Code of Federal Register FQHC Federally Qualified Health Center
CHC Community Health Center FTE Full-Time Equivalent
Acronyms (cont)
77
Acronym and MeaningGIS Geographic Information System MSSA Medical Service Study Areas
HMO Health Maintenance Organization MUA Medically Underserved Areas
HPSA Health Professional Shortage Areas MUP Medically Underserved Populations
HRSA Health Resources and Services Administration NHSC National Health Service Corps
IHP Indian Health Program PC Primary Care
IHS Indian Health Services PCA Primary Care Association
IMR Infant Mortality Rate PCO Primary Care Office
IMU Index of Medical Underservice RHC Rural Health Clinic
MCD Minor Civil Division RSA Rational Service Area
MFW Migrant Farmworker SFS Sliding Fee Scale
MSFW Migrant Seasonal Farmworker SLRP State Loan Repayment Program
MH Mental Health TA Technical Assistance
Other Resources
78
SLRP httposhpdcagovHWDDSLRPhtml
OSHPD httpwwwoshpdcagov
NHSC httpnhschrsagov
Address Lookup httpgeooshpdcagovhpsa-search-by-address
CalHealth httpswwwfacebookcomCalHealthWorkforce
Twitter httpstwittercomHealthProfCAgov
J1-Visa Waiver Program httpwwwdhcscagovservicesruralPagesJ-1VisaWaiveraspx
HPSA Find httphpsafindhrsagov
HRSA Data Warehouse httpwwwhrsagovdata-statisticsindexhtml
Shortage Designation Program httpwwwoshpdcagovHWDDShortage_Designation_Proghtml
Geographic Information Systems (GIS) httpwwwoshpdcagovHWDDResearch_Policy_Planning_GIShtml
MSFW Enumeration Profiles Estimates httpwwwncfhorgenumerationPDF220Californiapdf
Health Professional Shortage Area (HPSA)
Join the HPSA Tour
Shortage Designation Program (SDP) Concludes
HOPE TO SEE YOU AGAIN
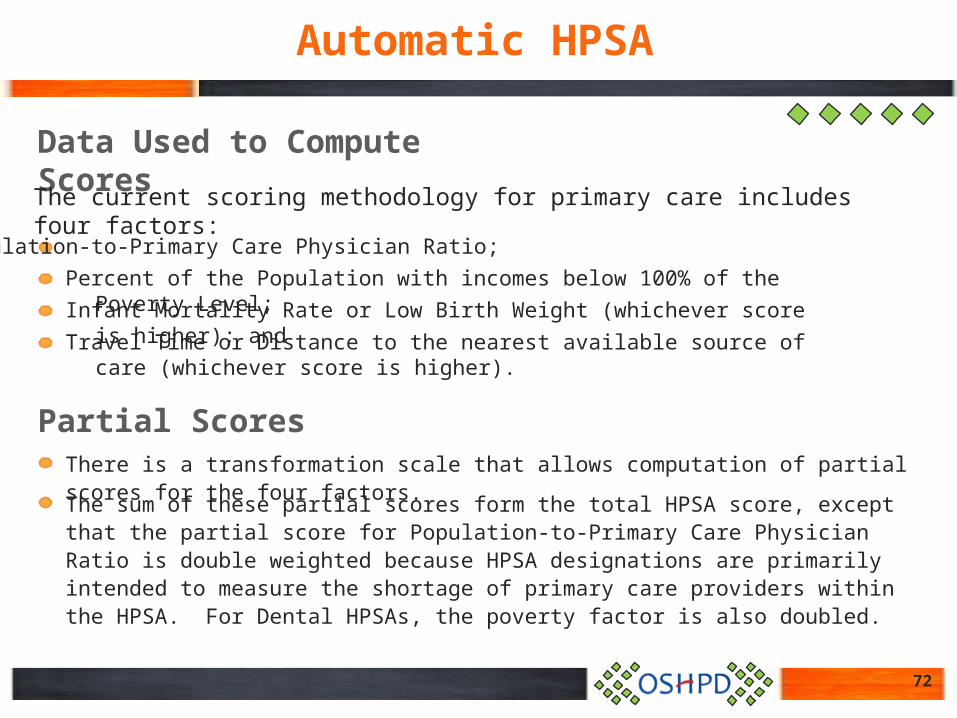
Automatic HPSA
75
Travel Time or Distance to the Nearest Available Source of CareFor FQHC grantees FQHC Look-a-Likes and RHCs
Travel time and distance were calculated from the population-weighted center of the PCSA in which the entity was located to the population-weighted center of the nearest PCSA with a population-to-primary care physician ratio of at least 20001 using average road speeds and travel time for each road segment involved
For IHS and Alaska Natives Data reported by the IHS or the Alaska Native Health System were used
Infant Mortality Rate or Low Birth Weight (IMRLBW)For FQHC grantees FQHC Look-a-Likes and RHCs
IMRLBW rates for the PCSAs including the FQHC or RHC were used
For IHS and Alaska Native scoring Service unit data for the appropriate populations were used
Acronyms
76
Acronym and MeaningALOS Average Length of Stay CHMPC California Healthcare Workforce Policy
Commission
AMA American Medical Association CDPH California Department of Public Health
ASAPS Application Submission and Processing System CMHP Core Mental Health ProvidersProfessionals
BHCDANET
Bureau of Health Care Delivery and Assistance (NET)
CMS Center for MedicaidMedicare Services (formerly HCFA)
BHW Bureau of Health Workforce CPCA California Primary Care Association
BPHC Bureau of Primary Health Care CT Census Tract
BOP Bureau of Prisons DHHS Department of Health and Human Services
CA Cooperative Agreement DHCS Department of Health Care Services
CCD County Census Division DT Dental
CFR Code of Federal Register FQHC Federally Qualified Health Center
CHC Community Health Center FTE Full-Time Equivalent
Acronyms (cont)
77
Acronym and MeaningGIS Geographic Information System MSSA Medical Service Study Areas
HMO Health Maintenance Organization MUA Medically Underserved Areas
HPSA Health Professional Shortage Areas MUP Medically Underserved Populations
HRSA Health Resources and Services Administration NHSC National Health Service Corps
IHP Indian Health Program PC Primary Care
IHS Indian Health Services PCA Primary Care Association
IMR Infant Mortality Rate PCO Primary Care Office
IMU Index of Medical Underservice RHC Rural Health Clinic
MCD Minor Civil Division RSA Rational Service Area
MFW Migrant Farmworker SFS Sliding Fee Scale
MSFW Migrant Seasonal Farmworker SLRP State Loan Repayment Program
MH Mental Health TA Technical Assistance
Other Resources
78
SLRP httposhpdcagovHWDDSLRPhtml
OSHPD httpwwwoshpdcagov
NHSC httpnhschrsagov
Address Lookup httpgeooshpdcagovhpsa-search-by-address
CalHealth httpswwwfacebookcomCalHealthWorkforce
Twitter httpstwittercomHealthProfCAgov
J1-Visa Waiver Program httpwwwdhcscagovservicesruralPagesJ-1VisaWaiveraspx
HPSA Find httphpsafindhrsagov
HRSA Data Warehouse httpwwwhrsagovdata-statisticsindexhtml
Shortage Designation Program httpwwwoshpdcagovHWDDShortage_Designation_Proghtml
Geographic Information Systems (GIS) httpwwwoshpdcagovHWDDResearch_Policy_Planning_GIShtml
MSFW Enumeration Profiles Estimates httpwwwncfhorgenumerationPDF220Californiapdf
Health Professional Shortage Area (HPSA)
Join the HPSA Tour
Shortage Designation Program (SDP) Concludes
HOPE TO SEE YOU AGAIN

Health Professional Shortage Area (HPSA)
Join the HPSA Tour
Shortage Designation Program (SDP) Concludes
HOPE TO SEE YOU AGAIN