health plans dashboard - myhss.org report details the inpatient, outpatient and pharmacy utilization...
TRANSCRIPT

Health Plans Dashboard
Prepared by HSS and Aon Hewitt
Q2 2015 Dashboard Summary ReportA review of Inpatient, Outpatient and RX trends
January 14, 2016

Health Plans Dashboard January 14,2016
2
Introduction
This report completes the first phase in transitioning the evaluation of the health plans’ performance from vendor reports to the All Payer Claims Database (APCD)
This report details the inpatient, outpatient and pharmacy utilization and cost trends across Blue Shield, Kaiser Permanente, and City Plan for the active population through Q2 2015
This is the first integrated dashboard that has been presented and as such the comparisons are made at the aggregate totals. The values presented have not been risk adjusted. The APCD will be updated with risk scores in the next maintenance cycle

Health Plans Dashboard January 14,2016
3
Notes
Some data continues to be sourced from vendor reports. Specifically Blue Shield cost measures are sourced from vendor reports since financials from Sutter claims are not provided at a detail claim level for the APCD.
All APCD data underwent a vigorous data investigation and validation process. Less than a 3% variance was the required threshold for the acceptance criteria.

Health Plans Dashboard January 14,2016
4
Health Plan Actives: Enrollment and Membership
• Kaiser Permanente active membership for Q2 2015 is comprised of 25% under 20, 37% aged 20-44, 35% aged 45-64 and 3% over age 65

Health Plans Dashboard January 14,2016
5
Health Plan Actives: Enrollment and Membership
33,513 32,578 32,588
05,00010,00015,00020,00025,00030,00035,00040,000
BSC BSC BSC BSC BSC BSC BSC BSC BSC BSC
Q1 2013 Q2 2013 Q3 2013 Q4 2013 Q1 2014 Q2 2014 Q3 2014 Q4 2014 Q1 2015 Q2 2015
Blue Shield Active Membership
Under 20 20-‐44 45-‐64 Over 65
• Blue Shield active membership for Q2 2015 is comprised of 24% under 20, 32% aged 20-44, 41% aged 45-64 and 3% over age 65
• Health Service System has had a desire for more families to move to Blue Shield. Some gains were realized with the addition of 124 families for Q1 2015, but as a percentage, the growth was negligible.
Health Plans Dashboard January 14,2016
6
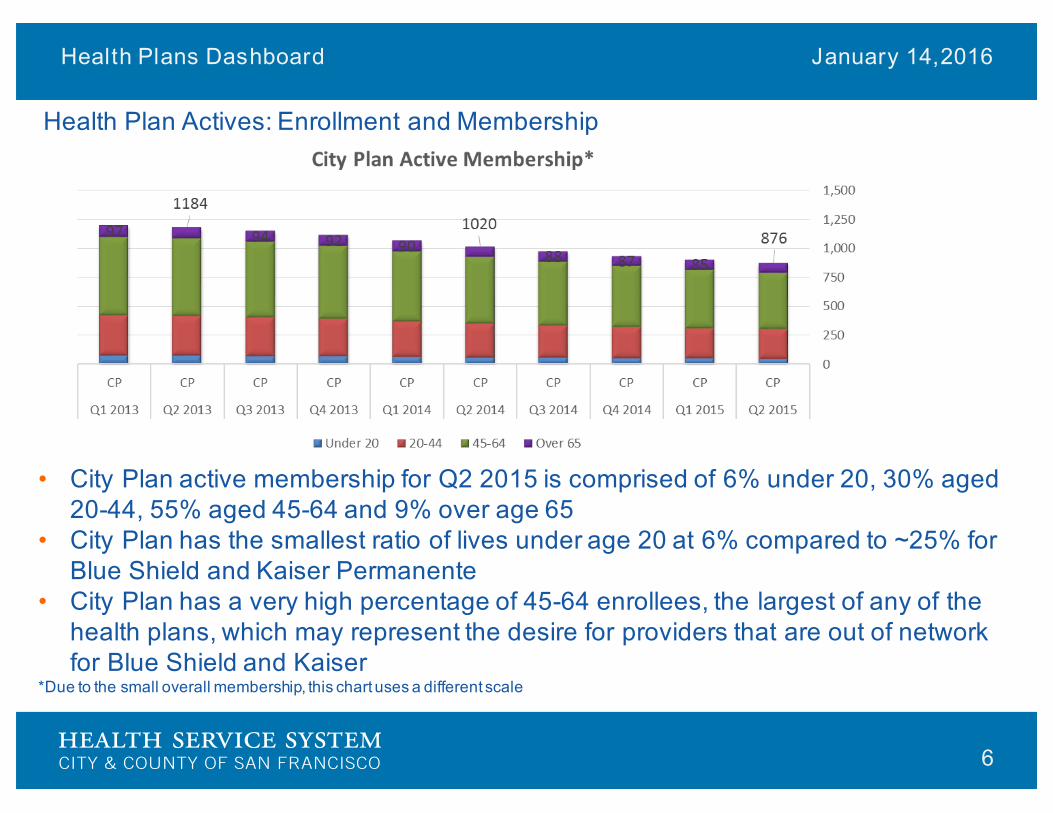
Health Plan Actives: Enrollment and Membership
• City Plan active membership for Q2 2015 is comprised of 6% under 20, 30% aged 20-44, 55% aged 45-64 and 9% over age 65
• City Plan has the smallest ratio of lives under age 20 at 6% compared to ~25% for Blue Shield and Kaiser Permanente
• City Plan has a very high percentage of 45-64 enrollees, the largest of any of the health plans, which may represent the desire for providers that are out of network for Blue Shield and Kaiser
*Due to the small overall membership, this chart uses a different scale

Health Plans Dashboard January 14,2016
7
Health Plan Actives: Total Costs PMPM
• Total costs PMPM are trending upwards with City Plan experiencing the higher trend with a 44% change since Q2 2013
• In the last two years, Blue Shield PMPM has increased by 16% and Kaiser Permanente’s PMPM has increased by 6.5%
$389.31 $401.10 $415.25
$481.85 $544.67
$560.21
$935.77 $1,069.22
$1,348.84
$-‐
$200.00
$400.00
$600.00
$800.00
$1,000.00
$1,200.00
$1,400.00
$1,600.00
Q1 2 0 1 3 Q2 2 0 1 3 Q3 2 0 1 3 Q4 2 0 1 3 Q1 2 0 1 4 Q2 2 0 1 4 Q3 2 0 1 4 Q4 2 0 1 4 Q1 2 0 1 5 Q2 2 0 1 5
TOTAL COSTS PMPMKAISER BSC CP Linear (KAISER) Linear (BSC) Linear (CP)

Health Plans Dashboard January 14,2016
8
Health Plan Actives: Cost Composition
• The percentage of the pharmacy component of the PMPM costs for Blue Shield and Kaiser Permanente reflect a 17 percent and 18 percent increase respectively over Q2 2014
33%
36%
19%
12%
KP -‐ Q 2 2015 Cost Composition
Inpatient Outpatient Other Rx
30%
52%
1% 17%
CP -‐ Q2 2015 Cost Composition
Inpatient Outpatient Other Rx
36%
41%
0%
23%
BSC -‐ Q2 2015 Cost Composition
Inpatient Outpatient Other Rx

Health Plans Dashboard January 14,2016
9
Health Plan Actives: Admits Per 1000 Members
3936
36
47 45
43
1621
18
0
10
20
30
40
50
60
Q1 2 0 1 3 Q2 2 0 1 3 Q3 2 0 1 3 Q4 2 0 1 3 Q1 2 0 1 4 Q2 2 0 1 4 Q3 2 0 1 4 Q4 2 0 1 4 Q1 2 0 1 5 Q2 2 0 1 5
ADMITS PER 1000 MEMBERS
KP BSC CP
• Blue Shield consistently has more admissions per 1000 members• In reviewing the other inpatient utilization metrics, it appears that Blue Shield could
benefit from making more outpatient services available or finding ways to discharge patients earlier.

Health Plans Dashboard January 14,2016
10
Health Plan Actives: Inpatient Average Length of Stay
• Recent data shows that City Plan and Blue Shield Patients are in the hospital ½ day longer than Kaiser
• This area is amenable to increased case review to decrease the average length of stay. Each ½ day of stay represents about $3,911
• This greater length of stay coupled with the higher admits per thousand as compared to KP results in greater inpatient cost for Blue Shield and City Plan
4.08 3.893.97
5.324.45
4.54
5.49
4.094.57
0.00
2.00
4.00
6.00
8.00
10.00
12.00
14.00
16.00
18.00
Q1 2 0 1 3 Q2 2 0 1 3 Q3 2 0 1 3 Q4 2 0 1 3 Q1 2 0 1 4 Q2 2 0 1 4 Q3 2 0 1 4 Q4 2 0 1 4 Q1 2 0 1 5 Q2 2 0 1 5
INPATIENT AVERAGE LENGTH OF STAYKP BSC CP
Health Plans Dashboard January 14,2016
11
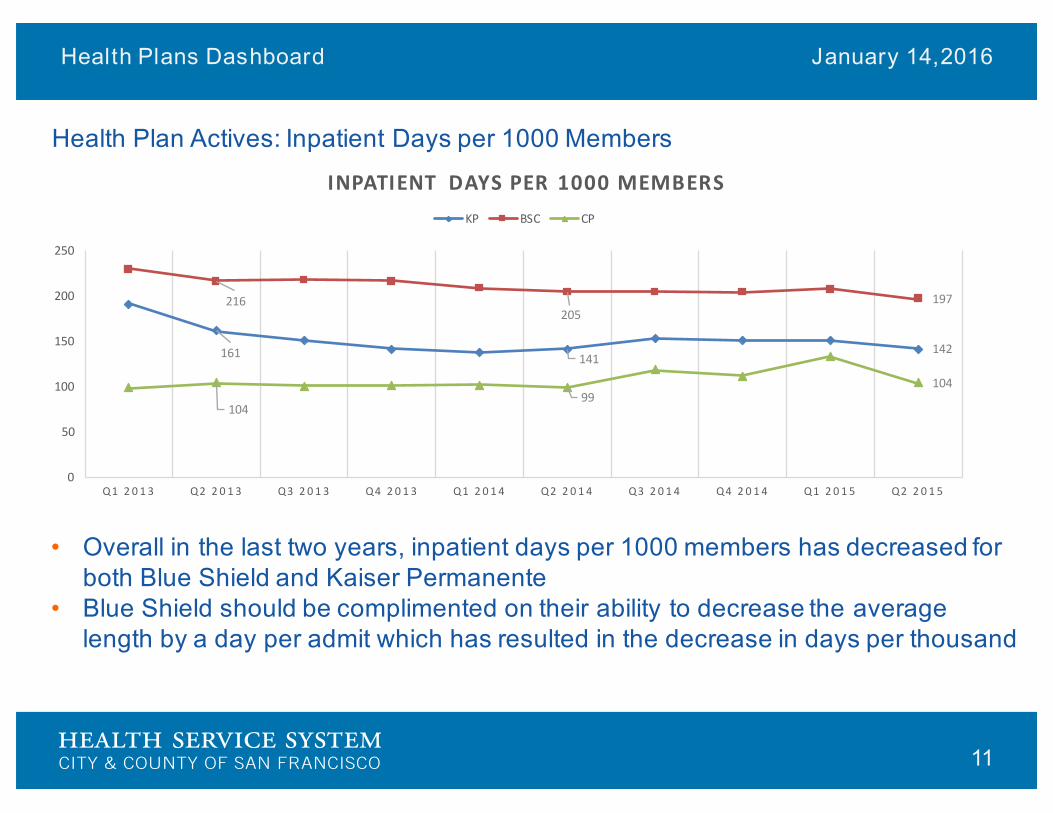
Health Plan Actives: Inpatient Days per 1000 Members
• Overall in the last two years, inpatient days per 1000 members has decreased for both Blue Shield and Kaiser Permanente
• Blue Shield should be complimented on their ability to decrease the average length by a day per admit which has resulted in the decrease in days per thousand
161 141142
216205
197
10499
104
0
50
100
150
200
250
Q1 2 0 1 3 Q2 2 0 1 3 Q3 2 0 1 3 Q4 2 0 1 3 Q1 2 0 1 4 Q2 2 0 1 4 Q3 2 0 1 4 Q4 2 0 1 4 Q1 2 0 1 5 Q2 2 0 1 5
INPATIENT DAYS PER 1000 MEMBERSKP BSC CP
Health Plans Dashboard January 14,2016
12
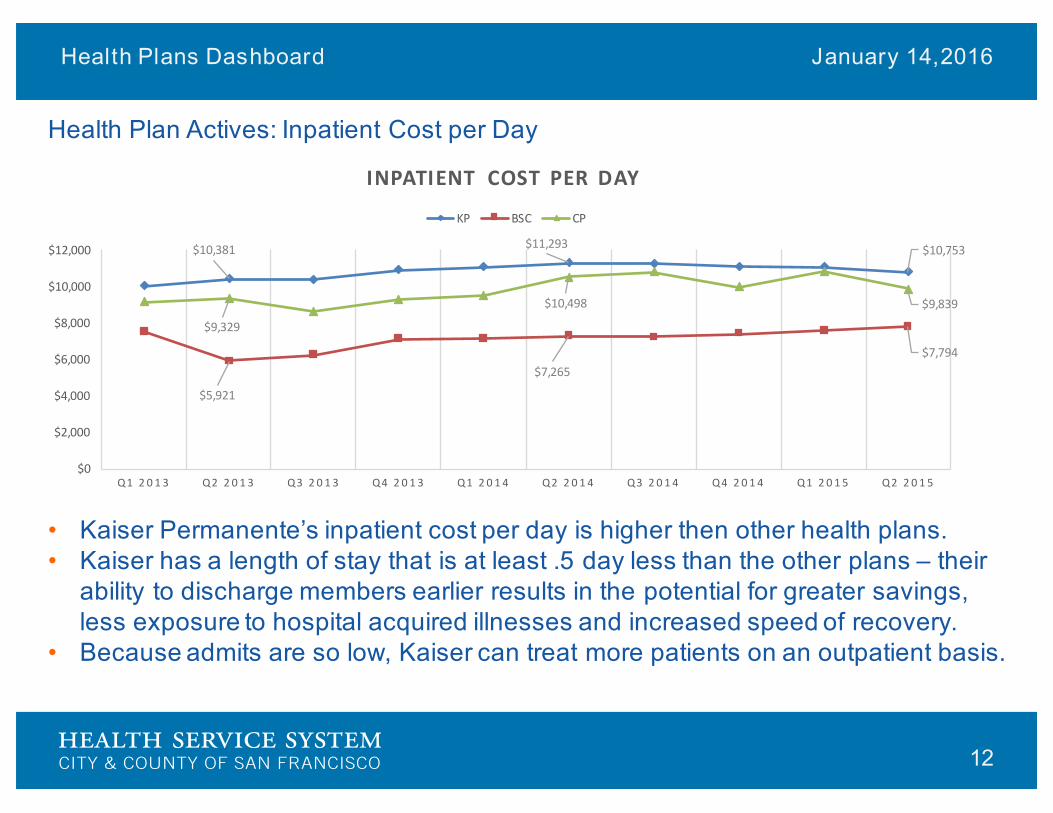
Health Plan Actives: Inpatient Cost per Day
• Kaiser Permanente’s inpatient cost per day is higher then other health plans. • Kaiser has a length of stay that is at least .5 day less than the other plans – their
ability to discharge members earlier results in the potential for greater savings, less exposure to hospital acquired illnesses and increased speed of recovery.
• Because admits are so low, Kaiser can treat more patients on an outpatient basis.
$10,381 $11,293 $10,753
$5,921
$7,265$7,794
$9,329
$10,498 $9,839
$0
$2,000
$4,000
$6,000
$8,000
$10,000
$12,000
Q1 2 0 1 3 Q2 2 0 1 3 Q3 2 0 1 3 Q4 2 0 1 3 Q1 2 0 1 4 Q2 2 0 1 4 Q3 2 0 1 4 Q4 2 0 1 4 Q1 2 0 1 5 Q2 2 0 1 5
INPATIENT COST PER DAY
KP BSC CP

Health Plans Dashboard January 14,2016
13
Health Plan Actives: Outpatient Procedures Per 1000
• The procedures per 1000 aggregates emergency room, surgical, medical, laboratory, radiology, office visit and other procedures such as physical and occupational therapies
8,563 8,386 8,407
5,888
6,373
6,314 6,717
7,005 6,006
-‐
1,000
2,000
3,000
4,000
5,000
6,000
7,000
8,000
9,000
Q3 2 0 1 3 Q4 2 0 1 3 Q1 2 0 1 4 Q2 2 0 1 4 Q3 2 0 1 4 Q4 2 0 1 4 Q1 2 0 1 5 Q2 2 0 1 5
PROCEDURES PER 1000
KAISER BSC CP

Health Plans Dashboard January 14,2016
14
Health Plan Actives: Outpatient Cost Per Procedure
• Overall outpatient cost per procedure is trending upwards• Blue Shield’s outpatient cost per procedure is four times higher than the other
health plans.
$188.5 $210.2
$215.8
$858.8 $839.7 860.0
$159.6 $178.8
$221.6
$-‐$100.0 $200.0 $300.0 $400.0 $500.0 $600.0 $700.0 $800.0 $900.0
$1,000.0
Q2 2 0 1 3 Q3 2 0 1 3 Q4 2 0 1 3 Q1 2 0 1 4 Q2 2 0 1 4 Q3 2 0 1 4 Q4 2 0 1 4 Q1 2 0 1 5 Q2 2 0 1 5
OUTPATIENT COST / PROCEDURE
KAISER BSC CP

Health Plans Dashboard January 14,2016
15
Health Plan Actives: Rx PMPM
• Overall PMPM pharmaceutical costs have been trending upwards which is consistent with industry trends
• It should be noted that Blue Shield members receive 50% more prescriptions a year than Kaiser members
$42 $51
$76$91
$175
$267
$0
$50
$100
$150
$200
$250
$300
Q3 2 0 1 3 Q4 2 0 1 3 Q1 2 0 1 4 Q2 2 0 1 4 Q3 2 0 1 4 Q4 2 0 1 4 Q1 2 0 1 5 Q2 2 0 1 5
RX PMPM
KP BSC CPQ1 2015 Total Scripts:
Blue Shield: 355,018City Plan: 16,341Kaiser: 236,675
Health Plans Dashboard January 14,2016
16
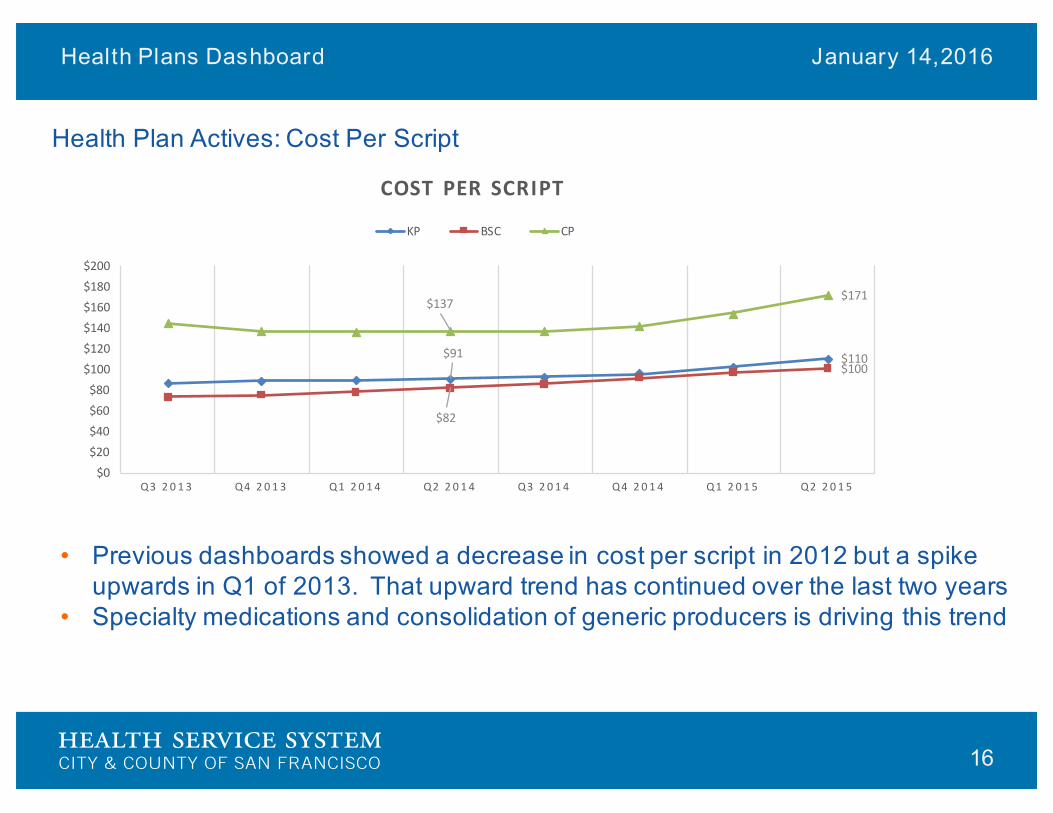
Health Plan Actives: Cost Per Script
• Previous dashboards showed a decrease in cost per script in 2012 but a spike upwards in Q1 of 2013. That upward trend has continued over the last two years
• Specialty medications and consolidation of generic producers is driving this trend
$91 $110
$82
$100
$137 $171
$0$20$40$60$80$100$120$140$160$180$200
Q3 2 0 1 3 Q4 2 0 1 3 Q1 2 0 1 4 Q2 2 0 1 4 Q3 2 0 1 4 Q4 2 0 1 4 Q1 2 0 1 5 Q2 2 0 1 5
COST PER SCRIPT
KP BSC CP

Health Plans Dashboard January 14,2016
17
Health Plan Actives: Dispensing Rate for Generic Drugs
• In the September 2013 presentation of the Blue Shield dashboard, HSS reported an expectation for the Blue Shield generic substitution rate would continue to increase due to the efforts of the ACO’s.
• The generic dispensing rate for all three health plans has remained flat –although some of this finding may be related to the increase in specialty medications, it is concerning that the generic dispensing rate remains flat
94%94%
81%81%
73%
74%
0%
10%
20%
30%
40%
50%
60%
70%
80%
90%
100%
Q3 2 0 1 3 Q4 2 0 1 3 Q1 2 0 1 4 Q2 2 0 1 4 Q3 2 0 1 4 Q4 2 0 1 4 Q1 2 0 1 5 Q2 2 0 1 5
GENERIC DISPENSING RATE
KP BSC CP

Health Plans Dashboard January 14,2016
18
Summary and Considerations:
Costs have continued to trend upwards with pharmacy as the main driver. This is consistent with industry trends
Both City Plan and Blue Shield have been able to reduce the average length of stay by one day in the last 24 months
Aon Hewitt recommends the HS Board encourage Blue Shield to reduce the ongoing gap with Kaiser Permanente by 10%, specifically to reduce the 7 day gap in the admits/1000
Blue shield could benefit from identifying post discharge services that can be provided to reduce admits and length of stay

Health Plans Dashboard January 14,2016
19
Next Steps:
Risk scores will be generated in the next APCD maintenance cycle allowing for risk adjusted reporting
Truven Marketscan benchmarks will be incorporated into HSS reporting
The next dashboard to be generated will focus on the early retiree population. With the ground work completed for building accurate reports, HSS will be able to provide quarterly integrated dashboards.
Blue Shield retiree historical data will be loaded in the next maintenance cycle.
The process has been initiated to capture Kaiser integrated care management (ICM) and other medical services (OMS) data
APPENDIX

• APCD – All payer claims database
• Fee for Service – Payment is made each time service is rendered
• Formulary Compliance – Adhering to prescription formulary drugs that have been selected and approved for their safety, quality and cost effectiveness
• Generic Dispensing Rate – Measures the number of drugs dispensed as generic divided by the total number of drugs dispensed
• Inpatient – Admittance to a hospital or clinic for treatment that requires at least one overnight stay
• Loss Ratio – The total amount of dollars paid out in claims divided by the amount collected in premiums
• Members – A person enrolled in and eligible for benefits under a health care plan
• Member Share – The portion of health care costs (copayments, deductibles, and coinsurance) for which the member enrolled in a health plan is responsible
Glossary

• Outpatient – Admittance to a hospital or clinic for treatment that does not require an overnight stay. This includes emergency room visits, dialysis, group therapy at the facility setting, lab work, observation room, surgeries, radiology and medical supplies and services
• PMPM – Per member per month
• Professional Procedures – All services not provided in an inpatient setting
• Specialty Drug – High-cost injectable, infused, oral, or inhaled drugs that generally require special storage or handling and close monitoring of the patient’s drug therapy
• Total Paid Claims – Total dollar amount paid for services and costs from health care providers and facilities submitted to the insured for payment
• Utilization – The extent to which an insured group uses a particular health care service in a specified period, typically expressed as the number of services user per year per 100 or per 1000 persons
Glossary