dashboard - cisco€¦ · dashboard...
TRANSCRIPT
Dashboard
The following describes how to use the dashboard to view various agent-related metrics and network metrics.
• Dashboard Overview, page 1
• Main Dashboard, page 1
• Agent Dashboards, page 2
Dashboard OverviewThe Dashboard displays metrics and visualizations for the network traffic the Learning Network Licensesystem detects to help you better understand how traffic moves through your network. At a glance, you canview a stacked bar graph that shows all the anomalies the system detected over the past 30 days. You can alsoselect different agents and view metrics for each.
The system updates the dashboard every 30 minutes. The dashboard displays the last date and time the systemupdated an agent dashboard.
Main DashboardTheMain Dashboard provides an overview of the system, including anomalies detected over the past 30 days,overall system metrics, and controller system information.
TheAnomalies by severity stacked bar graph displays a count of the anomalies that the system detected overthe past 30 days. The x-axis displays the day and the y-axis displays the anomaly count. You can hover yourpointer over the graph to view a tooltip that describes the exact count of anomalies of that severity that thesystem detected on that day. You can also hover your pointer over the legend to highlight all low, medium,or high severity anomalies in the graph.
Each agent dashboard also displays an Anomalies by severity graph, which shows a count of all anomaliesthat agent detected over the past 30 days.
TheGlobalMetrics pane gives an overview of the system. Specifically, it provides a count of the total numberof anomalies detected over the past 30 days, the number of ongoing mitigations, and the total number ofagents.
The System Information pane provides information on the controller version and build date, and the versionof the controller web UI.
Cisco Stealthwatch Learning Network License Configuration Guide, Version 1.1 1
If you restore a controller database using a database backup, the dashboard will not display graphinformation or clusters on the dashboard for a period. Wait for the controller to gather more statistics topopulate the dashboard.
Note
Viewing the Main Dashboard
Select DASHBOARD.
Agent DashboardsEach agent dashboard provides information and graphs to help you better understand the traffic that an agentdetects. The agent dashboard includes:
• an Anomalies by Severity graph for this agent
• an Agent Activity pane that describes the traffic detected by this agent
• the Top ten applications charts, based on flows detected and bytes transmitted
• A network traffic graph that shows over which applications groups hosts transfer traffic
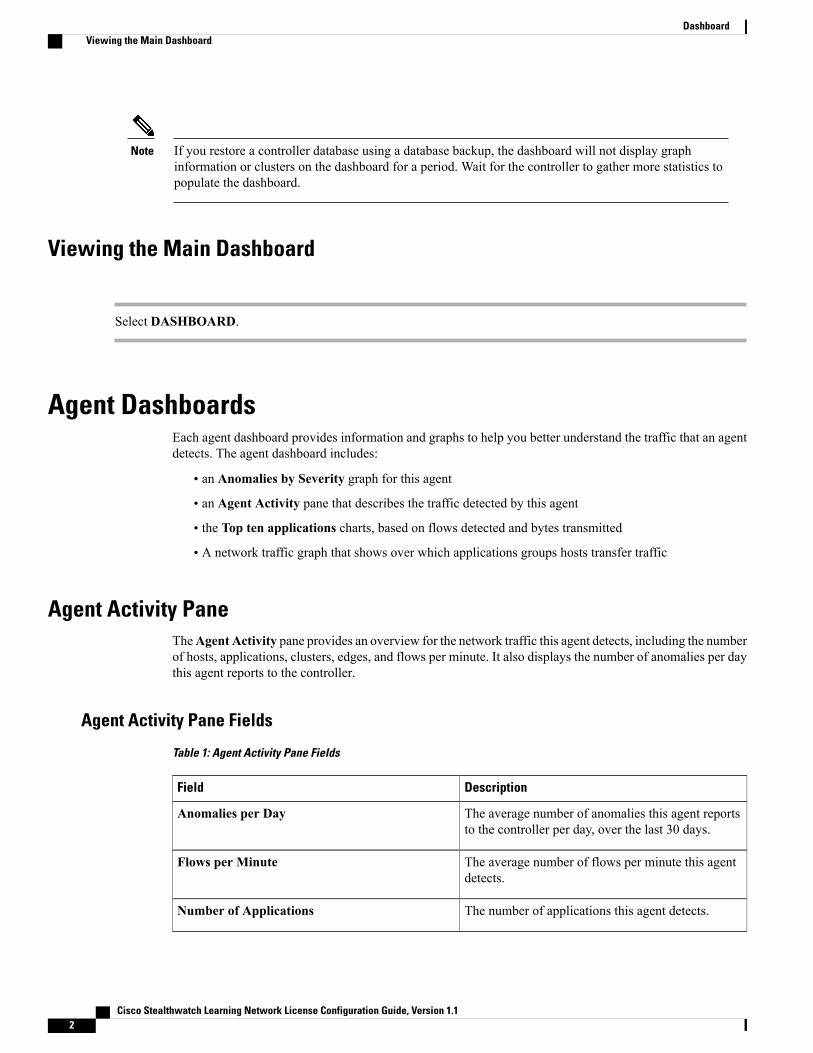
Agent Activity PaneTheAgent Activity pane provides an overview for the network traffic this agent detects, including the numberof hosts, applications, clusters, edges, and flows per minute. It also displays the number of anomalies per daythis agent reports to the controller.
Agent Activity Pane Fields
Table 1: Agent Activity Pane Fields
DescriptionField
The average number of anomalies this agent reportsto the controller per day, over the last 30 days.
Anomalies per Day
The average number of flows per minute this agentdetects.
Flows per Minute
The number of applications this agent detects.Number of Applications
Cisco Stealthwatch Learning Network License Configuration Guide, Version 1.12
DashboardViewing the Main Dashboard
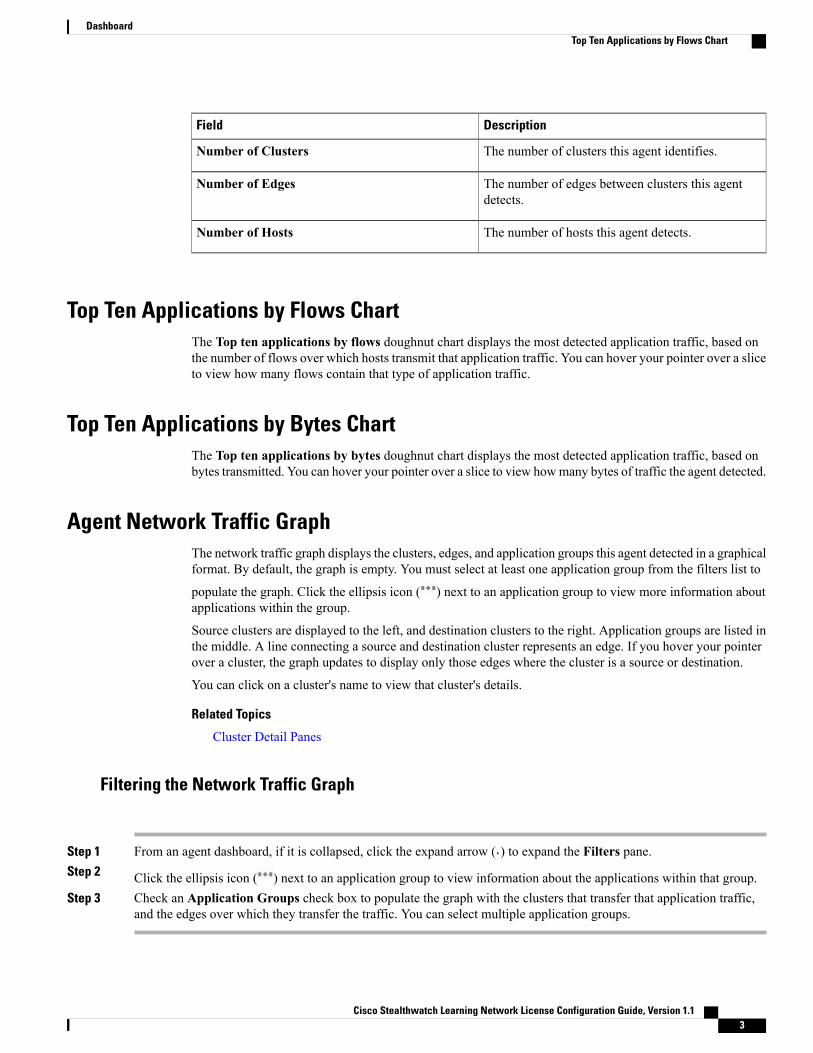
DescriptionField
The number of clusters this agent identifies.Number of Clusters
The number of edges between clusters this agentdetects.
Number of Edges
The number of hosts this agent detects.Number of Hosts
Top Ten Applications by Flows ChartThe Top ten applications by flows doughnut chart displays the most detected application traffic, based onthe number of flows over which hosts transmit that application traffic. You can hover your pointer over a sliceto view how many flows contain that type of application traffic.
Top Ten Applications by Bytes ChartThe Top ten applications by bytes doughnut chart displays the most detected application traffic, based onbytes transmitted. You can hover your pointer over a slice to view howmany bytes of traffic the agent detected.
Agent Network Traffic GraphThe network traffic graph displays the clusters, edges, and application groups this agent detected in a graphicalformat. By default, the graph is empty. You must select at least one application group from the filters list to
populate the graph. Click the ellipsis icon ( ) next to an application group to view more information aboutapplications within the group.
Source clusters are displayed to the left, and destination clusters to the right. Application groups are listed inthe middle. A line connecting a source and destination cluster represents an edge. If you hover your pointerover a cluster, the graph updates to display only those edges where the cluster is a source or destination.
You can click on a cluster's name to view that cluster's details.
Related Topics
Cluster Detail Panes
Filtering the Network Traffic Graph
Step 1 From an agent dashboard, if it is collapsed, click the expand arrow ( ) to expand the Filters pane.Step 2 Click the ellipsis icon ( ) next to an application group to view information about the applications within that group.Step 3 Check an Application Groups check box to populate the graph with the clusters that transfer that application traffic,
and the edges over which they transfer the traffic. You can select multiple application groups.
Cisco Stealthwatch Learning Network License Configuration Guide, Version 1.1 3
DashboardTop Ten Applications by Flows Chart
Viewing an Agent's Dashboard
Step 1 Select DASHBOARD.Step 2 Enter an agent name in the Display Agent specific dashboard text field. As you type, the system displays matching
agent names.Step 3 Click View DLA dashboard.
Cisco Stealthwatch Learning Network License Configuration Guide, Version 1.14
DashboardViewing an Agent's Dashboard