health net, inc. presentation to: deutsche bank alex.brown cora tellez president health net, inc....
TRANSCRIPT

Health Net, Inc.
Presentation to:Deutsche Bank
Alex.Brown
Cora TellezPresident
Health Net, Inc. Health Plans Division
May 9, 2001
2
Health Net, Inc. Health PlansPositioned for Profitable Growth
• Solid Operating Performance in 2000 and Entering 2001
• New Products Introduced in 2000 and More Planned for 2001
• Diligent Focus on Pricing Discipline and Product/Market Profitability
3
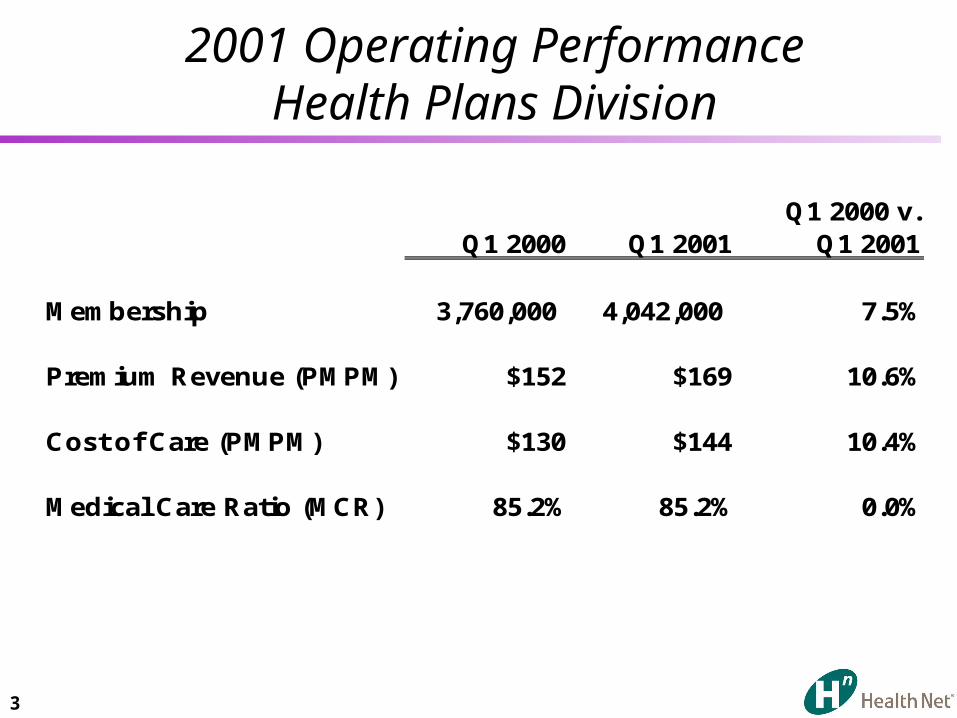
2001 Operating PerformanceHealth Plans Division
Q1 2000 v.Q1 2000 Q1 2001 Q1 2001
Membership 3,760,000 4,042,000 7.5%
Premium Revenue (PMPM) $152 $169 10.6%
Cost of Care (PMPM) $130 $144 10.4%
Medical Care Ratio (MCR) 85.2% 85.2% 0.0%

4
Drivers of Membership Growth
• Diversify the Product Portfolio
• Diversify Market Segments
• Explore Niche Products
• Provide Flexible Benefits Designs to Meet the
Consumer at the Price They Want to Pay
• Expand Choice Access
• Price Ahead of Cost Trends
5
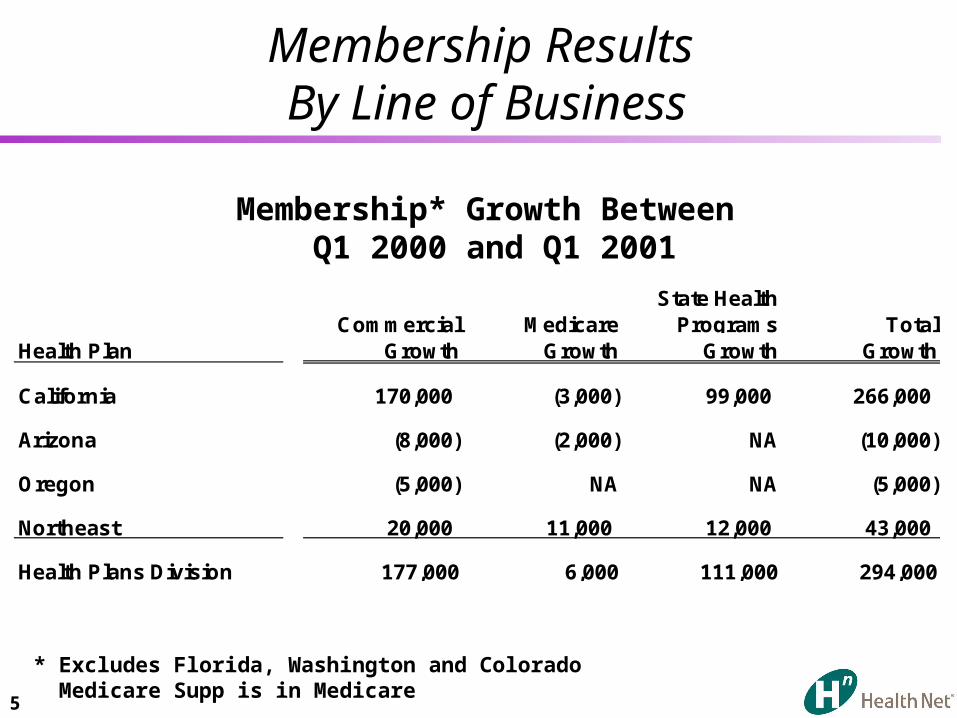
Membership Results By Line of Business
Membership* Growth Between Q1 2000 and Q1 2001
Commercial MedicareState Health
Programs TotalHealth Plan Growth Growth Growth Growth
California 170,000 (3,000) 99,000 266,000
Arizona (8,000) (2,000) NA (10,000)
Oregon (5,000) NA NA (5,000)
Northeast 20,000 11,000 12,000 43,000
Health Plans Division 177,000 6,000 111,000 294,000
* Excludes Florida, Washington and Colorado Medicare Supp is in Medicare

6
Membership ResultsBy Product
Commercial Membership* Growth Between Q1 2000 and Q1 2001
* Excludes Florida, Washington and Colorado Medicare Supp is in Medicare
HMO POS/PPO/ASO Total
Health Plan Growth Growth Growth
California 33,000 137,000 170,000
Arizona (15,000) 7,000 (8,000)
Oregon (14,000) 9,000 (5,000)
Northeast 20,000 3,000 20,000
Health Plans Division 24,000 156,000 177,000
7
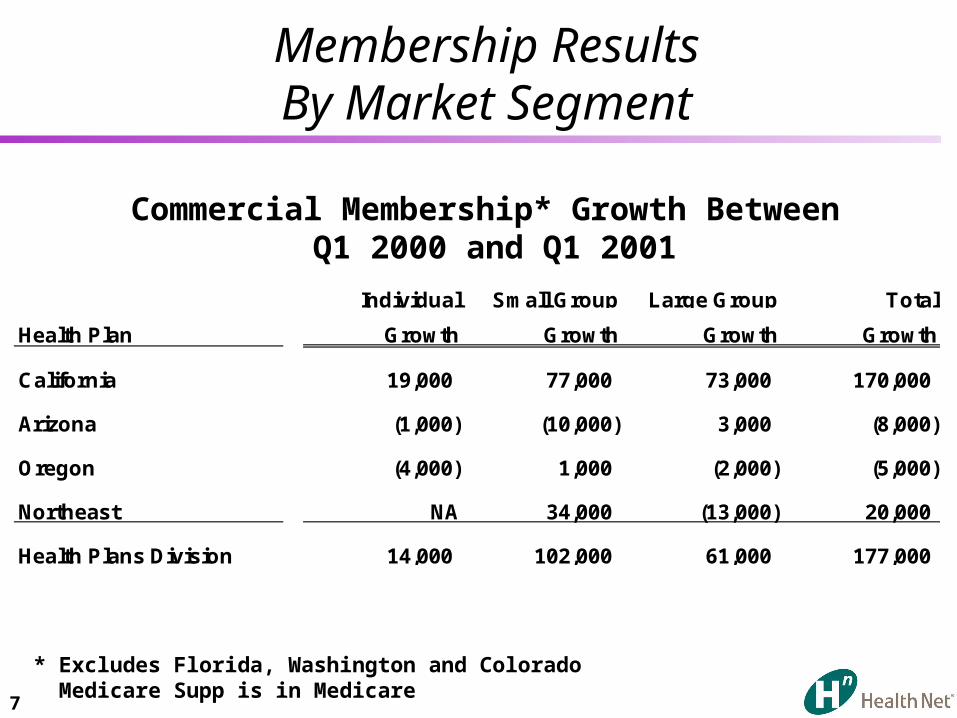
Membership ResultsBy Market Segment
Commercial Membership* Growth Between Q1 2000 and Q1 2001
* Excludes Florida, Washington and Colorado Medicare Supp is in Medicare
Individual Small Group Large Group Total
Health Plan Growth Growth Growth Growth
California 19,000 77,000 73,000 170,000
Arizona (1,000) (10,000) 3,000 (8,000)
Oregon (4,000) 1,000 (2,000) (5,000)
Northeast NA 34,000 (13,000) 20,000
Health Plans Division 14,000 102,000 61,000 177,000

8
Successfully Managing The Shift in Risk
• Pricing That Reflects Medical Cost Trends
• Claims Processing Under Control– Claims Volume Increased 25% from 1999 to
2000 and Projected to Increase 27% in 2001– Successfully Managing Inventory - Days Work
on Hand Consistently Under 5 Days– Increased Staff 25% Over Past 12 Months– Expanded Outsourced Adjudication Capabilities– Implemented Technology Enhancements - EDI,
Auto-Adjudication

9
Successfully Managing The Shift in Risk (Con’t)
• Enhanced Medical Management Capabilities– Adding Staff– Focus on High Risk Physician Groups– Improved Reporting
• Keeping Providers in Risk Arrangements Where Feasible
10
Health Net, Inc. Health PlansPositioned for Profitable Growth
• Solid Operating Performance in 2000 and Entering 2001
• New Products Introduced in 2000 and More Planned for 2001
• Diligent Focus on Pricing Discipline and Product/Market Profitability

11
Product Strategy Will Deliver Diversified Growth
• Product At Every Price Point - Meet the Customer Where They Want To Be
• Diversification– Choice Products– Niche Markets– New Customer Segments– Affinity Marketing
• Benefit Designs That Maintain Affordability
• Profitable Growth– Pricing Ahead of Cost Trends– Medicare Changes

12
Offering More Choice ProductsPPO Strategy - West
• California PPO Projected to Grow to 100,000 Members
• Initial Focus on Individual and Small Group
• Competitive Pricing and Benefit Design
• Strong Alternative to Market Leader
• Product Well Received By Brokers and Consultants

13
Offering More Choice ProductsPPO Strategy - Northeast
• July 1, 2001 Product Effective Date– Over 70 Plan Designs Will Be Introduced
– Product Flexibility Allows For All Combinations of Plan Design
• Focus on Middle Market (50 to 1,500 Lives) Where Margins Are Strong
• Products Will Appeal to Price Sensitive Segment
• National Network Access - Leveraging Provider Relationships of Sister Plans
• Collaborating With West on National Opportunities
14
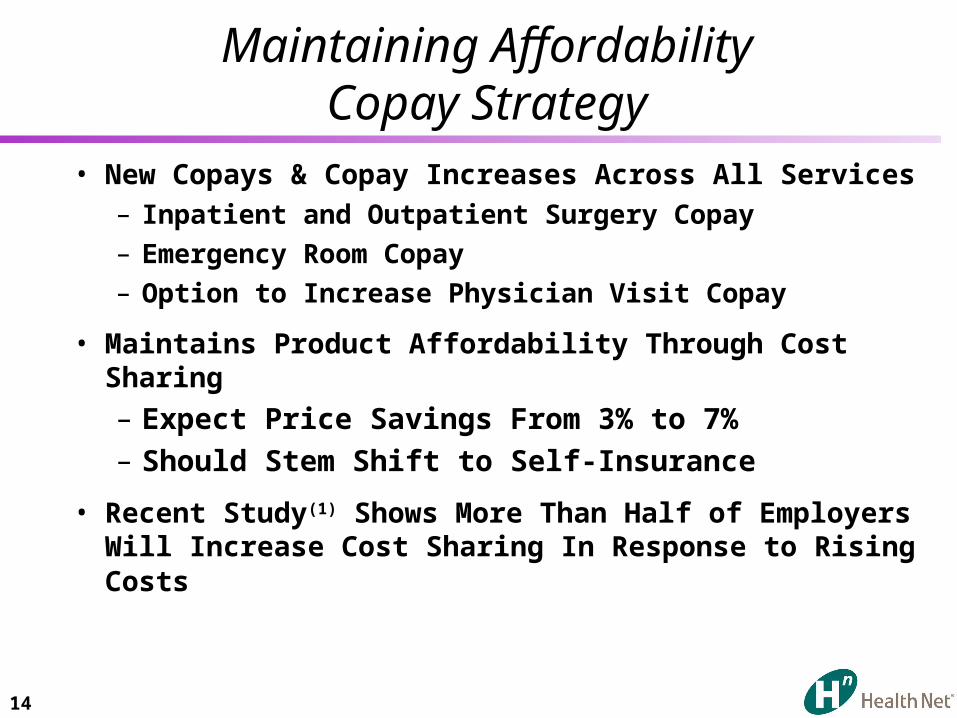
Maintaining AffordabilityCopay Strategy
• New Copays & Copay Increases Across All Services– Inpatient and Outpatient Surgery Copay
– Emergency Room Copay
– Option to Increase Physician Visit Copay
• Maintains Product Affordability Through Cost Sharing
– Expect Price Savings From 3% to 7%– Should Stem Shift to Self-Insurance
• Recent Study(1) Shows More Than Half of Employers Will Increase Cost Sharing In Response to Rising Costs
(1) Watson Wyatt, “Changing Role of Health Benefits,” 2001
15
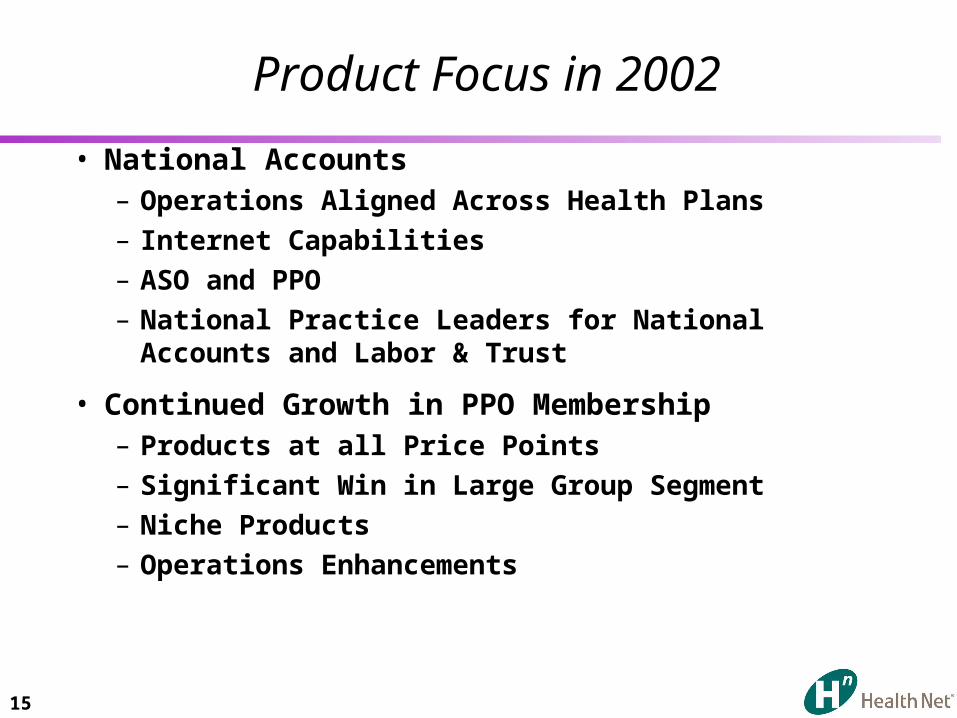
Product Focus in 2002
• National Accounts– Operations Aligned Across Health Plans
– Internet Capabilities
– ASO and PPO
– National Practice Leaders for National Accounts and Labor & Trust
• Continued Growth in PPO Membership– Products at all Price Points
– Significant Win in Large Group Segment
– Niche Products
– Operations Enhancements
16
Health Net, Inc. Health PlansPositioned for Profitable Growth
• Solid Operating Performance in 2000 and Entering 2001
• New Products Introduced in 2000 and More Planned for 2001
• Diligent Focus on Pricing Discipline and Product/Market Profitability
17
CalPERS
• Proposal Accepted - Maintains Key Account for Health Net of California (200,000+ Members)
• CalPERS Increased Copays on All Plans, Shaving $143 Million Off Original HMO Bids
• 13% Rate Increase in Line With Medical Costs
– Benefit Buy-down Reduces Premium Rate Increase to 7.4% With Same Margin Results
– Gave the Least Credit Moving to the Low Option Plan Compared to 3 Largest HMOs

18
CalPERS (Con’t)
• Five County Exit Will Improve Account Profitability - Impacts 21,000 CalPERS Members
• Enrollment Frozen for 2002
• EPO Approach Will Retain Provider Relationships For Our Other Members in the Five County Area