health insurance regulation: varying state requirements
TRANSCRIPT

United States General Accounting Office
GAO Report to the HonorableJames M. Jeffords, U.S. Senate
August 1996 HEALTH INSURANCEREGULATION
Varying StateRequirements AffectCost of Insurance
G OA
years1921 - 1996
GAO/HEHS-96-161


GAO United States
General Accounting Office
Washington, D.C. 20548
Health, Education, and
Human Services Division
B-271084
August 19, 1996
The Honorable James M. JeffordsUnited States Senate
Dear Senator Jeffords:
As concern about the affordability of health coverage has grown, the costsattributed to state regulation of health insurance have been increasinglydebated. State health insurance regulation is intended to protectconsumers by overseeing health plans’ financial solvency, monitoringinsurers’ market conduct to prevent abuses, and requiring coverage forparticular services. Although these state actions benefit consumers, theyalso result in costs that are borne by insurers and often ultimately passedon to consumers in their premiums. These costs may in some cases affectan employer’s decision to offer health coverage through an insurer that issubject to state insurance regulation or to self-fund1 its health plan, whichavoids state insurance regulation.
This report responds to your request that we provide additionalinformation on the costs of state health insurance requirements as afollow-up to our earlier report on the Employee Retirement IncomeSecurity Act of 1974 (ERISA).2 In particular, you requested that we examinethe costs associated with (1) premium taxes and other assessments,(2) mandated health benefits, (3) financial solvency standards, and(4) state health insurance reforms affecting small employers. We examinedthe impact of these requirements on the cost of insured health planscompared with the cost of self-funded health plans. Our earlier report,prepared at your request, more comprehensively describes the advantagesand disadvantages of ERISA preemption.3
To develop this information, we interviewed officials from the NationalAssociation of Insurance Commissioners (NAIC) and state insuranceregulators in Iowa, Maryland, North Carolina, Oregon, and Virginia. We
1Employers that self-fund their health plans bear much of the financial risk for employee health claims.Many of these employers purchase stop-loss insurance to mitigate their potential losses. Health plansunder these arrangements are referred to as self-funded.
2Employer-Based Health Plans: Issues, Trends, and Challenges Posed by ERISA (GAO/HEHS-95-167,July 25, 1995).
3For additional information on the benefits of state insurance regulation, see also Patricia Butler andKarl Polzer, Private-Sector Health Coverage: Variation in Consumer Protections Under ERISA andState Law, George Washington University, National Health Policy Forum (Washington D.C.:June 1996).
GAO/HEHS-96-161 Health Insurance Regulation CostsPage 1
B-271084
also interviewed actuaries, health insurance executives, benefits managersfor self-funded employers, and officials from national trade associationsrepresenting each of these groups. We reviewed documents and used dataprovided by these groups as well as available studies on mandated benefitsand other state regulatory actions. In addition, we updated informationfrom previous GAO reports on state insurance regulation and ERISA.4 Ourreview was conducted between January and June 1996 in accordance withgenerally accepted government auditing standards.
Results in Brief State health insurance regulation imposes requirements on health plansoffered by insurers that employers’ self-funded health plans do not have.Although these requirements benefit consumers, they also add costs toinsured health plans. The extent to which these requirements increaseinsured health plans’ costs compared with self-funded health plans’ costsvaries by state. The cost impact depends on the nature and scope of eachstate’s regulations and on health plans’ typical operating practices.
State premium taxes and other assessments are the most direct and easilyquantifiable cost that insured health plans face. Premium taxes increasecosts to commercial health insurers by about 2 percent in most states.Other assessments not only tend to be smaller than the premium tax butcan often be deducted from premium taxes. These include assessments forguaranty funds that pay the claims of insolvent plans and high-risk poolsthat provide coverage for individuals unable to get private coveragebecause of preexisting conditions.
Most states mandate that insurance policies cover certain benefits andtypes of providers, such as mammography screening, mental healthservices, and chiropractic services, which raises claims costs to the extentthat such benefits would not otherwise have been covered. The cost effectvaries due to differences in state laws and employer practices. Forexample, Virginia’s mandated benefits accounted for about 12 percent ofclaims costs, according to a recent study. Earlier studies estimated thatmandated benefits represented 22 percent of claims in Maryland and5 percent in Iowa. In general, such cost estimates are higher in states withmore mandated benefits and in states that mandate more costly benefits,such as mental health services and substance abuse treatment. These costestimates represent the potential costs of mandated benefits to a healthplan that does not voluntarily offer these benefits. Because most
4See Health Insurance Regulation: Wide Variation in States’ Authority, Oversight, and Resources(GAO/HRD-94-26, Dec. 27, 1993) and GAO/HEHS-95-167, July 25, 1995.
GAO/HEHS-96-161 Health Insurance Regulation CostsPage 2

B-271084
self-funded plans offer many of the mandated benefits, their additionalclaims cost—were they required to comply—would not be as high as thestudies’ estimates. If required to comply with state mandates, however,self-funded plans would lose flexibility in choosing what benefits to offerand in offering a single, uniform health plan across states.
State financial solvency standards have limited potential effect on costsbecause many insurers exceed the state minimum requirements andtypically perform tasks like those associated with the state financialreporting requirements. Most insurers maintain higher levels of capital andsurplus than the minimum state requirements, indicating that the effect ofthe capital and surplus requirements on health insurance costs is generallyminimal. Although states require financial information and actuarialreports that in some cases differ from the insurers’ general businesspractices, insurance executives indicated that the added administrativecost of preparing these documents was marginal and that the additionalinformation was also valuable to the insurer.
The cost implications of small employer health insurance reforms, such aslimits on preexisting condition exclusions recently adopted in many states,remain unclear. The cost information to date is mostly anecdotal andprovides an incomplete view of these reforms’ effects. Moreover, the rapidchanges in health care markets, such as the continued growth andevolution of managed care, make it difficult to isolate the independenteffect of the reforms.
Background Every state regulates the terms and conditions of insurance sold in thestate and nearly all tax insurers. States require health insurance policiessold there to include specific benefits, such as mental health services,mammography screening, chiropractic services, and coverage fornewborns. States use a variety of methods to monitor health insurers’solvency, including minimum capital and surplus levels, investmentrestrictions, and financial reviews. In addition, many states have enactedreforms to improve access and affordability of health insurance for smallemployers. Prominent examples of these reforms are guaranteed issuanceand renewal, portability, and premium rate restrictions. These reforms areintended to address concerns about certain individuals being excludedfrom coverage or priced out of the market. These individuals include thosewho change jobs or experience costly medical conditions while in thesmall employers’ insurance market.
GAO/HEHS-96-161 Health Insurance Regulation CostsPage 3

B-271084
Although states regulate health insurance, state regulation does notdirectly affect 4 of 10 people with private employer-based health coverage.ERISA5 preempts states from directly regulating employer provision ofhealth plans, but it permits states to regulate health insurers. Of the114 million Americans with health coverage offered through a privateemployer in 1993, about 60 percent participated in insured health plansthat are subject to state insurance regulation. However, for plans coveringthe remaining 40 percent—about 44 million people in 1993—the employerchose to self-fund and retain at least some financial risk for its health plan.
Self-funding is most common among large employers. Only 11 percent ofemployees in firms of 100 or fewer employees were in self-funded healthplans compared with 34 percent of those in firms of 101 to 500 employeesand 63 percent of those in firms of more than 500 employees, according toa 1993 Robert Wood Johnson Foundation survey.6 As stop-loss coveragewith less risk to the employer becomes available, however, more smallemployers may start to self-fund. The NAIC has adopted a stop-loss modelact that attempts to define the levels of risk that can be assumed bystop-loss carriers for determining which state insurance laws shouldapply. State insurance regulators are concerned that some employers maypurchase stop-loss coverage in which the stop-loss carrier assumes mostof the risk and believe, therefore, that the plan should be subject to statehealth insurance laws.7
Because self-funded health plans may not be deemed to be insurance,ERISA preempts them from state insurance regulation and premiumtaxation. Although ERISA includes fiduciary8 standards to protect employeebenefit plan participants and beneficiaries from plan mismanagement andother requirements, in other areas no federal requirements comparablewith state requirements for health insurers exist for self-funded health
5ERISA is the federal law that covers employer-based pension and welfare benefit plans, includinghealth plans. P.L. 93-406, 88 Stat. 829 (classified as amended at 29 U.S.C. 1001 et seq. (1994)).
6The Robert Wood Johnson Foundation Employer Health Insurance Survey was conducted in 10states. See Gregory Acs and others, “Self-Insured Employer Health Plans: Prevalence, Profile,Provisions, and Premiums,” Health Affairs, Vol. 15, No. 2 (1996), pp. 266-78.
7Maryland and Missouri promulgated regulations similar to the NAIC stop-loss model act, but bothregulations were found by federal courts earlier this year to be preempted by ERISA. AmericanMedical Security, Inc. v. Bartlet, 915 F. Supp. 740 (D. Md. 1996) and Associated Industries of Missouriv. Angloff (unreported). Maryland is planning an appeal. Missouri argued its appeal on July 3, 1996, andis awaiting the court’s decision.
8ERISA defines a fiduciary as anyone who exercises discretionary control or authority over themanagement of a plan or renders investment advice to a plan.
GAO/HEHS-96-161 Health Insurance Regulation CostsPage 4

B-271084
plans. Table 1 compares the requirements that fully insured andself-funded health plans must meet.
Table 1: Comparison of State and Federal Provisions Affecting Fully Insured and Self-Funded Health PlansState insurance regulations affectingfully insured health plans
ERISA provisions affecting self-fundedhealth plans a
Market conduct requirements
Plan benefit coverage and description States review and approve insurancepolicies to ensure they are not vague ormisleading and they meet staterequirements, such as mandatory benefitprovisions.
Disclosure requirements to providesummary plan description to participantsand the Department of Labor.
No requirements to provide specificbenefits. However, group health planscovering more than 20 employees mustoffer coverage (at the employees’ expense)for 18 to 36 months following termination ofemployment and other qualifying events.
Small group reforms Most states require insurers selling to smallemployers to accept and renew employeeswho want health insurance coverage,establish short waiting periods forpreexisting conditions, and requireportability of coverage when an individualchanges jobs or insurers.b
No comparable requirements. States arepreempted from applying small groupreforms to self-funded health plans.
Consumer protections and complaints States monitor insurers’ actions to ensurethey are not engaging in unfair businesspractices or otherwise taking advantage ofconsumers and assist consumers byinvestigating their complaints, answeringquestions, and conducting educationalprograms.
Plan must reconsider denied claims atparticipants’ request. Federal courts, notstate courts, have jurisdiction over litigationof denied claims.
States have no authority to pursueconsumer complaints about self-fundedplans. Department of Labor hasresponsibility for complaints aboutself-funded health plans.
Financial requirements
Licensing States license insurance companies andthe agents who sell insurance to ensurethat companies are financially sound andreputable and that agents are qualified.
No comparable requirements.
Financial solvency States set standards for and monitorfinancial operations of insurers to determinewhether they have adequate reserves topay policyholders’ claims. States restricthow insurers invest their funds.
No solvency requirements but fiduciaryduty to act in a prudent manner solely in theinterests of plan participants andbeneficiaries.
(continued)
GAO/HEHS-96-161 Health Insurance Regulation CostsPage 5

B-271084
State insurance regulations affectingfully insured health plans
ERISA provisions affecting self-fundedhealth plans a
Rate reviews States review and approve rates or requireactuarial certification to ensure that ratesare reasonable for consumers andsufficient to maintain the solvency ofinsurance companies.
No comparable requirements.
Some states regulate insurer ratingpractices in the small group market todetermine the factors insurers may use insetting premiums.b
No comparable requirements.
Tax requirements
Premium taxes Nearly all states assess premium taxes oninsurers.
States are preempted from assessingpremium taxes on self-funded health plans.
Guaranty funds States assess insurers to finance guarantyfunds that provide financial protections toenrollees who have outstanding medicalclaims in case of insurer insolvency.
States are preempted from requiringself-funded health plans to participate inguaranty funds.
High-risk pools Some states assess insurers to financelosses in high-risk pools that provide healthcoverage for individuals who otherwise hadbeen denied coverage because of amedical condition.
States are preempted from requiringself-funded health plans to participate inhigh-risk pools.
aERISA requirements apply to all private employer and union health plans, including fully insuredand self-funded health plans. See GAO/HEHS-95-167, July 25, 1995. Although states arepreempted from regulating self-funded health plans directly, some states regulate third partiesthat provide administrative services for self-funded health plans and stop-loss insurance carriersthat reimburse self-funded health plans for claims that exceed a predetermined threshold.
bFor a list of states that have enacted these reforms, see Health Insurance Regulation: Variation inRecent State Small Employer Health Insurance Reforms (GAO/HEHS-95-161FS, June 12, 1995).
State Taxes TypicallyIncrease InsuredHealth Plans’ Costs
One of the most direct and quantifiable costs that insured health plansincur compared with self-funded health plans results from state premiumtaxes and other assessments paid by health insurers. Most of the costsassociated with taxes result from premium taxes that increase costs toinsured health plans by about 2 percent in most states. In addition, statesalso assess insurers for other purposes, but these assessments aregenerally small and, in many states, the insurer may receive a credit fromits premium taxes for these payments.
Most states tax health insurance premiums. State revenues from premiumtaxes on all types of insurance, including property, casualty, life, andhealth insurance, totaled over $8 billion in 1993. Premium taxes forcommercial health insurers range from 0 to over 4 percent; most states
GAO/HEHS-96-161 Health Insurance Regulation CostsPage 6

B-271084
have premium tax rates of about 2 percent. Many states exempt or havelower rates for Blue Cross and Blue Shield plans as well as healthmaintenance organizations (HMO). In some states insurers receive creditsthat lower their premium tax rates, such as credits for insurers who areheadquartered locally or invest in state securities. In addition, the expenseof state taxes can be deducted from insurers’ federal taxes, reducing theirnet cost. See appendix I for a list of premium tax rates by state and type ofinsurance.
Health insurers may also be liable for paying other miscellaneousassessments collected by the states, including assessments for guarantyfunds and high-risk pools. Guaranty funds provide financial protections toenrollees who have outstanding medical claims in the case of an insurerinsolvency. In years that monies are drawn from the guaranty funds due toan insurance failure, states assess insurers a fee on the basis of theirmarket share within the state to pay for the guaranty fund expenses. Statescap the maximum rate insurers may be assessed in a year, typically atabout 2 percent of gross premiums. Except in a few states where arelatively large insurer has failed, however, actual assessments are muchlower than the maximum rate. In 1993, actual assessments against life andhealth insurers for guaranty funds averaged 0.34 percent, and guarantyfund assessments exceeded 1 percent of premiums in only seven states.Most states allow insurers to deduct some or all of the guaranty fundassessment from their premium taxes. Appendix II shows stateassessments for guaranty funds and deductions from premium taxes.
About half of the states maintain high-risk pools to provide healthcoverage for individuals denied health coverage because of a medicalcondition. In 1994, about 100,000 Americans were covered by high-riskpools.9 Although participants in these plans pay a premium for theircoverage, the costs of the high-risk pools exceed the premiums collected.To compensate for the difference in premiums collected and claims paid,20 states have the authority to assess insurers who participate in thehigh-risk pool.10 In 1994, 15 states actually assessed insurers to coverhigh-risk pool losses. Minnesota, with the largest high-risk pool in thenation, assessed insurers 1.7 percent of their premiums in 1995 to coverhigh-risk pool losses. Most states with assessments (although not
9See Communicating for Agriculture, Inc., Comprehensive Health Insurance for High-risk Individuals:A State-by-State Analysis, Ninth Edition (Bloomington, Minn.: 1995) for information on high-risk pools,their financing, and enrollment.
10States also use general revenues or taxes from other sources to fund the additional costs of high-riskpools.
GAO/HEHS-96-161 Health Insurance Regulation CostsPage 7
B-271084
Minnesota) allow insurers to offset at least some of the expense of thehigh-risk pool assessments from their premium taxes. Appendix III showsstate assessments for high-risk pools.
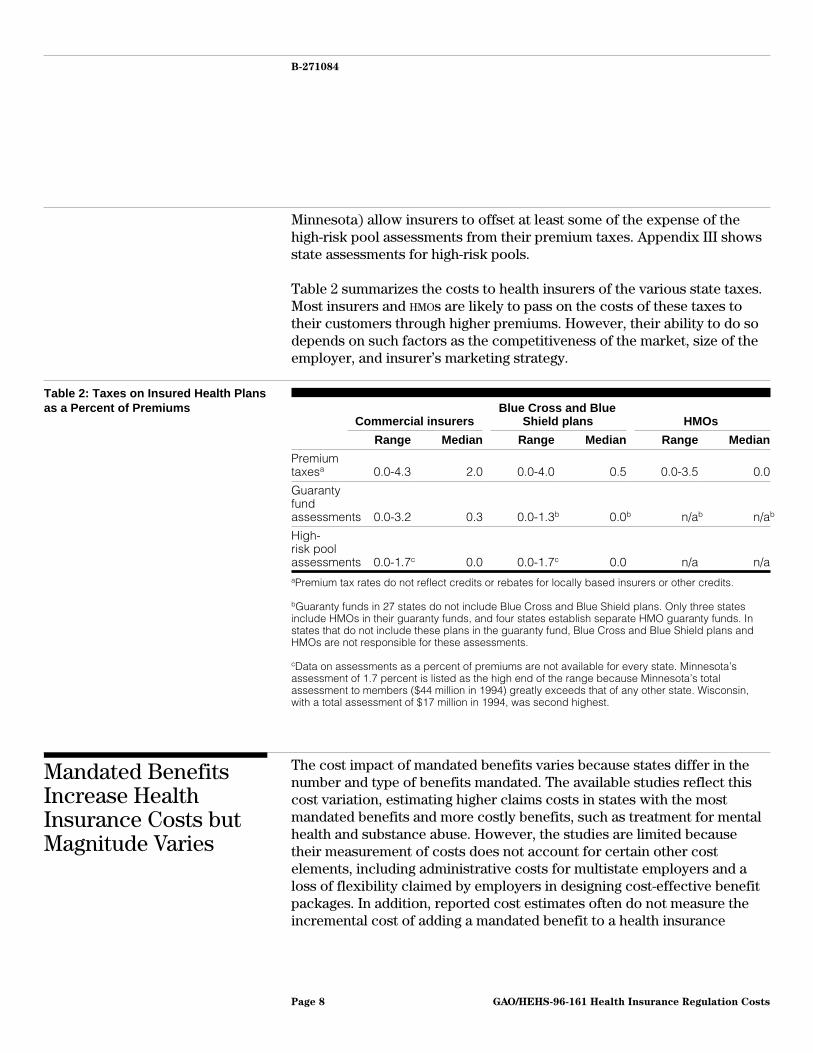
Table 2 summarizes the costs to health insurers of the various state taxes.Most insurers and HMOs are likely to pass on the costs of these taxes totheir customers through higher premiums. However, their ability to do sodepends on such factors as the competitiveness of the market, size of theemployer, and insurer’s marketing strategy.
Table 2: Taxes on Insured Health Plansas a Percent of Premiums
Commercial insurersBlue Cross and Blue
Shield plans HMOs
Range Median Range Median Range Median
Premiumtaxesa 0.0-4.3 2.0 0.0-4.0 0.5 0.0-3.5 0.0
Guarantyfundassessments 0.0-3.2 0.3 0.0-1.3b 0.0b n/ab n/ab
High-risk poolassessments 0.0-1.7c 0.0 0.0-1.7c 0.0 n/a n/aaPremium tax rates do not reflect credits or rebates for locally based insurers or other credits.
bGuaranty funds in 27 states do not include Blue Cross and Blue Shield plans. Only three statesinclude HMOs in their guaranty funds, and four states establish separate HMO guaranty funds. Instates that do not include these plans in the guaranty fund, Blue Cross and Blue Shield plans andHMOs are not responsible for these assessments.
cData on assessments as a percent of premiums are not available for every state. Minnesota’sassessment of 1.7 percent is listed as the high end of the range because Minnesota’s totalassessment to members ($44 million in 1994) greatly exceeds that of any other state. Wisconsin,with a total assessment of $17 million in 1994, was second highest.
Mandated BenefitsIncrease HealthInsurance Costs butMagnitude Varies
The cost impact of mandated benefits varies because states differ in thenumber and type of benefits mandated. The available studies reflect thiscost variation, estimating higher claims costs in states with the mostmandated benefits and more costly benefits, such as treatment for mentalhealth and substance abuse. However, the studies are limited becausetheir measurement of costs does not account for certain other costelements, including administrative costs for multistate employers and aloss of flexibility claimed by employers in designing cost-effective benefitpackages. In addition, reported cost estimates often do not measure theincremental cost of adding a mandated benefit to a health insurance
GAO/HEHS-96-161 Health Insurance Regulation CostsPage 8
B-271084
package; instead, the estimates represent the fraction of total healthinsurance claims that are paid for each of the mandated benefits.Furthermore, claims costs may exaggerate the differences in costsbetween insured and self-funded health plans because many commonlymandated benefits are often covered by employers who self-fund eventhough they are not subject to state regulation.
Number and Type ofMandated BenefitsAdopted by States Vary
On average, states have enacted laws mandating about 18 specific benefits.As shown in figure 1, 16 states have over 20 mandated benefits; 8 stateshave 10 or fewer mandates. Maryland (39), Minnesota (34), and California(33) have the most mandated benefits. In contrast, Idaho has only sixmandated benefits; Alabama, Delaware, Vermont, and Wyoming each haveeight mandated benefits.11
11The number of mandated benefits includes requirements that insurers provide or continue coveragefor specific populations, such as dependent students, as a mandated benefit. Thus, the number ofmandated benefits per state includes these requirements as well as treatment- and provider-relatedmandated benefits. See Blue Cross and Blue Shield Association, State Legislative Health Care andInsurance Issues: 1995 Survey of Plans (Washington, D.C.: Blue Cross and Blue Shield Association,1995) for a list of mandated benefits for each state.
GAO/HEHS-96-161 Health Insurance Regulation CostsPage 9

B-271084
Figure 1: Mandated Benefits by State
10 or Fewer
11 to 20
More Than 20
Source: Blue Cross and Blue Shield Association.
GAO/HEHS-96-161 Health Insurance Regulation CostsPage 10

B-271084
States most frequently mandate coverage for preventive treatments, suchas mammograms and well child care, or for treatment of mental illness oralcohol and drug abuse. In addition, states often require coverage for sometypes of providers such as optometrists and chiropractors. States typicallymandate that insurers cover specific benefits in all plans sold, but somestates merely mandate that each insurer make the mandated serviceavailable in at least one plan that it offers. Appendix IV shows how manystates have enacted each of 20 commonly mandated benefits.
In addition, many states have recently begun considering mandating thathealth insurance cover minimum postpartum hospital stays. For example,a state may require the insurer to cover 48 hours of hospitalizationfollowing a vaginal delivery or 96 hours following a caesarian delivery ifrecommended by the doctor, although in some states shorter stays may beallowed if they are accompanied by a home visit by a nurse or othermedical professional. According to the American College of Obstetriciansand Gynecologists, as of July 28, 1996, 28 states have enacted lawsrequiring coverage for postpartum care.
Estimates of the Costs ofMandated Benefits Vary byState
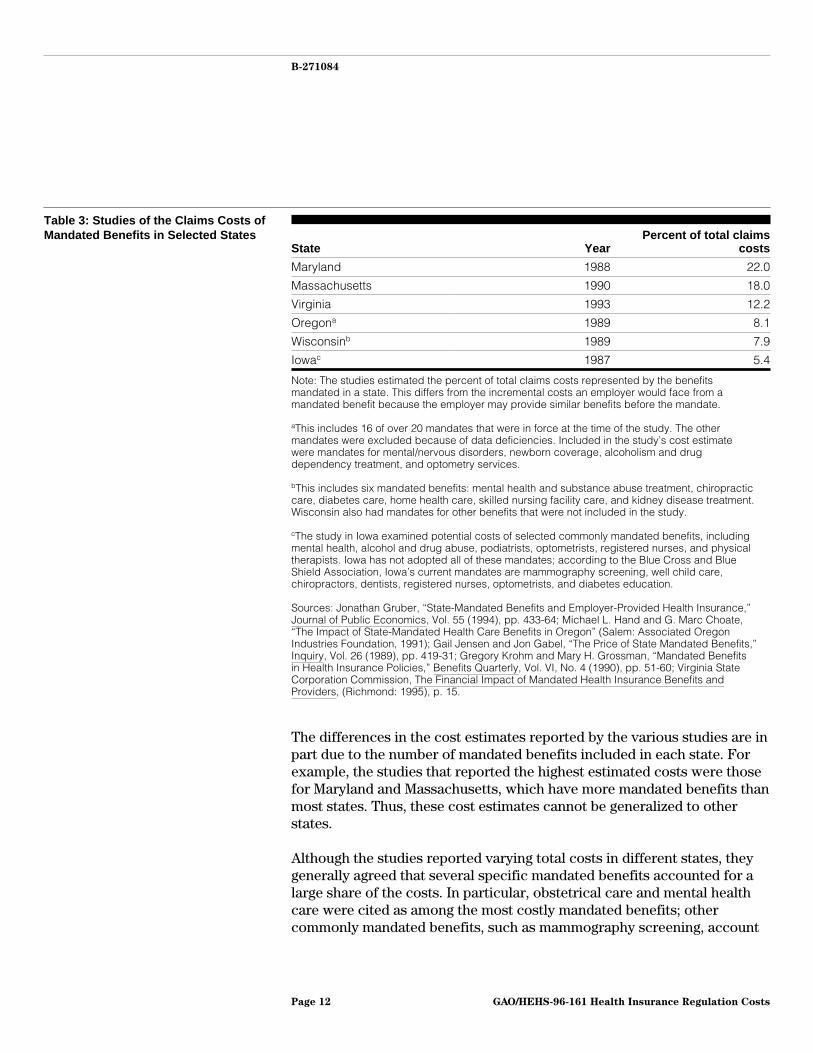
Studies conducted in several states between 1987 and 1993 providevarying estimates of the claims costs associated with mandated benefits.(See table 3.) The Virginia State Corporation Commission, for example,has required insurers to report cost and utilization information annuallyfor each of the mandated benefits in the state. Overall, the commission’sreport, the most recent of these studies, estimated that Virginia’smandated benefits accounted for about 12 percent of group healthinsurance claims in 1993. An earlier study in Maryland, the state with themost mandated benefits, estimated that mandated benefits represented22 percent of average claims costs in 1988. In Iowa, a state representingthe other extreme, a 1987 study estimated that the potential costs ofintroducing several commonly mandated benefits would be about5 percent of claims costs.
GAO/HEHS-96-161 Health Insurance Regulation CostsPage 11
B-271084
Table 3: Studies of the Claims Costs ofMandated Benefits in Selected States
State YearPercent of total claims
costs
Maryland 1988 22.0
Massachusetts 1990 18.0
Virginia 1993 12.2
Oregona 1989 8.1
Wisconsinb 1989 7.9
Iowac 1987 5.4
Note: The studies estimated the percent of total claims costs represented by the benefitsmandated in a state. This differs from the incremental costs an employer would face from amandated benefit because the employer may provide similar benefits before the mandate.
aThis includes 16 of over 20 mandates that were in force at the time of the study. The othermandates were excluded because of data deficiencies. Included in the study’s cost estimatewere mandates for mental/nervous disorders, newborn coverage, alcoholism and drugdependency treatment, and optometry services.
bThis includes six mandated benefits: mental health and substance abuse treatment, chiropracticcare, diabetes care, home health care, skilled nursing facility care, and kidney disease treatment.Wisconsin also had mandates for other benefits that were not included in the study.
cThe study in Iowa examined potential costs of selected commonly mandated benefits, includingmental health, alcohol and drug abuse, podiatrists, optometrists, registered nurses, and physicaltherapists. Iowa has not adopted all of these mandates; according to the Blue Cross and BlueShield Association, Iowa’s current mandates are mammography screening, well child care,chiropractors, dentists, registered nurses, optometrists, and diabetes education.
Sources: Jonathan Gruber, “State-Mandated Benefits and Employer-Provided Health Insurance,”Journal of Public Economics, Vol. 55 (1994), pp. 433-64; Michael L. Hand and G. Marc Choate,“The Impact of State-Mandated Health Care Benefits in Oregon” (Salem: Associated OregonIndustries Foundation, 1991); Gail Jensen and Jon Gabel, “The Price of State Mandated Benefits,”Inquiry, Vol. 26 (1989), pp. 419-31; Gregory Krohm and Mary H. Grossman, “Mandated Benefitsin Health Insurance Policies,” Benefits Quarterly, Vol. VI, No. 4 (1990), pp. 51-60; Virginia StateCorporation Commission, The Financial Impact of Mandated Health Insurance Benefits andProviders, (Richmond: 1995), p. 15.
The differences in the cost estimates reported by the various studies are inpart due to the number of mandated benefits included in each state. Forexample, the studies that reported the highest estimated costs were thosefor Maryland and Massachusetts, which have more mandated benefits thanmost states. Thus, these cost estimates cannot be generalized to otherstates.
Although the studies reported varying total costs in different states, theygenerally agreed that several specific mandated benefits accounted for alarge share of the costs. In particular, obstetrical care and mental healthcare were cited as among the most costly mandated benefits; othercommonly mandated benefits, such as mammography screening, account
GAO/HEHS-96-161 Health Insurance Regulation CostsPage 12
B-271084
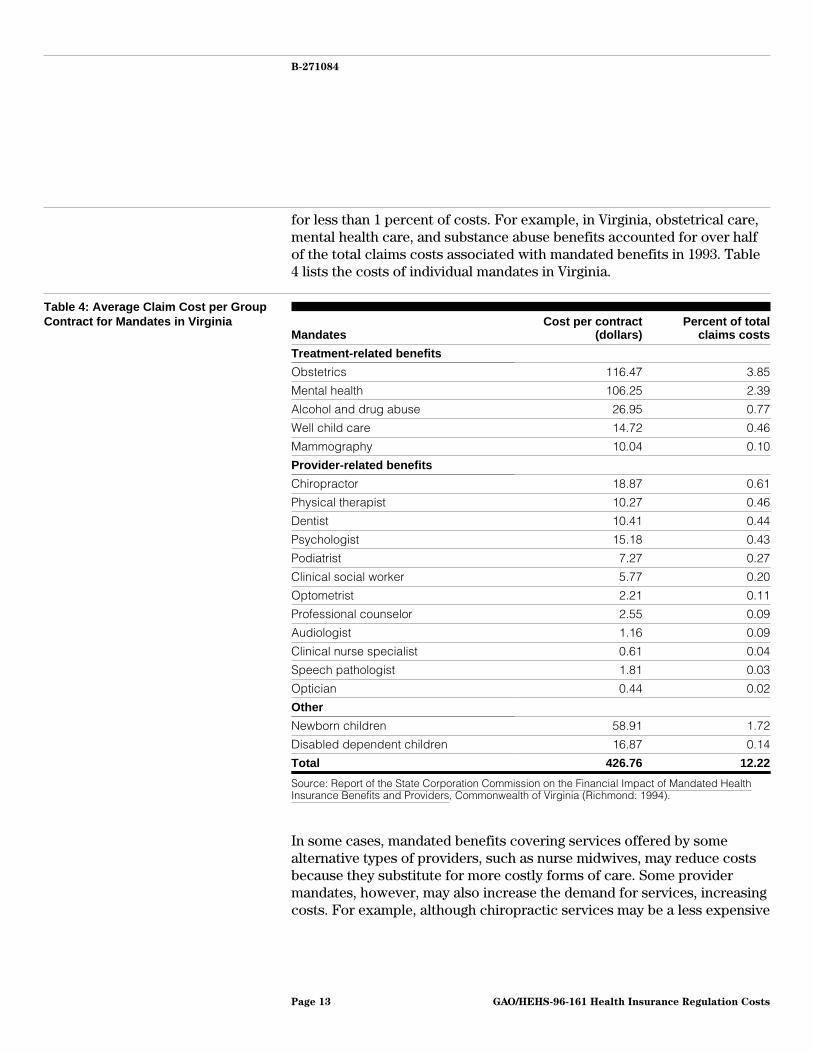
for less than 1 percent of costs. For example, in Virginia, obstetrical care,mental health care, and substance abuse benefits accounted for over halfof the total claims costs associated with mandated benefits in 1993. Table4 lists the costs of individual mandates in Virginia.
Table 4: Average Claim Cost per GroupContract for Mandates in Virginia
MandatesCost per contract
(dollars)Percent of total
claims costs
Treatment-related benefits
Obstetrics 116.47 3.85
Mental health 106.25 2.39
Alcohol and drug abuse 26.95 0.77
Well child care 14.72 0.46
Mammography 10.04 0.10
Provider-related benefits
Chiropractor 18.87 0.61
Physical therapist 10.27 0.46
Dentist 10.41 0.44
Psychologist 15.18 0.43
Podiatrist 7.27 0.27
Clinical social worker 5.77 0.20
Optometrist 2.21 0.11
Professional counselor 2.55 0.09
Audiologist 1.16 0.09
Clinical nurse specialist 0.61 0.04
Speech pathologist 1.81 0.03
Optician 0.44 0.02
Other
Newborn children 58.91 1.72
Disabled dependent children 16.87 0.14
Total 426.76 12.22
Source: Report of the State Corporation Commission on the Financial Impact of Mandated HealthInsurance Benefits and Providers, Commonwealth of Virginia (Richmond: 1994).
In some cases, mandated benefits covering services offered by somealternative types of providers, such as nurse midwives, may reduce costsbecause they substitute for more costly forms of care. Some providermandates, however, may also increase the demand for services, increasingcosts. For example, although chiropractic services may be a less expensive
GAO/HEHS-96-161 Health Insurance Regulation CostsPage 13

B-271084
alternative for some treatments, mandating their coverage may also lead toincreased use.
One limitation of most studies on mandated benefits is that they haveexamined the cost effect of mandated benefits using the fraction of thetotal health insurance claims costs paid for each benefit, instead ofestimating the incremental cost of adding a benefit to the health insurancepackage. In addition, the reported cost estimates do not necessarilycapture the actual effect on employers’ costs, especially in cases in whichall costs associated with a mandate do not occur at the same point in time.For example, one actuary estimated that including in vitro fertilizationservices in health plans would increase premiums by less than 1 percent.In the case of one self-funded employer, however, the total costs to theemployer of in vitro fertilization would be greater than the initial cost ofthe service because multiple attempts are often required and its use maylead to costly, high-risk pregnancies or multiple childbirths.
Moreover, multistate employers note that the variation in state-mandatedbenefits results in additional administrative cost that is not reflected in thestudies’ estimates. Employers that purchase health insurance may need tomodify their plans to meet differences in state-mandated benefits.Furthermore, employers are concerned that, to the extent that they mustcomply with mandated benefits, they lose the flexibility to design the mostcost-effective health benefit plan to meet their employees’ needs.
Employers and managed health care plans have also expressed concernabout the potentially high costs associated with any-willing-provider laws.The actual cost impact of these laws, however, as they have been enactedby states is likely to be limited. Any-willing-provider laws require managedhealth care plans to accept any qualified provider who wants to participateand is willing to accept the plans’ contract terms. The few available studieshave examined only hypothetical results of broad any-willing-providerlaws and provide no definitive measure of actual costs of the laws thathave been implemented.12 The actual costs of enacted laws would be morelimited than the studies’ estimates because most states have passedversions with narrow scopes. The American Association of Health Plans(AAHP) reported that, as of April 1996, 19 of the 24 states withany-willing-provider laws limit them to particular providers, such aspharmacists, or particular types of managed care plans. Furthermore,
12For example, one study found that any-willing-provider laws could increase premiums for HMOs by 9to 28 percent. See Atkinson and Company, The Cost Impact of “Any Willing Provider” Legislation(1994). Some of this study’s assumptions have been criticized, including the effects ofany-willing-provider laws on provider participation rates and negotiated discounts.
GAO/HEHS-96-161 Health Insurance Regulation CostsPage 14

B-271084
any-willing-provider laws have been enacted mostly in states withrelatively low managed care penetration. AAHP reported that 24 percent ofHMO enrollees are in states with limited any-willing-provider requirements,and less than 2 percent are in states with broad any-willing-provider laws.
Self-Funded Health PlansOften Cover BenefitsCommonly Mandated byStates
The actual cost effect of mandated benefits to employers also depends onwhether the employer offers a comprehensive or limited health plan,which in turn often depends on the size of the employer. Employersfrequently offer many of the commonly mandated benefits, evenemployers who self-fund and are not subject to the state mandates. Ingeneral, large employers are more likely to self-fund their health plans andtend to offer more comprehensive benefits than small employers. Forsmall employers, who typically purchase fully insured health plans and areless likely to offer any health coverage, mandates may impose claims costsfor benefits that they otherwise might not have covered. Studies conflictabout whether increased costs associated with mandated benefits leadsmall employers to drop health insurance coverage.13
Self-funded health plans typically offer many of the benefits commonlymandated by states for fully insured health plans, according to studies.This may be due in part to the labor market, where firms must offercompetitive health plans to compete for labor. As shown in figure 2, aKPMG Peat Marwick survey of employer benefits among all firm sizesindicates that self-funded health plans are more likely to offer well childcare, outpatient alcohol treatment, outpatient drug treatment, mentalhealth benefits, and chiropractic care than fully insured health plans. Thissurvey also reported similar patterns for other benefits that are nottypically mandated, including prescription drugs, adult physicals, anddental benefits.14 Similarly, a survey of Wisconsin insurers also found that“self-funded health plans provide at least as many of the mandatedbenefits as insured health plans and in some cases provide more generous
13Studies differ on the proposition that mandated benefits force small businesses to drop coverage. SeeGruber, pp. 433-64. This study contradicts findings from an earlier study that had concluded that smallfirms are likely to forgo insurance coverage as a result of continued growth in mandated benefits. SeeGail Jensen and Jon Gabel, “State Mandated Benefits and the Small Firm’s Decision to OfferInsurance,” Journal of Regulatory Economics, Vol. 4 (1992) pp. 379-404.
14The data in figure 2 represent percentage of covered workers in conventional health plans. KPMGPeat Marwick reports similar findings for workers in preferred provider organizations andpoint-of-service plans that are either self-funded or fully insured. KPMG Peat Marwick is examining towhat extent these differences in rates of benefit coverage among self-funded and fully insured healthplans can be explained by differences in firm size and premium levels.
GAO/HEHS-96-161 Health Insurance Regulation CostsPage 15

B-271084
coverage.”15 This result may partially be due to the tendency of largeemployers to both self-fund and offer more comprehensive benefits.
Figure 2: Comparison of SelectedBenefits Offered by Fully Insured andSelf-Funded Health Plans
Percent of Covered Workers
0
10
20
30
40
50
60
70
80
90
100
Well Child Care OutpatientAlcoholTreatment
Outpatient DrugTreatment
Inpatient MentalHealth Benefits
ChiropracticCare
Type of Benefit
60
67
75
96
82
96
84
97
72
95
Fully Insured Health Plans
Self-Funded Health Plans
Source: KPMG Peat Marwick, March 1996, based on 1995 employer surveys.
Although self-funded plans often offer the same types of benefits statescommonly mandate for insurers, self-funded plans may include featuresthat differ from those required by state mandates. For example, statemandates generally specify a minimum number of days of care thatinsurers must cover for inpatient mental health care. One employerassociation indicated that many employers prefer designing more flexiblemental health benefits, for example, requiring case management rather
15See Krohm and Grossman, p. 56. The mandated benefits surveyed include substance abuse, diabetescare, home health care, skilled nursing facility care, kidney disease treatment, and chiropractic care.
GAO/HEHS-96-161 Health Insurance Regulation CostsPage 16

B-271084
than specifying a limited number of days of care. Thus, even though97 percent of self-funded plans offer inpatient mental health care services,some of these plans would not meet the state requirements for fullyinsured health plans.
Assessing the cost differences between self-funded and fully insuredhealth plans resulting from mandated benefits is difficult. To the extentthat self-funded health plans offer benefits that are like state-mandatedbenefits, their claims costs would not significantly differ because of theirexemption from state-mandated benefit laws. For less commonly offeredbenefits, such as in vitro fertilization, self-funded employers would faceadditional claims costs if they were required to meet the state mandates.In addition, if employers who self-fund their health plan were required tocomply with state mandates, they would lose flexibility in choosing thebenefits to offer and in offering a single uniform health plan in manystates.
State SolvencyStandards’ Impact onInsurers’ Costs IsLimited
State solvency requirements add costs only to the extent that they exceedprudent industry practices a health insurance carrier would follow in theabsence of state requirements. States use a variety of methods to monitorhealth insurers’ solvency, including minimum capital and surplus levels,investment restrictions, and financial reviews. The specific requirementsvary both by state and by type of insurance.
State laws generally require insurers to maintain a minimum level ofcapital or surplus to become licensed, but this level is a small fraction ofmost insurers’ assets. The minimum levels of capital and surplus vary bystate and by type of insurance, ranging in 1993 from $200,000 to $5 million.Most insurers have capital and surplus levels that exceed these minimumrequirements. For example, Maryland requires insurers selling both lifeand health insurance to have a minimum of $3.75 million in capital andsurplus to be licensed.16 In comparison, as of December 31, 1994, theactual capital and surplus level for life and health insurers licensed inMaryland averaged $200 million. The cost effect of the minimumrequirements can be more significant for small insurers, however.According to data from the Maryland Insurance Administration, 19 percent
16Insurers selling only health insurance in Maryland must have $1.875 million. HMOs must have$1.5 million to become licensed and then must maintain the greater of $750,000 or 5 percent ofpremiums, up to $3 million. When an insurer operates in more than one state, it must meet other states’minimum capital and surplus requirements only to the extent that they exceed the domiciled state’s.For example, an insurer based in Maryland that sells health insurance only would have to demonstratethat it has an additional $1.125 million in capital and surplus to meet Virginia’s $3 million minimumcapital and surplus requirement.
GAO/HEHS-96-161 Health Insurance Regulation CostsPage 17

B-271084
of life and health insurers licensed in Maryland had less than $10 million incapital and surplus.
Although some insurers may need to keep higher levels of capital andsurplus to comply with the minimum levels that states require under theNAIC-developed model risk-based capital standards, most insurers alsoexceed these levels.17 Under risk-based capital, a level (called the “controllevel”) is calculated for each health plan based on its uniquecharacteristics. If a health plan’s reserves were to fall below this level, thestate is authorized to take control of the insurer.18 A range of regulatoryactions would occur if an insurer were to approach this control level. At200 percent of the control level, the state requires an insurer to prepare aplan to increase its capital; at the extreme, if the insurer’s capital werebelow 70 percent of the authorized control level, the insurancecommission would have to take control of the insurance company.However, standard industry practices tend to be similar to or exceed theseminimum state requirements. For example, a representative of the HealthInsurance Association of America told us that 90 percent of insurers in1995 exceeded 250 percent of the authorized control level for risk-basedcapital. In addition, a Virginia state official noted that, since Virginiaadopted enforcement actions based on NAIC’s risk-based capital formula inJuly 1995, no insurers have fallen below the level where state standardswould require action.
Blue Cross and Blue Shield plans have different requirements under statelaws. For example, many states set target capital and surplus levels forBlue Cross and Blue Shield health plans to ensure that they have sufficientfunds to cover, for example, 1 or 2 months of claims. Furthermore, tomaintain their nonprofit status, some states require that Blue Cross andBlue Shield plans’ surplus not exceed a target level, such as 7 months’claims.
In addition, states restrict how insurers invest their funds, potentiallyimposing an opportunity cost on insurers who might otherwise invest inhigher yielding assets. These investment restrictions vary by state, but ingeneral states regulate the type and amount of assets in which health plansinvest to diversify insurers’ investments and minimize their risk. For
17The existing risk-based capital formula applies only to insurers that sell life and health insurance.NAIC is drafting a standard formula for other types of health plans, including HMOs.
18For example, the minimum surplus level is set by a formula that takes into account the type ofinsurance sold and the company’s investments and assigns risk factors that measure the variability ofthese products and investments.
GAO/HEHS-96-161 Health Insurance Regulation CostsPage 18

B-271084
example, many states limit the amount of funds that a health insurancecarrier may invest in certain types of investments, such as common stocksand foreign securities, with potentially higher return rates than otherpermitted investments. The risk associated with these investments is alsogreater, however, so the insurer could get a lower rate of return than withpermitted investments. An insurer could even lose money, possiblydamaging its solvency. Furthermore, actuaries note that investmentstypically provide a smaller share of income to health insurers than othertypes of insurance such as life insurance.
States’ oversight of health insurers’ solvency may also add administrativecosts to insurers who must comply with reporting and reviewrequirements, but industry officials note that such costs are difficult toquantify. The administrative costs include preparing audited financialstatements and actuarial analyses for state review, functions insurerswould likely perform anyway. States require insurers to report financialinformation using NAIC’s accounting standards, however, which differ fromgenerally accepted accounting principles in their valuation of assets. Insome cases, this may require an insurer to maintain two sets of accountingdata, but insurance company executives we spoke with said this is amarginal additional cost.
The costs of actuarial certification vary by type of insurance. Insurersselling only health coverage may prepare a simplified actuarialcertification that requires few resources. Insurers selling health and lifecoverage must prepare a more extensive actuarial certification that wouldbe more costly. One insurer, however, noted that the informationdeveloped for the actuarial certification provides the insurer with valuableinformation on the adequacy of the insurer’s reserves for meetinganticipated costs.
Finally, many states charge the insurer for the costs of on-site financialexamination, which typically occur once every 3 to 5 years. The costs ofthese exams vary depending on their length and complexity, but one statereported that the cost can be as high as $1 million for a complex review ofa large insurer; less complex ones may cost less than $100,000.19
19States also conduct market conduct exams that include reviews of insurers’ advertising, compliancewith licensing requirements, claims practices, and handling of consumer complaints. These exams aretypically conducted less often and are less costly than financial reviews.
GAO/HEHS-96-161 Health Insurance Regulation CostsPage 19

B-271084
Cost Effects of StateSmall EmployerReforms Difficult toAssess
Most states have recently passed legislation designed to improveportability, access, and rating practices for the small employer healthinsurance market. It is too early to assess the cost effects of these reformsdefinitively because most available information is anecdotal. Moreover,even if more systematic data were available, isolating the effect of smallgroup reforms from other factors would be difficult in the currentlydynamic health care market.
The small group reforms include provisions to help ensure that(1) employees who want health insurance coverage will be accepted andrenewed by insurers; (2) waiting periods for preexisting conditions will berelatively short, occur only once, and be based only on recent medicalhistory; (3) coverage will be continuous and portable, even when anindividual changes jobs or the employer changes insurers; and (4) widevariation in premium rates will be narrowed to fall within state-specifiedranges. In an earlier report, we identified 45 states that passed legislationbetween 1990 and 1994 regulating the small employer health insurancemarket (typically fewer than 25 or 50 employees).20 We also noted that thespecific state requirements vary both by state and from the NAIC model act.
The available evidence on states’ early experience with small group reformis mostly testimonial, anecdotal, and often contradictory. Following areexamples of some of this evidence.
• The Colorado Insurance Division reports that small employer reforms,including guaranteed issue and rate restrictions, have moderated premiumincreases and increased the number of individuals covered by small grouphealth plans.
• Some initial reports on New York’s experience stated that insurers left thestate and premiums increased. Subsequent reports, however, havequestioned the extent of these problems. Furthermore, state officials notethat most changes occurred in the individual market rather than the smallemployer market and resulted from other factors, particularly the financialstatus of the state’s largest insurer.
• Minnesota and Colorado officials point to the decline in enrollment in theirhigh-risk pools as evidence of the success of small group reforms inmaking private health coverage more available.
• Washington’s reforms, which were partially repealed beforeimplementation, resulted in a surge in high-cost, high-risk enrollees thathas led insurers to warn of high premium increases and their potentialwithdrawal from the state.
20See GAO/HEHS-95-161FS, June 12, 1995.
GAO/HEHS-96-161 Health Insurance Regulation CostsPage 20

B-271084
• Maryland officials asserted that in the first year of implementing smallemployer reforms competition in the small group health insurance markethas increased and premiums have declined, but they acknowledged thatdata on premiums before the reforms were sparse.
As these examples illustrate, the results across states are not consistent orgeneralizable to other states’ experiences. Furthermore, even within thestates noted above, conflicting views exist about the success or failure ofthe small group reforms.
Some states have specifically designed their reforms to minimize potentialcost increases. For example, the task force that developed Maryland’sreforms designed the benefits package to cost less than 12 percent ofaverage wages in Maryland. Ohio state officials scaled back their originalreforms after receiving estimates that they could increase costs. As aresult, Ohio enacted less generous requirements for guaranteed coverage.
In addition, because the private insurance market has been changingrapidly, the effect these reforms have had on health insurance premiums isdifficult to isolate. Besides the small employer insurance reforms, factorsaffecting insurance premiums include nationwide declines in the growthrate of health care costs, the growth of managed care, changes in healthbenefits, and the expansion of Medicaid coverage. Small group reformsmay also have redistributive effects, with some enrollees facing increasedcosts while others face reduced costs, making the net effect unclear.Changes resulting from small group reforms may take several years to playout fully. Finally, the paucity of data preceding the enactment of reformsmay hamper before-and-after comparisons of insurance premiums.
ConcludingObservations
State requirements on health insurance and their effects raise twoquestions: who is affected directly, and what factors determine the size ofthe requirements’ cost impact? Under the ERISA statute, state governmentscannot tax or regulate self-funded plans established by an employer whobears most of the financial risk. By contrast, states continue to haveauthority to tax and regulate health insurance. As a result, enrollees ininsured health plans have the benefits associated with state regulation butalso bear an additional cost relative to enrollees in self-funded healthplans. This cost differential can differ considerably by state. Specifically,state taxes on health insurers raise the costs of fully insured plans byabout 2 percent in most states, with the actual level determined by statetax rate and type of health plan. In addition, the extent to which mandated
GAO/HEHS-96-161 Health Insurance Regulation CostsPage 21

B-271084
benefits and solvency requirements raise costs differs by state, dependingupon the scope of state laws. Furthermore, the extent to which a costdifferential between self-funded and insured health plans would beapparent depends on whether state regulation results in a change inemployers’ and insurers’ behavior. At the extreme, for health plans thatprovide comprehensive benefits and maintain surpluses exceeding stateminimum requirements, the cost differential may be nonexistent.
The burden of state requirements on large versus small employers dependson the employers’ use of self-funding. Because large employers’ healthplans are predominantly self-funded (and outside the states’ purview) andsmall employers generally purchase health coverage from private insurers,the costs associated with state requirements fall largely on smallemployers. But this may be changing. Some small employers are alsobeginning to self-fund, partly to avoid state regulation and taxation of theirhealth plans. Whether this trend will continue, and at what rate, is unclear.
NAIC’s Comments NAIC officials provided us with comments on a draft of this report. Theypointed out that although the costs associated with state requirements areaccurately described, the benefits to plan participants are addressed onlyto a limited extent. We acknowledge that participants benefit from manystate requirements. As noted earlier, our ERISA report21 morecomprehensively describes the state and employer perspectives on theimplications of ERISA preemption of state regulation. As agreed to with ourrequester, our primary focus in this report was to provide additionalinformation on the costs associated with these state requirements.
In addition, NAIC officials noted that the report could also address “thecosts that employers and employees might face when covered throughERISA-governed plans.” Indeed, ERISA requirements, such as reporting,disclosure, and fiduciary responsibilities, may have associated costs. Asnoted in the report, however, these costs are borne by all ERISA-governedplans, including both fully insured and self-funded health plans. Thus, theydo not lead to a differential in costs between fully insured and self-fundedhealth plans in the way that state requirements applying only to fullyinsured health plans may.
NAIC officials also provided technical comments, which we incorporatedwhere appropriate.
21GAO/HEHS-95-167, July 25, 1995.
GAO/HEHS-96-161 Health Insurance Regulation CostsPage 22

B-271084
As agreed with your office, unless you publicly announce its contentsearlier, we plan no further distribution of this report until 30 days from thedate of this letter. At that time, we will send copies to interested partiesand make copies available to others upon request.
Please call me on (202) 512-7114 if you or your staff have any questionsabout this report. Other major contributors are listed in appendix V.
Sincerely yours,
Jonathan RatnerAssociate Director, Health Financing and Systems Issues
GAO/HEHS-96-161 Health Insurance Regulation CostsPage 23

Contents
Letter 1
Appendix I State HealthInsurance PremiumTax Rates
26
Appendix II State Life and HealthGuaranty FundAssessments
29
Appendix III State Assessments forHigh-Risk Pools
32
Appendix IV Health InsuranceBenefits StatesCommonly Mandate
33
Appendix V Major Contributors toThis Report
34
Tables Table 1: Comparison of State and Federal Provisions AffectingFully Insured and Self-Funded Health Plans
5
Table 2: Taxes on Insured Health Plans as a Percent of Premiums 8Table 3: Studies of the Claims Costs of Mandated Benefits in
Selected States12
Table 4: Average Claim Cost per Group Contract for Mandates inVirginia
13
GAO/HEHS-96-161 Health Insurance Regulation CostsPage 24

Contents
Figures Figure 1: Mandated Benefits by State 10Figure 2: Comparison of Selected Benefits Offered by Fully
Insured and Self-Funded Health Plans16
Abbreviations
AAHP American Association of Health PlansERISA Employee Retirement Income Security Act of 1974HMO health maintenance organizationNAIC National Association of Insurance Commissioners
GAO/HEHS-96-161 Health Insurance Regulation CostsPage 25

Appendix I
State Health Insurance Premium Tax Rates
Health insurers(percent)
Blue Cross and BlueShield plans
(percent)HMOs
(percent)
Alabama 1-4a 1-4a 1b
Alaska 2.7 6c 2.7
Arizona 2 2 2d
Arkansas 2.5 1 2.5e
California 2.35 0 0
Colorado 2.25 5¢ per enrollee 0f
Connecticut 1.75 2g 1.75g
Delaware 2 0 0
District of Columbia 2.25 0 0
Florida 1.75 1.75 0
Georgia 2.25 2.25 2.25h
Hawaii 4.265 0 0
Idaho 1.4-2.75i 4¢ per enrolleej 4¢ per enrolleej
Illinois 2k 0 0
Indiana 2 0 0
Iowa 2 2 0-2l
Kansas 1-2a 1-2a 0.5-1l
Kentucky 2m 2m 2m
Louisiana 2-2.25n 2-2.25n 2-2.25n
Maine 2 0 0
Maryland 2 0 0o
Massachusetts 2-2.28p 0 0
Michigan 0q 0 0
Minnesota 2 0 0
Mississippi 3 0 0
Missouri 2 0 0
Montana 2.75 0 0
Nebraska 0.5-1r 1 1
Nevada n/a 3.5 3.5
New Hampshire 2s 0 2s
New Jersey 1.05 2¢ per subscriber 0
New Mexico 0.9-3j 0.9-3j 0.9-3j
New York 1 0 0
North Carolina 1.9 0.5 0
North Dakota 1.75 1.75 1.75t
Ohio 2.5u 2.5u 0
(continued)
GAO/HEHS-96-161 Health Insurance Regulation CostsPage 26

Appendix I
State Health Insurance Premium Tax Rates
Health insurers(percent)
Blue Cross and BlueShield plans
(percent)HMOs
(percent)
Oklahoma 2.25 2.25 2.25v
Oregon 2.25w 0 0
Pennsylvania 2 0 2x
Rhode Island 2 0 0
South Carolina 1.25 1.25 0y
South Dakota 2.5 2.5 2.5b
Tennessee 2.5 2.5 2
Texas 1.75 0 1.75z
Utah 0 0 0
Vermont 2 0 0
Virginia 2.25 0.75aa 0bb
Washington 2cc 2cc 2cc
West Virginia 3 0 0
Wisconsin 2 0 0dd
Wyoming 0.75 0.75 0.75
Note: Premium taxes expressed as percentage rate assessed on premiums unless otherwisenoted.
aDomestic (state-based) insurers pay lower rate.
bCredit for HMOs with home office.
cTax based on gross premium less claims paid.
dTax assessed on net charges.
eCredit for HMOs with state home office and local salaries and wages.
fFee collected on the basis of premium volume.
gTax collected on the basis of net direct premiums.
hCity license fee deducted.
iLower rate applies to insurers investing in state securities.
jPer month.
kDomestic insurers meeting certain requirements are tax exempt.
lHMOs less than 6 years old pay the lower rate.
mAdditional tax of $0.25 per outpatient pharmaceutical drug if tax is not paid by pharmacist.
nTax set as $140 for $7,000 or less in premiums received and $225 for each additional $10,000 inpremiums received.
GAO/HEHS-96-161 Health Insurance Regulation CostsPage 27

Appendix I
State Health Insurance Premium Tax Rates
oHMOs are tax exempt except where HMO benefits are offered by a for-profit commercial insurer.HMOs offered by nonprofit insurer are tax exempt.
pLower rate is paid by insurer if also licensed as life insurance company. Preferred providerorganizations taxed at 2 percent.
qInsurers pay business tax.
rLower rate applies to group plans.
sMinimum payment of $200.
tHMO credits for exam fees and home office.
uDomestic insurers pay lesser of 2.5 percent or franchise tax.
vFederal payments (Medicare and Medicaid) to HMOs are tax exempt; credit if invested in statesecurities; credit for HMO state home office.
wDomestic insurers pay income tax instead.
xNonprofit or benevolent HMOs are tax exempt.
yTaxed as a corporation at 5 percent; also have a license tax.
zFor first $450,000 of gross reserves collected, HMO tax rate is 0.875 percent. HMOs receive acredit for Texas investments not to exceed $2 per enrollee.
aaTax assessed on subscriber fees.
bbPay insurance commission maintenance assessment of no more than 0.1 percent of premium,with a minimum of $300.
ccAdditional fee assessed for Department of Insurance operations, not to exceed 0.125 percent ofreceipts.
ddHMOs pay franchise tax of 7.9 percent.
Source: National Association of Insurance Commissioners, “Premium Tax Rate by Line,”Compendium of State Laws on Insurance Topics (Kansas City, Mo.: NAIC, 1995).
GAO/HEHS-96-161 Health Insurance Regulation CostsPage 28

Appendix II
State Life and Health Guaranty FundAssessments
StateAssessment
cap (percent)
Actualassessment, 1993
(percent)
Percent offsetfrom premium
taxes
Alabama 1 0.31 100a
Alaska 2 1.48 0
Arizona 2 0.43 100b
Arkansas 2 0.24 100a
California 1 0.31 0
Colorado 1 0.22 0c
Connecticut 2 0.01 50
Delaware 2 0.65 100a
District of Columbia 2 0.00 100d
Florida 1 1.30 n/a
Georgia 2 1.32 100a
Hawaii 2 3.19 100a
Idaho 2 0.63 100a
Illinois 2 0.18 100e
Indiana 2 0.11 100a
Iowa 2 0.19 100a
Kansas 2 0.00 100a
Kentucky 2 0.36 100a
Louisiana 2 0.21 100a
Maine 2 0.12 0c
Maryland 2 0.30 0
Massachusetts 2 0.41 50f
Michigan 2 0.00 0
Minnesota 2 0.81 0
Mississippi 2 0.68 50g
Missouri 2 0.23 100a
Montana 2 1.06 100a
Nebraska 2 0.34 100a
Nevada 2 0.70 100a
New Hampshire 2 0.00 100a
New Jersey 2 0.15 50h
New Mexico 2 1.27 0
New York 2 0.00 80i
North Carolina 2 0.74 100a
North Dakota 2 0.65 100a
Ohio 2 0.04 100a
(continued)
GAO/HEHS-96-161 Health Insurance Regulation CostsPage 29

Appendix II
State Life and Health Guaranty Fund
Assessments
StateAssessment
cap (percent)
Actualassessment, 1993
(percent)
Percent offsetfrom premium
taxes
Oklahoma 2 0.71 100a
Oregon 2 0.16 100a
Pennsylvania 2 0.48 100a
Rhode Island 3 0.21 50j
South Carolina 4 0.00 100a
South Dakota 2 0.49 100k
Tennessee 2 0.31 100l
Texas 1 0.05 100m
Utah 2 0.24 100a
Vermont 2 0.05 100a
Virginia 2 0.00 See noten
Washington 2 0.40 100a
West Virginia 2 0.44 0
Wisconsin 2 1.63 100a
Wyoming 2 0.94 100d
a20 percent for 5 years following assessment.
bOffset graduated over several years until 100 percent recovered.
cRecoup health guaranty fund assessments by surcharge of premiums.
d10 percent for 10 years following assessment.
e20 percent for 5 years following assessment; offset only allowed if aggregate assessment of allinsurers exceeds $3 million.
f10 percent for 5 years following assessment if aggregate assessment for all insurers exceeds$3 million.
g25 percent for 2 years following assessment.
h10 percent for 5 years beginning third year after assessment but no more than 20 percent of taxliability.
iOffset effective when aggregate assessments for insurers exceed $100 million.
j10 percent for 5 years following assessment.
k20 percent for 5 years beginning year after assessment, up to $2 million per year.
l10 percent for 10 years beginning year after assessment or 1 percent of premiums written.
m10 percent for 10 years beginning year after assessment; assessments for administrativeexpenses may be subtracted from year’s tax owed.
nMay offset 0.05 percent of gross premium for insurance written for account each year.
GAO/HEHS-96-161 Health Insurance Regulation CostsPage 30

Appendix II
State Life and Health Guaranty Fund
Assessments
Sources: National Association of Insurance Commissioners, “Life and Health Guaranty FundLaws,” Compendium of State Laws on Insurance Topics (Kansas City, Mo.: NAIC, 1995) andNational Organization of Life and Health Insurance Guaranty Associations, Comparison ofAssessments and Estimated Assessment Capacity (Herndon, Va.: NOLHGA, 1995).
GAO/HEHS-96-161 Health Insurance Regulation CostsPage 31

Appendix III
State Assessments for High-Risk Pools
StateParticipants (Dec. 31,
1994)Insurer assessments
(1994)
Alaska 128 $ 600,000
Arkansas n/aa n/a
California 19,353b Noc
Colorado 1,921 Noc
Connecticut 1,364d 8,365,979
Florida 2,387 11,814,627
Illinois 4,755 No
Indiana 4,638 10,717,539
Iowa 1,341 3,000,000
Kansas 619e 0
Louisiana 386 Noc
Minnesota 33,477 44,424,903
Mississippi 610 See notef
Missouri 931 1,934,854
Montana 268 0
Nebraska 3,331 6,200,000
New Mexico 1,124 3,426,625
North Dakota 1,422 1,500,000
Oklahoma n/aa n/a
Oregon 4,313g 3,956,818
South Carolina 1,264 n/a
Utah 710h Noc
Washington 1,307 11,499,657
Wisconsin 10,864 17,107,689
Wyoming 200 517,350aLegislation enacted in 1995.
bAs of April 1995.
cInsurer assessments not used to finance high-risk pool.
dNumber of policies, not individuals.
eAs of March 15, 1995.
fEach insurer is assessed an amount no more than $1 per policy per month. The rate in 1994 was$0.50 per policy per month.
gAs of June 1995.
hAs of May 1995.
Source: Comprehensive Health Insurance for High-risk Individuals: A State-by-State Analysis,Communicating for Agriculture, Inc. (Bloomington, Minn.: 1995).
GAO/HEHS-96-161 Health Insurance Regulation CostsPage 32

Appendix IV
Health Insurance Benefits States CommonlyMandate
Number of states
Cover Offer Total
Treatment-related benefits
Mammography screening 42 4 46
Alcoholism treatment 23 16 39
Mental illness 15 16 31
Well child care 21 4 25
Drug abuse treatment 13 10 23
Pap smear 17 0 17
Infertility treatment/in vitro fertilization 12 2 14
Temporomandibular joint disorders 11 3 14
Off-label drug use 13 0 13
Maternity care 11 2 13
Breast reconstruction following mastectomy 9 2 11
Provider-related benefits
Optometrists 46 1 47
Chiropractors 43 3 46
Psychologists 42 0 42
Podiatrists 38 0 38
Social workers 26 0 26
Osteopaths 21 0 21
Nurse midwives 15 0 15
Physical therapists 14 0 14
Nurse practitioners 13 1 14
Note: In some cases, states limit mandates to particular types of health plans such as HMOs orgroup insurance plans.
Source: NAIC, Compendium of State Laws on Insurance Topics: Mandated Benefits (Kansas City,Mo.: NAIC, 1995).
GAO/HEHS-96-161 Health Insurance Regulation CostsPage 33
Appendix V
Major Contributors to This Report
Michael Gutowski, Assistant Director, (202) 512-7128John Dicken, Senior Evaluator, (202) 512-7135Carmen Rivera-Lowitt, Senior Evaluator, (202) 512-4342
(108257) GAO/HEHS-96-161 Health Insurance Regulation CostsPage 34

Ordering Information
The first copy of each GAO report and testimony is free.
Additional copies are $2 each. Orders should be sent to the
following address, accompanied by a check or money order
made out to the Superintendent of Documents, when
necessary. VISA and MasterCard credit cards are accepted, also.
Orders for 100 or more copies to be mailed to a single address
are discounted 25 percent.
Orders by mail:
U.S. General Accounting Office
P.O. Box 6015
Gaithersburg, MD 20884-6015
or visit:
Room 1100
700 4th St. NW (corner of 4th and G Sts. NW)
U.S. General Accounting Office
Washington, DC
Orders may also be placed by calling (202) 512-6000
or by using fax number (301) 258-4066, or TDD (301) 413-0006.
Each day, GAO issues a list of newly available reports and
testimony. To receive facsimile copies of the daily list or any
list from the past 30 days, please call (202) 512-6000 using a
touchtone phone. A recorded menu will provide information on
how to obtain these lists.
For information on how to access GAO reports on the INTERNET,
send an e-mail message with "info" in the body to:
or visit GAO’s World Wide Web Home Page at:
http://www.gao.gov
PRINTED ON RECYCLED PAPER

United StatesGeneral Accounting OfficeWashington, D.C. 20548-0001
Official BusinessPenalty for Private Use $300
Address Correction Requested
Bulk RatePostage & Fees Paid
GAOPermit No. G100