health impacts of urban and transport related exposures in cities
TRANSCRIPT

THE HEALTH IMPACTS OF URBAN AND TRANSPORT RELATED EXPOSURES. Mark Nieuwenhuijsen
ISGlobal, Barcelona [email protected] ITS, Leeds, November 18, 2016Medellin

PROPORTION OF THE WORLD POPULATION LIVING IN URBAN AREAS
Rydin et al 2012

CITIES
´´Cities have long been known to be society’s predominant engine of innovation and wealth creation, of innovation and wealth creation, yet they are also its main source of crime, pollution, and disease´´
Bettencourt et al 2007

SHENZHEN, CHINA
SHENZHEN, CHINA

BUENOS AIRES, ARGENTINA
BUENOS AIRES, ARGENTINA
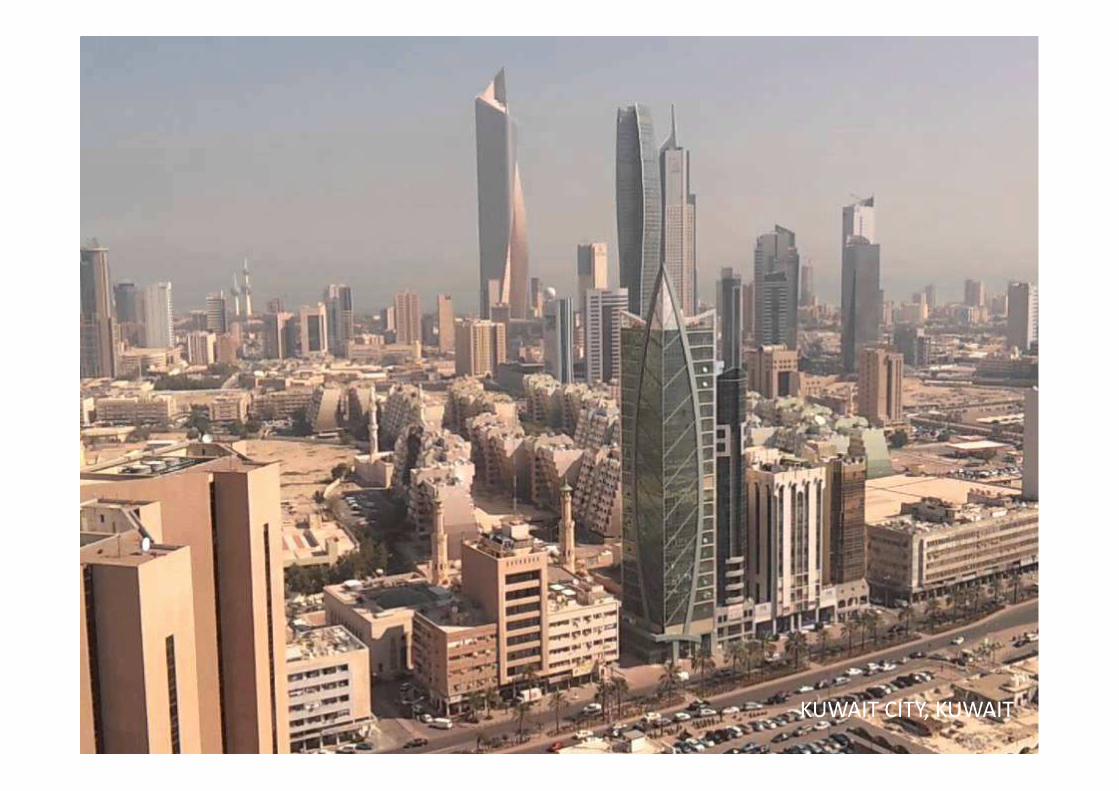
KUWAIT CITY, KUWAIT
KUWAIT CITY, KUWAIT
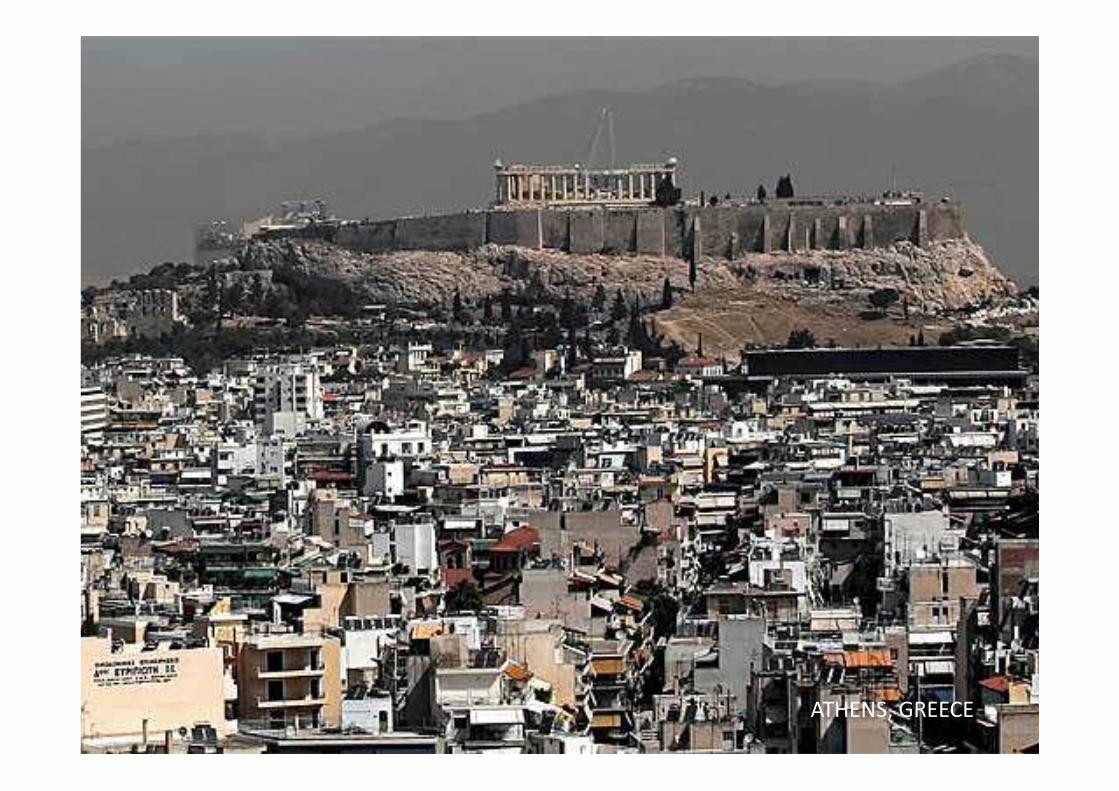
ATHENS, GREECE
ATHENS, GREECE


Mumbai

Paris


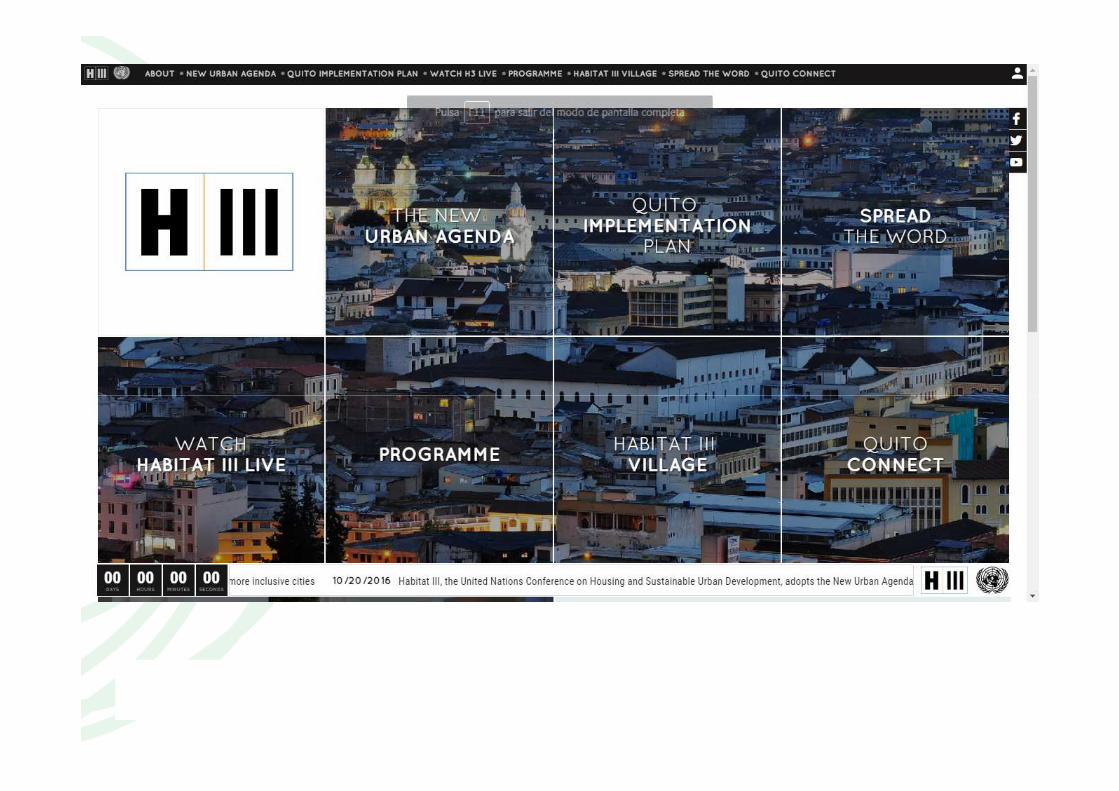
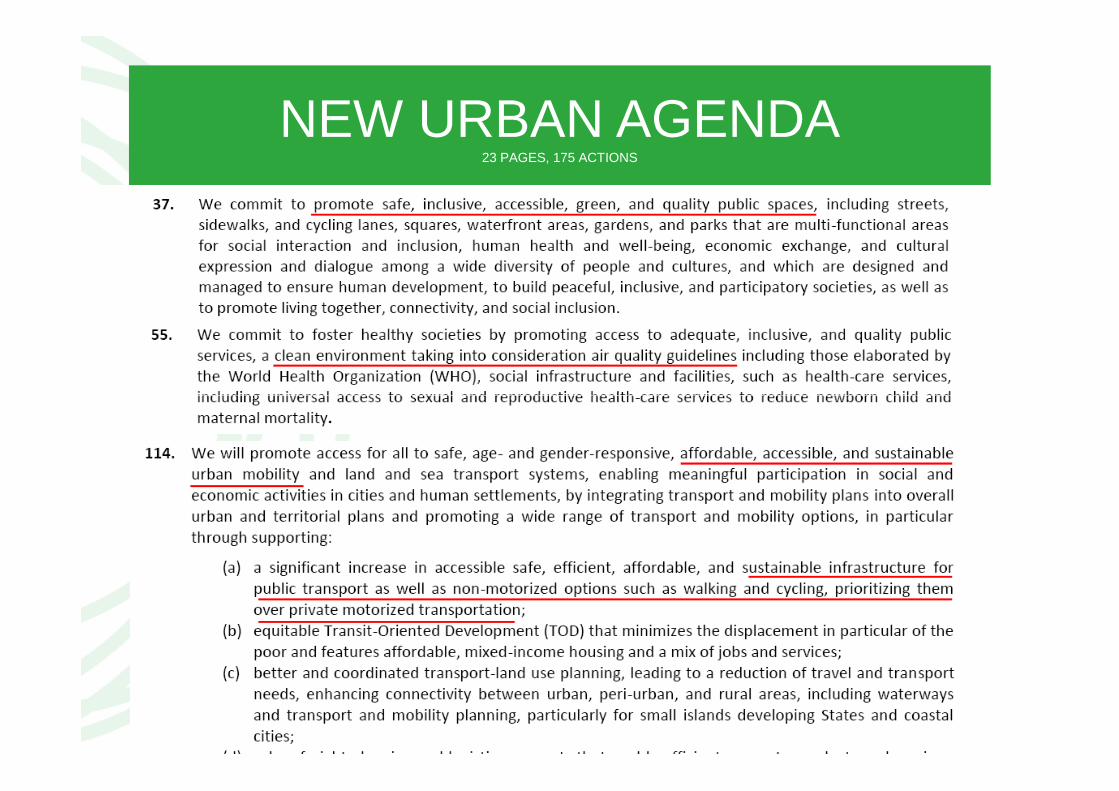
NEW URBAN AGENDA23 PAGES, 175 ACTIONS

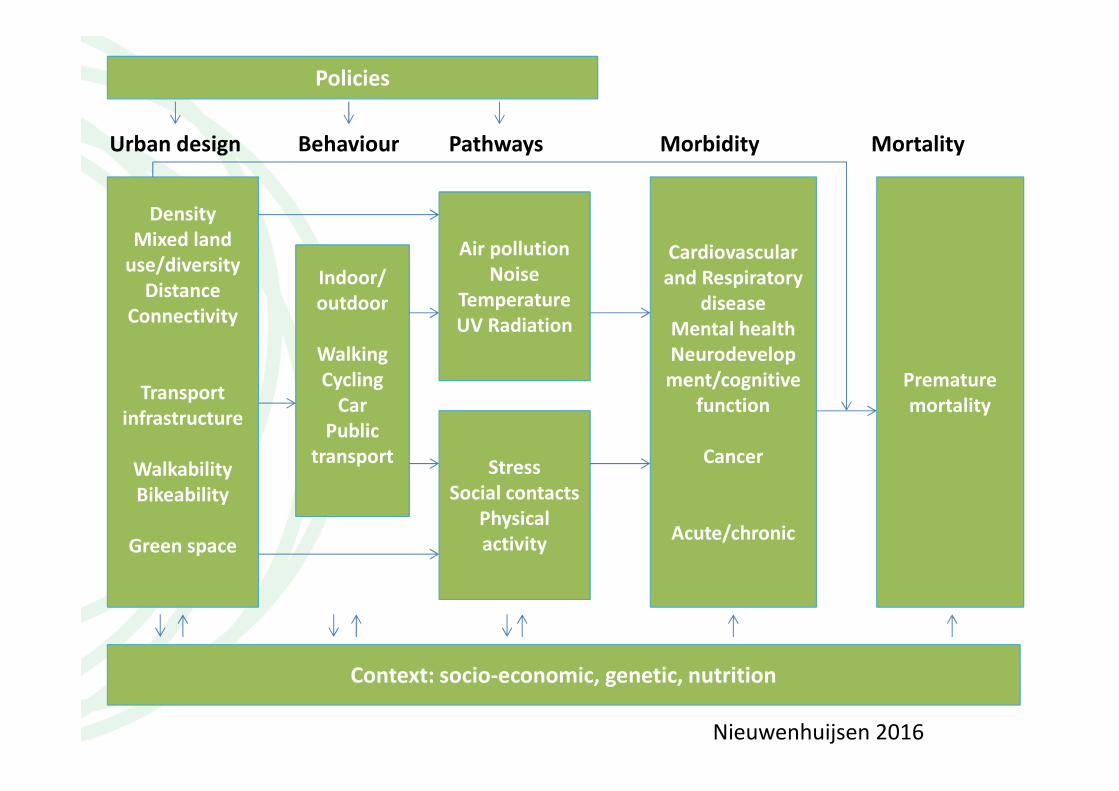
Density
Mixed land
use/diversity
Distance
Connectivity
Transport
Indoor/
outdoor
Walking
Cycling
Car
Air pollution
Noise
Temperature
UV Radiation
Cardiovascular
and Respiratory
disease
Mental health
Neurodevelop
ment/cognitive
function
Premature
mortality
Urban design Behaviour Pathways Morbidity Mortality
Policies
Transport
infrastructure
Walkability
Bikeability
Green space
Car
Public
transport
function
Cancer
Acute/chronic
mortality
Context: socio-economic, genetic, nutrition
Stress
Social contacts
Physical
activity
Nieuwenhuijsen 2016

EXPOSURE PATTERNS IN CITIES
Barcelona
Girona
Air pollution
Temperature
Green space
Noise
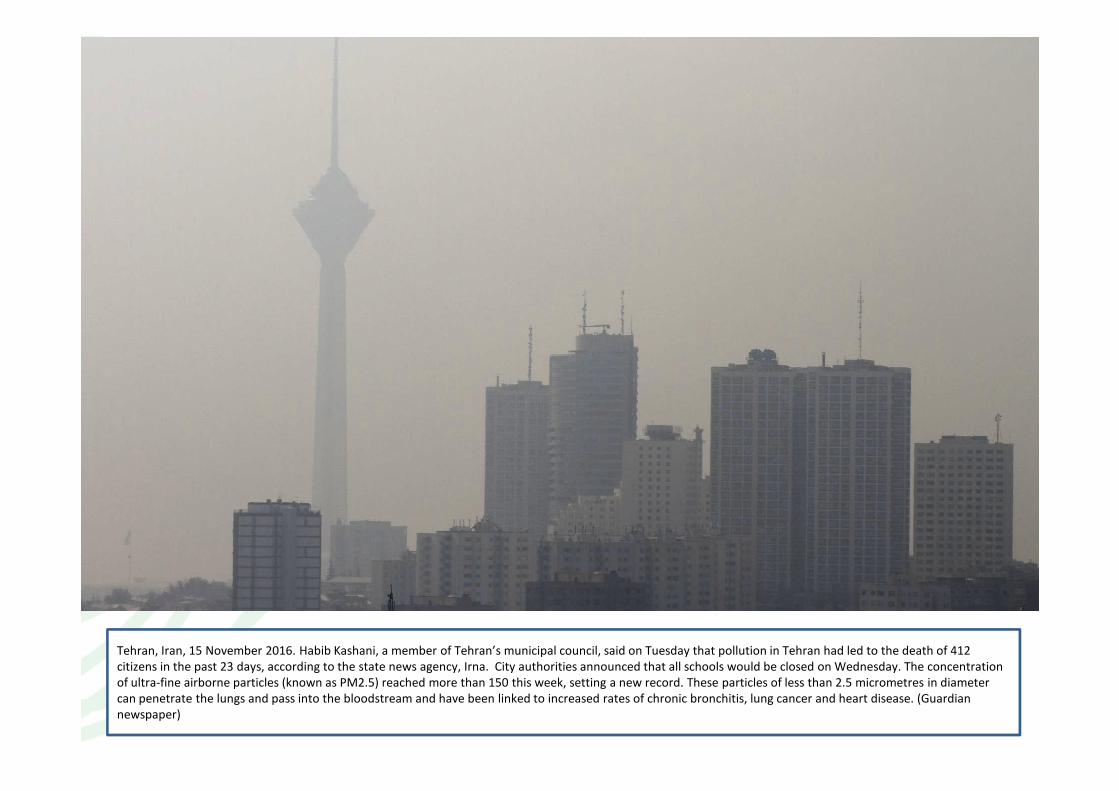
Tehran, Iran, 15 November 2016. Habib Kashani, a member of Tehran’s municipal council, said on Tuesday that pollution in Tehran had led to the death of 412
citizens in the past 23 days, according to the state news agency, Irna. City authorities announced that all schools would be closed on Wednesday. The concentration
of ultra-fine airborne particles (known as PM2.5) reached more than 150 this week, setting a new record. These particles of less than 2.5 micrometres in diameter
can penetrate the lungs and pass into the bloodstream and have been linked to increased rates of chronic bronchitis, lung cancer and heart disease. (Guardian
newspaper)

• 20 Countries
• 40 Study areas
AIR POLLUTION ASSESSMENT AND EPIDEMIOLOGY ESCAPE 7 million people die each year of air pollution
• 2008 - 2012

AIR POLLUTION AND PREMATURE MORTALITY
Beelen et al 20147% increased risk for premature mortality per 5 ug/m3 PM2.5
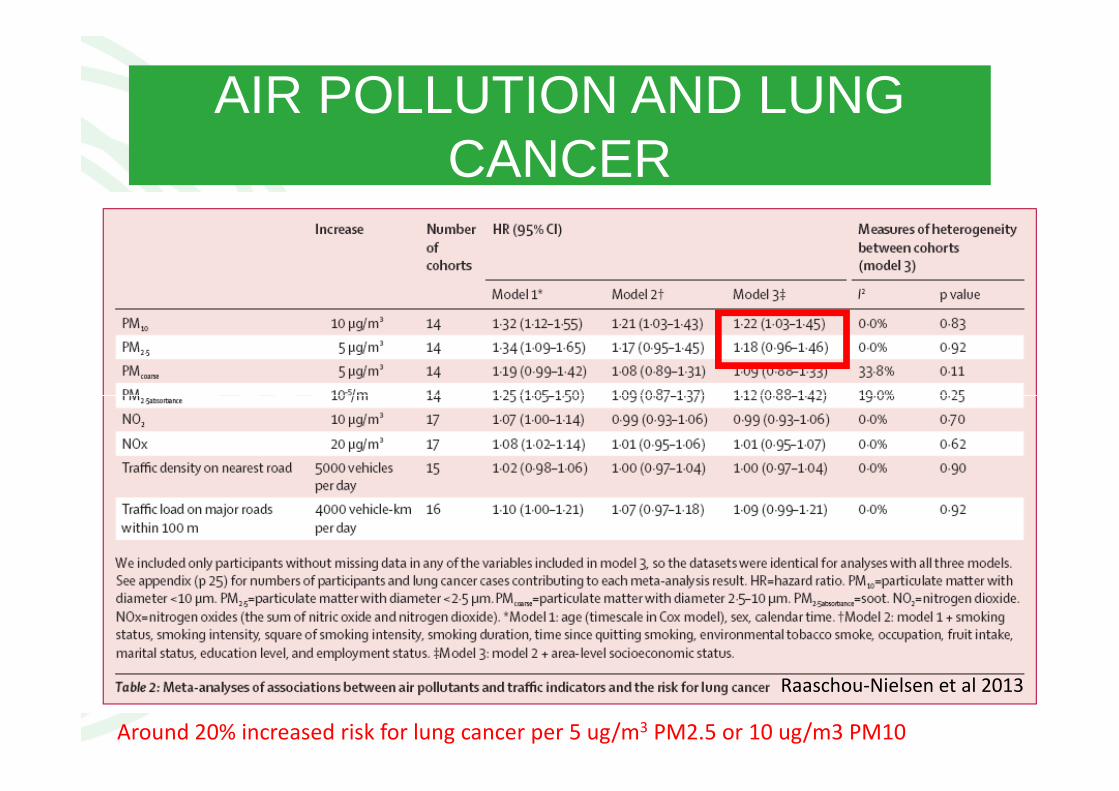
AIR POLLUTION AND LUNG CANCER
Around 20% increased risk for lung cancer per 5 ug/m3 PM2.5 or 10 ug/m3 PM10
Raaschou-Nielsen et al 2013
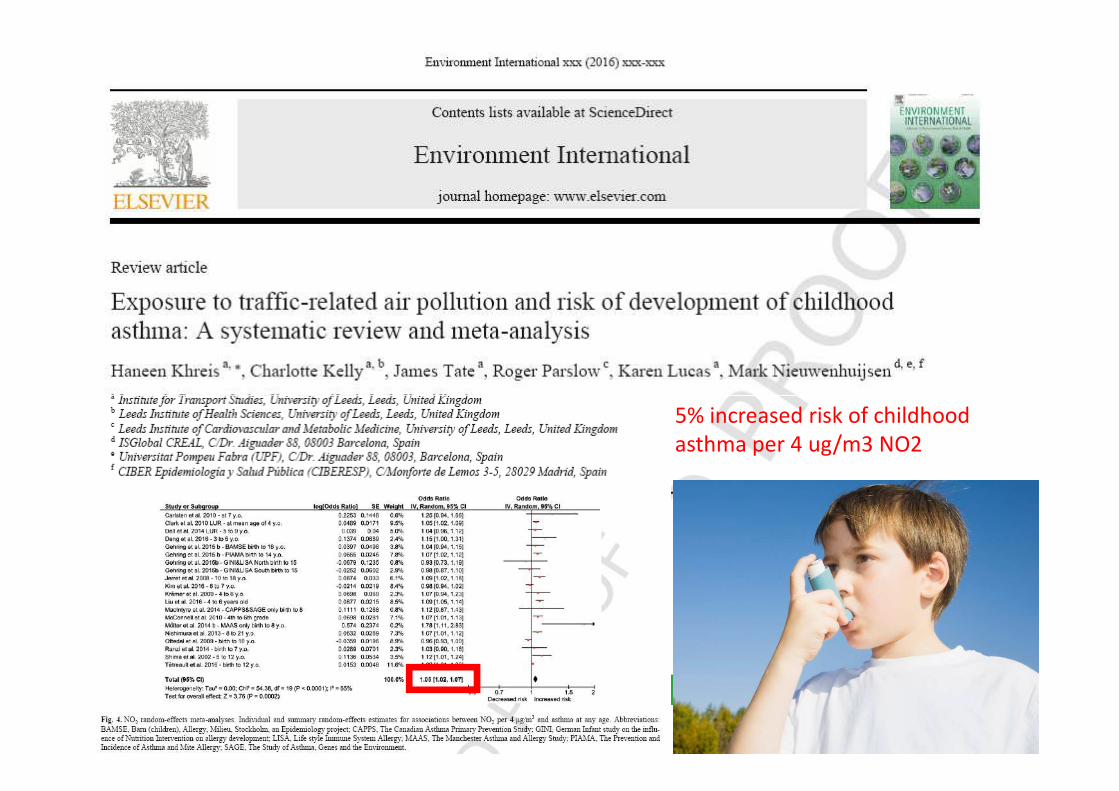
5% increased risk of childhood
asthma per 4 ug/m3 NO2

NOISE AND ALL CAUSE MORTALITY
• London TRAFFIC study – All cause mortality
Halonen et al. EHJ 20154% increased risk for premature mortality for > 60 dB vs < 55 dB
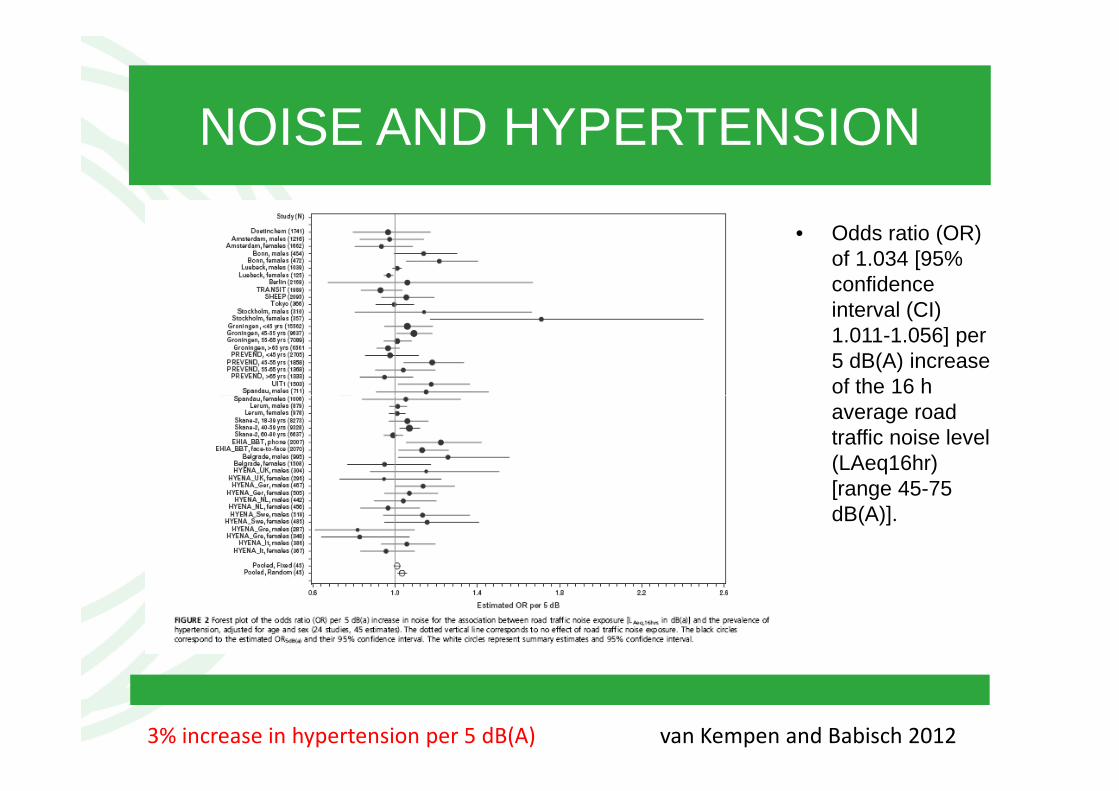
NOISE AND HYPERTENSION
• Odds ratio (OR) of 1.034 [95% confidence interval (CI) 1.011-1.056] per 5 dB(A) increase of the 16 h of the 16 h average road traffic noise level (LAeq16hr) [range 45-75 dB(A)].
van Kempen and Babisch 20123% increase in hypertension per 5 dB(A)

TEMPERATURE
Gasparrini
et al 2015
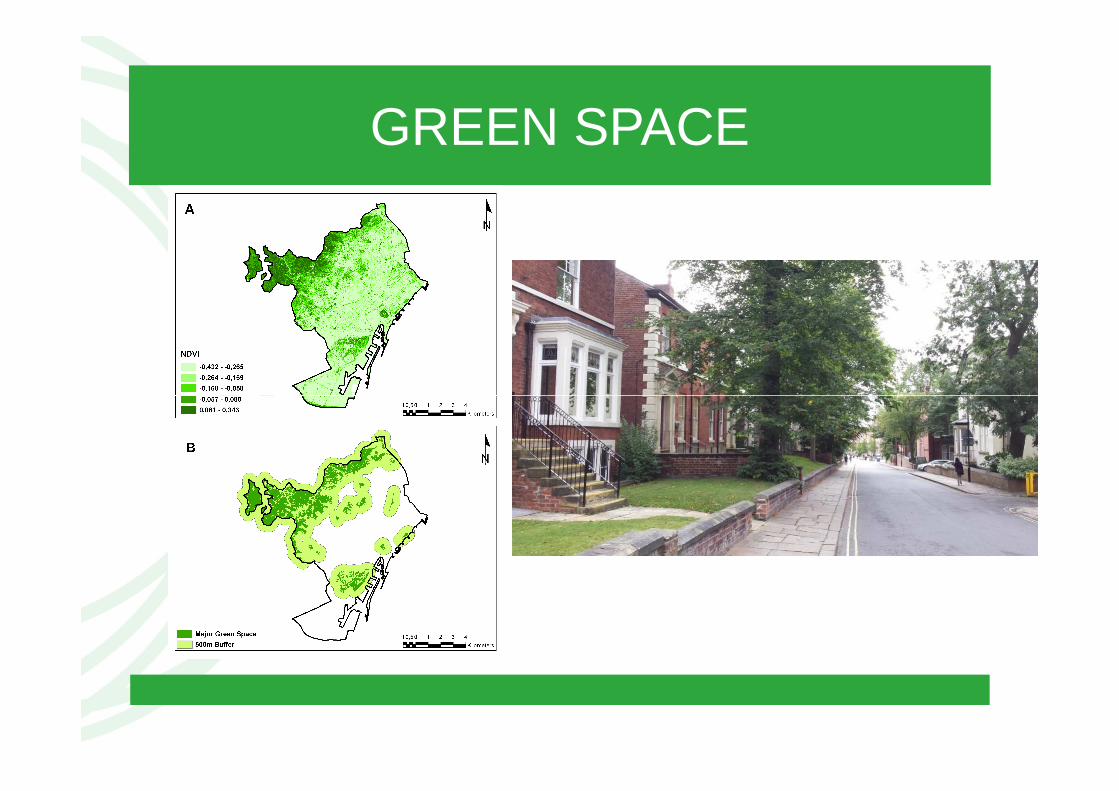
GREEN SPACE

GREEN SPACE AND MORTALITY
4% reduced risk for cardiovascular mortality for high vs low green space exposure
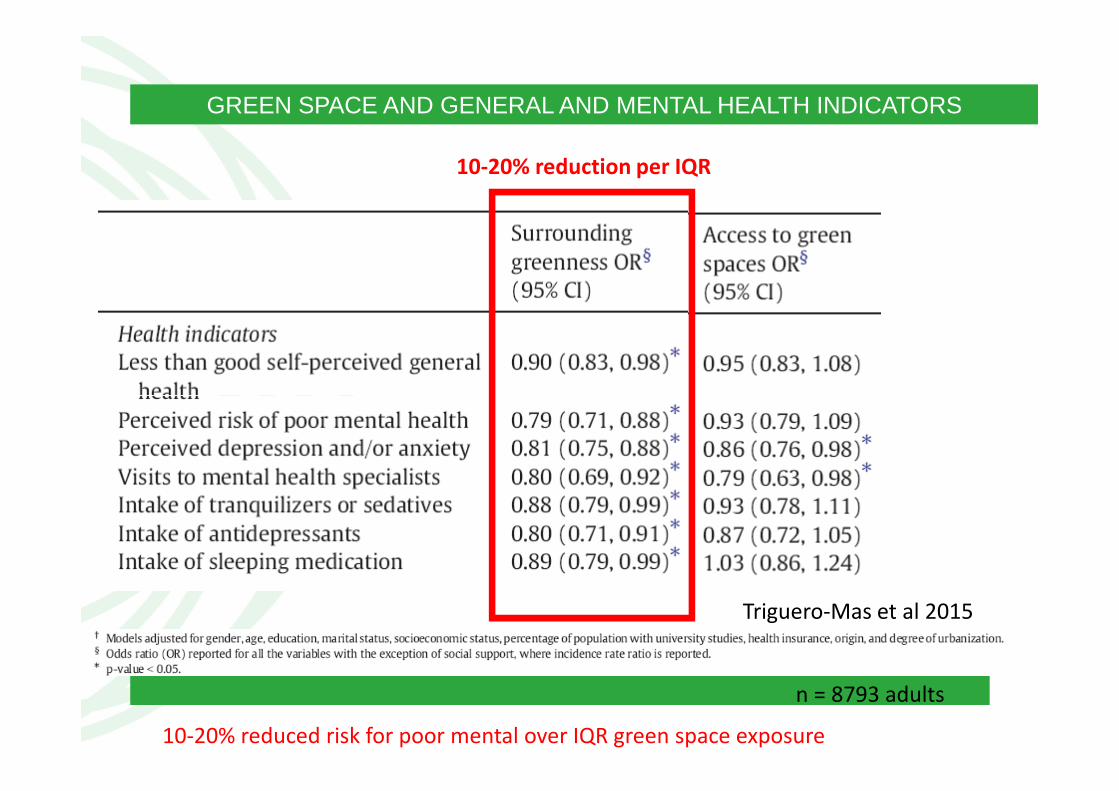
GREEN SPACE AND GENERAL AND MENTAL HEALTH INDICATORS
10-20% reduction per IQR
Triguero-Mas et al 2015
n = 8793 adults
10-20% reduced risk for poor mental over IQR green space exposure
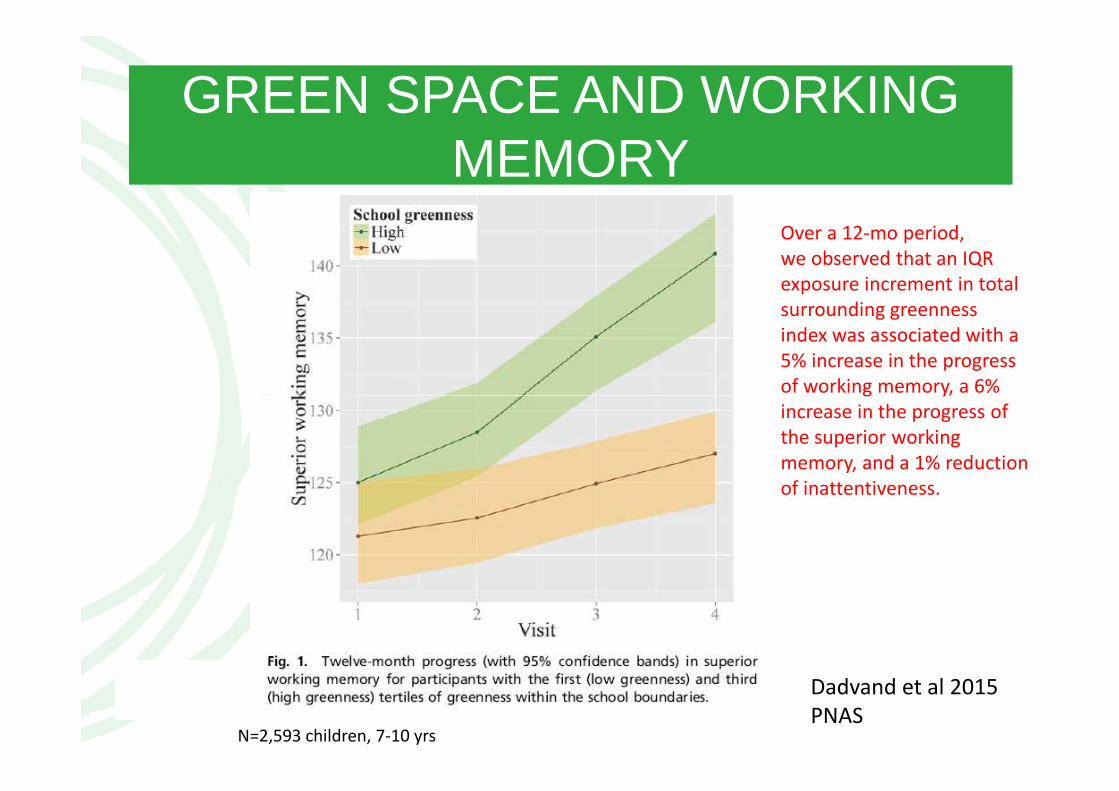
GREEN SPACE AND WORKING MEMORY
Over a 12-mo period,
we observed that an IQR
exposure increment in total
surrounding greenness
index was associated with a
5% increase in the progress
of working memory, a 6%
Dadvand et al 2015
PNASN=2,593 children, 7-10 yrs
of working memory, a 6%
increase in the progress of
the superior working
memory, and a 1% reduction
of inattentiveness.
PHYSICAL INACTIVITY
• Approximately 2.1 million deaths each year are attributable to insufficient physical activity

10%
20%
30%
Risk
reduction
Woodcock et al 2010
40%
50%

ADDED PA THROUGH CYCLING
Donaire-Gonzalez et al 2015
Cycling amounted to 2.1 (95% CI¼0.84, 3.55) hours/week extra of physical
activity for bicycle commuters versus motorized commuters.
CYCLING
• What are the health benefits and risks of cycling for a cyclist:
- increase in physical activity- Increased risk of traffic injuries- Increased risk of traffic injuries- Increased inhalation of air pollution
For the general population; reduced air pollution
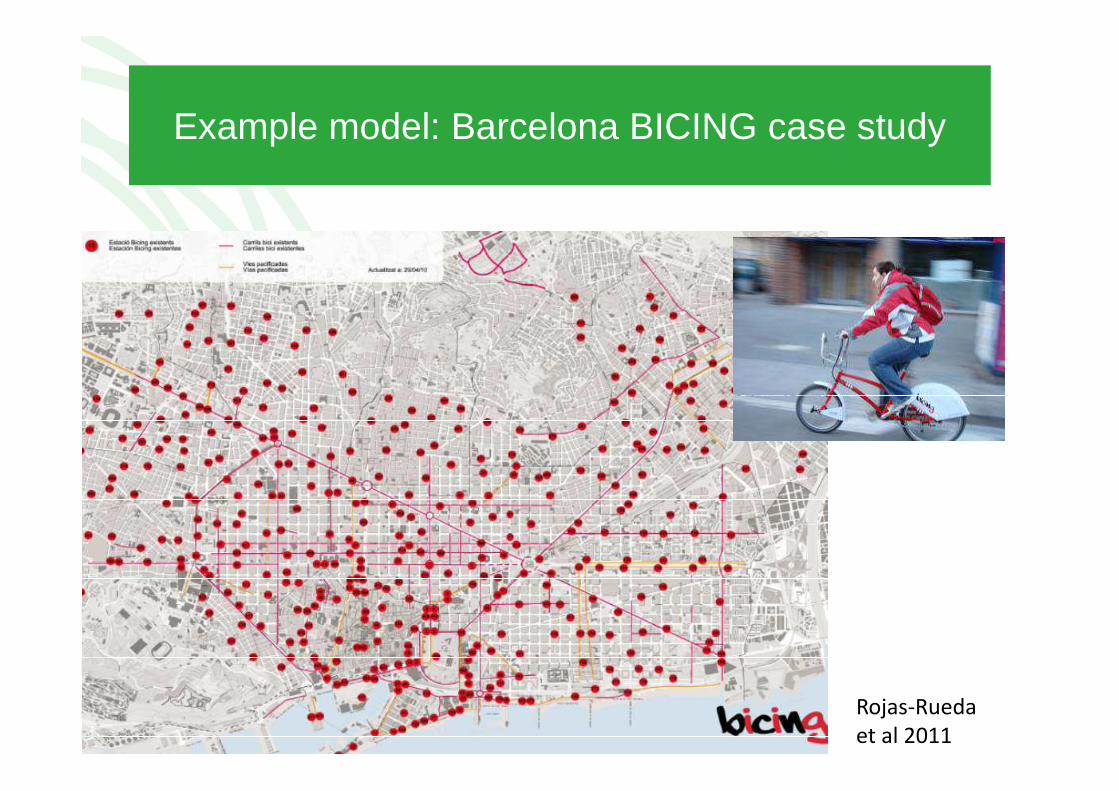
Example model: Barcelona BICING case study
Rojas-Rueda
et al 2011

HEALTH IMPACT ASSESSMENT OF THE BICING SYSTEM
CO2eBuilt Environment /
Mode Choice
Active TransportPolicy• Scenario:
– 25 427 daily bicing commuters “new” to cycling (assume 90% of Bicing user previously drove)
– 4.34 km/work-day
RR=0.72
TrafficInjuriy
PhysicalActivity
Air Pollution
Mortality
EconomicEvaluation
Lifeexpectancy
• Impacts:– Change in mortality
in commuters who shifted from car travel
– CO2 emissions savings
Rojas-Rueda et al 2011

Results: mortality in new cyclist population (n=25 427)
Air pollution Motor vehicle crashes
Physical activity
Relative Risk Bike vs Car
1.002 1.0007 0.80
Attributable 0.002 0.0007 -0.23Attributable fraction of mortality
0.002 -0.23
Deaths / year +0.14 +0.03 -12.46
Economic evaluation
Benefit of lives saved (€/year)c18,420,000
Rough estimate of Bicing costs (€/year)15,000,000
Rojas-Rueda et al 2011

HEALTH IMPACTS OF ACTIVE TRANSPORTATION
There are great health benefits of moving from car to public and active transportation.
Benefits from physical activity well outweigh the risks of air pollution and traffic incidents
Mueller et al 2015
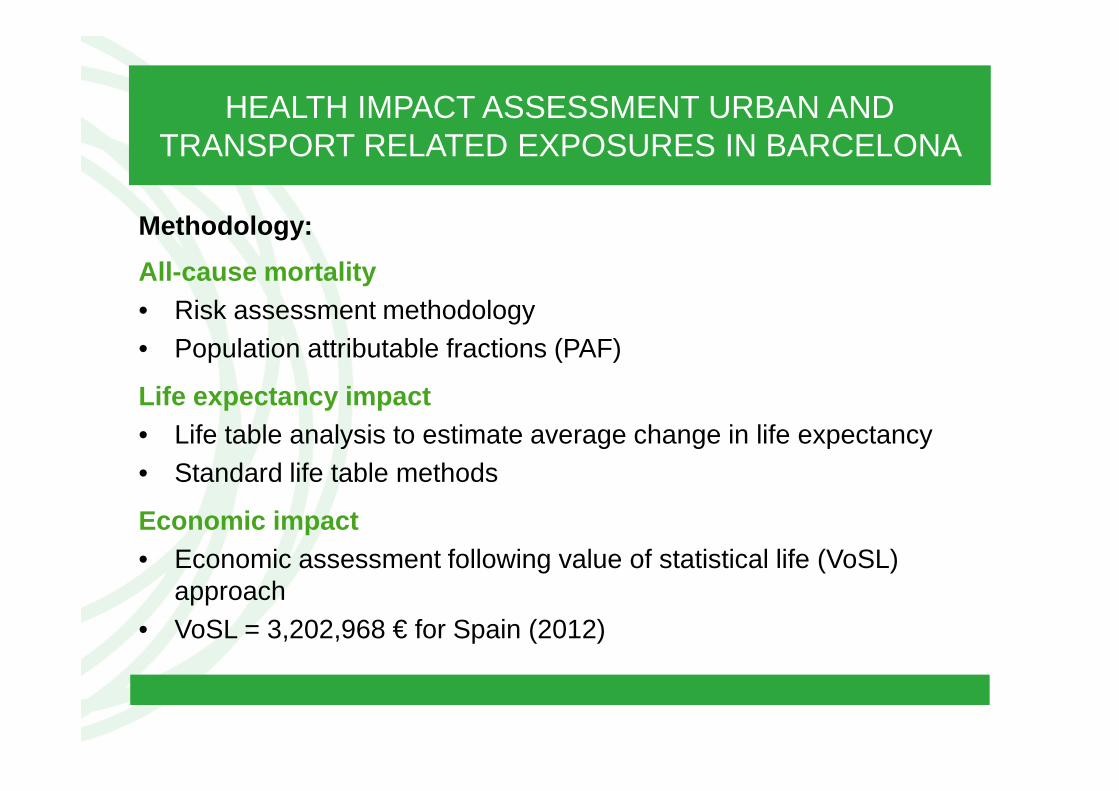
HEALTH IMPACT ASSESSMENT URBAN AND TRANSPORT RELATED EXPOSURES IN BARCELONA
Methodology:
All-cause mortality • Risk assessment methodology• Population attributable fractions (PAF)
Life expectancy impactLife expectancy impact• Life table analysis to estimate average change in life expectancy• Standard life table methods
Economic impact• Economic assessment following value of statistical life (VoSL)
approach• VoSL = 3,202,968 € for Spain (2012)

STUDY SETTING: BARCELONA
Population N=1.6 million (≥20 years N=1.3 million)
Area 101 km2
(high population density)
Climate 18 ºC mean temperature, hot summers, mild winters, low precipitationwinters, low precipitation
Vehicle fleet 500,000 cars and 300,000 motorcycles + large daily suburban commuter fleet
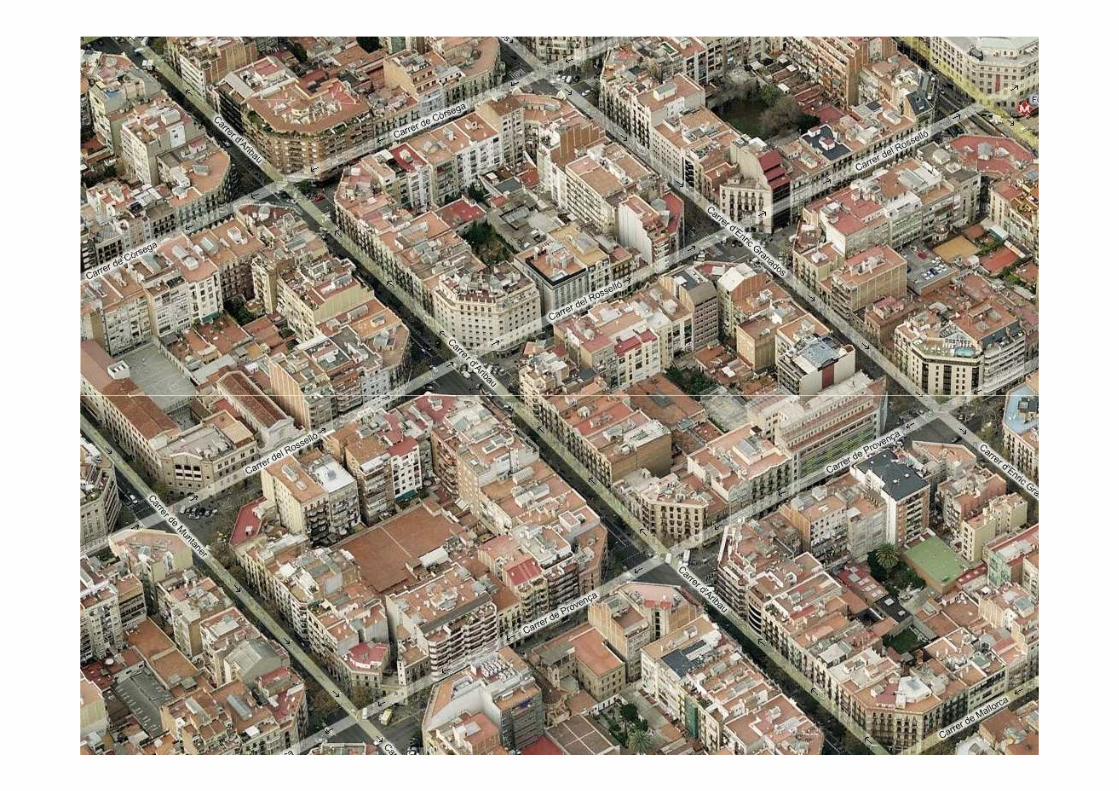
Urban design Narrow street canyonsDense construction of semi-tall buildings (5-6 stories)
Green spaces 7 m2 per resident

EXPOSURE RECOMMENDATIONS
Physical activity (WHO)
150 minutes of moderate-intensity aerobic physical activity or 75 minutes of vigorous intensity aerobic physical activity weekly
Air pollution (WHO) PM2.5 = 10 µg/m3
Noise (WHO) Day time (7:00-23:00 hr) outdoor activity noise levels ≤55 dB(A)levels ≤55 dB(A)
Heat (not available) Modifying urban plan may provide cooling of up to 4 ºC
Green space (EC, WHO)
Access to green space ≥0.5 ha within 300 m linear distance
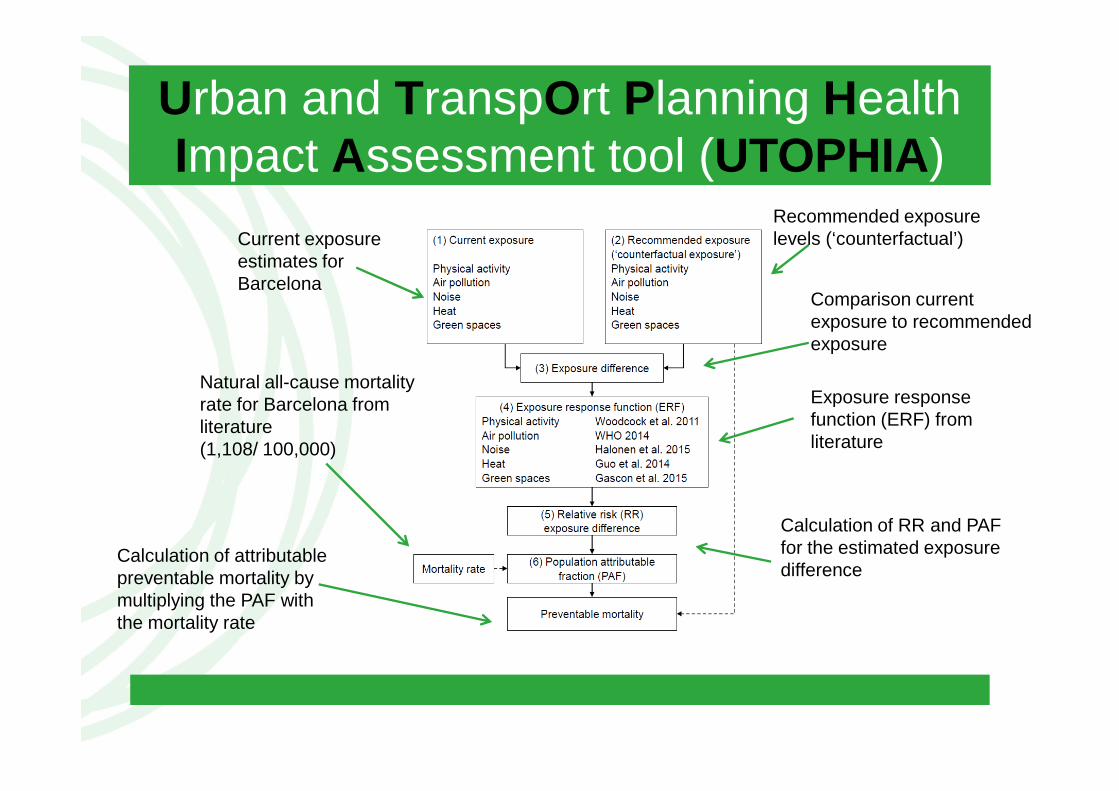
Urban and TranspOrt Planning Health Impact Assessment tool (UTOPHIA)
Current exposure estimates for Barcelona
Recommended exposure levels (‘counterfactual’)
Comparison current exposure to recommended exposure
Exposure response Natural all-cause mortality rate for Barcelona from Exposure response
function (ERF) from literature
Calculation of RR and PAF for the estimated exposure difference
rate for Barcelona from literature (1,108/ 100,000)
Calculation of attributable preventable mortality by multiplying the PAF with the mortality rate
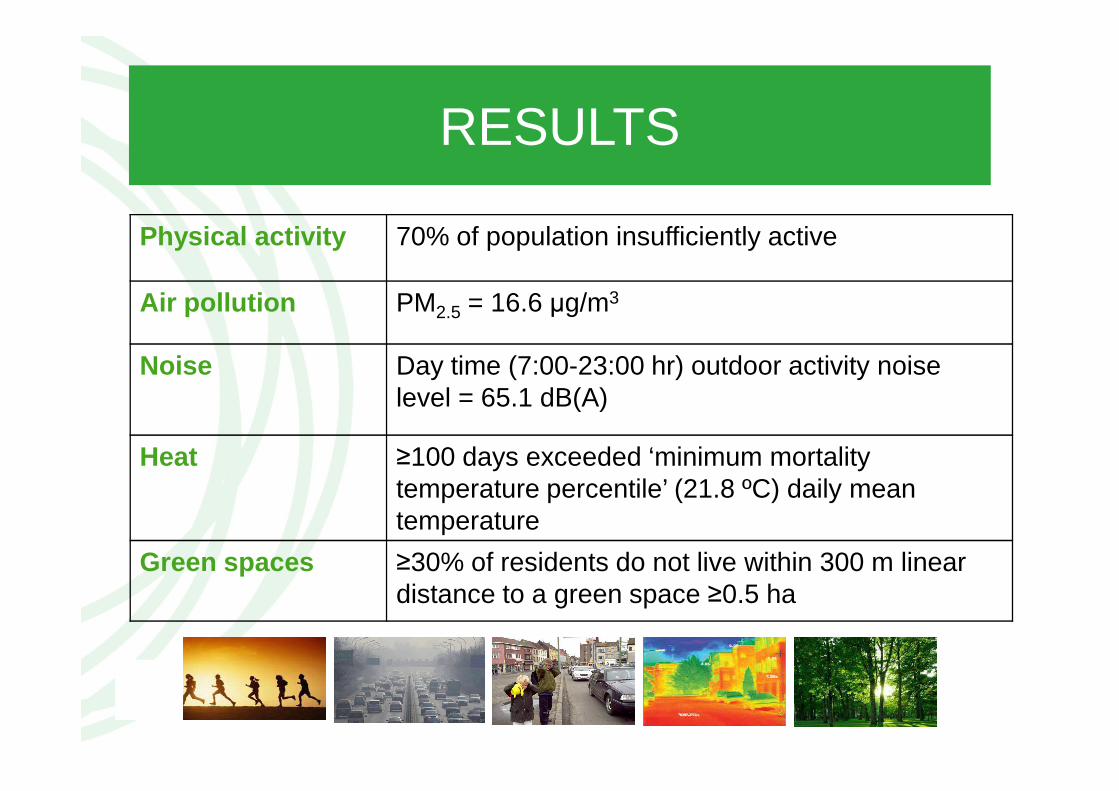
RESULTS
Physical activity 70% of population insufficiently active
Air pollution PM2.5 = 16.6 µg/m3
Noise Day time (7:00-23:00 hr) outdoor activity noise level = 65.1 dB(A)level = 65.1 dB(A)
Heat ≥100 days exceeded ‘minimum mortality temperature percentile’ (21.8 ºC) daily mean temperature
Green spaces ≥30% of residents do not live within 300 m linear distance to a green space ≥0.5 ha
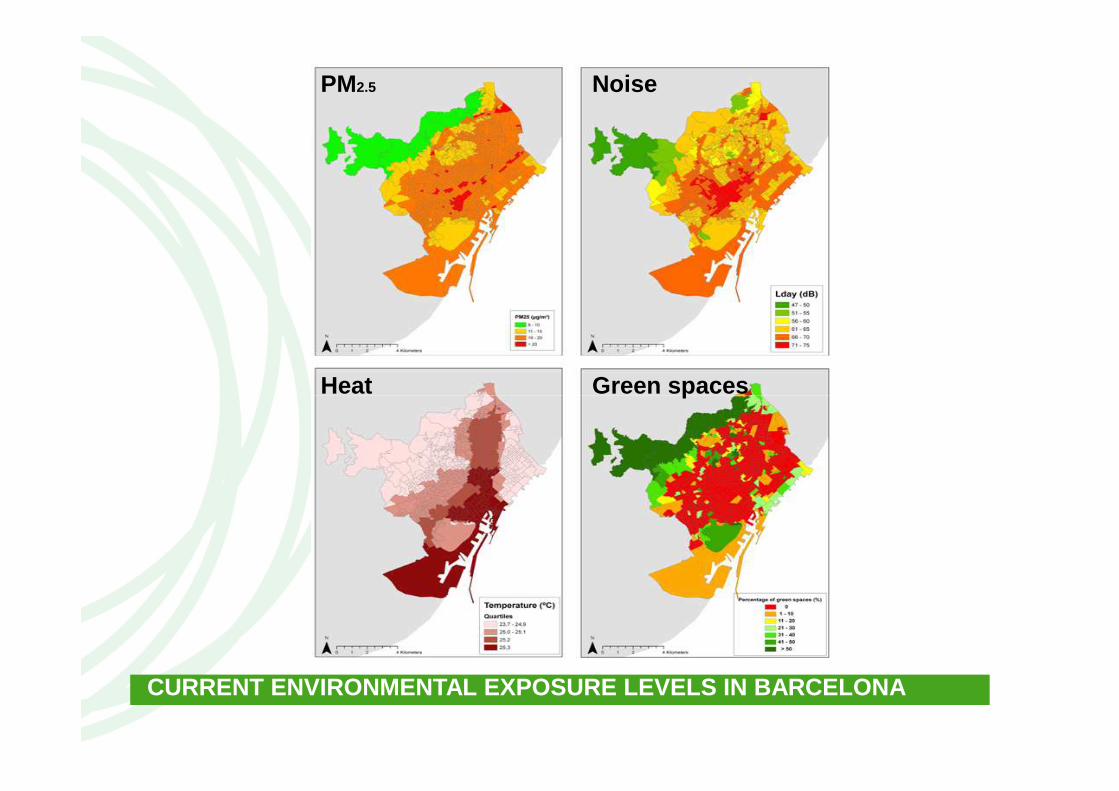
PM2.5 Noise
Heat Green spacesHeat Green spaces
CURRENT ENVIRONMENTAL EXPOSURE LEVELS IN BARCELONA
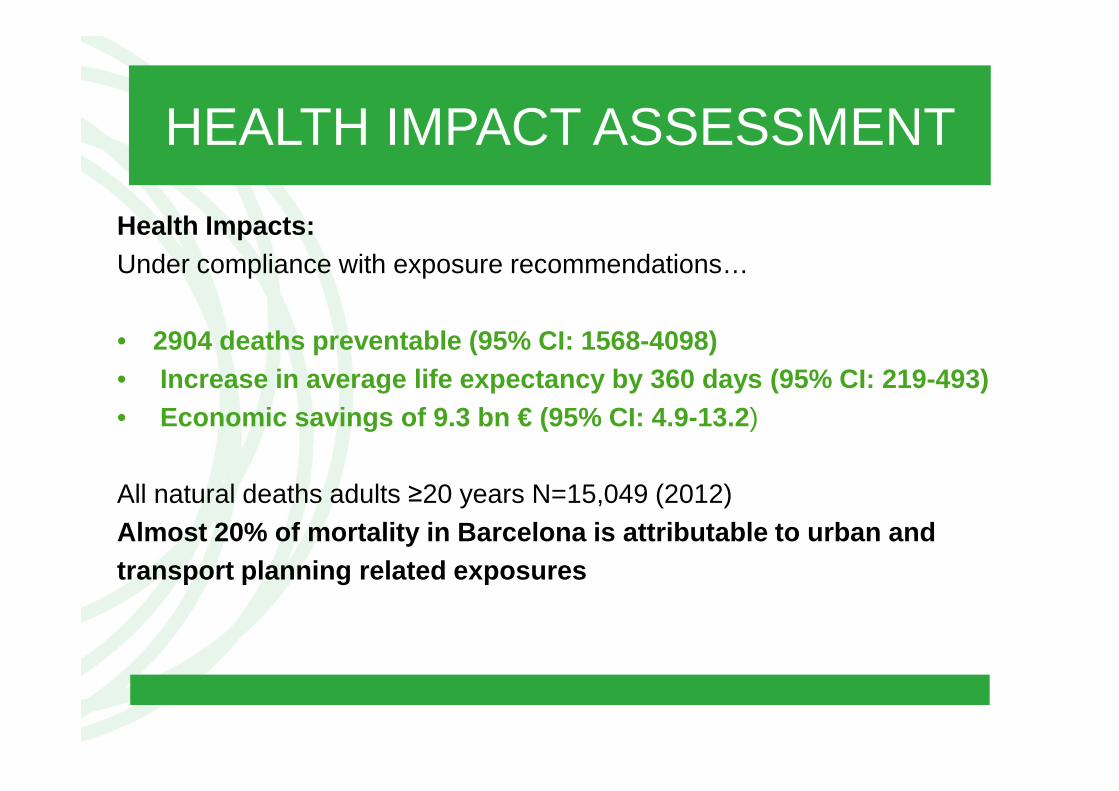
HEALTH IMPACT ASSESSMENT
Health Impacts:Under compliance with exposure recommendations…
• 2904 deaths preventable (95% CI: 1568-4098) • Increase in average life expectancy by 360 days (95 % CI: 219-493) • Economic savings of 9.3 bn € (95% CI: 4.9-13.2 )
All natural deaths adults ≥20 years N=15,049 (2012) Almost 20% of mortality in Barcelona is attributabl e to urban andtransport planning related exposures

ESTIMATED ATTRIBUTABLE DEATHS
1154
659800
1000
1200
1400
659599
376
116
0
200
400
600
Physical activity (95% CI: 858,1577)
Air pollution (95% CI: 386,834)
Noise(95% CI: 0,1009)
Heat(95% CI: 324,442)
Green spaces (95% CI: 0,236)
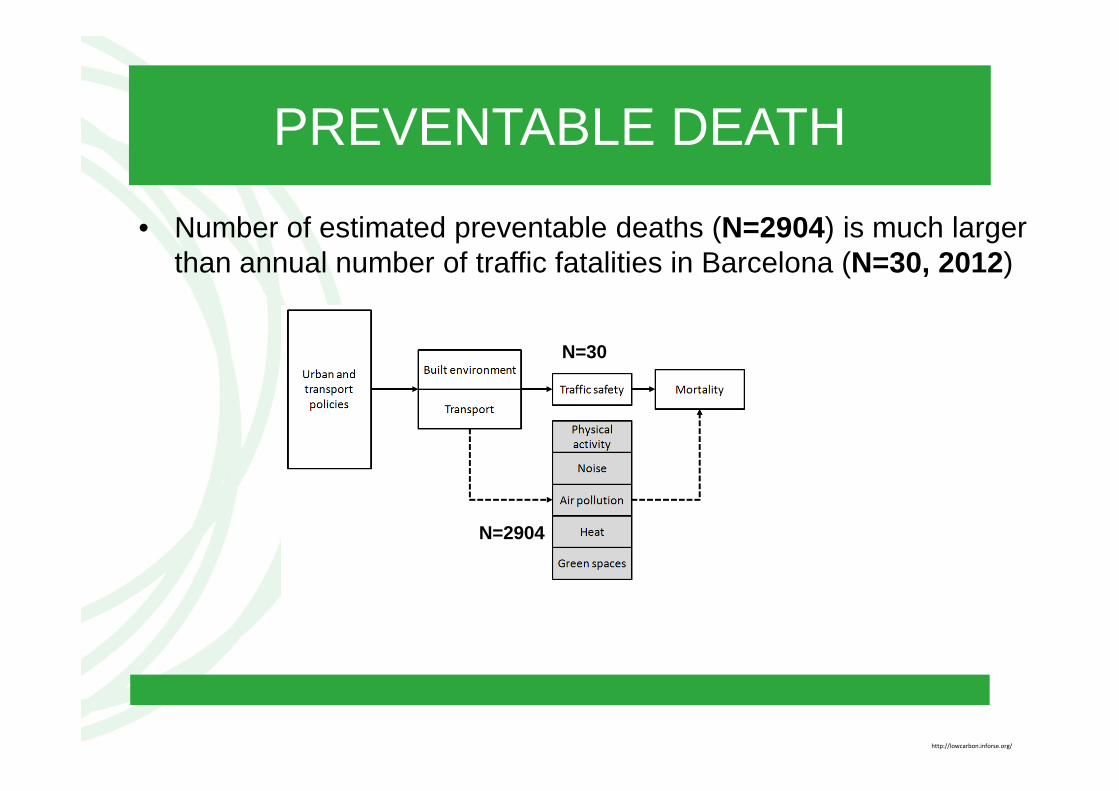
PREVENTABLE DEATH
• Number of estimated preventable deaths (N=2904) is much larger than annual number of traffic fatalities in Barcelona (N=30, 2012)
N=30
N=2904
http://lowcarbon.inforse.org/
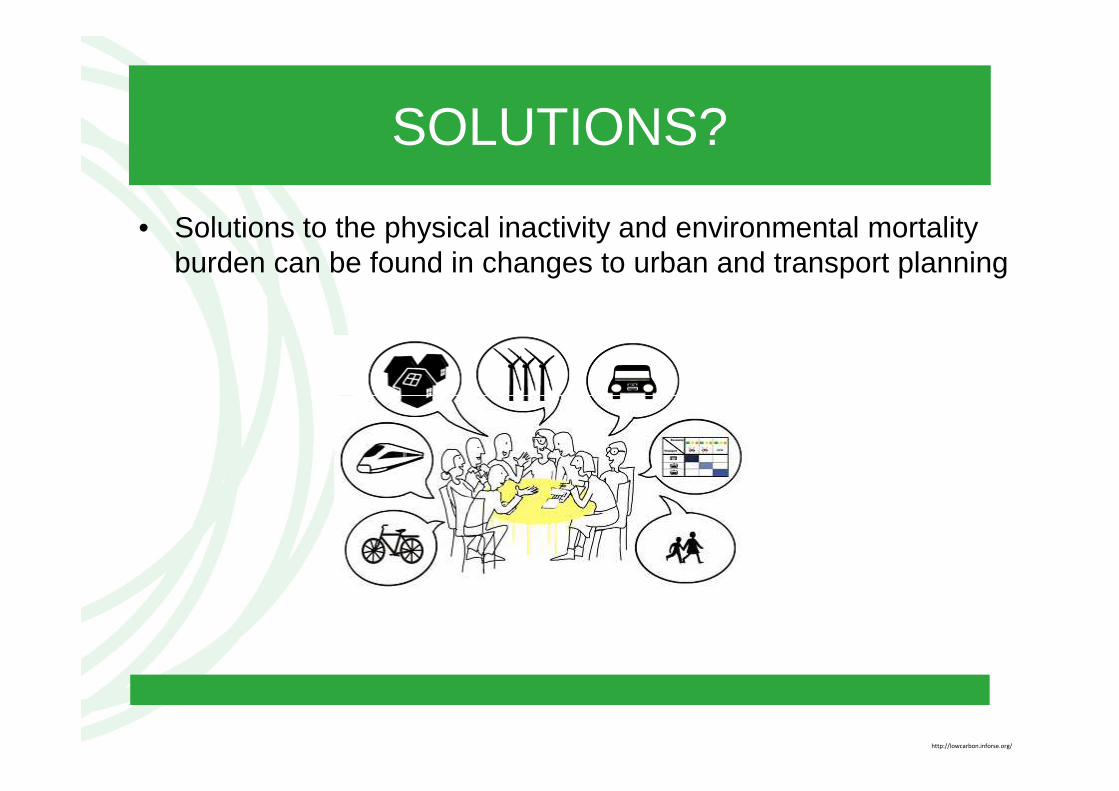
SOLUTIONS?
• Solutions to the physical inactivity and environmental mortality burden can be found in changes to urban and transport planning
http://lowcarbon.inforse.org/
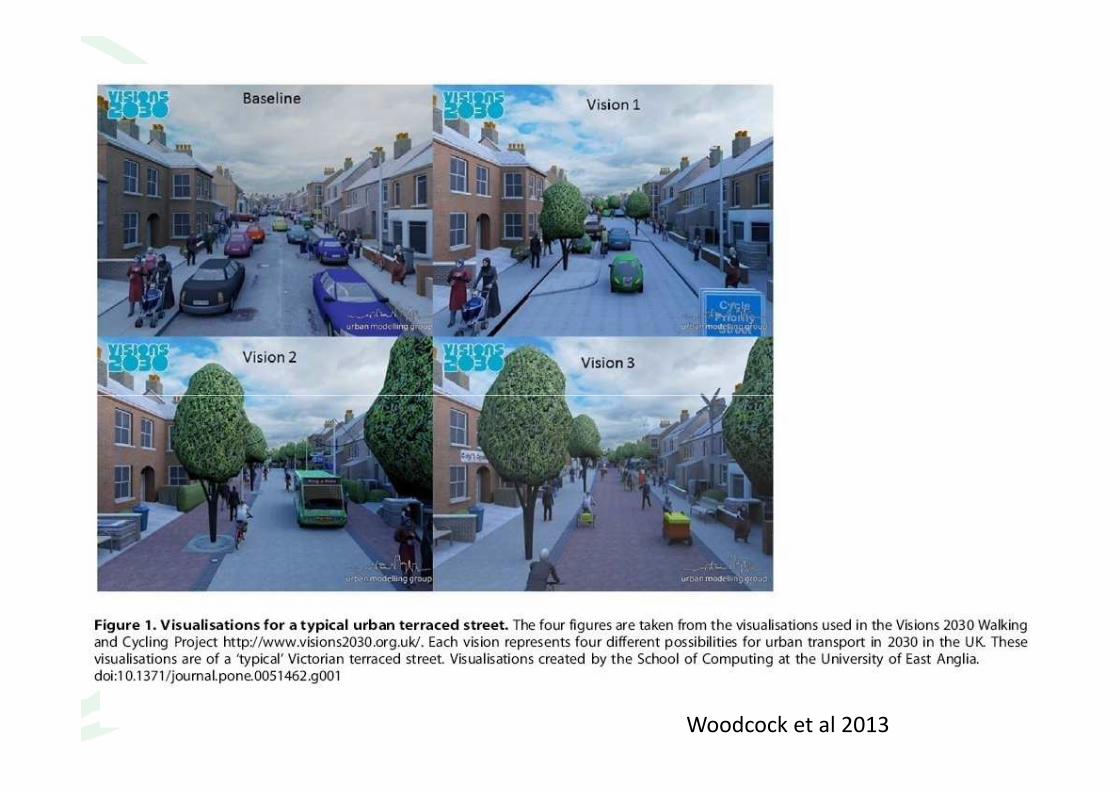
Woodcock et al 2013


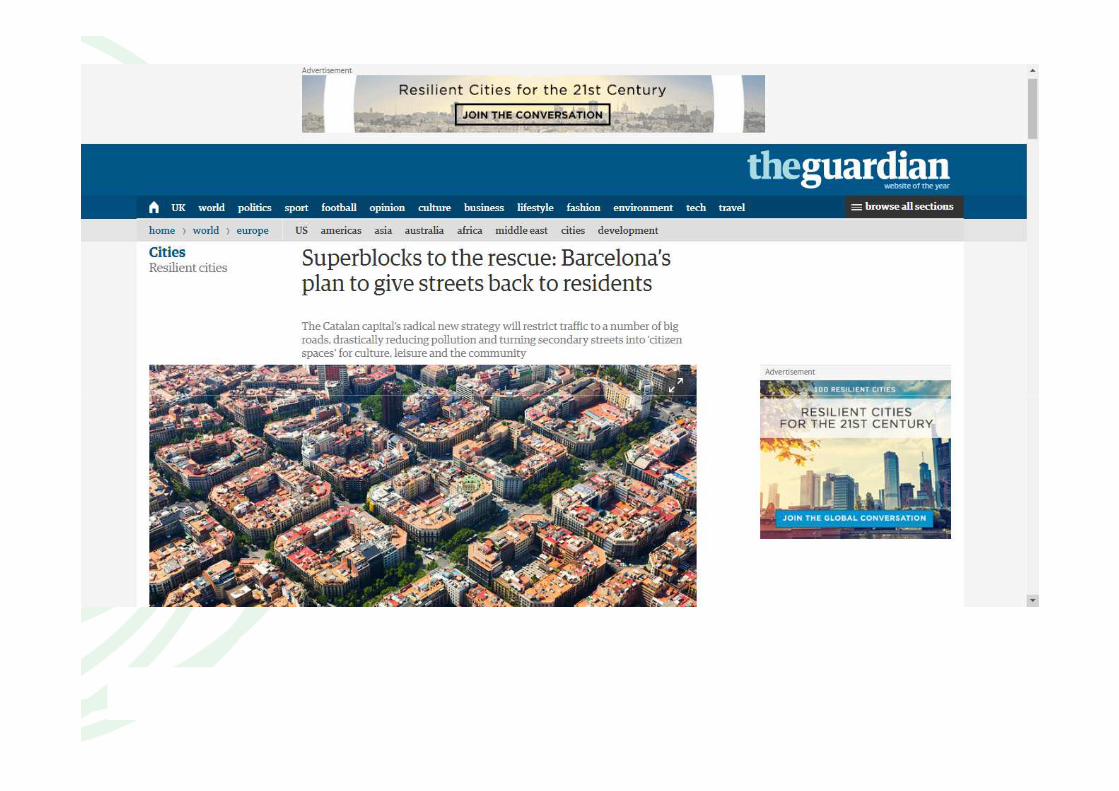
CAR FREE CITIES
• Car free cities can have a considerable benefit on health through potential reduction in air pollution, noise, and heat island effects and increase in physical activity and green space and thereby improving health
• The move towards public and active transportation in this must be understood as crucial, as physical activity is one of the main drivers understood as crucial, as physical activity is one of the main drivers for health and lack of time has been repeatedly listed as a detriment of physical activity
• Urban and transport planning practices such as making cities denser, providing mixed land-use (e.g. home, work, shops), street furniture, safe urban environments and pedestrian and cyclist-friendly amenities could promote positive physical activity patterns and build them into daily routines
Physical inactivityAir pollution
Noise
• Leading risk factors in GBD Study• Cause ≥5 million deaths globally
Green space
Exposures in cities
Heat
• Few green spaces despite benefits for physical and mental health
• Motorized traffic exposes 40% of Europeans to ≥55 dB(A)
• Emissions cause anthropogenic heat that together with re-radiation of construction contribute to urban heat islands
Green space
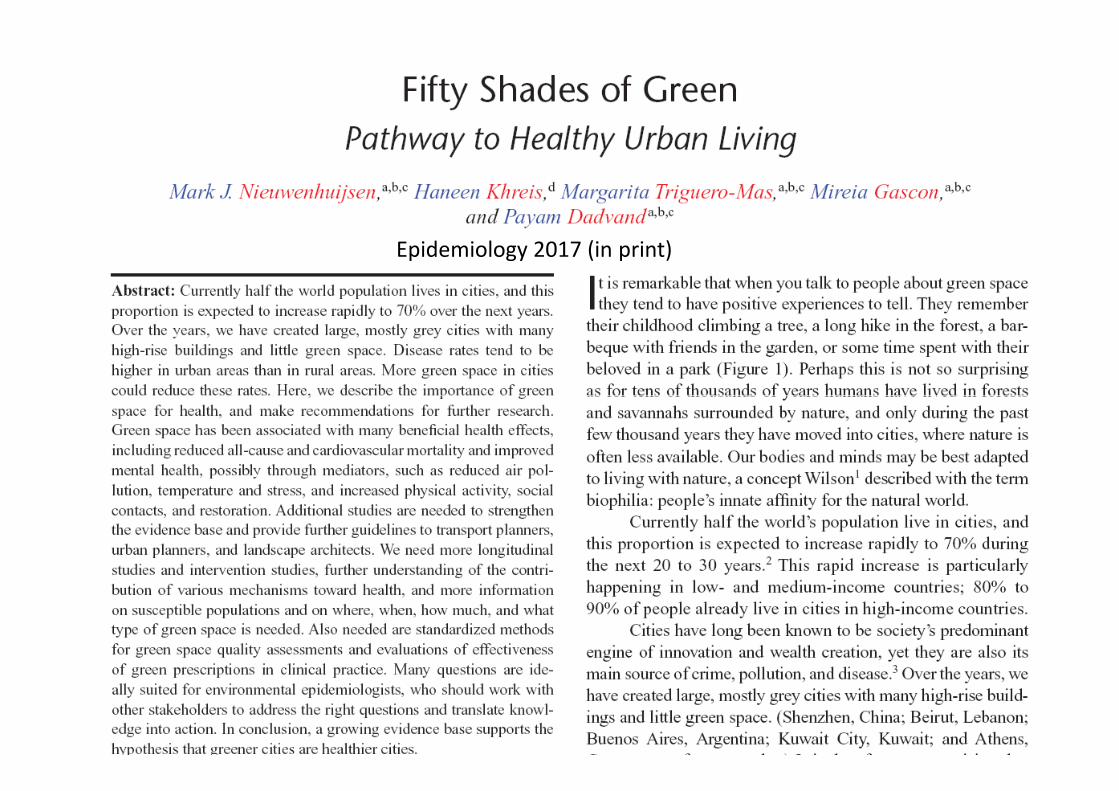
Epidemiology 2017 (in print)
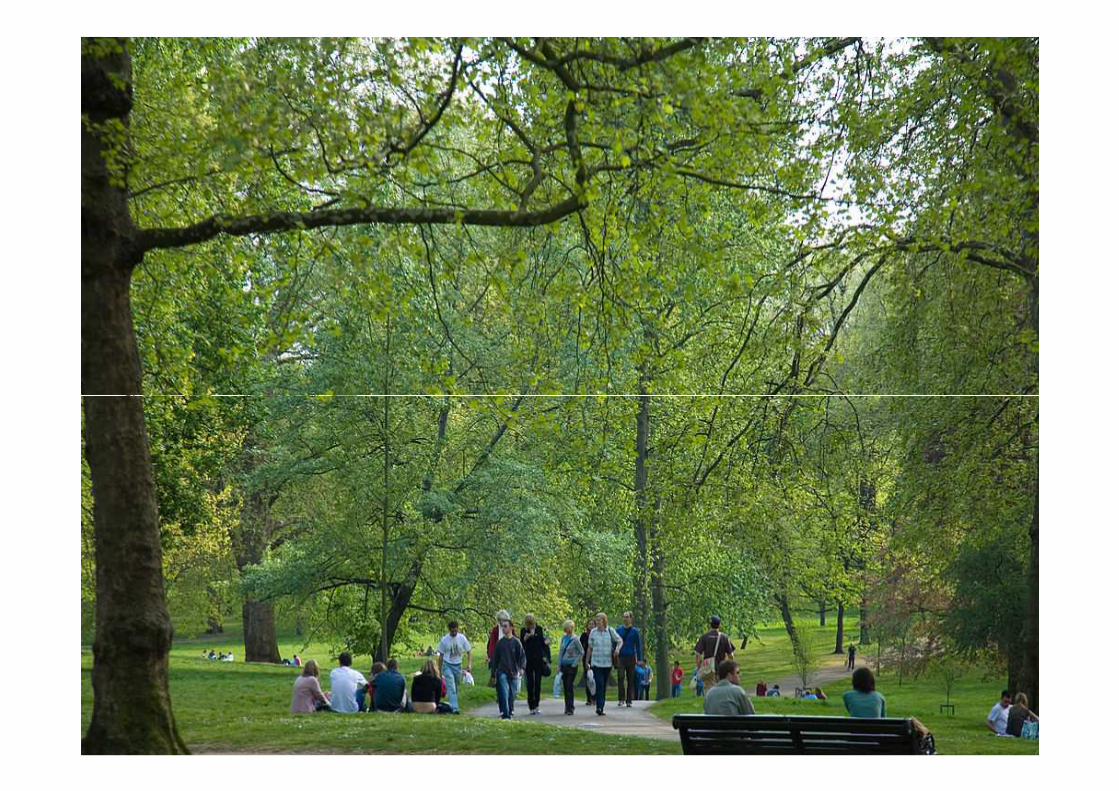
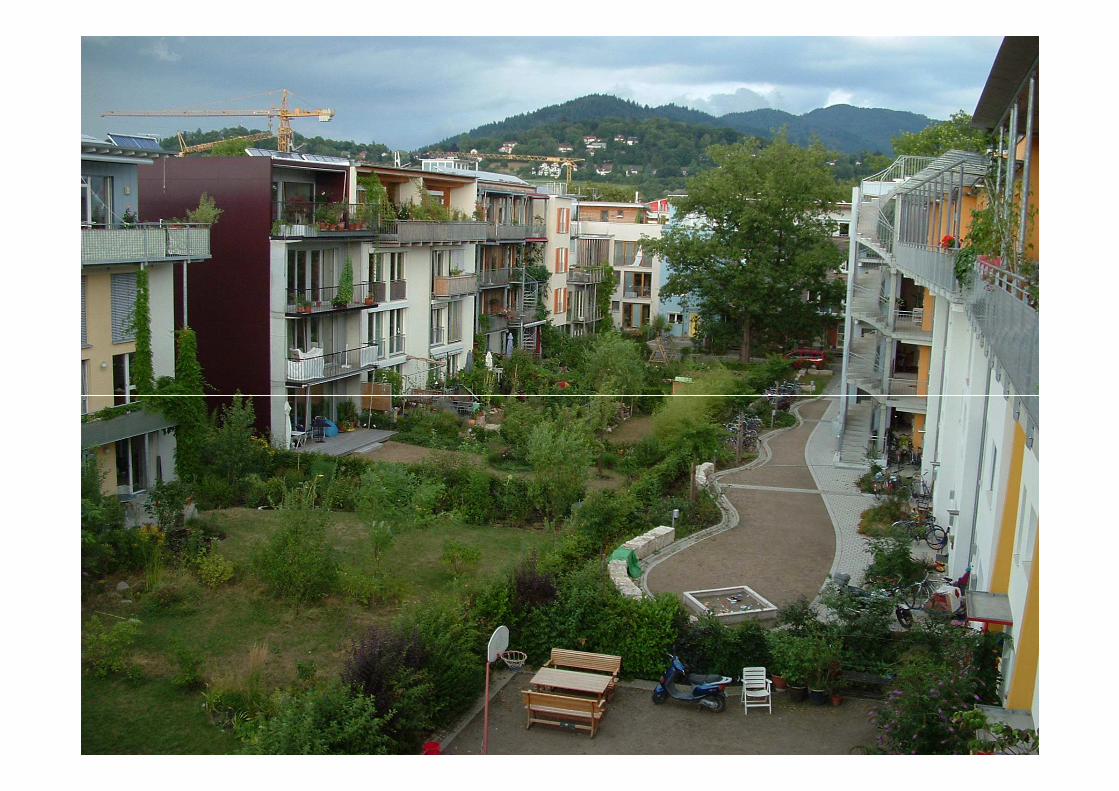
GREEN AND LIVEABLE
• Greening cities has many health benefits including longer life expectancy, fewer mental health problems, better cognitive function, better mood and healthier babies
• It mitigates air pollution, heat and noise levels.• It mitigates air pollution, heat and noise levels.• Replacing roads and parking with green environments
can be one way forward to change an environment from detrimental to beneficial.

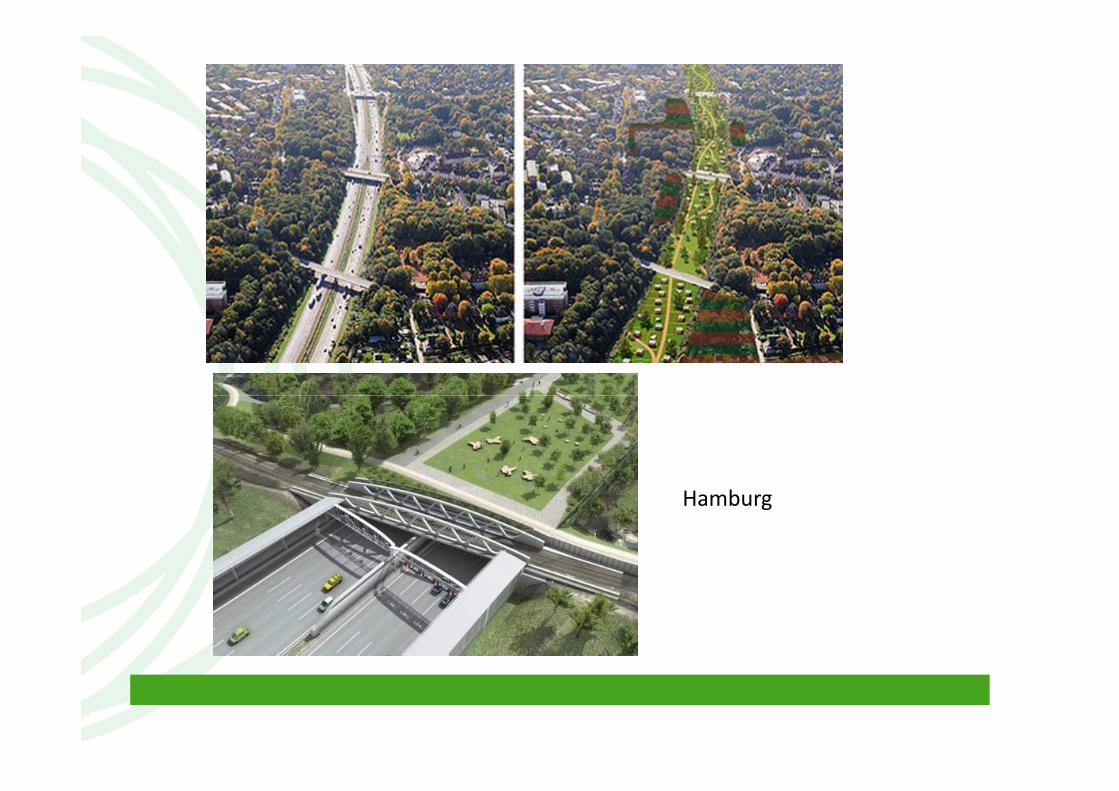
Hamburg

SYSTEMIC APPROACHES
• It is important that we have a more systemic approach to our cities,
bringing together • Urban planners• Urban planners• Transport planners• Environmentalist• Public health professionals• Economists

STAKEHOLDER INVOLVEMENT
• The planning of car free and green cities requires long term political commitment at the highest level and public acceptance.
• Citizen and business participation is • Citizen and business participation is essential to obtain commitment for the proposed changes and vision.
• Favourable media interest


http://www.transglobalhealth.
org/#/joint-phd-
degree/research-projects/


Page 70