health expectancy in denmark 3 rd meeting of the task force on health expectancies luxembourg, 12...
TRANSCRIPT

Health expectancy in Denmark
3rd Meeting of the Task Force on Health Expectancies
Luxembourg, 12 December 2006
Henrik Brønnum-Hansen
Secular trends
Social gradient
Social differences in the burden of diseases
Impact of selected risk factors
Health expectancy in Denmark
12 December 2006. Henrik Brønnum-Hansen 2
Secular trends
Health expectancy in Denmark
12 December 2006. Henrik Brønnum-Hansen 3
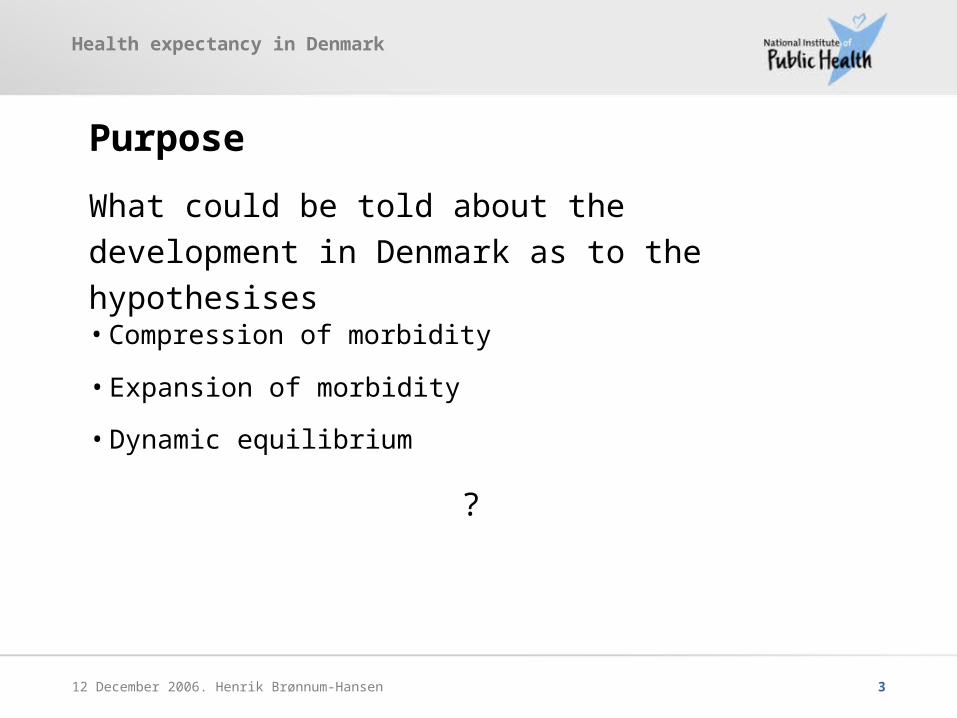
Purpose
What could be told about the development in
Denmark as to the hypothesises
• Compression of morbidity
• Expansion of morbidity
• Dynamic equilibrium
?

Health expectancy in Denmark
12 December 2006. Henrik Brønnum-Hansen 4
Health interview surveys carried out by the National
Institute of Public Health.
Surveys in 1987, 1991, 1994, 2000 and 2005
Standard life tables from Statistics Denmark for
1986–1987, 1990–1991, 1993–1994, 1999–2000 and
2004–2005
Data sources
New data!

Health expectancy in Denmark
12 December 2006. Henrik Brønnum-Hansen 5
Methods
Health expectancy by Sullivan’s method
Expected lifetime in various health states
• Self-rated health
• Functional limitations
• Long-standing, limiting illness
Health expectancy in Denmark
12 December 2006. Henrik Brønnum-Hansen 6
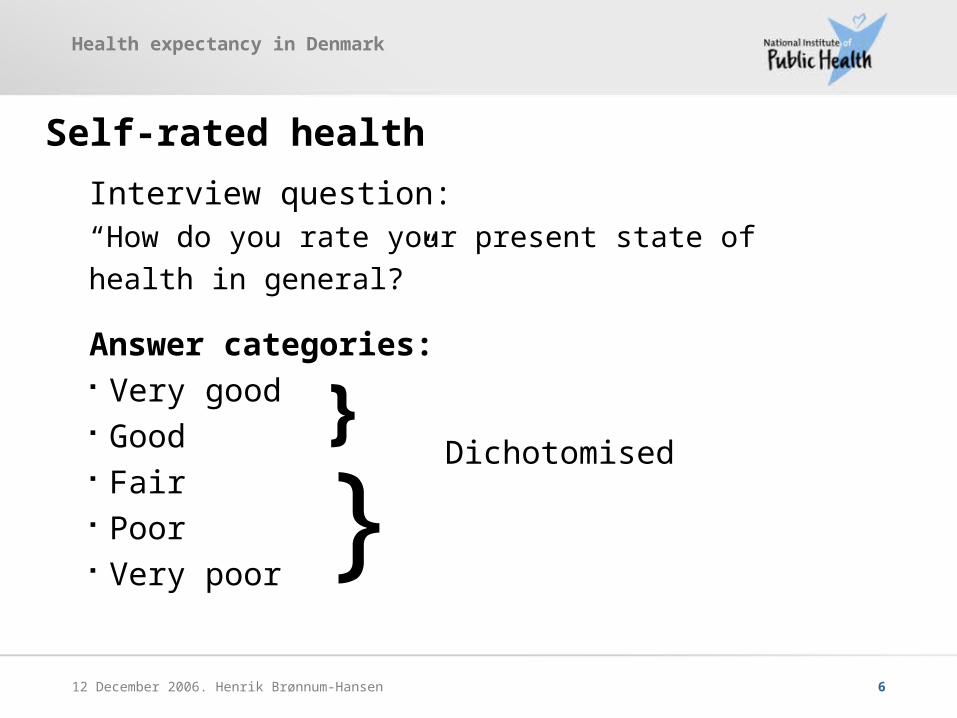
Interview question:“How do you rate your present state of health in general?”
Answer categories: Very good Good Fair Poor Very poor
Self-rated health
}
}Dichotomised
Health expectancy in Denmark
12 December 2006. Henrik Brønnum-Hansen 7
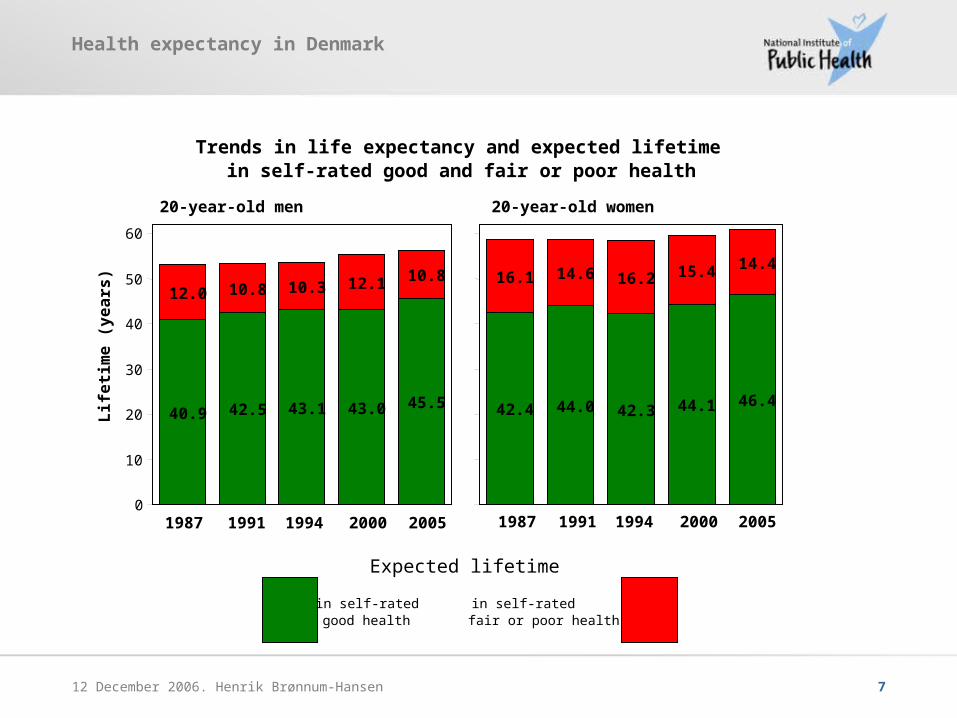
40.9 42.5 43.1 43.0 45.5
12.0 10.8 10.3 12.1 10.8
0
10
20
30
40
50
60
Lif
eti
me (
years
)
1994 2000
20-year-old men
20051987 1991
Trends in life expectancy and expected lifetimein self-rated good and fair or poor health
42.4 44.0 42.3 44.1 46.4
16.1 14.6 16.2 15.4 14.4
0
10
20
30
40
50
60
1994 2000
20-year-old women
20051987 1991
Expected lifetime
in self-ratedgood health
in self-ratedfair or poor health
Health expectancy in Denmark
12 December 2006. Henrik Brønnum-Hansen 8
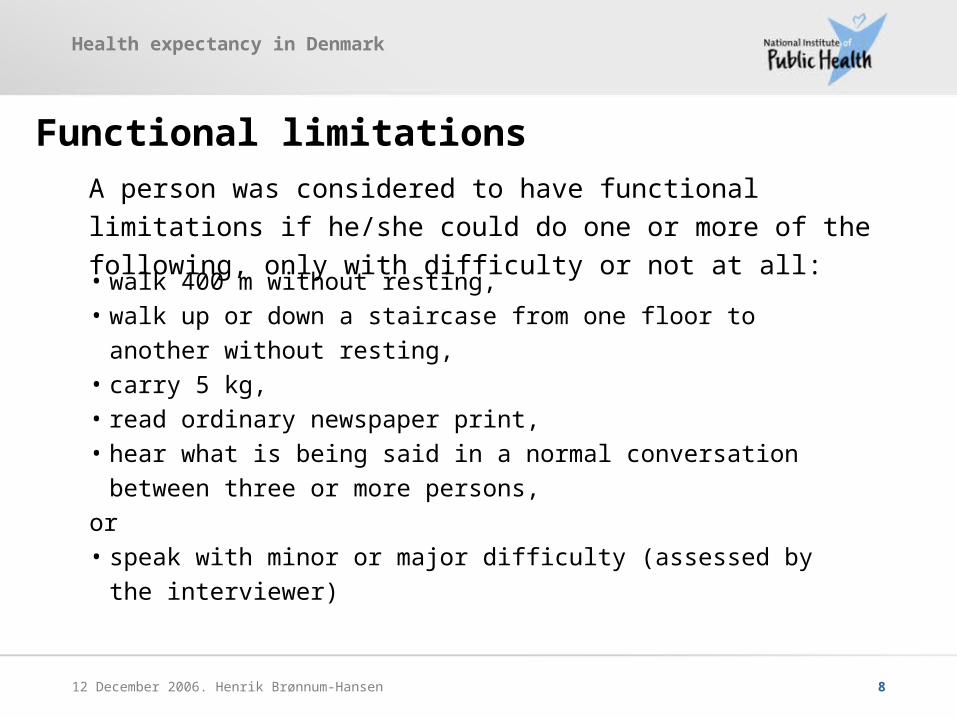
Functional limitations
• walk 400 m without resting,• walk up or down a staircase from one floor to another without resting,• carry 5 kg,• read ordinary newspaper print,• hear what is being said in a normal conversation between three or more
persons,
or• speak with minor or major difficulty (assessed by the interviewer)
A person was considered to have functional limitations if he/she
could do one or more of the following, only with difficulty or not at all:

Health expectancy in Denmark
12 December 2006. Henrik Brønnum-Hansen 9
12.2 13.2 14.7 15.5
5.2 4.44.1
4.3
0
5
10
15
20
Lif
eti
me (
years
)
1994 2000
60-year-old men
20051987
Trends in life expectancy and expected lifetimewithout and with functional limitations
13.3 13.114.7 15.6
8.4 8.47.3
7.4
0
5
10
15
20
1994 2000
60-year-old women
20051987
Expected lifetime
without functionallimitations
with functionallimitations
Health expectancy in Denmark
12 December 2006. Henrik Brønnum-Hansen 10
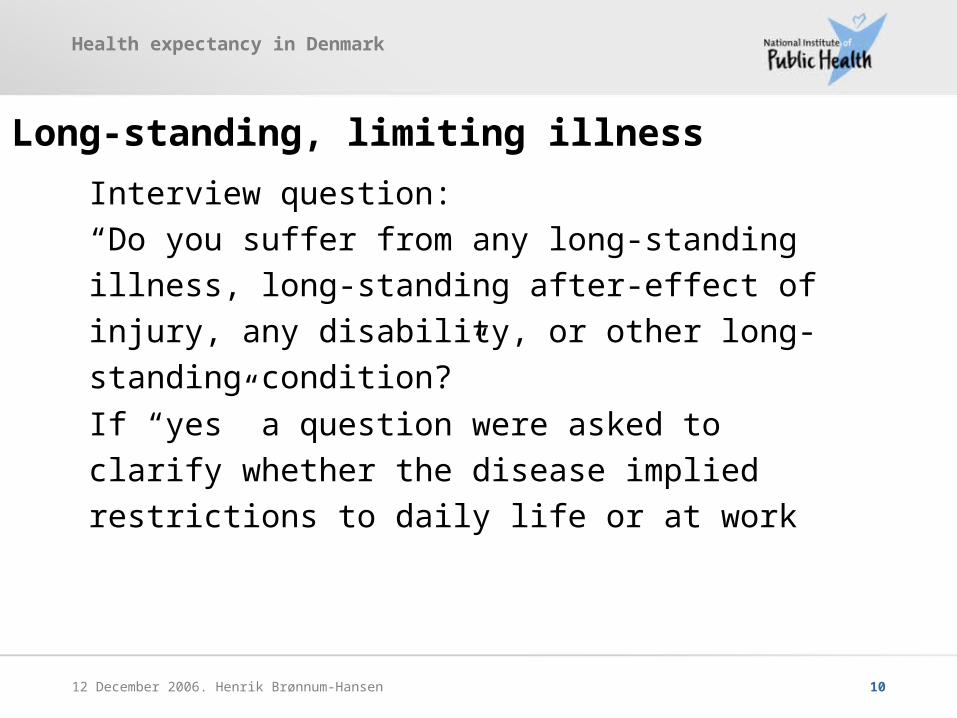
Interview question:
“Do you suffer from any long-standing illness, long-
standing after-effect of injury, any disability, or other
long-standing condition?”
If “yes” a question were asked to clarify whether the
disease implied restrictions to daily life or at work
Long-standing, limiting illness
Health expectancy in Denmark
12 December 2006. Henrik Brønnum-Hansen 11
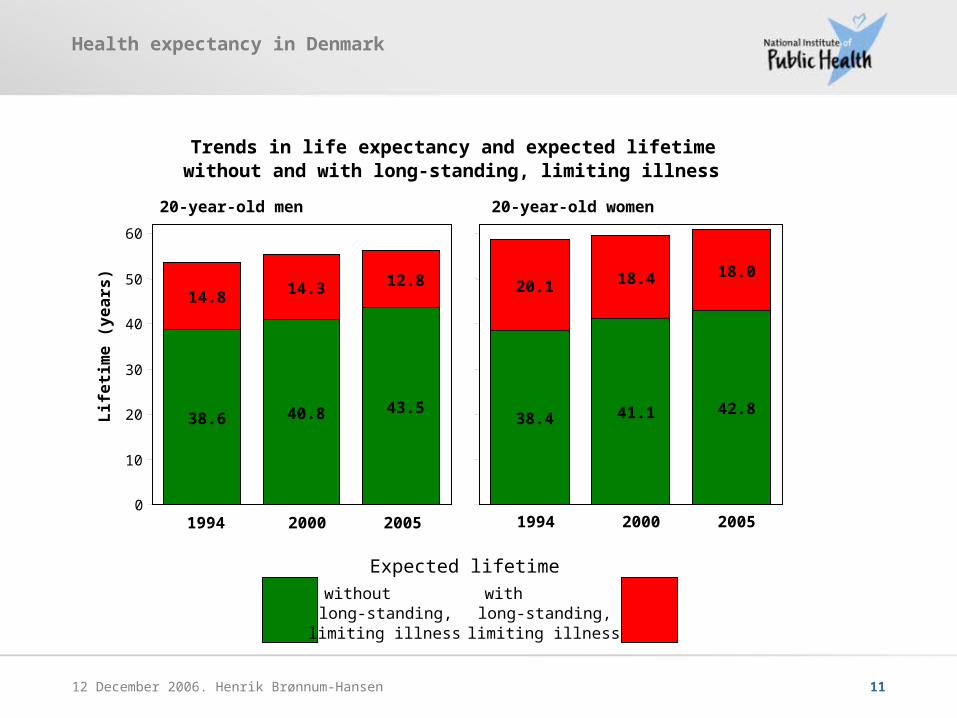
38.6 40.8 43.5
14.8 14.3 12.8
0
10
20
30
40
50
60
Lif
eti
me (
years
)
1994 2000
20-year-old men
2005
Trends in life expectancy and expected lifetimewithout and with long-standing, limiting illness
38.4 41.1 42.8
20.1 18.4 18.0
0
10
20
30
40
50
60
1994 2000
20-year-old women
2005
Expected lifetime withoutlong-standing,limiting illness
withlong-standing,limiting illness
Health expectancy in Denmark
12 December 2006. Henrik Brønnum-Hansen 12
Compression of morbidity is observed in Denmark
when health expectancy is measured by
Conclusions
• Self-rated health
• Functional limitations
• Long-standing, limiting illness
Health expectancy in Denmark
12 December 2006. Henrik Brønnum-Hansen 13
Social gradient
Health expectancy in Denmark
12 December 2006. Henrik Brønnum-Hansen 14
Purpose
To estimate social inequalities as to expected lifetime
without and with long-standing, limiting illness
Social classification
Educational level
Health expectancy in Denmark
12 December 2006. Henrik Brønnum-Hansen 15
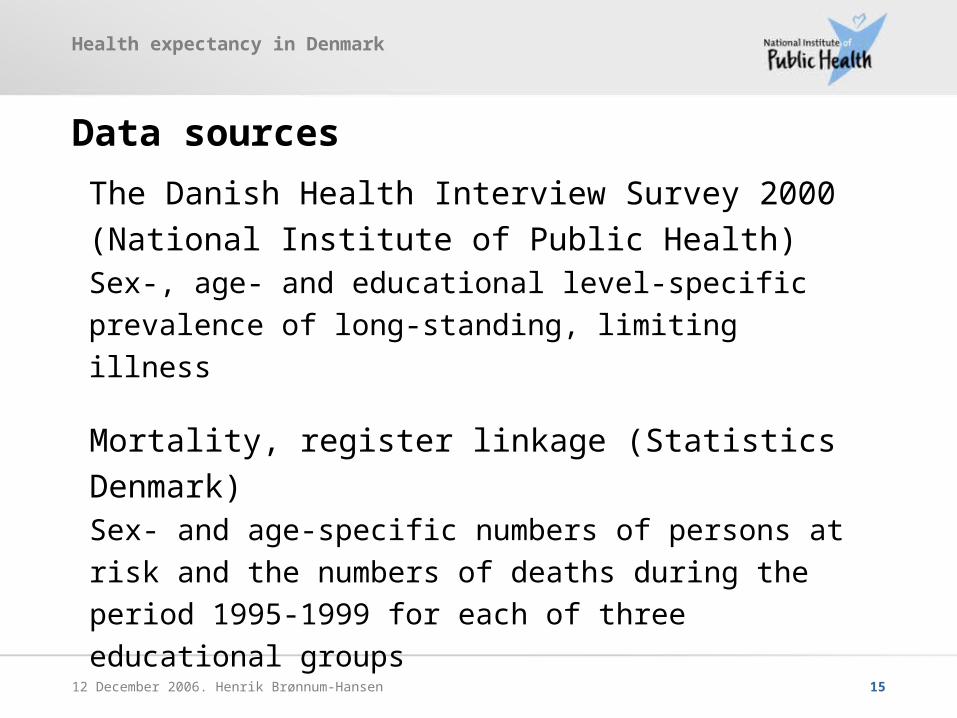
The Danish Health Interview Survey 2000
(National Institute of Public Health)Sex-, age- and educational level-specific prevalence of
long-standing, limiting illness
Mortality, register linkage (Statistics Denmark)Sex- and age-specific numbers of persons at risk and the
numbers of deaths during the period 1995-1999 for each of
three educational groups
Data sources

Health expectancy in Denmark
12 December 2006. Henrik Brønnum-Hansen 16
Information about schooling, vocational training and further
education
Register information (Statistics Denmark)
Questions in the health interview survey (National Institute of Public
Health)
Educational level
Three levels:
• Low
• Medium
• High
Health expectancy in Denmark
12 December 2006. Henrik Brønnum-Hansen 17
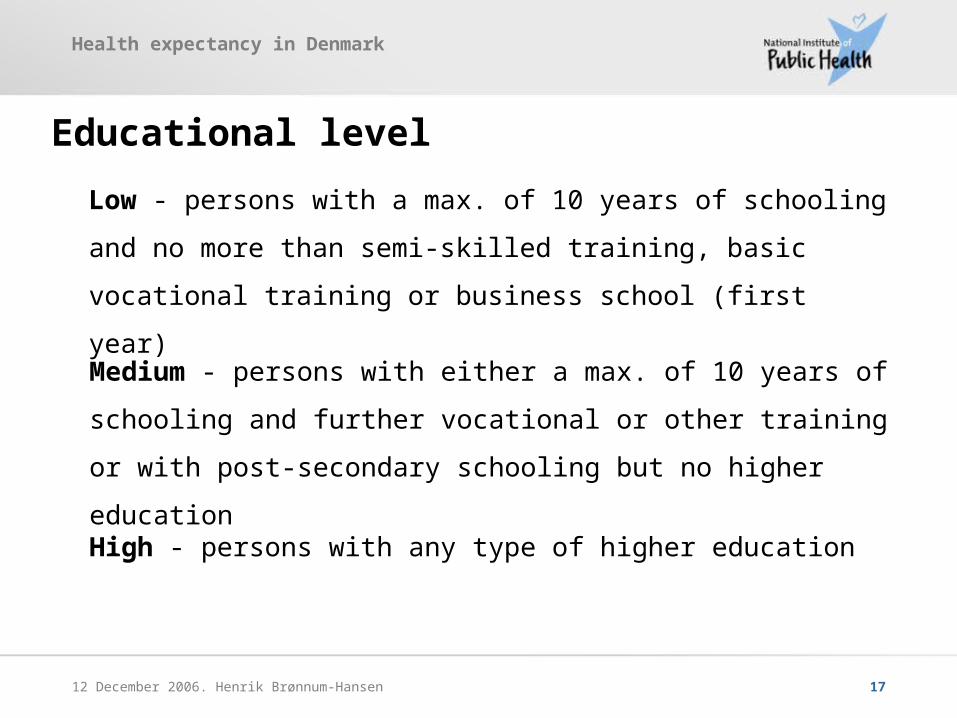
Low - persons with a max. of 10 years of schooling and no more
than semi-skilled training, basic vocational training or business
school (first year)
Educational level
Medium - persons with either a max. of 10 years of schooling and
further vocational or other training or with post-secondary schooling
but no higher education
High - persons with any type of higher education
Health expectancy in Denmark
12 December 2006. Henrik Brønnum-Hansen 18
0
10
20
30
40
50
Exp
ecte
d li
fe-y
ears
High Medium AllLow
Life expectancy30-year-old men. Denmark 2000
Educational level
0
10
20
30
40
50
Exp
ecte
d li
fe-y
ears
High Medium AllLow
Life expectancy30-year-old women. Denmark 2000
Educational level
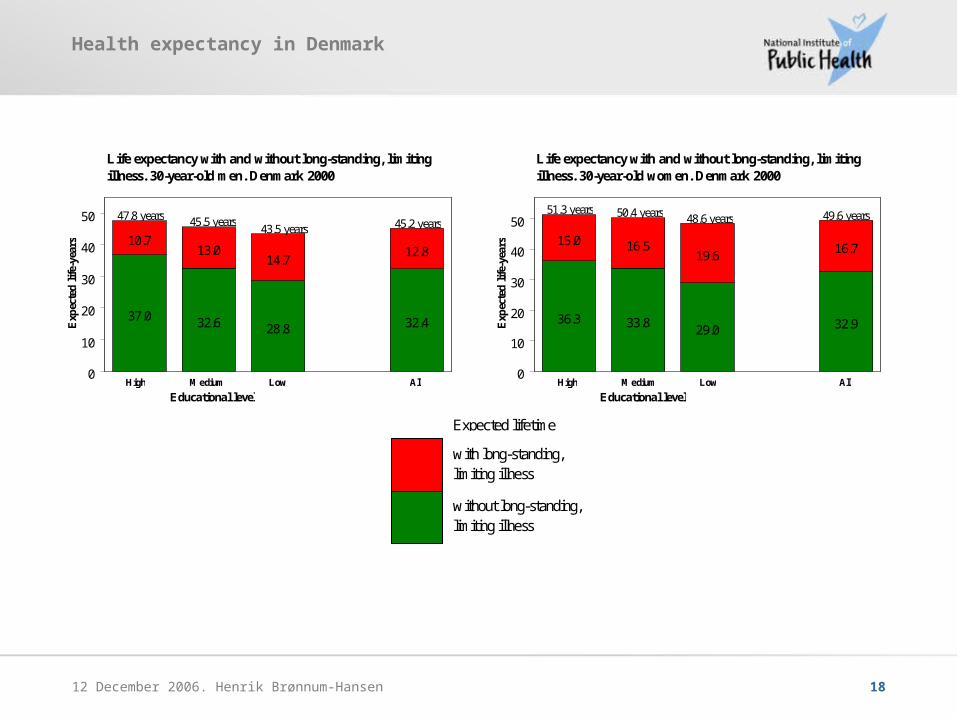
with long-standing, limiting illness
Expected lifetime
without long-standing, limiting illness
37.0 32.6 28.8 32.4
13.014.7
12.810.7
0
10
20
30
40
50
Exp
ecte
d l
ife-
year
s
High Medium AllLow
Life expectancy with and without long-standing, limiting illness. 30-year-old men. Denmark 2000
47.8 years 45.5 years43.5 years 45.2 years
Educational level
36.3 33.829.0 32.9
15.0 16.519.6
16.7
0
10
20
30
40
50
Exp
ecte
d l
ife-
year
s
High Medium AllLow
Life expectancy with and without long-standing, limiting illness. 30-year-old women. Denmark 2000
51.3 years 50.4 years 48.6 years 49.6 years
Educational level
Health expectancy in Denmark
12 December 2006. Henrik Brønnum-Hansen 19
Social differences in the burden of diseases

Health expectancy in Denmark
12 December 2006. Henrik Brønnum-Hansen 20
Purpose
To quantify the health impact of diseases with high
prevalence or mortality, and to evaluate social
differences in the burden of long-standing illness
Health expectancy in Denmark
12 December 2006. Henrik Brønnum-Hansen 21
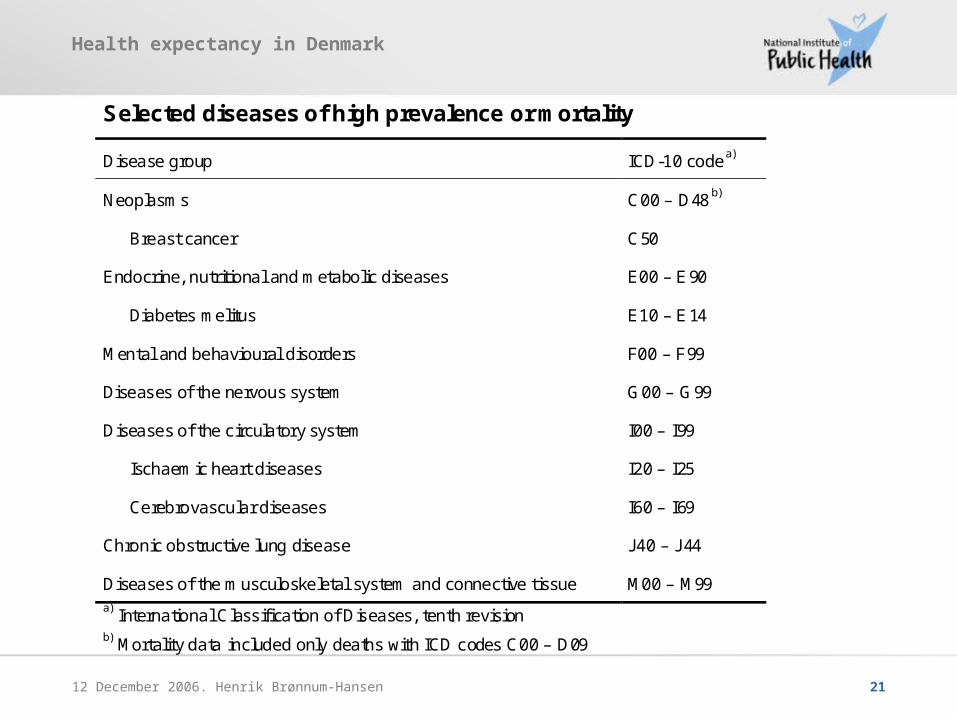
Selected diseases of high prevalence or mortality
Disease group ICD-10 code a)
Neoplasms C00 – D48 b)
Breast cancer C50
Endocrine, nutritional and metabolic diseases E00 – E90
Diabetes melitus E10 – E14
Mental and behavioural disorders F00 – F99
Diseases of the nervous system G00 – G99
Diseases of the circulatory system I00 – I99
Ischaemic heart diseases I20 – I25
Cerebrovascular diseases I60 – I69
Chronic obstructive lung disease J40 – J44
Diseases of the musculoskeletal system and connective tissue M00 – M99 a) International Classification of Diseases, tenth revision b) Mortality data included only deaths with ICD codes C00 – D09
Health expectancy in Denmark
12 December 2006. Henrik Brønnum-Hansen 22
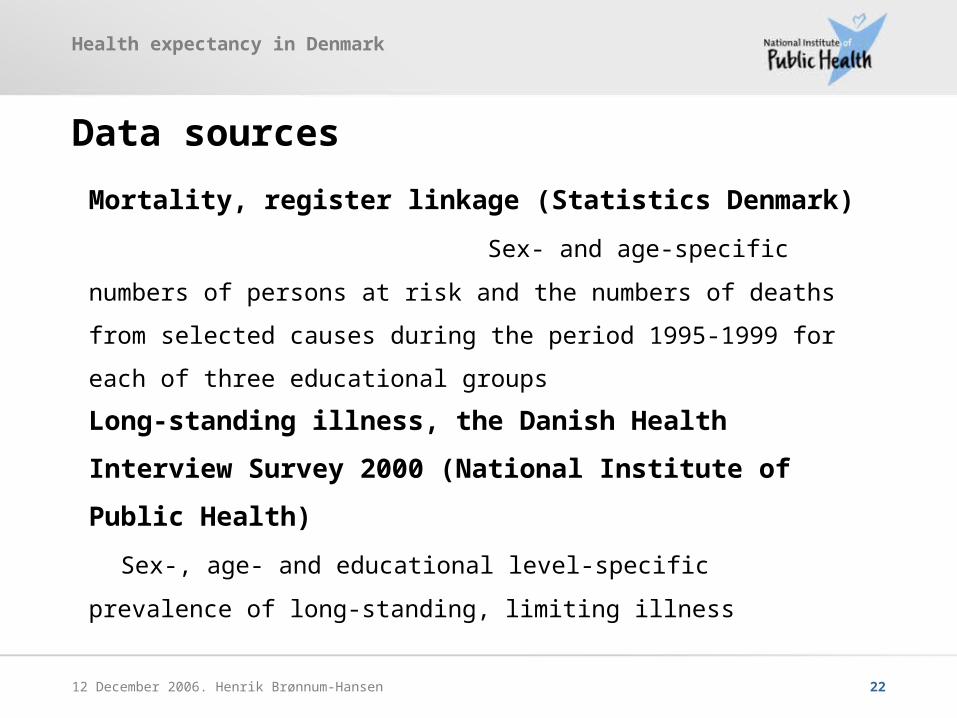
Mortality, register linkage (Statistics Denmark)
Sex- and age-specific numbers of persons at risk and the numbers of
deaths from selected causes during the period 1995-1999 for each of
three educational groups
Data sources
Long-standing illness, the Danish Health Interview Survey
2000 (National Institute of Public Health)
Sex-, age- and educational level-specific prevalence of long-standing,
limiting illness
Health expectancy in Denmark
12 December 2006. Henrik Brønnum-Hansen 23
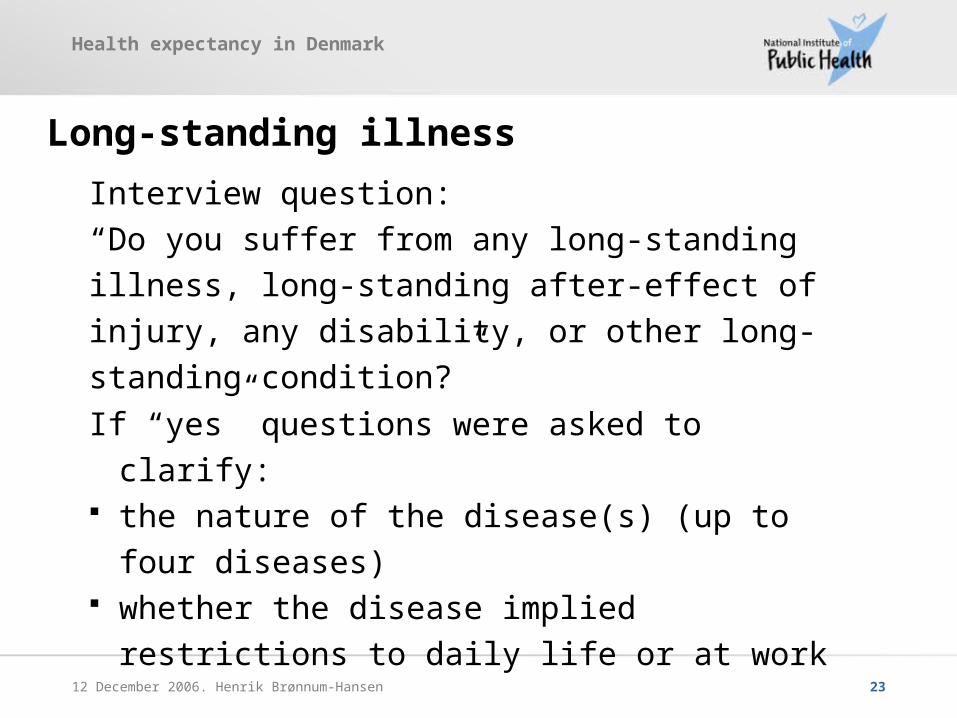
Interview question:
“Do you suffer from any long-standing illness, long-
standing after-effect of injury, any disability, or other
long-standing condition?”
If “yes” questions were asked to clarify: the nature of the disease(s) (up to four diseases) whether the disease implied restrictions to daily life
or at work
Long-standing illness
Health expectancy in Denmark
12 December 2006. Henrik Brønnum-Hansen 24
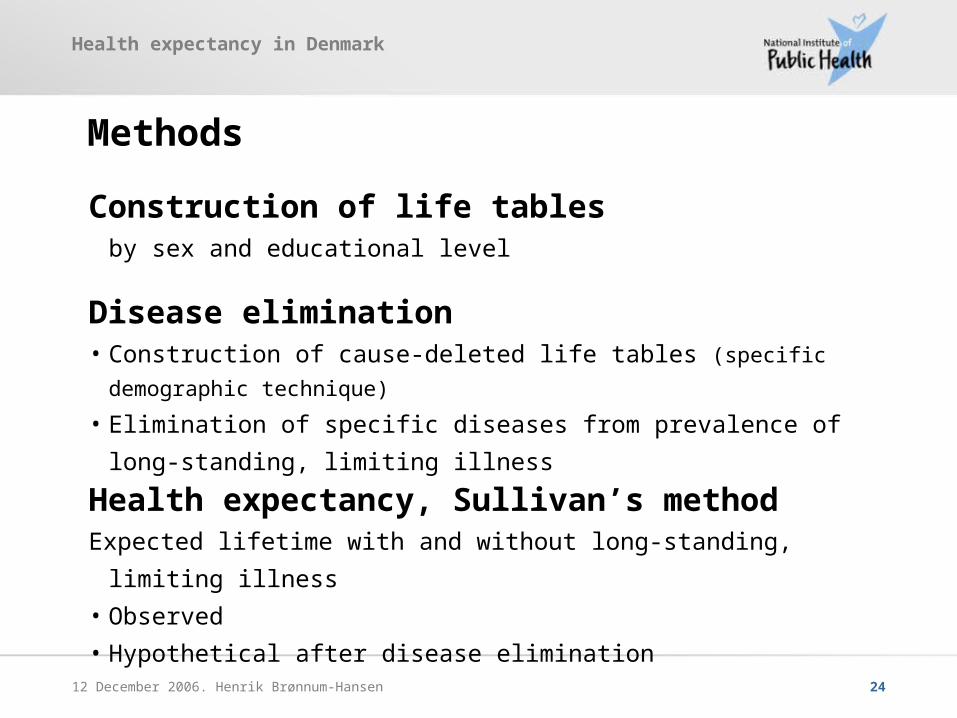
Construction of life tablesby sex and educational level
Methods
Disease elimination• Construction of cause-deleted life tables (specific demographic technique)
• Elimination of specific diseases from prevalence of long-standing,
limiting illness
Health expectancy, Sullivan’s methodExpected lifetime with and without long-standing, limiting illness
• Observed
• Hypothetical after disease elimination
Health expectancy in Denmark
12 December 2006. Henrik Brønnum-Hansen 25
Life expectancy and expected lifetime with and without long-standig illness
0.0
0.1
0.2
0.3
0.4
0.5
0.6
0.7
0.8
0.9
1.0
0 10 20 30 40 50 60 70 80 90 100 110
Age
Su
rviv
al p
rob
abili
ty
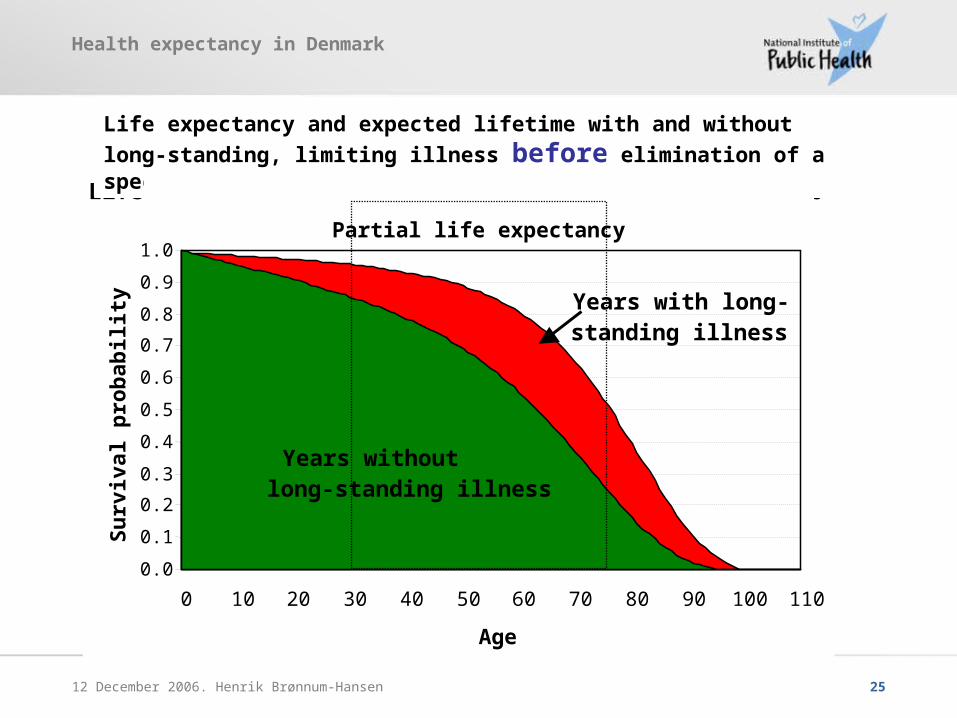
Years with long-standing illness
Years withoutlong-standing illness
Life expectancy and expected lifetime with and without
long-standing, limiting illness before elimination of a specific disease
Partial life expectancy
Health expectancy in Denmark
12 December 2006. Henrik Brønnum-Hansen 26
Life expectancy and expected lifetime with and without long-standig illness
0.0
0.1
0.2
0.3
0.4
0.5
0.6
0.7
0.8
0.9
1.0
0 10 20 30 40 50 60 70 80 90 100 110
Age
Su
rviv
al p
rob
abili
ty
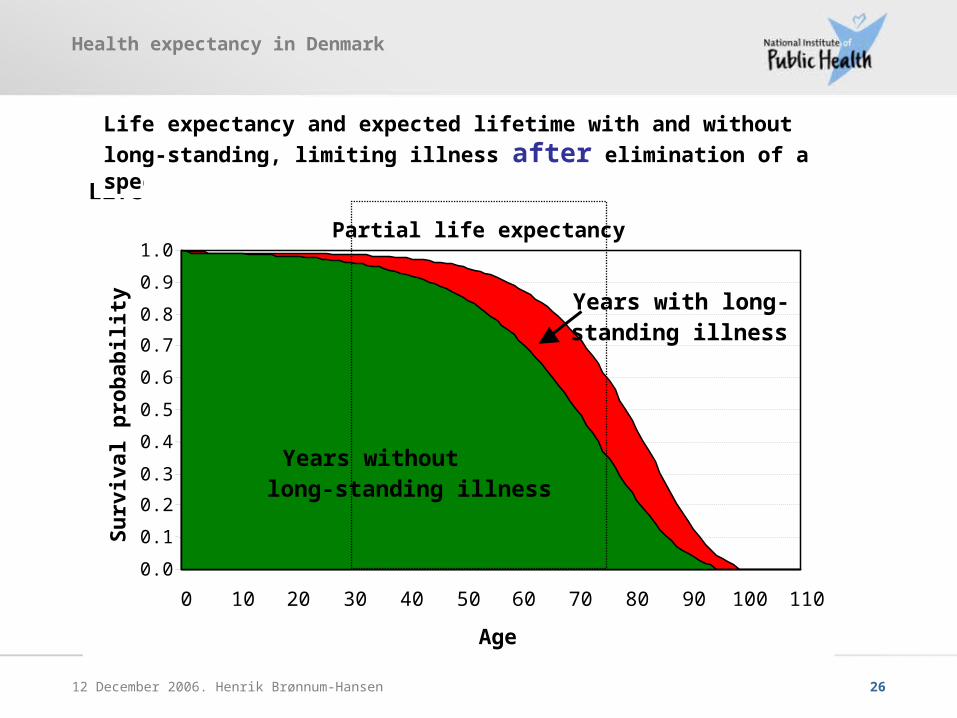
Years with long-standing illness
Years withoutlong-standing illness
Life expectancy and expected lifetime with and without
long-standing, limiting illness after elimination of a specific disease
Partial life expectancy
Health expectancy in Denmark
12 December 2006. Henrik Brønnum-Hansen 27
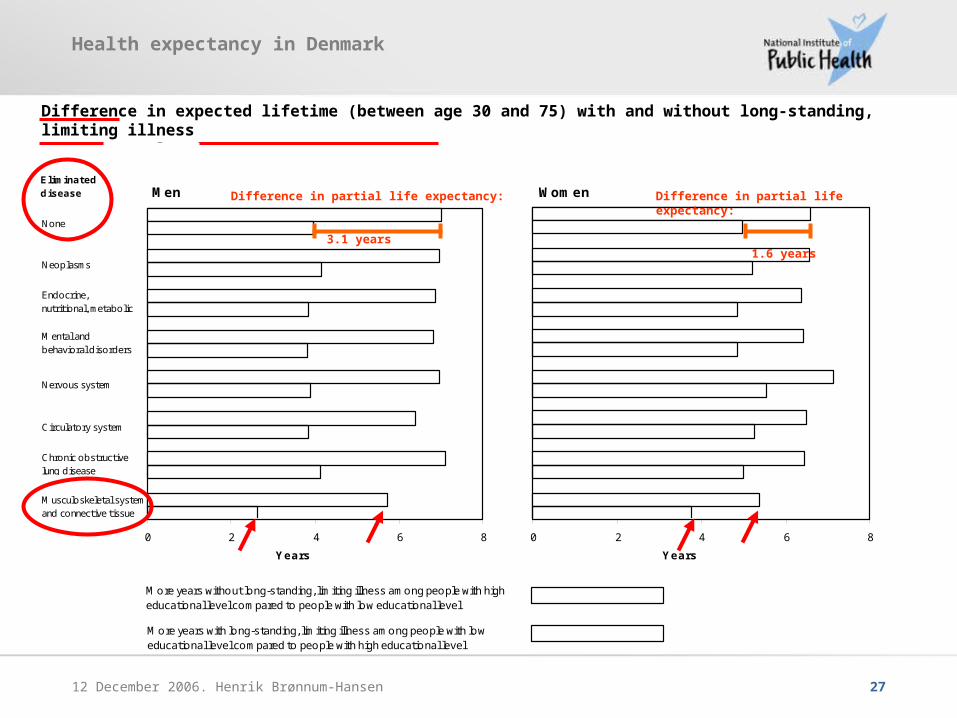
Difference in expected lifetime (between age 30 and 75) with and without long-standing, limiting illnessbetween people with high and low educational level
Women
0 2 4 6 8
Years
Men
0 2 4 6 8
Eliminated disease
Years
None
Neoplasms
Endocrine,nutritional, metabolic
Mental andbehavioral disorders
Nervous system
Circulatory system
Chronic obstructivelung disease
Musculoskeletal systemand connective tissue
More years with long-standing, limiting illness among people with low educational level compared to people with high educational level
More years without long-standing, limiting illness among people with high educational level compared to people with low educational level
Difference in partial life expectancy:
3.1 years
Difference in partial life expectancy:
1.6 years
Health expectancy in Denmark
12 December 2006. Henrik Brønnum-Hansen 28
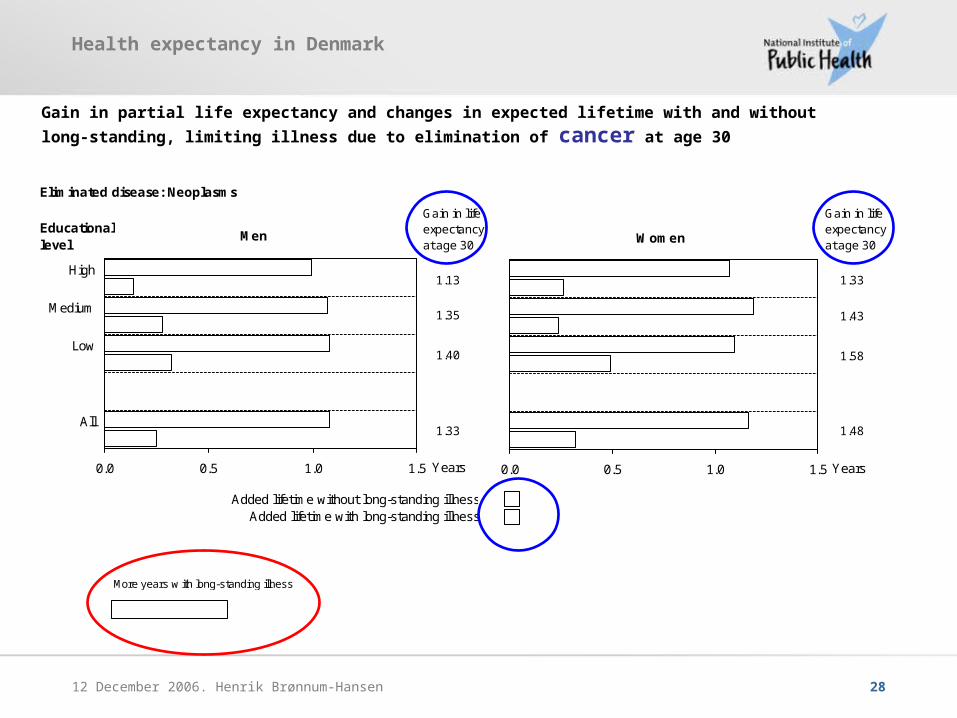
Gain in partial life expectancy and changes in expected lifetime with and without long-standing, limiting
illness due to elimination of cancer at age 30
Men
0.0 0.5 1.0 1.5
High
Medium
Low
All
Years
Gain in lifeexpectancyat age 30
Educationallevel
1.35
Added lifetime without long-standing illnessAdded lifetime with long-standing illness
1.13
1.40
1.33
Eliminated disease: Neoplasms
Women
0.0 0.5 1.0 1.5 Years
Gain in lifeexpectancyat age 30
1.43
1.33
1.58
1.48
More years w ith long-standing illness
Health expectancy in Denmark
12 December 2006. Henrik Brønnum-Hansen 29
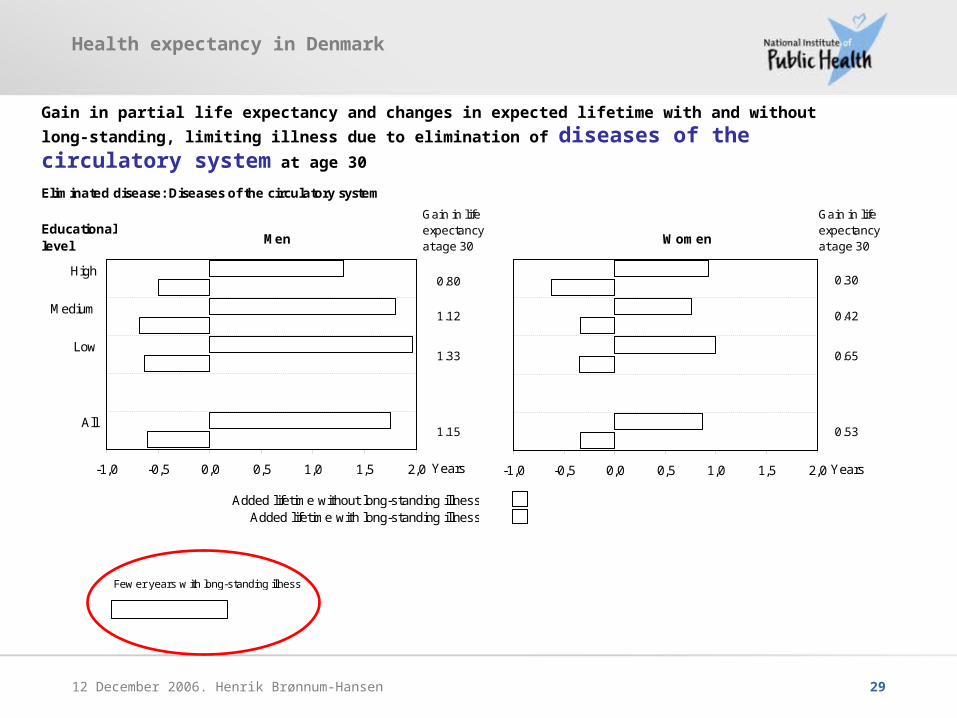
Gain in partial life expectancy and changes in expected lifetime with and without long-standing, limiting
illness due to elimination of diseases of the circulatory system at age 30
Men
-1,0 -0,5 0,0 0,5 1,0 1,5 2,0
High
Medium
Low
All
Years
Gain in lifeexpectancyat age 30
Educationallevel
1.12
Added lifetime without long-standing illnessAdded lifetime with long-standing illness
0.80
1.33
1.15
Eliminated disease: Diseases of the circulatory system
Women
-1,0 -0,5 0,0 0,5 1,0 1,5 2,0 Years
Gain in lifeexpectancyat age 30
0.42
0.30
0.65
0.53
Few er years w ith long-standing illness
Health expectancy in Denmark
12 December 2006. Henrik Brønnum-Hansen 30
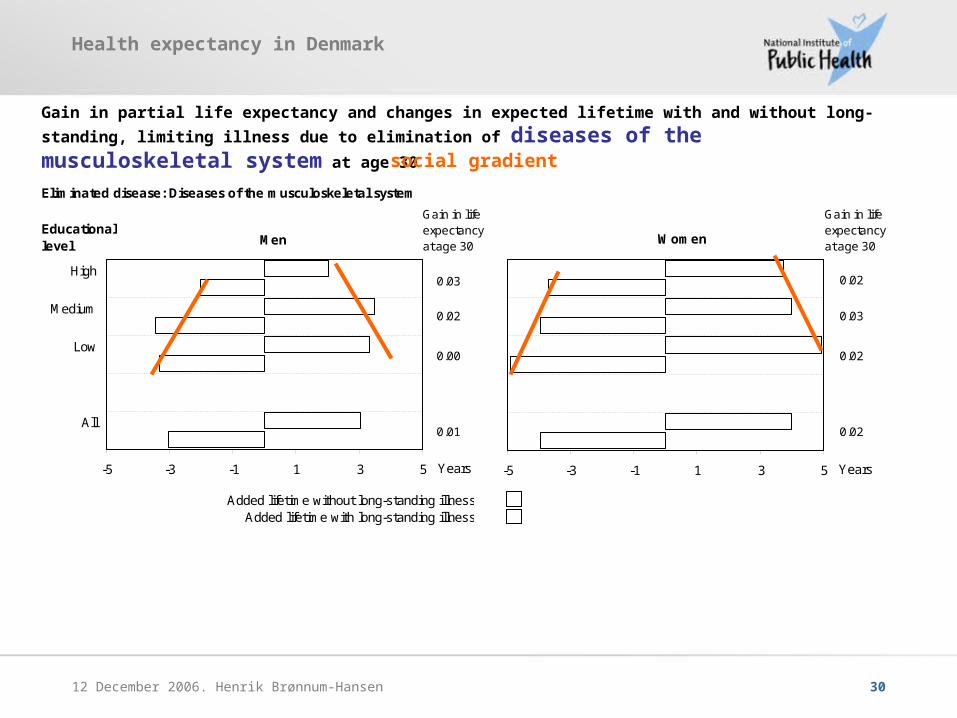
Gain in partial life expectancy and changes in expected lifetime with and without long-standing, limiting
illness due to elimination of diseases of the musculoskeletal system at age 30
social gradient
Men
-5 -3 -1 1 3 5
High
Medium
Low
All
Years
Gain in lifeexpectancyat age 30
Educationallevel
0.02
Added lifetime without long-standing illnessAdded lifetime with long-standing illness
0.03
0.00
0.01
Eliminated disease: Diseases of the musculoskeletal system
Women
-5 -3 -1 1 3 5 Years
Gain in lifeexpectancyat age 30
0.03
0.02
0.02
0.02
Health expectancy in Denmark
12 December 2006. Henrik Brønnum-Hansen 31
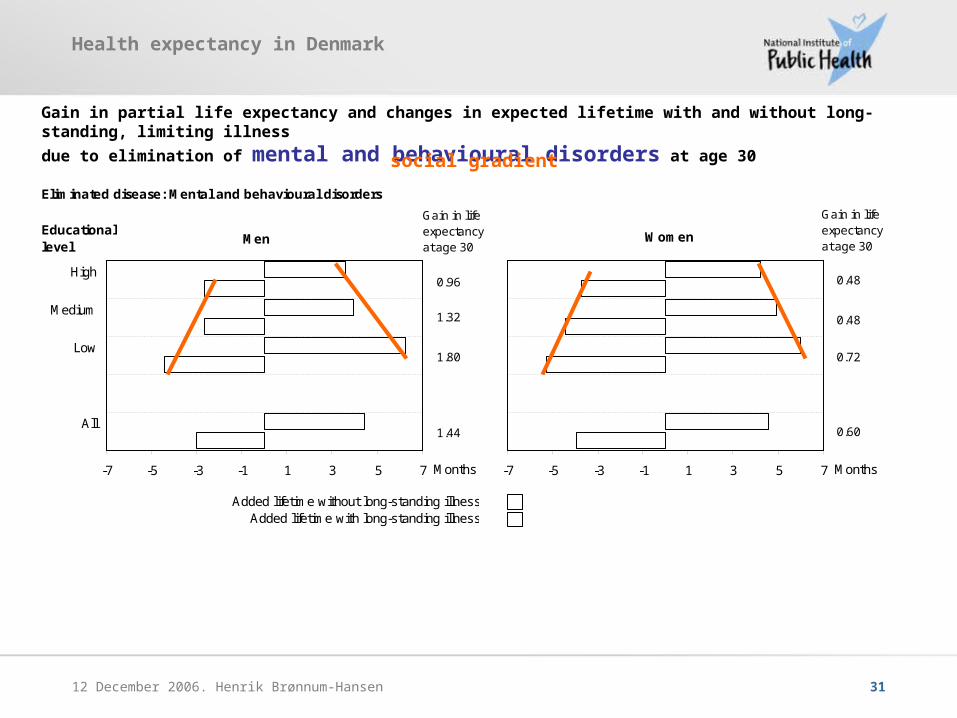
Gain in partial life expectancy and changes in expected lifetime with and without long-standing, limiting illness
due to elimination of mental and behavioural disorders at age 30
Men
-7 -5 -3 -1 1 3 5 7
High
Medium
Low
All
Months
Gain in lifeexpectancyat age 30
Educationallevel
1.32
Added lifetime without long-standing illnessAdded lifetime with long-standing illness
0.96
1.80
1.44
Eliminated disease: Mental and behavioural disorders
Women
-7 -5 -3 -1 1 3 5 7 Months
Gain in lifeexpectancyat age 30
0.48
0.48
0.72
0.60
social gradient
Health expectancy in Denmark
12 December 2006. Henrik Brønnum-Hansen 32
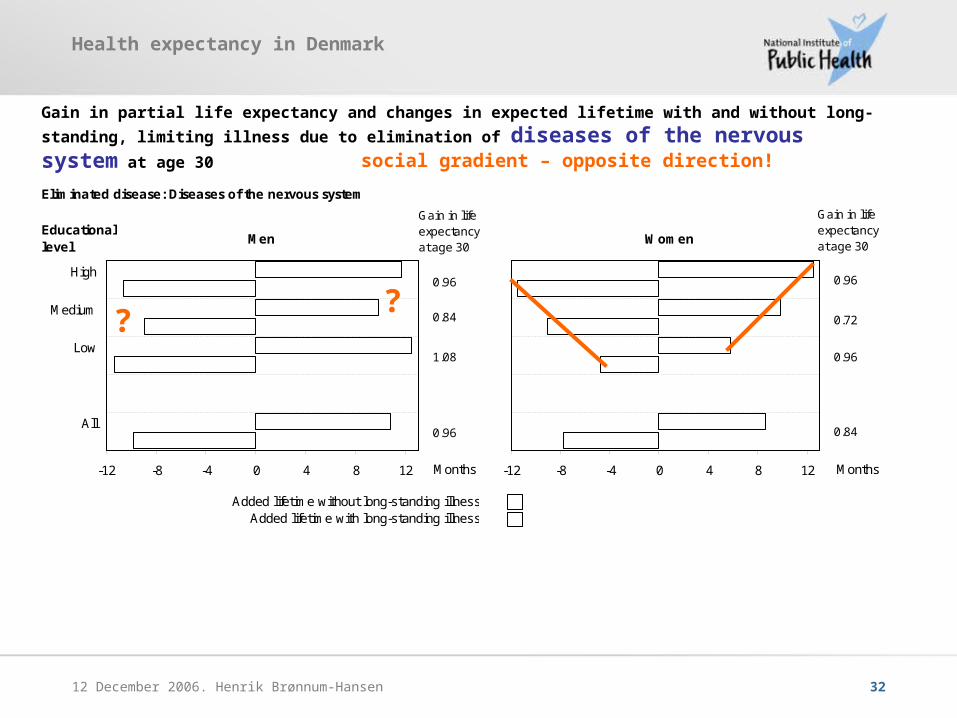
Gain in partial life expectancy and changes in expected lifetime with and without long-standing, limiting
illness due to elimination of diseases of the nervous system at age 30
social gradient – opposite direction!
Men
-12 -8 -4 0 4 8 12
High
Medium
Low
All
Months
Gain in lifeexpectancyat age 30
Educationallevel
0.84
Added lifetime without long-standing illnessAdded lifetime with long-standing illness
0.96
1.08
0.96
Eliminated disease: Diseases of the nervous system
Women
-12 -8 -4 0 4 8 12 Months
Gain in lifeexpectancyat age 30
0.72
0.96
0.96
0.84
??

Health expectancy in Denmark
12 December 2006. Henrik Brønnum-Hansen 33
• Persons with a low educational level were more likely to have long-
standing, limiting illness than those with a high educational level.
Conclusions
• The gain in partial life expectancy to be expected by eliminating
certain diseases decreased with educational level.
• The gain in partial life expectancy that could be expected to derive
from elimination of cancer decreases with educational level, but also
added lifetime with long-standing illness decreases with educational
level. A similar phenomenon was seen for cardiovascular diseases: if
they were eliminated, women with a low educational level would gain
lifetime years, but the reduction in lifetime with long-standing illness
would be greatest for women with a high educational level.
• We found a social gradient in the burden of all major diseases with
low fatality, except for diseases of the nervous system for women.

Health expectancy in Denmark
12 December 2006. Henrik Brønnum-Hansen 34
Impact ofselected risk factors
Health expectancy in Denmark
12 December 2006. Henrik Brønnum-Hansen 35
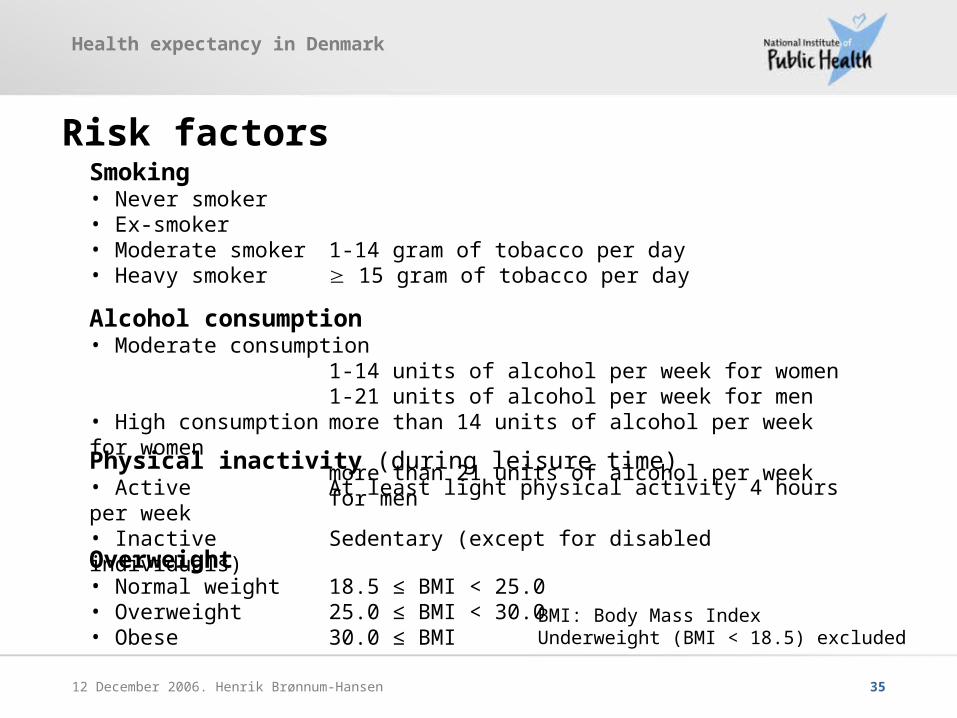
Risk factorsSmoking• Never smoker• Ex-smoker• Moderate smoker 1-14 gram of tobacco per day• Heavy smoker 15 gram of tobacco per day
Alcohol consumption• Moderate consumption 1-14 units of alcohol per week for women
1-21 units of alcohol per week for men• High consumption more than 14 units of alcohol per week for women
more than 21 units of alcohol per week for men
Physical inactivity (during leisure time)• Active At least light physical activity 4 hours per week• Inactive Sedentary (except for disabled individuals)
Overweight• Normal weight 18.5 ≤ BMI < 25.0 • Overweight 25.0 ≤ BMI < 30.0 • Obese 30.0 ≤ BMI
BMI: Body Mass IndexUnderweight (BMI < 18.5) excluded

Health expectancy in Denmark
12 December 2006. Henrik Brønnum-Hansen 36
• Death rates by sex and age from the Cause of Death Register
Data sources
• As to smoking: Lung cancer death rates and relative risks from the second prospective Cancer Prevention Study(CPS-II) of the American Cancer Society
• Relative risks for death estimated from the Danish National Cohort Study (DANCOS): the Danish Health Interview Surveys in 1987, 1991, 1994 and 2000 linked to the Danish Civil Registration System and other national registers
• Prevalence of long-standing, limiting illness by sex, age and risk factor level established from the Danish Health Interview Survey 2000
Health expectancy in Denmark
12 December 2006. Henrik Brønnum-Hansen 37
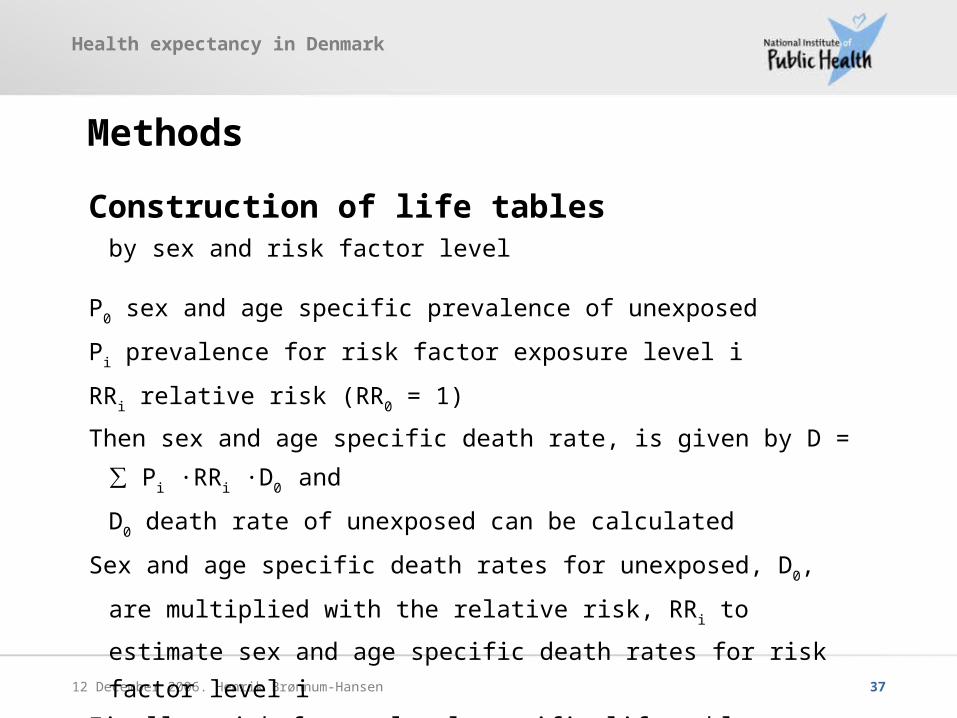
Construction of life tablesby sex and risk factor level
P0 sex and age specific prevalence of unexposed
Pi prevalence for risk factor exposure level i
RRi relative risk (RR0 = 1)
Then sex and age specific death rate, is given by D = ∑ Pi ∙RRi ∙D0 and
D0 death rate of unexposed can be calculated
Sex and age specific death rates for unexposed, D0, are multiplied with
the relative risk, RRi to estimate sex and age specific death rates for
risk factor level i
Finally, risk factor level specific life tables are constructed
For smoking an indirect method (Peto and colleagues) was used.
Methods
Health expectancy in Denmark
12 December 2006. Henrik Brønnum-Hansen 38
Methods
Survey dataPrevalence of long-standing, limiting illness
by sex and risk factor level
Sullivan’s methodto estimate
expected lifetime without longstanding, limiting illness
Health expectancy in Denmark
12 December 2006. Henrik Brønnum-Hansen 39
Results
Risk factors and
expected lifetime without longstanding, limiting illness

Health expectancy in Denmark
12 December 2006. Henrik Brønnum-Hansen 40
Summary – Life expectancyLife expectancy lost Healthy life lost Risk factor
Prevalence
Risk factor YearsMen Women
YearsMen Women
%Men Women
Smoking
Heavy smokers 8.7 10.4 10.4 10.5 23.2 16.5
Moderate smokers 5.0 5.3 6.9 5.3 16.2 18.1
Ex-smokers 2.4 1.5 5.2 2.5 25.2 22.0
Alcohol
High consumption 4.7 4.0 5.0 0.8 14.8 8.7
Physical inactivity
Inactive 5.3 5.1 8.3 10.3 16.0 16.9
Body weight
Overweight 0.0 0.7 -1.4 3.9 39.9 24.8
Obese 2.0 3.2 4.9 10.0 9.8 9.1

Health expectancy in Denmark
12 December 2006. Henrik Brønnum-Hansen 41
Summary – Health expectancyLife expectancy lost Healthy life lost Risk factor
Prevalence
Risk factor YearsMen Women
YearsMen Women
%Men Women
Smoking
Heavy smokers 8.7 10.4 10.4 10.5 23.2 16.5
Moderate smokers 5.0 5.3 6.9 5.3 16.2 18.1
Ex-smokers 2.4 1.5 5.2 2.5 25.2 22.0
Alcohol
High consumption 4.7 4.0 5.0 0.8 14.8 8.7
Physical inactivity
Inactive 5.3 5.1 8.3 10.3 16.0 16.9
Body weight
Overweight 0.0 0.7 -1.4 3.9 39.9 24.8
Obese 2.0 3.2 4.9 10.0 9.8 9.1
Health expectancy in Denmark
12 December 2006. Henrik Brønnum-Hansen 42
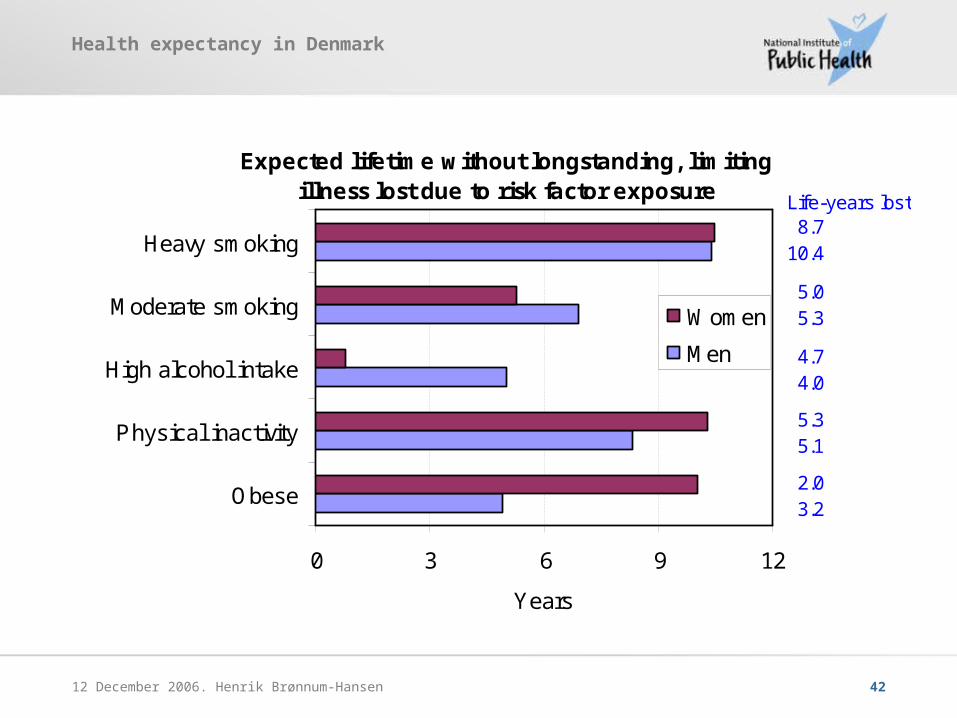
Expected lifetime without longstanding, limitingillness lost due to risk factor exposure
0 3 6 9 12
Obese
Physical inactivity
High alcohol intake
Moderate smoking
Heavy smoking
Years
Women
Men
5.0 5.3
4.7 4.0
5.3 5.1
2.0 3.2
8.710.4
Life-years lost
Health expectancy in Denmark
12 December 2006. Henrik Brønnum-Hansen 43
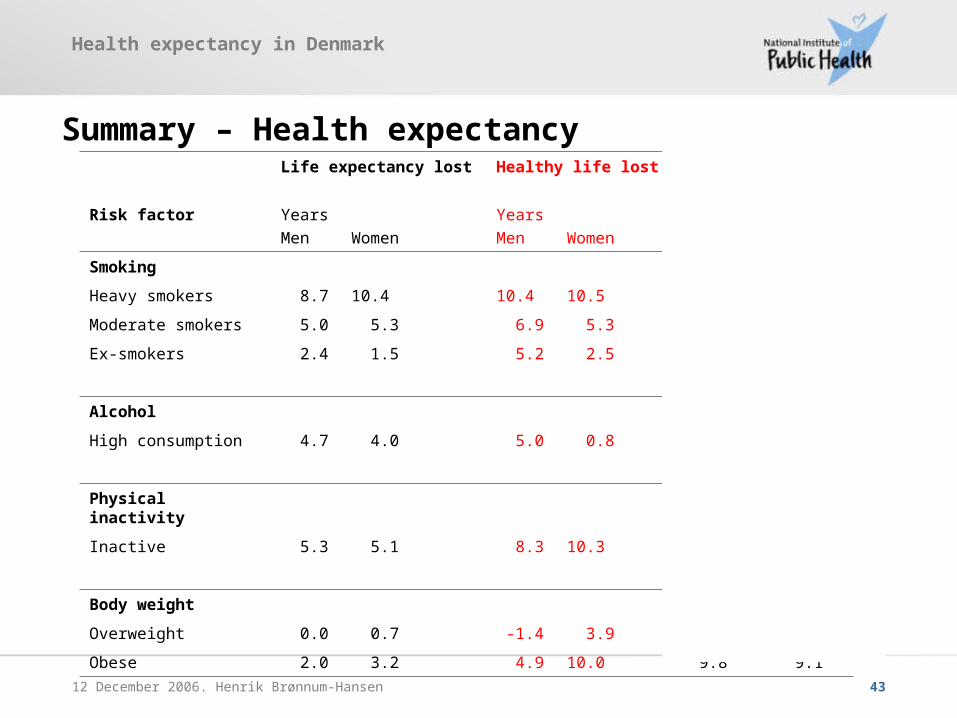
Summary – Health expectancyLife expectancy lost Healthy life lost Risk factor
Prevalence
Risk factor YearsMen Women
YearsMen Women
%Men Women
Smoking
Heavy smokers 8.7 10.4 10.4 10.5 23.2 16.5
Moderate smokers 5.0 5.3 6.9 5.3 16.2 18.1
Ex-smokers 2.4 1.5 5.2 2.5 25.2 22.0
Alcohol
High consumption 4.7 4.0 5.0 0.8 14.8 8.7
Physical inactivity
Inactive 5.3 5.1 8.3 10.3 16.0 16.9
Body weight
Overweight 0.0 0.7 -1.4 3.9 39.9 24.8
Obese 2.0 3.2 4.9 10.0 9.8 9.1

Health expectancy in Denmark
12 December 2006. Henrik Brønnum-Hansen 44
Summary – Health expectancyLife expectancy lost Healthy life lost Risk factor
Prevalence
Risk factor YearsMen Women
YearsMen Women
%Men Women
Smoking
Heavy smokers 8.7 10.4 10.4 10.5 23.2 16.5
Moderate smokers 5.0 5.3 6.9 5.3 16.2 18.1
Ex-smokers 2.4 1.5 5.2 2.5 25.2 22.0
Alcohol
High consumption 4.7 4.0 5.0 0.8 14.8 8.7
Physical inactivity
Inactive 5.3 5.1 8.3 10.3 16.0 16.9
Body weight
Overweight 0.0 0.7 -1.4 3.9 39.9 24.8
Obese 2.0 3.2 4.9 10.0 9.8 9.1

Thank you!