health equity and social determinants of health in ottawa · health equity and social determinants...
TRANSCRIPT

Health Equity and Social Determinants of Health in Ottawa
November 2016

Health Equity and Social Determinants of Health in Ottawa | Ottawa Public Health 2
Table of Contents Health Equity and Social Determinants of Health in Ottawa ............................................................. 1
Table of Contents .......................................................................................................................... 2
List of Tables ................................................................................................................................. 3
List of Figures ................................................................................................................................ 4
Executive Summary ...................................................................................................................... 5
Introduction ................................................................................................................................... 7
Social Determinants of Health in Ottawa ................................................................................... 7
Methodology .................................................................................................................................. 8
Self-reported income measure and health ................................................................................. 8
Geographical measures of socio-economic advantage and health ........................................... 9
Limitations ................................................................................................................................... 11
Self report analysis .................................................................................................................. 11
Area level analysis ................................................................................................................... 11
Results ........................................................................................................................................ 12
Self-reported income measure group and health ..................................................................... 12
Key Health Measures and their Relation to Income ................................................................. 12
Area level measures of socio-economic advantage and health ............................................... 18
Discussion ................................................................................................................................... 22
Appendix 1: Methods and measures ........................................................................................... 25
Methods ................................................................................................................................... 25
Measures ................................................................................................................................. 26
Appendix 2: Data tables .............................................................................................................. 30
References .................................................................................................................................. 34

Health Equity and Social Determinants of Health in Ottawa | Ottawa Public Health 3
List of Tables Table 1: Socio-demographic profile of the 3 income groups used for analysis. 95% confidence intervals are in parentheses ............................................................................................................ 12
Table 2: Before tax low income cut off values by household size for population centres exceeding 500,000 population ......................................................................................................................... 25
Table 3: Data for Figure 1: Percent of the population in Ottawa with self rated general health of "Fair" or "Poor" by income group, age 12 and up............................................................................ 30
Table 4: Data for Figure 2: Percent of the population in Ottawa with self-rated mental health of "Fair" or "Poor" by income group, age 12 and up............................................................................ 30
Table 5: Data for Figure 3: Percent of the population in Ottawa reporting two or more chronic conditions by income group, age 20 and up ................................................................................... 30
Table 6: Data for Figure 4: Percent of the population in Ottawa who are overweight or obese by income group, age 18 and up ......................................................................................................... 30
Table 7: Data for Figure 5: Percent of the population in Ottawa who are physically inactive during leisure time by income group, age 12 and up ................................................................................. 31
Table 8: Data for Figure 6: Percent of the population in Ottawa who are current smokers by income group, aged 19 and up .................................................................................................................... 31
Table 9: Data for Figure 7: Percent of the population in Ottawa who exceed the Canadian Low Risk Drinking Guidelines by income group, age 19 and up .................................................................... 31
Table 10: Data for Figure 8: Percent of the population in Ottawa who engage in heavy drinking by income group, age 19 and up ......................................................................................................... 31
Table 11: Data for Figure 9: Percent of the population in Ottawa reporting they have no regular family physician by income group, age 12 and up .......................................................................... 32
Table 12: Data for Figure 10: Age standardized rates of all-cause hospitalizations in Ottawa excluding births, still births and mental health discharges by neighbourhood socio-economic advantage ....................................................................................................................................... 32
Table 13: Data for Figure 11: Premature mortality in Ottawa as premature deaths per 100,000 populations by neighbourhood socio-economic advantage. ........................................................... 32
Table 14: Data for Figure 12: Diabetes prevalence as a percent of the population aged 20 and up by neighbourhood socio-economic index score .............................................................................. 33
Table 15: Percent of kindergarten children vulnerable in one or more Early Development Instrument domains by neighbourhood socio-economic index score, 2014 to 15 (Cycle 4) ........... 33

Health Equity and Social Determinants of Health in Ottawa | Ottawa Public Health 4
List of Figures Figure 1: Percent of the population in Ottawa with self rated general health of "Fair" or "Poor" by income group, age 12 and up ......................................................................................................... 12
Figure 2: Percent of the population in Ottawa with self-rated mental health of "Fair" or "Poor" by income group, age 12 and up. ........................................................................................................ 13
Figure 3: Percent of the population in Ottawa reporting two or more chronic conditions by income group, age 12 and up ...................................................................................................................... 14
Figure 4: Percent of the population in Ottawa who are overweight or obese by income group, age 18 and up ........................................................................................................................................ 14
Figure 5: Percent of the population in Ottawa who are physically inactive during leisure time by income group, age 12 and up ......................................................................................................... 15
Figure 6: Percent of the population in Ottawa who are current smokers by income group, aged 19 and up ............................................................................................................................................. 15
Figure 7: Percent of the population in Ottawa who exceed the Canadian Low Risk Drinking Guidelines by income group, age 19 and up ................................................................................... 16
Figure 8: Percent of the population in Ottawa who engage in heavy drinking by income group, age 19 and up ........................................................................................................................................ 16
Figure 9: Percent of the population in Ottawa reporting they have no regular family physician by income group .................................................................................................................................. 17
Figure 10: Age standardized rates of all-cause hospitalizations in Ottawa excluding births, still births and mental health discharges by neighbourhood socio-economic advantage. ..................... 18
Figure 11: Premature mortality in Ottawa as premature deaths per 100,000 population by socio-economic quintile. ........................................................................................................................... 19
Figure 12: Diabetes prevalence as a percent of the population aged 20 and up by neighbourhood socio-economic index score. 2011 data .......................................................................................... 20
Figure 13: Percent of kindergarten children vulnerable in one or more Early Development Instrument domains by neighbourhood socio-economic index score, 2014 to15 (Cycle 4) ............ 21
Figure 14: Ottawa Neighbourhood Study neighbourhoods by Socio-Economic Status (SES) Quintile from Q1 (Most advantaged) to Q5 (Least advantaged) ..................................................... 24
Figure 15: Calculation of income categories ................................................................................... 25

Health Equity and Social Determinants of Health in Ottawa | Ottawa Public Health 5
Executive Summary
Ottawa is generally considered to be an affluent city, with significant advantages related to income, education and employment. This is not the case for all Ottawa residents and communities. Differences in health status exist between people and groups because of their social and economic circumstances.
To illustrate these differences, the relationships between income or neighbourhood socio-economic advantage and thirteen health-related measures are provided in this report. Those in low income groups or low advantage neighbourhoods are more likely to experience poor outcomes on 9 of the 13 health-related measures compared to the high income groups or most advantaged neighbourhoods.
Using three groups based on total household income, those in the low income group:
• are over twice as likely to report fair or poor general health compared to the high income group (16% compared to 6%);
• are over three times as likely to report fair or poor mental health compared to the high income group (13% compared to 4%);
• are twice as likely to report 2 or more chronic conditions compared to the high income group (19% compared to 9%);
• were not significantly different from other income groups with regards to being overweight or obese;
• are more likely to be inactive in leisure time compared to the high income group (49% compared to 34%);
• are more likely to smoke compared to the high income group (24% compared to 12%);
• are less likely to exceed the Canadian Low Risk Drinking Guideline for chronic disease compared to the high income group (21% compared to 39%);
• are less likely to report heavy drinking than the high income group (15% compared to 27%); and
• have the same percentage of the population with no regular family physician compared to other income groups.
Using five groups of neighbourhoods based on a measure of socio-economic advantage, low advantage neighbourhoods have:
• more hospitalizations than the most advantaged neighbourhood (6500 compared to 5400 per 100,000 population );
• more premature deaths (death before age 75) than the most advantaged neighbourhood (542 compared to 280 per 100,000 population );
• a higher prevalence of diabetes than the most advantaged neighbourhood (8% compared to 5%); and
• a higher percentage of children who are likely to have greater challenges in school learning than the most advantaged neighbourhoods (39% compared to 21%)
Based on the evidence presented in this report, there is a need to address health inequities in Ottawa - to continue to work towards improving overall population health

Health Equity and Social Determinants of Health in Ottawa | Ottawa Public Health 6
while collectively working to narrow the health equity gap for disadvantaged populations.
Working collaboratively with partners, opportunities exist to establish a common agenda, increase the consistency of existing efforts, and intensify innovation for greater collective impact on health equity. OPH is committed to health equity and creating equitable opportunities for health through actions as described in this report.

Health Equity and Social Determinants of Health in Ottawa | Ottawa Public Health 7
Introduction Ottawa is generally considered to be an affluent city, with significant advantages related to income, education and employment. This is not the case for all Ottawa residents and communities. Differences in health status exist between people and groups because of their social and economic circumstances.
Health starts - long before illnesses - where we live, learn, work, and play. In other words, it is the social determinants of health, such as income, employment, housing, education, early child development and social inclusion that largely shape our opportunities to be healthy1. People have a personal responsibility to take care of their health, but health is not solely determined by lifestyle choices or access to quality health care services2.
Grounded in and guided by Ottawa Public Health’s (OPH) vision that sees all Ottawa’s communities and people as healthy, safe and actively engaged in their well-being, and foundational principles that promote equitable opportunities for health, evidence-informed decision making and dedication to excellence and quality improvement, addressing health inequities is seen as a fundamental organizational expectation3. This report supports the discussion about health equity in Ottawa by assessing the relationships between health status and social determinants of health, particularly income, in the city’s population. The aim of this health status assessment is to support Ottawa Public Health’s actions to create a fair distribution of health in Ottawa.
Social Determinants of Health in Ottawa Ottawa is relatively well off compared to Ontario and the rest of Canada with respect to average household incomes and the percent of residents with low incomes. Approximately 12% of Ottawa residents are living in low income compared to 14% in Ontario4. Ottawa is a well educated community with 75% having a postsecondary certificate, diploma or degree compared to 65% for all of Ontario (Statistics Canada 2013). Ottawa’s unemployment rate was 6.3% of the labour forcea, similar to the Ontario rate of 6.8%. However, unemployment among young people in Ottawa aged 15 to 24 was more than twice as high at 15.1%; similar to the Ontario rate (14.7%)5. Approximately 1 in 10 (11.2%) Ottawa households have homes that require major repair, don’t have enough bedrooms for the size and makeup of the household or would be unable to pay less than 30% of the household’s before-tax income on alternative local housing: they are in core housing need6. This compared to 13.4% in Ontario6.
a The labour force consists of people who are currently employed and people who are unemployed but were available to work in the reference week and had looked for work in the past 4 weeks. Statistics Canada. Table 109-5337 - Unemployment rate, Canada, provinces, health regions (2015 boundaries) and peer groups, annual (percent), CANSIM (database). (accessed: Sep 12, 2016)

Health Equity and Social Determinants of Health in Ottawa | Ottawa Public Health 8
Methodology This report assesses the relationship between health status and income for thirteen health measures.
Income was selected as the comparative social determinant of health for this report because it is a fundamental cause of equity-related health problems1 and perhaps the most important because it shapes overall living conditions (such as the ability to live in affordable, adequate and suitable housing), affects psychological functioning, and influences health-related behaviours7. Income can also be measured or inferred in a way that allows comparisons of health measures and behaviours along a gradient of wealth. Health and health behaviour measures were selected based on data ability and because they demonstrated health inequities in a recent publication from another jurisdiction8. Details of each measure are included in Appendix 1.
The analysis uses two different approaches: nine health measures are analyzed based on self-reported data from the Canadian Community Health Survey, and the other four are assessed by linking administrative data with geographic areas in the city. The linking is required because administrative data does not include information about income. These methods of analysis are discussed in greater detail below.
Self-reported income measure and health The Canadian Community Health Survey (CCHS) is a cross-sectional survey that collects information related to health status, health care utilization and health determinants for the Canadian population9. From this survey, total household income was selected as the basis for a measure of socio-economic position.
Households were divided into three groups with different levels of before-tax total household income, ensuring enough data was available for estimating the relationships between the income measure and measures of health status and health determinants. More details of this division are included in Appendix 2.
To provide reliable estimates, four years of CCHS data were combined (2011 to 2014). Estimates which must be interpreted with caution because of high sampling variability are flagged or they are suppressed if sampling variability was too highb. Differences in the size of age groups between the income categories were accounted for by standardizing to the 2011 Ottawa population.
b Measures with a co-efficient of variation greater than or equal to 16.6 are flagged as interpret with caution and measures with a co-efficient of variation greater than 33.3 are suppressed.
Health Equity and Social Determinants of Health in Ottawa | Ottawa Public Health 9
The nine measures selected from the CCHS for analysis include:
• Fair or Poor self-rated general health (Age 12 and up) • Fair or Poor self-rated mental health (Age 12 and up) • Reports two or more chronic health conditions (Age 20 and up) • Physical inactivity during leisure time (Age 12 and up) • Current smoker (Age 12 and up) • Overweight and obesity (Age 18 and up) • Exceeding the Canada’s Low-Risk Alcohol Drinking Guidelines (Age 19 and up) • Heavy drinking (Age 19 and up) • Having a regular family physician
Geographical measures of socio-economic advantage and health This method linked administrative data, such as the records created when people receive care from a hospital, to a measure of socio-economic position derived from the Ottawa Neighbourhood Study (ONS).
The ONS divides the city of Ottawa into 103 neighbourhoods and categorizes them into five groups (quintiles), based on:
• The percent of a population in a neighbourhood living below the after-tax low income measure (LIM-AT)
• The unemployment rate in the neighbourhood • The percent of the population aged 24 to 65 without a high school diploma • The percent of lone parent families • The average household income after tax
Quintile 1 neighbourhoods are the most advantaged and Quintile 5 neighbourhoods are the least advantaged.
For this report, data from administrative databases, such as hospitalizations, were assigned to the neighbourhoods defined in the ONS by postal code. If a postal code could belong to more than one neighbourhood, the data was assigned to each area by “weight” of the population in each area. Estimates, which must be interpreted with caution because of high sampling variability, are flagged or were suppressed if sampling variability was too high.

Health Equity and Social Determinants of Health in Ottawa | Ottawa Public Health 10
The health measures that are included in this comparison are:
• All-cause hospitalizations for all ages. This estimate is based on 2014 and 2015 hospitalization data and excludes births, still births and hospital visits with a mental health issue as the principal reason for admission. The latter are excluded because the majority of such visits are collected in a different database than that used for other causes of admission (e.g. injury, chronic disease) and the two sources cannot be combined.
• Diabetes prevalence among those aged 20 and up. This estimate is based on the 2012 population. For details of how the estimate is calculated, see Appendix 1. The 2011 Ottawa population was used as a standard population to adjust for differences in the size of age groups that may exist between neighbourhoods.
• Premature Mortality. This estimate includes all-cause death before the age of 75 and was not age-adjusted because it is not affected by differences in age groups between neighbourhoods. Data from 2010 and 2011 were combined to provide the estimate.
• Vulnerability at school entry. The percentage of kindergarten children with an Early Development Instrument (EDI) score that shows vulnerability in one or more developmental domains. The EDI measures developmental health at school entry in five areas of early child development that are good predictors of adult health, education and social outcomesc. Children who are vulnerable in one or more EDI domains are more likely to face greater challenges learning in a school environment10.
All analysis was conducted in Stata 14.111. Differences between groups were tested using a Chi Square test followed by an adjusted Wald post-hoc test if a significant difference was seen between groups. An alpha of 0.05 was used as the threshold value for significance.

Health Equity and Social Determinants of Health in Ottawa | Ottawa Public Health 11
Limitations
Self report analysis The CCHS collects self-reported data, which may be influenced by reporting bias. For example, there is evidence that individuals over-estimate their physical activity measures when compared to quantitative measures12. Because several years of data was combined to have enough data for the analysis, the results cannot be used to describe the health picture at a specific point in time. For example, the measure of smoking in this report does not represent current smoking rates in Ottawa.
The use of total household income as the key social determinant of health for the analysis of health inequity may not reflect the relationships of other determinants that influence health, such as education. However, income is a fundamental driver of health inequities.
Area level analysis Allocation of the health information to the geographic areas follows a process of likelihood based on a weighting scheme. It is possible that some records are allocated to a neighbourhood to which they do not belong.
Neighbourhoods are often diverse, and areas of high deprivation may be mixed with areas of high advantage within a single neighbourhood. This means neighbourhood socio-economic index measures do not adequately represent all the residents in a given neighbourhood. This means residents in a given neighbourhood do not necessarily share the characteristics of the area itself.

Health Equity and Social Determinants of Health in Ottawa | Ottawa Public Health 12
Results
Self-reported income measure group and health Using the three income groups as described in the methodology, Table 1 shows some basic characteristics by lowest to highest income group.
Table 1: Socio-demographic profile of the 3 income groups used for analysis. 95% confidence intervals are in parentheses
Profile Measure Lowest income Middle income Highest income
Population size 266,800 266,700 264,600
Average household annual income before taxes
$34,450 ($32,400-$36,500)
$85,100 ($82,450-$87,770)
$167,400 ($161,860-$172,980)
Percent living in rented dwellings
55.9% (50.3%-61.4%)
23.2% (18.9%-28.1%)
8.1% (5.9%-10.9%)
Immigrants past 10 years 14.7% (10.9%-19.6%) 4.5% (2.8%-7.1%)* 2.7% (1.6%-4.7%)*
*Interpret with caution due to high sampling variability Source: Canadian Community Health Survey (CCHS), 2011-2014 combined. Ontario Share File. Statistics Canada.
Key Health Measures and their Relation to Income Fair or poor self-rated general health. This measure shows a strong relationship with income (Figure 1). Those in the lowest income group are more than twice as likely to report fair or poor general health as those in the highest. Also, people in the middle income group are significantly more likely to rate their general health as fair or poor than those in the highest income group.
Figure 1: Percent of the population in Ottawa with self rated general health of "Fair" or "Poor" by income group, age 12 and up

Health Equity and Social Determinants of Health in Ottawa | Ottawa Public Health 13
Source: Canadian Community Health Survey (CCHS), 2011-2014 combined. Ontario Share File. Statistics Canada. Data Table for Figure 1
Self-rated mental health. This measure shows a strong relationship with income group, but does not show the same gradient as general health (Figure 2). Those in the lowest income group are more than twice as likely to report fair or poor mental health as those in the highest. However, there is no statistically significant difference between the middle and highest income groups.
Figure 2: Percent of the population in Ottawa with self-rated mental health of "Fair" or "Poor" by income group, age 12 and up.
Source: Canadian Community Health Survey (CCHS), 2011-2014 combined. Ontario Share File. Statistics Canada. Data Table for Figure 2

Health Equity and Social Determinants of Health in Ottawa | Ottawa Public Health 14
Prevalence of chronic conditions. This measure shows a gradient between income group, with those in the lowest income group being more likely to report two or more chronic conditions than those in either the middle or highest groups (Figure 3). Those in the middle income group are also more likely to report two or more chronic conditions than those in the highest.
Figure 3: Percent of the population in Ottawa reporting two or more chronic conditions by income group, age 12 and up
Source: Canadian Community Health Survey (CCHS), 2011-2014 combined. Ontario Share File. Statistics Canada. Data Table for Figure 3
Overweight and obesity (Figure 4). The analysis shows no statistically significant difference between income groups in self-reported overweight or obesity.
Figure 4: Percent of the population in Ottawa who are overweight or obese by income group, age 18 and up
Source: Canadian Community Health Survey (CCHS), 2011-2014 combined. Ontario Share File. Statistics Canada. Data Table for Figure 4
Health Equity and Social Determinants of Health in Ottawa | Ottawa Public Health 15
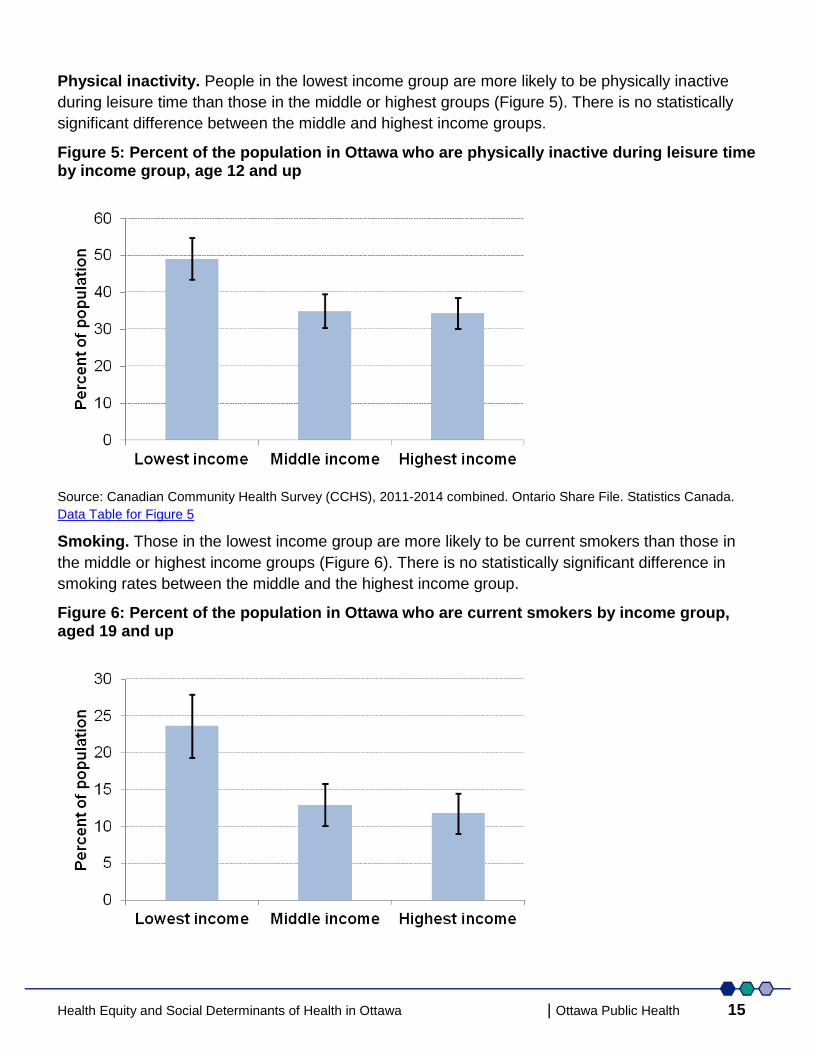
Physical inactivity. People in the lowest income group are more likely to be physically inactive during leisure time than those in the middle or highest groups (Figure 5). There is no statistically significant difference between the middle and highest income groups.
Figure 5: Percent of the population in Ottawa who are physically inactive during leisure time by income group, age 12 and up
Source: Canadian Community Health Survey (CCHS), 2011-2014 combined. Ontario Share File. Statistics Canada. Data Table for Figure 5
Smoking. Those in the lowest income group are more likely to be current smokers than those in the middle or highest income groups (Figure 6). There is no statistically significant difference in smoking rates between the middle and the highest income group.
Figure 6: Percent of the population in Ottawa who are current smokers by income group, aged 19 and up

Health Equity and Social Determinants of Health in Ottawa | Ottawa Public Health 16
Source: Canadian Community Health Survey (CCHS), 2011-2014 combined. Ontario Share File. Statistics Canada. Data Table for Figure 6
Alcohol use. High-risk drinking is reported more frequently in higher income groups than lower. People aged 19 and older in the middle and highest income groups are more likely to exceed the Canada’s Low Risk Alcohol Drinking Guidelines (Butt et al. 2011) (Figure 7) and engage in heavy drinking (Figure 8) than the lowest income group. More details on these measures are in Appendix 2.
Figure 7: Percent of the population in Ottawa who exceed the Canadian Low Risk Drinking Guidelines by income group, age 19 and up
Source: Canadian Community Health Survey (CCHS), 2011-2014 combined. Ontario Share File. Statistics Canada. Data Table for Figure 7
Figure 8: Percent of the population in Ottawa who engage in heavy drinking by income group, age 19 and up

Health Equity and Social Determinants of Health in Ottawa | Ottawa Public Health 17
Source: Canadian Community Health Survey (CCHS), 2011-2014 combined. Ontario Share File. Statistics Canada. Data Table for Figure 8
Access to family physicians. While Figure 9 appears to show a difference between the percentage of income groups who have no regular family physician, the difference is not statistically significant (p=0.15).
Figure 9: Percent of the population in Ottawa reporting they have no regular family physician by income group
Source: Canadian Community Health Survey (CCHS), 2011-2014 combined. Ontario Share File. Statistics Canada. Data Table for Figure 9

Health Equity and Social Determinants of Health in Ottawa | Ottawa Public Health 18
Area level measures of socio-economic advantage and health Hospitalizations. There is a higher rate of all-cause hospitalization in people from the least advantaged neighbourhoods (Quintile 5) compared to the most advantaged (Quintile 1) (Figure 10). A gradient is not seen because the Quintile 2 neighbourhoods have higher hospitalization rates than Quintile 4 and 5 neighbourhoods.
Figure 10: Age standardized rates of all-cause hospitalizations in Ottawa excluding births, still births and mental health discharges by neighbourhood socio-economic advantage.
Source: Inpatient Discharges 2014-2015, Ontario Ministry of Health and Long-Term Care, IntelliHEALTH ONTARIO, Date Extracted: September 19, 2016. Data Table for Figure 10

Health Equity and Social Determinants of Health in Ottawa | Ottawa Public Health 19
Premature mortality. The analysis shows a clear relationship between socio-economic status and premature mortality; the least advantaged Quintile 5 has a higher rate of premature death than the most advantaged Quintile 1 (Figure 11). Quintiles 2 and 3 are not statistically significantly different from one another but have higher premature mortality rates than Quintile 1. Quintile 4 has a higher premature mortality rate than Quintiles 2 or 3 but is lower than Quintile 5.
Figure 11: Premature mortality in Ottawa as premature deaths per 100,000 population by socio-economic quintile.
Source: Ontario Mortality Data 2010-2011, Ontario Ministry of Health and Long-Term Care, IntelliHEALTH ONTARIO, Date Extracted: August 19, 2016. Data Table for Figure 11

Health Equity and Social Determinants of Health in Ottawa | Ottawa Public Health 20
Diabetes. Diabetes prevalence is highest among the least advantaged, with the lowest prevalence seen among those in Quintile 1 (Figure 12). A clear gradient by quintile is not seen between Quintiles 1 and 5. Quintiles 2 through 3 are not statistically different but both rates are higher than those in Quintile 1 and are lower than those in Quintile 5. Diabetes rates in Quintile 4 are not statistically significantly different than those in Quintile 2 but are higher than those in Quintile 1 and 3 and lower than Quintile 5.
Figure 12: Diabetes prevalence as a percent of the population aged 20 and up by neighbourhood socio-economic index score. 2011 data
Sources: Numerator – Combined data from the Ambulatory Emergency 2010-2014, Ontario Ministry of Health and Long-Term Care, IntelliHEALTH ONTARIO, Date Extracted: August 23 2016 and Medical Services 2010-2014, Ontario Ministry of Health and Long-Term Care, IntelliHEALTH ONTARIO, Date Extracted: August 23, 2016. Denominator – ONS neighbourhood populations aged 20+ based on the 2011 Census. Data Table for Figure 12

Health Equity and Social Determinants of Health in Ottawa | Ottawa Public Health 21
Vulnerability at School Entry. Figure 13 shows that neighbourhoods with the least advantage have over 15% more kindergarten children who face greater likelihood of challenges in school learning compared to neighbourhoods with the most advantage13. Vulnerability is measured using the Early Development Instrument, a population-based measure of children’s developmental health at school entry10. Figure 13: Percent of kindergarten children vulnerable in one or more Early Development Instrument domains by neighbourhood socio-economic index score, 2014 to 2015 (Cycle 4)
Source: Adapted from Millar, C., Lafrenière, A., Lebreton, J., de Quimper, C. (2016). Our Kids, Their Story...Snapshot of Developmental Health at School Entry in Ottawa 2005-2015. Data Analysis Coordinators, Parent Resource Centre, Ottawa, ON. 49pp + 4pp (Appendices) Data Table for Figure 13

Health Equity and Social Determinants of Health in Ottawa | Ottawa Public Health 22
Discussion This report shows the relationships between the health of people living in Ottawa and their socio-economic advantage. The data show that in Ottawa, socio-economic position has a strong relationship to mortality and disease and, with some exceptions, to health risks and behaviours as well.
People in lower income groups have a higher prevalence of diabetes, are more likely to have a hospital visit and are more likely to die before the age of 75. They are more likely to self report poor or fair general or mental health and more likely to report having two or more chronic conditions. Smoking is more common among those with lower income and those in lower income groups are less likely to be physically active in leisure time. Those in higher income are more likely to exceed low-risk drinking guidelines or drink heavily. No differences by income were seen among those who are overweight/obese or those without a family physician.
Some measures of health show a gradient, with health status progressively improving as socio-economic status improves; others do not. When the data does not show a gradient, those with the least socio-economic advantage have significantly poorer health status than others in the population.
Data analyses such as these are a small part of the story about an individual’s and a community’s pathway to health. Part of the challenge of examining health equity at either a population or program level is the scarcity of quality data on all determinants of health and their interaction. Partnership with other sectors is required to gain a more comprehensive picture of SDOH and health. Enhanced data collection of SDOH variables will improve the ability of organizations to identify and reduce gaps in health equity.
Ottawa Public Heath uses the National Collaborating Centre for Determinants of Health’s model of public health roles to improve health equity’s approach. This framework consists of five (5) key practical public health roles14. [Document 5: Framework for Public Health Roles to Improve Health Equity].These roles are defined as follows:
1. Assess and report on the existence and impact of health inequities, as well as effective strategies to reduce these inequities
2. Modify and orient public health programs and services to reduce inequities with an understanding of the unique needs of populations that experience marginalization;
3. Partner with other sectors to identify ways to improve health outcomes for populations that experience marginalization
4. Participate in policy development – i.e. lead, support and participate with other organizations in policy analysis and development, and in advocacy for improvements in health determinants and inequities.
5. Organization and system development – i.e. development activities related to organizational (or system) policies, structures, procedures and practices that are required to facilitate/support public health action on health inequities and to manage the required change15.

Health Equity and Social Determinants of Health in Ottawa | Ottawa Public Health 23
Based on the evidence presented in this report, there is a need to address health inequities in Ottawa - to continue to work towards improving overall population health while collectively working to narrow the health equity gap for disadvantaged populations.
Working collaboratively with partners, opportunities exist to establish a common agenda, increase the consistency of existing efforts, and intensify innovation for greater collective impact on health equity16. OPH is committed to health equity and creating equitable opportunities for health through actions as described in this report.

Health Equity and Social Determinants of Health in Ottawa | Ottawa Public Health 24
Figure 14: Ottawa Neighbourhood Study neighbourhoods by Socio-Economic Status (SES) Quintile from Q1 (Most advantaged) to Q5 (Least advantaged)

Health Equity and Social Determinants of Health in Ottawa | Ottawa Public Health 25
Appendix 1: Methods and measures
Methods
Self-reported income measure
Data: Canadian Community Health Survey (CCHS) 2012-2014
Before-tax household income from all sources is reported in the Canadian Community Health Survey (CCHS) using variable inc_3. For each respondent, this income measure is divided by the equivalent household size low income cut-off measure as per Table 15. Each respondent is divided by the highest ratio in Ottawa to yield values from 0 to 1. This measure is then divided into three groups (tertiles) with 33.3% of the weighted estimate of the population in each group as estimated using the survey and bootstrap weights provided in the CCHS. Figure 15 shows this calculation.
Figure 15: Calculation of income categories
Table 2: Before tax low income cut off values by household size for population centres exceeding 500,000 population
Household size Before tax low income cut off
1 person $24,328
2 persons $30,286
3 persons $37,234
4 persons $45,206
5 persons $51,272
6 persons $57,826
7 persons or more $64,381
Source: Statistics Canada. Table 206-0094 - Low income cut-offs (LICOs) before and after tax by community and family size in current dollars, annual, CANSIM (database). (Accessed: Sep 12, 2016)
Age standardizing
Most measures were age standardized using the 2011 Ottawa population using the direct method. This method uses the 2011 Ottawa population as a common age-standard population to account for differences in the age distributions within groups being compared. Standardizing removes the effect of age differences between groups.

Health Equity and Social Determinants of Health in Ottawa | Ottawa Public Health 26
Area comparisons
Area comparisons used administrative data restricted to those living within the Ottawa Public Health Unit and were assigned to Ottawa Neighbourhood Study neighbourhoods using a population weighted allocation file. If a postal code boundary crossed a neighbourhood boundary, the weight ensured that the appropriate number of records was assigned to the respective neighbourhoods based on the proportion of the neighbourhood’s population within that postal code.
Measures
Fair or Poor Self Rated General Health (Age 12 and up)
Data: Canadian Community Health Survey (CCHS) 2012-2014
The proportion of the population age 12 and up who respond "Fair" or "Poor" when asked: "In general, would you say your health is: 'excellent', 'very good', 'good', 'fair', or 'poor'?"
Fair or Poor Self Rated Mental Health (Age 12 and up)
Data: Canadian Community Health Survey (CCHS) 2012-2014
The proportion of the population age 12 and up who respond "Fair" or "Poor" when asked: "In general, would you say your mental health is: 'excellent', 'very good', 'good', 'fair', or 'poor'?"
Reports two or more chronic health conditions (age 20 and up)
Data: Canadian Community Health Survey (CCHS) 2012-2014
The proportion of the population aged 20 and up who respond “Yes” to two or more questions when asked if they have:
• chronic bronchitis, emphysema or chronic obstructive pulmonary disease or COPD • asthma • arthritis, excluding fibromyalgia • heart disease • cancer • Alzheimer’s disease or other dementia • stroke • Type 1 or Type 2 diabetes and excluding gestational diabetes • a mood disorder such as depression, bipolar disorder, mania or dysthymia or an anxiety
disorder such as a phobia, obsessive-compulsive disorder or a panic disorder
The selection of conditions was guided by work by Roberts et al 201517.

Health Equity and Social Determinants of Health in Ottawa | Ottawa Public Health 27
Physical Inactivity during leisure time (Age 12 and up)
Data: Canadian Community Health Survey (CCHS) 2012-2014
The percent of the population considered to be inactive during leisure time based on based on the total daily energy expenditure values (kcal/kg/day) calculated using the self-reported frequency and duration per session of the physical activity as well as the activity metabolic energy cost (MET) expressed as a multiple of the resting metabolic rate. For example, an activity of 4 METS requires four times the amount of energy as compared to when the body is at rest. The activities done by the respondent are provided a single MET value representing the lowest intensity for that activity. This approach is adopted from the Canadian Fitness and Lifestyle Research Institute because individuals tend to overestimate the intensity, frequency and duration of their activities12.
Current smoker (Age 12 and up)
Data: Canadian Community Health Survey (CCHS) 2012-2014
The percent of the population who report being a current smoker (daily or occasional) regardless of how many cigarettes they’ve smoke lifetime. Some definitions of current smoking require a lifetime history of smoking at least 100 cigarettes (about 4 packs).
Overweight and Obesity (Age 18 and up)
Data: Canadian Community Health Survey (CCHS) 2012-2014
This measure combines the categories of overweight or obese categories for adult respondents aged 18 and over (except pregnant women) based on their Body Mass Index (BMI). The BMI categories are adopted from a body weight classification system recommended by Health Canada and the World Health Organization (WHO) which has been widely used internationally.
Exceeding the Low Risk Alcohol Drinking Guidelines (Age 19 and up)
Data: Canadian Community Health Survey (CCHS) 2012-2014
The proportion of people exceeding the Canadian Centre on Substance Abuse’s Low Risk Alcohol Drinking Guidelines18:
• men who drank more than 15 drinks per week total, more than 3 drinks on any single day, drank on more than 5 days per week or in the past year had 5 or more drinks on more than 2 occasions or
• women who drank more than 10 drinks per week total, more than 2 drinks on any single day, drank on more than 5 days per week or in the past year had 4 or more drinks on more than 2 occasions
Heavy drinking (Age 19 and up)
Data: Canadian Community Health Survey (CCHS) 2012-2014
Men who drink more than 5 drinks per occasion or women who drink 4 or more drinks per occasion once a month or more.

Health Equity and Social Determinants of Health in Ottawa | Ottawa Public Health 28
Percent of the population in Ottawa reporting they have no regular family physician
Data: Canadian Community Health Survey (CCHS) 2012-2014
The percent of people who answered “No” to the question “Do you have a regular family doctor?”.
All-ages hospitalizations
Source: Inpatient Discharges 2014-2015, Ontario Ministry of Health and Long-Term Care, IntelliHEALTH ONTARIO, Date Extracted: September 19, 2016.
Numerator: This estimate is based on 2014 and 2015 hospitalization data and excludes births, still births and hospital visits with a mental health issue as the principal reason for admission. The latter are excluded because the majority of such visits are collected in a different database than that used for other causes of admission (e.g. injury, chronic disease) and the two sources cannot be combined.
Denominator: ONS neighbourhood populations based on the 2011 Census.
Premature mortality
Source: Ontario Mortality Data 2010-2011, Ontario Ministry of Health and Long-Term Care, IntelliHEALTH ONTARIO, Date Extracted: August 19 2016.
Numerator: All-cause deaths occurring before the age of 75 years and measured as rate per 100,000 population per year.
Denominator: ONS neighbourhood populations based on the 2011 Census.
Diabetes prevalence
Source: Combined data from the Ambulatory Emergency 2010-2014, Ontario Ministry of Health and Long-Term Care, IntelliHEALTH ONTARIO, Date Extracted: August 23, 2016 and Medical Services 2010-2014, Ontario Ministry of Health and Long-Term Care, IntelliHEALTH ONTARIO, Date Extracted: August 23, 2016.
Numerator: This measure was guided by the Institute for Clinical Evaluative Sciences method for estimating population diabetes prevalence19. For this report, 2012 was the index year. Individuals over the age of 20 were considered to have diabetes if they had:
• a hospitalization for diabetes (ICD-10CA code of E100 to E 149) in 2012 or • who had a primary care visits for diabetes determined by a medical service record code with
a diagnostic code of 250: Diabetes Mellitus (Including Complications) or 248: Diabetes Mellitus with Ocular Complications in 2012 and a second such primary care visit or diabetes related hospitalization in the preceding or following 2 years.
Instances of primary care visits and/or hospitalizations were linked using the encrypted health card numbers in the data.
Denominator: ONS neighbourhood populations aged 20+ based on the 2011 Census.
Health Equity and Social Determinants of Health in Ottawa | Ottawa Public Health 29
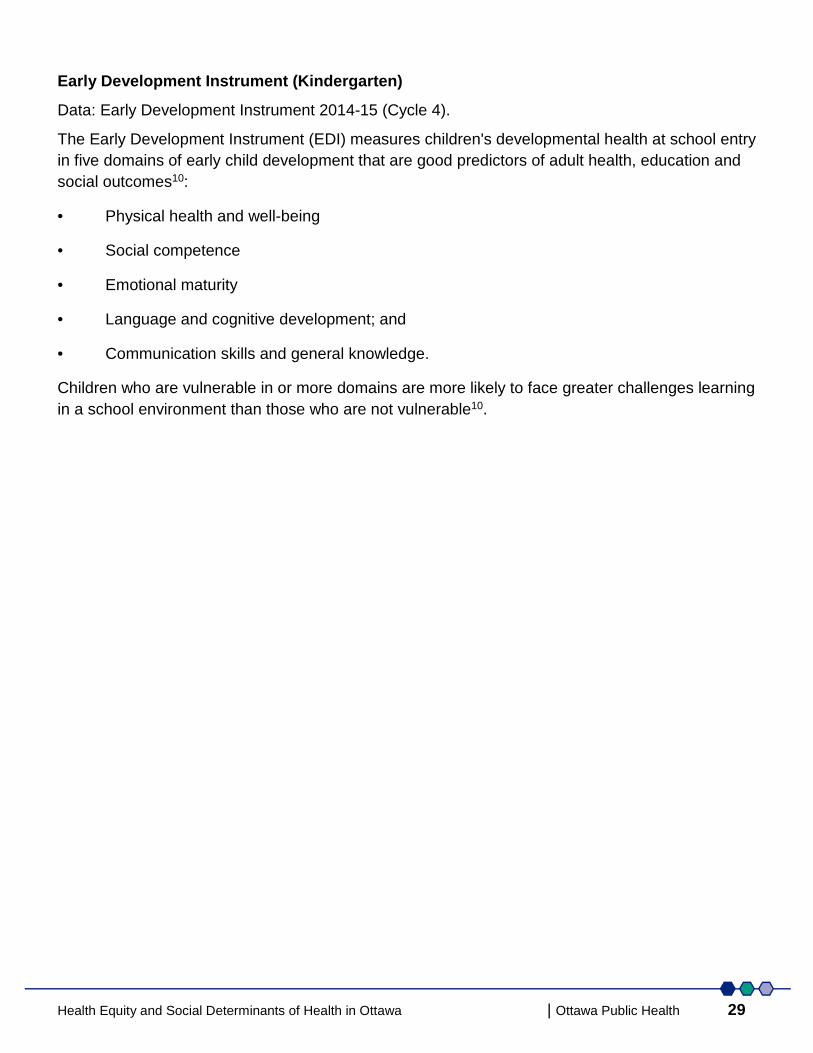
Early Development Instrument (Kindergarten)
Data: Early Development Instrument 2014-15 (Cycle 4).
The Early Development Instrument (EDI) measures children's developmental health at school entry in five domains of early child development that are good predictors of adult health, education and social outcomes10:
• Physical health and well-being
• Social competence
• Emotional maturity
• Language and cognitive development; and
• Communication skills and general knowledge.
Children who are vulnerable in or more domains are more likely to face greater challenges learning in a school environment than those who are not vulnerable10.

Health Equity and Social Determinants of Health in Ottawa | Ottawa Public Health 30
Appendix 2: Data tables Table 3: Data for Figure 1: Percent of the population in Ottawa with self rated general health of "Fair" or "Poor" by income group, age 12 and up
Income category Fair or poor self rated general health 95% Confidence interval
Lowest income 15.9% 4.0%
Middle income 9.6% 2.8%
Highest income 6.1% 2.3%
Source: Canadian Community Health Survey (CCHS), 2011-2014 combined. Ontario Share File. Statistics Canada.
Table 4: Data for Figure 2: Percent of the population in Ottawa with self-rated mental health of "Fair" or "Poor" by income group, age 12 and up
Income category Fair or poor self rated mental health 95% Confidence interval
Lowest income 12.9% 4.5%
Middle income 5.5% 1.9%
Highest income 4.3% 1.5%
Source: Canadian Community Health Survey (CCHS), 2011-2014 combined. Ontario Share File. Statistics Canada.
Table 5: Data for Figure 3: Percent of the population in Ottawa reporting two or more chronic conditions by income group, age 20 and up
Income category Two or more chronic conditions 95% Confidence interval
Lowest income 18.8% 4.0%
Middle income 12.2% 2.6%
Highest income 8.7% 2.6%
Source: Canadian Community Health Survey (CCHS), 2011-2014 combined. Ontario Share File. Statistics Canada.
Table 6: Data for Figure 4: Percent of the population in Ottawa who are overweight or obese by income group, age 18 and up
Income category Overweight or obese 95% Confidence interval
Lowest income 45.6% 5.7%
Middle income 43.2% 4.3%
Highest income 49.0% 5.2%
Source: Canadian Community Health Survey (CCHS), 2011-2014 combined. Ontario Share File. Statistics Canada.

Health Equity and Social Determinants of Health in Ottawa | Ottawa Public Health 31
Table 7: Data for Figure 5: Percent of the population in Ottawa who are physically inactive during leisure time by income group, age 12 and up
Income category Physically inactive during leisure time 95% Confidence interval
Lowest income 49.1% 5.6%
Middle income 34.9% 4.6%
Highest income 34.4% 4.1%
Source: Canadian Community Health Survey (CCHS), 2011-2014 combined. Ontario Share File. Statistics Canada.
Table 8: Data for Figure 6: Percent of the population in Ottawa who are current smokers by income group, aged 19 and up
Income category Current smokers 95% Confidence interval
Lowest income 23.6% 4.3%
Middle income 12.9% 2.8%
Highest income 11.8% 2.7%
Source: Canadian Community Health Survey (CCHS), 2011-2014 combined. Ontario Share File. Statistics Canada.
Table 9: Data for Figure 7: Percent of the population in Ottawa who exceed the Canadian Low Risk Drinking Guidelines by income group, age 19 and up
Income category Exceed Canadian Low Risk Drinking Guidelines 95% Confidence interval
Lowest income 21.2% 6.0%
Middle income 14.4% 5.8%
Highest income 38.7% 5.6%
Source: Canadian Community Health Survey (CCHS), 2011-2014 combined. Ontario Share File. Statistics Canada.
Table 10: Data for Figure 8: Percent of the population in Ottawa who engage in heavy drinking by income group, age 19 and up
Income category Engage in heavy drinking 95% Confidence interval
Lowest income 15.1% 5.8%
Middle income 26.0% 5.2%
Highest income 27.2% 5.1%
Source: Canadian Community Health Survey (CCHS), 2011-2014 combined. Ontario Share File. Statistics Canada.

Health Equity and Social Determinants of Health in Ottawa | Ottawa Public Health 32
Table 11: Data for Figure 9: Percent of the population in Ottawa reporting they have no regular family physician by income group, age 12 and up
Income category No regular family physician 95% Confidence interval
Lowest income 15.4% 3.3%
Middle income 10.5% 2.9%
Highest income 9.6% 2.7%
Source: Canadian Community Health Survey (CCHS), 2011-2014 combined. Ontario Share File. Statistics Canada.
The denominator for the following area measures is the ONS neighbourhood populations based on the 2011 Census population.
Table 12: Data for Figure 10: Age standardized rates of all-cause hospitalizations in Ottawa excluding births, still births and mental health discharges by neighbourhood socio-economic advantage
Income category Hospitalizations per 100,000 95% Confidence interval
Quintile 5 (Least advantage) 6474.2 82.1
Quintile 4 5751.9 82.1
Quintile 3 5664.6 81.8
Quintile 2 6080.8 77.2
Quintile 1 (Most advantage) 5402.6 85.2
Source: Inpatient Discharges 2014-2015, Ontario Ministry of Health and Long-Term Care, IntelliHEALTH ONTARIO, Date Extracted: Sept 19, 2016.
Table 13: Data for Figure 11: Premature mortality in Ottawa as premature deaths per 100,000 populations by neighbourhood socio-economic advantage.
Income category Premature deaths per 100,000 95% Confidence interval
Quintile 5 (Least advantage) 542.0 23.9
Quintile 4 407.9 22.5
Quintile 3 317.1 19.6
Quintile 2 317.9 16.5
Quintile 1 (Most advantage) 276.7 18.1
Source: Ontario Mortality Data 2010-2011, Ontario Ministry of Health and Long-Term Care, IntelliHEALTH ONTARIO, Date Extracted: August 19, 2016.

Health Equity and Social Determinants of Health in Ottawa | Ottawa Public Health 33
Table 14: Data for Figure 12: Diabetes prevalence as a percent of the population aged 20 and up by neighbourhood socio-economic index score
Income category Diabetes prevalence 95% Confidence interval
Quintile 5 (Least advantage) 8.2% 0.2%
Quintile 4 6.8% 0.1%
Quintile 3s 6.5% 0.1%
Quintile 2 6.7% 0.1%
Quintile 1 (Most advantage) 5.4% 0.1%
Sources: Numerator – Combined data from the Ambulatory Emergency 2010-2014, Ontario Ministry of Health and Long-Term Care, IntelliHEALTH ONTARIO, Date Extracted: August 23, 2016 and Medical Services 2010-2014, Ontario Ministry of Health and Long-Term Care, IntelliHEALTH ONTARIO, Date Extracted: August 23, 2016.
Table 15: Percent of kindergarten children vulnerable in one or more Early Development Instrument domains by neighbourhood socio-economic index score, 2014 to 2015 (Cycle 4)
Income category Percent of children with low EDI score in at least 1 domain
95% Confidence interval
Quintile 5 (Least advantage) 38.9% 3.5%
Quintile 4 26.4% 3.3%
Quintile 3 28.5% 3.8%
Quintile 2 23.7% 2.6%
Quintile 1 (Most advantage) 21.2% 4.8%
Source: Adapted from Millar, C., Lafrenière, A., Lebreton, J., de Quimper, C. (2016). Our Kids, Their Story...Snapshot of Developmental Health at School Entry in Ottawa 2005-2015. Data Analysis Coordinators, Parent Resource Centre, Ottawa, ON. 49pp + 4pp (Appendices)

Health Equity and Social Determinants of Health in Ottawa | Ottawa Public Health 34
References 1. Braveman P, Gottlieb L. The Social Determinants of Health: It's Time to Consider the Causes
of the Causes. Public Health Reports 2014; 120 (Supplement 2). 2. Robert Wood Johnson Foundation. A new way to talk about the social determinants of
health. Robert Wood Johnson Foundation; 2010. Available from: http://www.rwjf.org/content/dam/farm/reports/reports/2010/rwjf63023
3. Building a healthier Ottawa: Ottawa Public Health strategic plan 2015-2018. Ottawa Public Health; 2014. Available from: http://documents.ottawa.ca/sites/documents.ottawa.ca/files/documents/oph_strat_plan_2015_en.pdf
4. Ottawa Public Health. State of Ottawa's Health, 2014. Ottawa (ON): Ottawa Public Health; 2014. Available from: http://documents.ottawa.ca/en/node/5912
5. Statistics Canada. Table 109-5337 - Unemployment rate, Canada, provinces, health regions (2015 boundaries) and peer groups, annual (percent), CANSIM (database). [cited 2016 Sep 2];
6. Canadian Mortgage and Housing Corporation website. Core Housing Need, Ottawa Ontario. 2016 [cited 2016 Sep 2]; Available from: http://cmhc.beyond2020.com/HiCOMain_EN.html
7. Mikkonen J, Raphael D. Social Determinants of Health: The Canadian Facts. Toronto: York University School of Health Policy and Management; 2010. Available from: http://www.thecanadianfacts.org/
8. Toronto Public Health. The Unequal City 2015: Income and Health Inequities in Toronto – Technical Report. Toronto Public Health; 2015. Available from : www.toronto.ca/legdocs/mmis/2015/hl/bgrd/backgroundfile-79096.pdf
9. Statistics Canada. Canadian Community Health Survey - Annual Component (CCHS). Statistics Canada website 2016 June 24 [cited 2016 Sep 2]; Available from: http://www23.statcan.gc.ca/imdb/p2SV.pl?Function=getSurvey&SDDS=3226
10. Offord Centre EDI website 2016. How to interpret EDI results. [cited 2016 Sep 2];Available from: https://edi.offordcentre.com/researchers/how-to-interpret-edi-results/
11. Stata Statistical Software [computer program]. Version 14. College Station, TX: StataCorp LP; 2015.
12. Garriguet D, Colley RC. A comparison of self-reported leisure-time physical activity and measured moderate-to-vigorous physical activity in adolescents and adults. Health Reports 2014;25(7):3-11.
13. Millar C, Lafrenière A, Lebreton J, de Quimper C. Our Kids, Their Story...Snapshot of Developmental Health at School Entry in Ottawa 2005-2015. Ottawa (ON): Data Analysis Coordinators, Parent Resource Centre; 2016.
14. National Collaborating Centre for Determinants of Health. Let's talk: Public health roles for improving health equity. National Collaborating Center for Determinants of Health; 2013. Available from: http://nccdh.ca/images/uploads/PHR_EN_Final.pdf
15. Antonello D, Cohen B, Le Ber MJ et al. Develop and test indicators of Ontario local public health agency work to address the social determinants of health to reduce health inequities Phase 2 Report: A case study approach to pilot test indicators. 2016.

Health Equity and Social Determinants of Health in Ottawa | Ottawa Public Health 35
16. National Collaborating Centre for Determinants of Health. Common Agenda for Public Health Action on Health Equity. Antigonish, NS: National Collaborating Centre for Determinants of Health, St. Francis Xavier University; 2016.
17. Roberts KC, Rao DP, Bennett TL, Loukine L, Jayaraman GC. Prevalence and patterns of chronic disease multi-morbidity and associated determinants in Canada. Health Promotion and Chronic Disease Prevention in Canada. Vol 35(6), August 2015
18. Butt, P., Beirness, D., Gliksman, L., Paradis, C., & Stockwell, T. (2011). Alcohol and health in Canada: A summary of evidence and guidelines for low risk drinking. Ottawa, ON: Canadian Centre on Substance Abuse. Available from http://www.ccsa.ca/Resource%20Library/2011-Summary-of-Evidence-and-Guidelines-for-Low-Risk%20Drinking-en.pdf
19. Booth GL, Polsky JY, Gozdyra P, Cauch-Dudek K, Kiran T, Shah BR, Lipscombe LL, Glazier RH. Regional measures of diabetes burden in Ontario. Toronto: Institute for Clinical Evaluative Sciences; 2012.