health equity and the social determinants of health ... equity a… · health equity and the social...
TRANSCRIPT
Northwestern Health UnitHealth Equity and the Social Determinants of Health:
Information for program planning and evaluation 2016
Table of Contents
Introduction ..............................................................................................................................
Socioeconomic Status .............................................................................................................
Food Security ..........................................................................................................................
Housing and Mobility ..............................................................................................................
Social Inclusion and Social Support Networks ........................................................................
Ethnic and Racial Disparities ...................................................................................................
Geographical Factors Affecting Access to Healthcare ............................................................
Data Limitations ......................................................................................................................
References ...............................................................................................................................
1
1
2
3
4
4
5
6
7
January 2016 page 1
Introduction Health equity exists when everyone in a society has the same opportunity to reach their maximum health potential.
Health is influenced by many factors, called determinants of health. These include personal characteristics such as sex and genetics, as well as the economic, social and physical environments where we live, learn, work and play. They are called determinants of health because they can determine the health issues that a person may face and/or the resources and choices available to them as they try to be and stay healthy.
The social determinants of health are those factors that are systemic, a result of the way we organize our society; things like income, social status, gender, education, employment and working conditions, housing, safe and healthy physical environments, and social support networks. The social determinants of health are not equally distributed in our society. Differences in access to the social determinants of health mean that some people or groups have greater risk of poor health.
Health inequities are differences in health status experienced by various individuals or groups in society that are systemic, socially produced (and therefore modifiable), and are judged to be unfair or unjust (Public Health Agency of Canada, 2007).
Priority populations are those groups at increased risk of negative health outcomes because of health inequities.
This report provides a snapshot of several of the determinants of health in the Northwestern Health Unit (NWHU) catchment area as background information to program planning. The topics and indicators in this report were chosen based on their relevance as socioeconomic determinants of health as well as availability of statistics at the regional and local level.
Socioeconomic Status
Socioeconomic status is a well-established predictor of health outcomes, and it is also a key factor that impacts health inequities in populations (Ben-Shlomo et al., 1996). Important socioeconomic factors include income, education and employment; these types of factors can influence an individual’s capacity to access health care and maintain good health, and people with higher socioeconomic status tend to have better overall health.
The NWHU has an unemployment rate of 8.1%, higher than provincial and national estimates of 7.8% and 7.5% respectively. Formal education rates are also lower in the area when compared to the province: 76% of people aged 25-29 have completed high school compared with 91% provincially, and 54% of people aged 25-54 have post-secondary education compared with 67% provincially. Over 1 in 10 people in the NWHU area (11.1%) are in low-income households slightly lower than the provincial
The Northwestern Health Unit is committed to improving the health and health equity of the people in our catchment area. This document provides health unit staff with information for use during program planning and evaluation.
January 2016 page 2
prevalence of 13.9%. Nearly 1 in 5 children in the NWHU area (19.4%) are in low-income houses, compared with 18.1% provincially. (Statistics Canada, 2013).
These statistics indicate that in general the NWHU has a higher proportion of the population considered to have lower socioeconomic status when compared with the rest of the province, and this population is at risk of experiencing health inequities, both in terms of health outcomes and access to care.
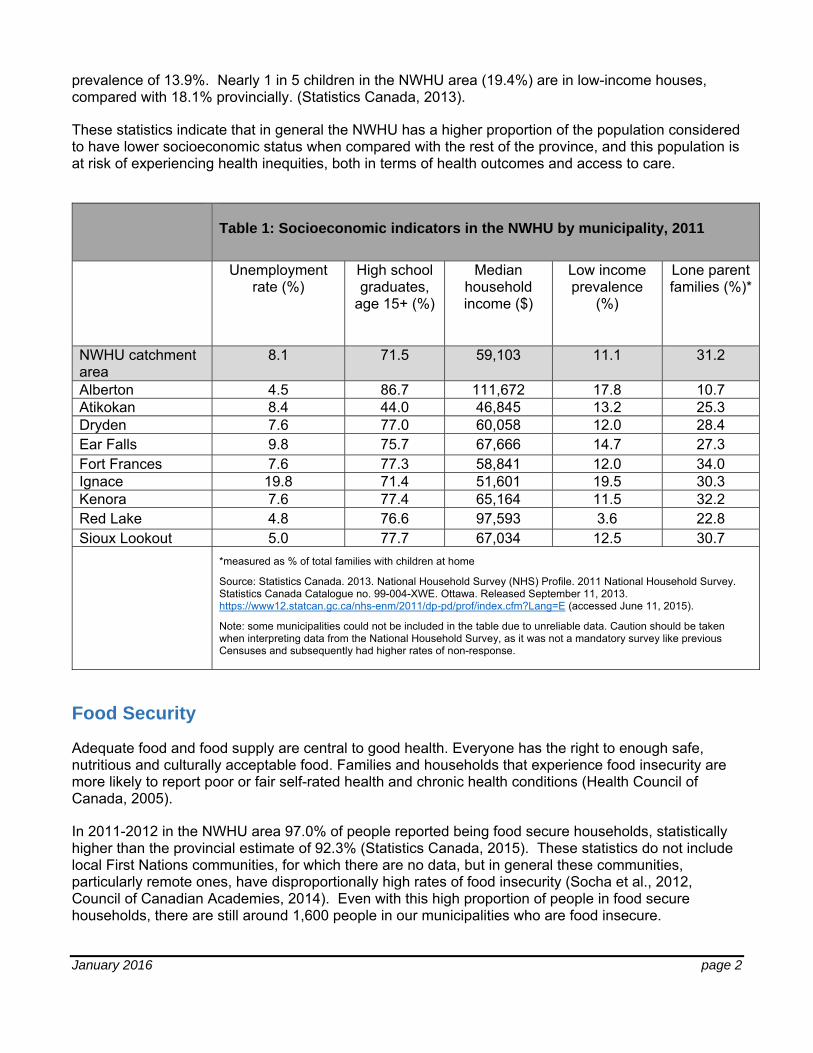
Table 1: Socioeconomic indicators in the NWHU by municipality, 2011
Unemployment rate (%)
High school graduates,
age 15+ (%)
Median household income ($)
Low income prevalence
(%)
Lone parent families (%)*
NWHU catchment area
8.1 71.5 59,103 11.1 31.2
Alberton 4.5 86.7 111,672 17.8 10.7 Atikokan 8.4 44.0 46,845 13.2 25.3 Dryden 7.6 77.0 60,058 12.0 28.4 Ear Falls 9.8 75.7 67,666 14.7 27.3 Fort Frances 7.6 77.3 58,841 12.0 34.0 Ignace 19.8 71.4 51,601 19.5 30.3 Kenora 7.6 77.4 65,164 11.5 32.2 Red Lake 4.8 76.6 97,593 3.6 22.8 Sioux Lookout 5.0 77.7 67,034 12.5 30.7 *measured as % of total families with children at home
Source: Statistics Canada. 2013. National Household Survey (NHS) Profile. 2011 National Household Survey. Statistics Canada Catalogue no. 99-004-XWE. Ottawa. Released September 11, 2013. https://www12.statcan.gc.ca/nhs-enm/2011/dp-pd/prof/index.cfm?Lang=E (accessed June 11, 2015).
Note: some municipalities could not be included in the table due to unreliable data. Caution should be taken when interpreting data from the National Household Survey, as it was not a mandatory survey like previous Censuses and subsequently had higher rates of non-response.
Food Security
Adequate food and food supply are central to good health. Everyone has the right to enough safe, nutritious and culturally acceptable food. Families and households that experience food insecurity are more likely to report poor or fair self-rated health and chronic health conditions (Health Council of Canada, 2005).
In 2011-2012 in the NWHU area 97.0% of people reported being food secure households, statistically higher than the provincial estimate of 92.3% (Statistics Canada, 2015). These statistics do not include local First Nations communities, for which there are no data, but in general these communities, particularly remote ones, have disproportionally high rates of food insecurity (Socha et al., 2012, Council of Canadian Academies, 2014). Even with this high proportion of people in food secure households, there are still around 1,600 people in our municipalities who are food insecure.
January 2016 page 3
Cost of eating continues to rise in the NWHU area, at a faster rate than income or social assistance; in 2015 the cost of feeding a family of four was $1,060.50, an increase of 15.7% since 2010. For a family of four in Ontario Works in the NWHU area, 48% of their income is required for the purchase of food (NWHU, 2015). Cost of eating is particularly high in First Nations communities in the NWHU area; a 2015 study found that costs were about 70% higher on-reserve compared to municipalities (NWHU, 2015).
Housing and Mobility
Housing is necessary in life. Lack of affordable, acceptable housing impacts health in many ways. High cost housing affects the resources that we have left over for living, which can lead to stress and increased sickness. For example, a person who spends a large portion of their income on housing will have less money left over for food and other necessities. Homeless people experience poor health status and have limited access to care. Poor housing conditions from lead, asbestos, cold, heat, radon, dust mites, and bed bugs are linked to negative health outcomes (Raphael, 2004 and Comack and Lyons, 2011).
In the NWHU area the Kenora and the Rainy River District Services Boards provide housing unit for people in need. Housing units are categorized as public non-profit, municipal or federal non-profit and rent supplement. Within the Kenora District there are 1,130 units available throughout the region (Kenora District Services Board, 2015) and in the Rainy River District there are 312 units (Rainy River District Services Board, 2015).
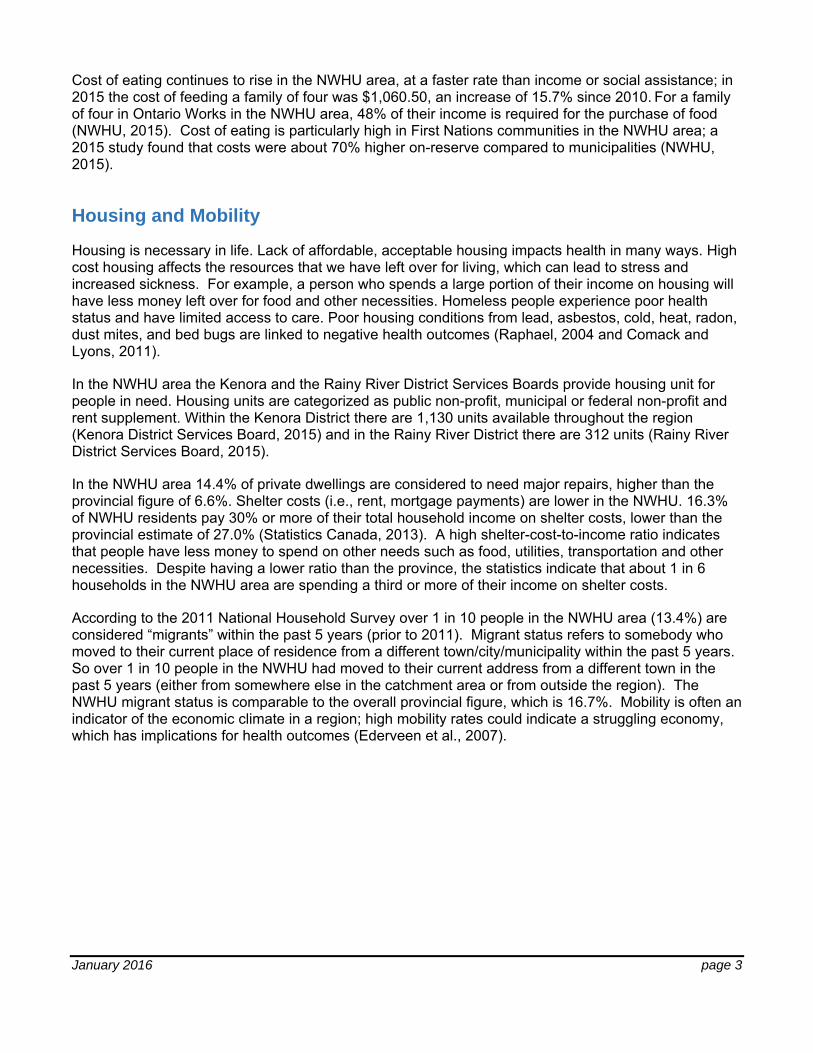
In the NWHU area 14.4% of private dwellings are considered to need major repairs, higher than the provincial figure of 6.6%. Shelter costs (i.e., rent, mortgage payments) are lower in the NWHU. 16.3% of NWHU residents pay 30% or more of their total household income on shelter costs, lower than the provincial estimate of 27.0% (Statistics Canada, 2013). A high shelter-cost-to-income ratio indicates that people have less money to spend on other needs such as food, utilities, transportation and other necessities. Despite having a lower ratio than the province, the statistics indicate that about 1 in 6 households in the NWHU area are spending a third or more of their income on shelter costs.
According to the 2011 National Household Survey over 1 in 10 people in the NWHU area (13.4%) are considered “migrants” within the past 5 years (prior to 2011). Migrant status refers to somebody who moved to their current place of residence from a different town/city/municipality within the past 5 years. So over 1 in 10 people in the NWHU had moved to their current address from a different town in the past 5 years (either from somewhere else in the catchment area or from outside the region). The NWHU migrant status is comparable to the overall provincial figure, which is 16.7%. Mobility is often an indicator of the economic climate in a region; high mobility rates could indicate a struggling economy, which has implications for health outcomes (Ederveen et al., 2007).
January 2016 page 4
Table 2: Housing and mobility indicators in the NWHU by municipality, 2011
Dwellings with major repairs needed (%)
Spending 30% or more of income on shelter costs (%)
Migrants, past 5 years (%)
NWHU catchment area 14.3 16.3 13.4 Alberton 0.0 7.7 24.5 Atikokan 22.0 20.8 13.6 Dryden 10.1 13.4 13.5 Ear Falls 8.3 18.8 17.4 Fort Frances 9.2 22.6 16.6 Ignace 17.5 15.8 12.9 Kenora 11.7 20.8 10.6 Red Lake 11.5 9.3 16.9 Sioux Lookout 6.5 18.3 16.6
Source: Statistics Canada. 2013. National Household Survey (NHS) Profile. 2011 National Household Survey. Statistics Canada Catalogue no. 99-004-XWE. Ottawa. Released September 11, 2013. https://www12.statcan.gc.ca/nhs-enm/2011/dp-pd/prof/index.cfm?Lang=E (accessed June 11, 2015).
Note: some municipalities could not be included in the table due to unreliable data. Caution should be taken when interpreting data from the National Household Survey, as it was not a mandatory survey like previous Censuses and subsequently had higher rates of non-response.
Social Inclusion and Social Support Networks
Social inclusion refers to the state of a community where all people feel valued, their differences are respected and their basic needs are met. Social inclusion or connectedness increases our ability to deal with adversity. It provides us with a sense of community, feelings of belonging, and means we get to participate in the things we want to join. A sense of connectedness and support in a community is linked to overall health and well-being, and those who are strongly connected to the community are less likely to be involved in risky health behaviours (Huron County Health Unit, 2009).
In 2014 77.6% of residents aged 12 and older in the NWHU area reported having a somewhat strong or very strong sense of belonging within their community, which is statistically higher than the provincial estimate of 68.2% (Statistics Canada, 2015).
Ethnic and Racial Disparities
Current evidence indicates that there are inequities in health outcomes and access to care between different ethnic/racial groups, with minorities tending to have poorer overall health (Weinick et al., 2000). Of particular concern in the NWHU area is Aboriginal health; it is well established in Canada that health outcomes are much worse amongst the Aboriginal population when compared with other populations. Socio-economic living conditions of Aboriginal people in Canada are often compared to those in developing countries (Health Council of Ontario, 2005). These poor living conditions have a direct impact on the health of this population.
January 2016 page 5
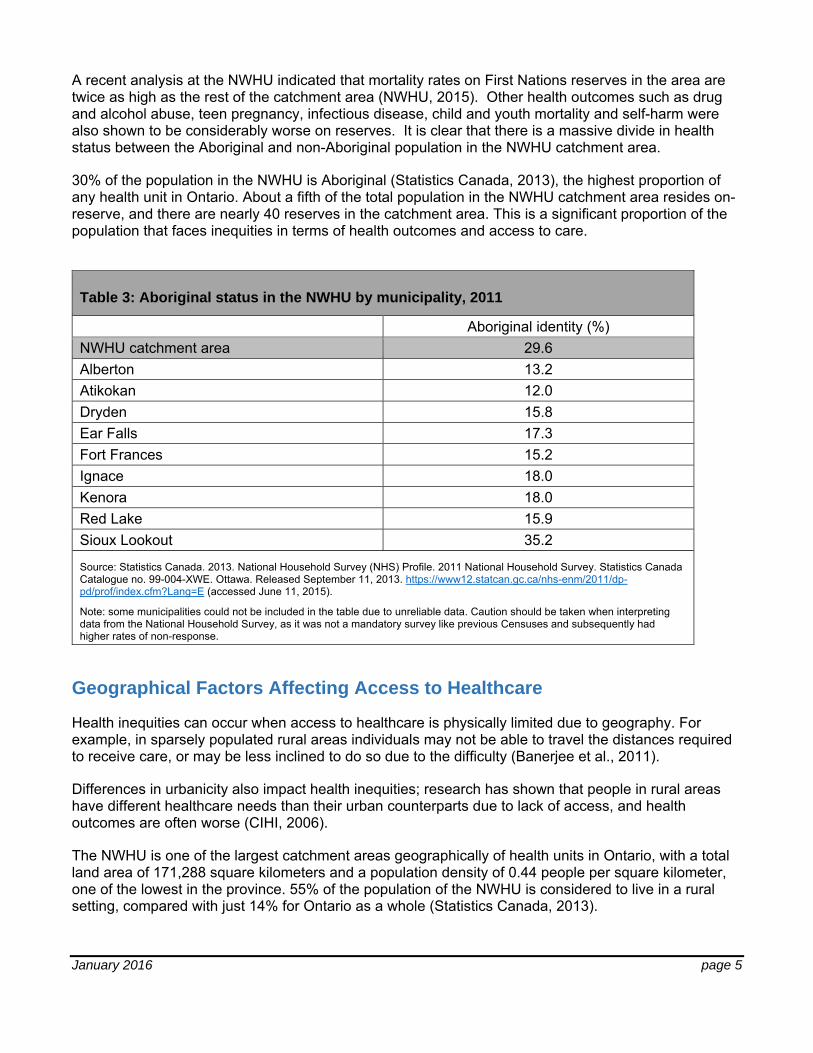
A recent analysis at the NWHU indicated that mortality rates on First Nations reserves in the area are twice as high as the rest of the catchment area (NWHU, 2015). Other health outcomes such as drug and alcohol abuse, teen pregnancy, infectious disease, child and youth mortality and self-harm were also shown to be considerably worse on reserves. It is clear that there is a massive divide in health status between the Aboriginal and non-Aboriginal population in the NWHU catchment area.
30% of the population in the NWHU is Aboriginal (Statistics Canada, 2013), the highest proportion of any health unit in Ontario. About a fifth of the total population in the NWHU catchment area resides on-reserve, and there are nearly 40 reserves in the catchment area. This is a significant proportion of the population that faces inequities in terms of health outcomes and access to care.
Table 3: Aboriginal status in the NWHU by municipality, 2011
Aboriginal identity (%) NWHU catchment area 29.6 Alberton 13.2 Atikokan 12.0 Dryden 15.8 Ear Falls 17.3 Fort Frances 15.2 Ignace 18.0 Kenora 18.0 Red Lake 15.9 Sioux Lookout 35.2
Source: Statistics Canada. 2013. National Household Survey (NHS) Profile. 2011 National Household Survey. Statistics Canada Catalogue no. 99-004-XWE. Ottawa. Released September 11, 2013. https://www12.statcan.gc.ca/nhs-enm/2011/dp-pd/prof/index.cfm?Lang=E (accessed June 11, 2015).
Note: some municipalities could not be included in the table due to unreliable data. Caution should be taken when interpreting data from the National Household Survey, as it was not a mandatory survey like previous Censuses and subsequently had higher rates of non-response.
Geographical Factors Affecting Access to Healthcare
Health inequities can occur when access to healthcare is physically limited due to geography. For example, in sparsely populated rural areas individuals may not be able to travel the distances required to receive care, or may be less inclined to do so due to the difficulty (Banerjee et al., 2011).
Differences in urbanicity also impact health inequities; research has shown that people in rural areas have different healthcare needs than their urban counterparts due to lack of access, and health outcomes are often worse (CIHI, 2006).
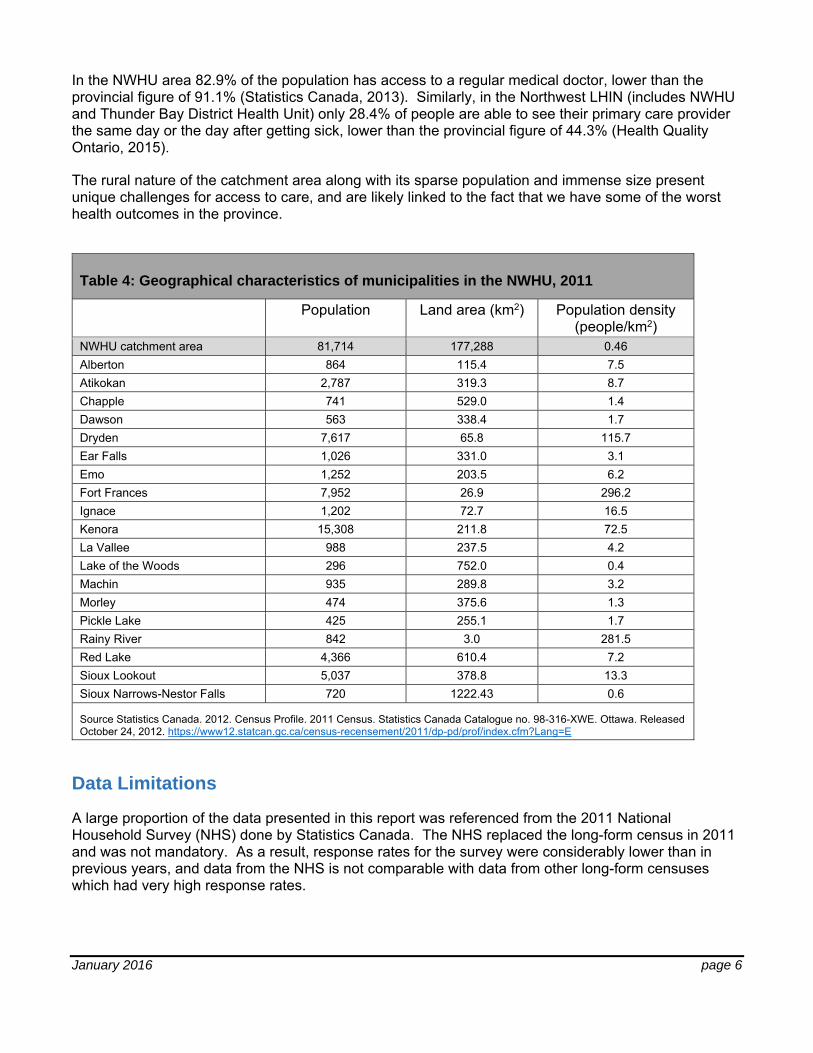
The NWHU is one of the largest catchment areas geographically of health units in Ontario, with a total land area of 171,288 square kilometers and a population density of 0.44 people per square kilometer, one of the lowest in the province. 55% of the population of the NWHU is considered to live in a rural setting, compared with just 14% for Ontario as a whole (Statistics Canada, 2013).
January 2016 page 6
In the NWHU area 82.9% of the population has access to a regular medical doctor, lower than the provincial figure of 91.1% (Statistics Canada, 2013). Similarly, in the Northwest LHIN (includes NWHU and Thunder Bay District Health Unit) only 28.4% of people are able to see their primary care provider the same day or the day after getting sick, lower than the provincial figure of 44.3% (Health Quality Ontario, 2015).
The rural nature of the catchment area along with its sparse population and immense size present unique challenges for access to care, and are likely linked to the fact that we have some of the worst health outcomes in the province.
Table 4: Geographical characteristics of municipalities in the NWHU, 2011
Population Land area (km2) Population density (people/km2)
NWHU catchment area 81,714 177,288 0.46 Alberton 864 115.4 7.5 Atikokan 2,787 319.3 8.7 Chapple 741 529.0 1.4 Dawson 563 338.4 1.7 Dryden 7,617 65.8 115.7 Ear Falls 1,026 331.0 3.1 Emo 1,252 203.5 6.2 Fort Frances 7,952 26.9 296.2 Ignace 1,202 72.7 16.5 Kenora 15,308 211.8 72.5 La Vallee 988 237.5 4.2 Lake of the Woods 296 752.0 0.4 Machin 935 289.8 3.2 Morley 474 375.6 1.3 Pickle Lake 425 255.1 1.7 Rainy River 842 3.0 281.5 Red Lake 4,366 610.4 7.2 Sioux Lookout 5,037 378.8 13.3 Sioux Narrows-Nestor Falls 720 1222.43 0.6
Source Statistics Canada. 2012. Census Profile. 2011 Census. Statistics Canada Catalogue no. 98-316-XWE. Ottawa. Released October 24, 2012. https://www12.statcan.gc.ca/census-recensement/2011/dp-pd/prof/index.cfm?Lang=E
Data Limitations
A large proportion of the data presented in this report was referenced from the 2011 National Household Survey (NHS) done by Statistics Canada. The NHS replaced the long-form census in 2011 and was not mandatory. As a result, response rates for the survey were considerably lower than in previous years, and data from the NHS is not comparable with data from other long-form censuses which had very high response rates.
January 2016 page 7
Due to these low response rates for the NHS, there is a risk that certain demographics or groups of people are under-represented or inaccurately represented. Data quality is therefore an important limitation to consider when interpreting these statistics. The accuracy and validity of the NHS data decreases as the level of geography gets smaller as well; when getting down to the municipal level the uncertainty of the statistical estimates becomes larger, and in some cases data has to be suppressed. This is why in many of the tables presented in this report there are some municipalities in the NWHU catchment area that are not included.
At the time of writing the long-from census has been reinstated and has been scheduled for February 2016, an action that will go a long way to solving these issues, but for now the data quality from the NHS is an important limitation to consider when using these statistics.
Lack of data or data quality issues for Aboriginal populations is another limitation. Some of the NWHU-level statistics in this report didn’t include on-reserve populations in the estimates (food security and cost of food statistics, as well as the social inclusion statistics). Data quality issues from the NHS may also have an impact on the estimates for the NWHU region as well; 13 reserves in northern Ontario were not enumerated during the NHS data collection and were not included in the sample (Statistics Canada, 2015). Also, response rates on reserves in the catchment area were generally low, which impacts the accuracy of the data and how well these populations are represented.
References
Banerjee, A., Banerjee, A. V., & Duflo, E. (2011). Poor Economics: A Radical Rethinking of the Way to Fight Global Poverty. Public Affairs.
Ben-Shlomo, Yoav, Ian R. White, and Michael Marmot. (1996). Does the Variation in the Socioeconomic Characteristics of an Area Affect Mortality? BMJ 312.7037: 1013–1014. www.bmj.com.
Canadian Institute for Health Information. (2006). How healthy are Rural Canadians? An Assessment of Their Health Status and Health Determinants. Retrieved from: https://secure.cihi.ca/free_products/rural_canadians_2006_report_e.pdf
Comack, E., Lyons, J. (2011). Bed Bugs: A Public Health Problem? National Collaborating Centre for Infectious Diseases: Purple Paper, issue 27.
Council of Canadian Academies (2014). Aboriginal Food Security in Northern Canada: An Assessment of the State of Knowledge. Ottawa, ON. The Expert Panel on the State of Knowledge of Food Security in Northern Canada, Council of Canadian Academies.
Ederveen, S., Nahuis, R., & Parikh, A. (2007). Labour Mobility and Regional Disparities: The Role of Female Labour Participation. Journal Of Population Economics, 20(4), 895-913.
Health Council of Canada. (2005). The health status of Canada’s First Nations, Metis and Inuit peoples. Toronto, ON.
Health Quality Ontario. Quality in Primary Care: Setting a foundation for monitoring and reporting in Ontario. Toronto: Queen’s Printer for Ontario; 2015.
Huron County Health Unit. (2009). Huron County Community Health Status Report.
January 2016 page 8
Kenora District Services Board. Housing Services Overview. Retrieved from http://www.kdsb.on.ca/HO.html
Northwestern Health Unit. (2015). First Nations Nutritious Food Basket Results, 2014.
Northwestern Health Unit. (2015). Nutritious Food Basket Results, 2015.
Rainy River District Services Board. Social Housing. Retrieved from: http://www.rrdssab.ca/social-housing
Raphael, D. (2004). Social Determinants of Health, Canadian Perspectives. Canadian Scholars’ Press.
Socha, T., Zahaf, M., Chambers, .L, Abraham, R., Fiddler, T. (2012). Food security in a Northern First Nations Community: An Exploratory Study on Food Availability and Accessibility. Journal of Aboriginal Health. March 2012.
Statistics Canada. (2013). Northwestern Health Unit (Health Region), Ontario and Ontario (table). Health Profile. Statistics Canada Catalogue no. 82-228-XWE. Ottawa. Released December 12, 2013. http://www12.statcan.gc.ca/health-sante/82-228/index.cfm?Lang=E (accessed April 17, 2015).
Statistics Canada. Aboriginal Peoples Reference Guide, National Household Survey, 2011. Retrieved from: http://www12.statcan.gc.ca/nhs-enm/2011/ref/guides/99-011-x/99-011-x2011006-eng.cfm
Statistics Canada. Table 105-0547 - Household food insecurity, by age group and sex, Canada, provinces, territories, health regions (2013 boundaries) and peer groups, occasional (number unless otherwise noted), CANSIM (database). (accessed: 2015-06-23).
Statistics Canada. Table 105-0547 - Household food insecurity, by age group and sex, Canada, provinces, territories, health regions (2013 boundaries) and peer groups, occasional (number unless otherwise noted), CANSIM (database). (accessed: 2015-06-23).
Weinick R. M., Zuvekas S. H., Cohen J. W. (2000). Racial and ethnic differences in access to and use of health care services, 1977 to 1996. Medical care research and review. MCRR 57 (Suppl 1): 36–54