health care employment projections · this study analyzes projected national growth in the health...
TRANSCRIPT

Health Care Employment Projections: An Analysis of Bureau of Labor Statistics Occupational Projections 2010-2020 March 2012 The Center for Health Workforce Studies School of Public Health, University at Albany State University of New York One University Place, Suite 220 Rensselaer, NY 12144-3445 (518) 402-0250 http://chws.albany.edu/ The Center for Health Workforce Studies is a not-for-profit research organization whose mission is to provide timely, accurate data and conduct policy-relevant research about the health workforce. The Center's work assists health, professional, and education organizations; policy makers and planners; and other stakeholders to understand issues related to the supply, demand, distribution, and use of health workers.

1

2
PREFACE
This report, prepared by the Center for Health Workforce Studies (the Center), provides a
summary of labor projections for the period 2010 through 2020 for health care settings and
health care occupations. The report is designed to provide information about projected trends to
help health industry, educators, policy makers, and other stakeholders better understand which
health occupations and professions will be in greatest demand over the next 10 years and how to
better allocate resources to meet the need for those health workers.
The Center is based at the School of Public Health, University at Albany, State University of
New York and is dedicated to studying the supply, demand, education, distribution and
utilization of the health workforce. This report was prepared by Robert Martiniano, Jean Moore,
and Sandra McGinnis. It is based on analyses of the BLS data that was completed by the Center.
The Center would like to acknowledge the National Center for Workforce Analysis for its
assistance in developing this report.
3
EXECUTIVE SUMMARY
This study analyzes projected national growth in the health sector and in health occupations and
is based on an analysis of the federal Bureau of Labor Statistics (BLS) 10-year occupational and
industry projections for employment in the United States, which are released every two years.
The Center's analysis focused on the most significant data related to health sector and health
occupations employment and highlights the increasing importance of the health sector to the U.S.
economy.
The Center found that despite the recent economic downturn, jobs in health care grew while jobs
in other sectors declined. Between 2010 and 2020, jobs in the health care sector are projected to
grow by 30%, more than twice as fast as the general economy and consistent with findings from
previous analyses of BLS projections conducted by the Center.1
Other key findings:
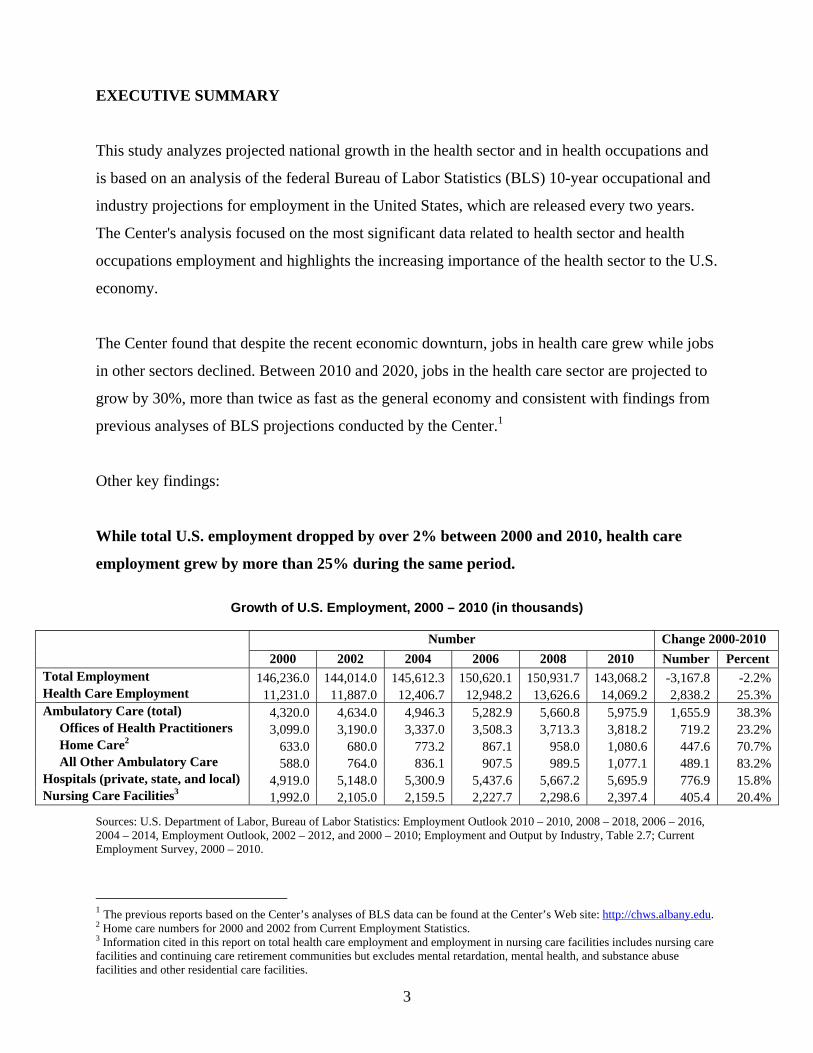
While total U.S. employment dropped by over 2% between 2000 and 2010, health care
employment grew by more than 25% during the same period.
Growth of U.S. Employment, 2000 – 2010 (in thousands)
Number Change 2000-2010
2000 2002 2004 2006 2008 2010 Number Percent Total Employment 146,236.0 144,014.0 145,612.3 150,620.1 150,931.7 143,068.2 -3,167.8 -2.2% Health Care Employment 11,231.0 11,887.0 12,406.7 12,948.2 13,626.6 14,069.2 2,838.2 25.3% Ambulatory Care (total) 4,320.0 4,634.0 4,946.3 5,282.9 5,660.8 5,975.9 1,655.9 38.3% Offices of Health Practitioners 3,099.0 3,190.0 3,337.0 3,508.3 3,713.3 3,818.2 719.2 23.2% Home Care2 633.0 680.0 773.2 867.1 958.0 1,080.6 447.6 70.7% All Other Ambulatory Care 588.0 764.0 836.1 907.5 989.5 1,077.1 489.1 83.2% Hospitals (private, state, and local) 4,919.0 5,148.0 5,300.9 5,437.6 5,667.2 5,695.9 776.9 15.8% Nursing Care Facilities3 1,992.0 2,105.0 2,159.5 2,227.7 2,298.6 2,397.4 405.4 20.4%
Sources: U.S. Department of Labor, Bureau of Labor Statistics: Employment Outlook 2010 – 2010, 2008 – 2018, 2006 – 2016, 2004 – 2014, Employment Outlook, 2002 – 2012, and 2000 – 2010; Employment and Output by Industry, Table 2.7; Current Employment Survey, 2000 – 2010.
1 The previous reports based on the Center’s analyses of BLS data can be found at the Center’s Web site: http://chws.albany.edu. 2 Home care numbers for 2000 and 2002 from Current Employment Statistics. 3 Information cited in this report on total health care employment and employment in nursing care facilities includes nursing care facilities and continuing care retirement communities but excludes mental retardation, mental health, and substance abuse facilities and other residential care facilities.

4
More than 13% of the U.S. labor force worked in the health sector or in a health occupation (19 million jobs out of 143 million jobs in U.S. labor force).
The U.S. Health Workforce, 2010 (in thousands)
The Health Sector Health Occupation Jobs
The health care sector is projected to add over 4.2 million jobs between 2010 and 2020, with 63% of those in ambulatory settings (offices of health practitioners, home health, and other non-institutional settings).
Job Increase by Setting in the U.S. Health Sector, 2010 and 2020 (in thousands)
Number of Jobs Job Increase 2010 2020
Total Employment 143,068.2 163,537.1 20,468.9 Health Sector Employment 14,069.2 18,274.4 4,205.2 Ambulatory Care 5,975.9 8,633.2 2,657.3 Offices of Health Practitioners 3,818.2 5,209.6 1,391.4 Home Health Care 1,080.6 1,952.4 871.8 Other Ambulatory Care 1,077.1 1,471.2 394.1 Hospitals (private, state, & local) 5,695.9 6,638.4 942.5 Nursing Homes 2,397.4 3,002.8 605.4
4,942 health occupation
jobs in other sectors
3,990 other jobs in the
health sector
10,079 health occupation jobs in the health sector

5
Registered nurses, home health aides, and personal care aides are among the occupations nationally projected to have the largest job growth between 2010 and 2020, adding more than 2 million jobs and with another 700,000 job openings due to vacancies from attrition.
Selected Health Occupations with Greatest Need for New Workers between 2010 and 2020

6
BACKGROUND
Every two years, the federal Bureau of Labor Statistics (BLS) publishes 10-year occupational
and industry projections for employment in the United States. These projections are a count of
jobs, not people. They are based on a number of factors, including current employment and
employment trends; labor force participation by age, gender, and race/ethnicity; population
projections; and macroeconomic trends, such as gross domestic product growth, labor
productivity, business investments, and the housing market. Projections for the period 2010-2020
were released in February of 2012. The Center analyzed these projections and summarized the
most significant findings related to health sector and health occupations employment.
This report presents projections for health sector employment4 and health occupations
employment.5 Health occupations employment includes jobs within the health sector, such as
registered nurses (RNs) working in hospitals, as well as jobs outside the health sector, such as
RNs working in schools or for insurance companies. Health sector projections and counts
indicate only new jobs between 2010 and 2020. Counts of jobs by health occupations indicate
new jobs and, in some cases, replacement of existing workers due to attrition.
The BLS projections are national in scope and do not include projections by state or region. State
projections by occupation lag by about one year and should be available in late 2013 on the New
York State Department of Labor Web site. Factors that influence demand for health services
nationally, such as an aging population and economic conditions, are likely to have similar
effects on demand at the regional, state, and local levels, although geographic variation is
possible. It is difficult to accurately predict health care employment because many factors
influence the demand for and use of workers (e.g., the nation’s economy, reimbursement
policies, health workforce shortages, changes in scope of practice, etc.). Nevertheless, the BLS
projections represent the most comprehensive forecast of future jobs in the country. Data from
the Current Employment Statistics from the Bureau of Labor Statistics were also used to prepare
this report.
4 Health sector employment includes all jobs in the various health settings (hospitals, home health care, private practitioner offices, etc.), including those jobs not considered health occupations, such as computer technicians and food service workers. 5 Includes 85 health occupations as identified by the Center for Health Workforce Studies.

7
KEY FINDINGS
A. Health Sector Employment
Since 2000, employment in the health sector nationally has grown 25% while total
employment declined by more than 2%.
Between 2000 and 2010, the overall economy lost over 3 million jobs while jobs in health care
increased by more than 2.8 million. Jobs in ambulatory care increased by more than 1.6 million
between 2000 and 2010, including 720,000 in offices of health practitioners and nearly 450,000
in home care. Hospitals added almost 780,000 jobs and nursing homes added 400,000 jobs
during the same period (Exhibit 1).
Exhibit 1 Growth of U.S. Employment, 2000 – 2010 (in thousands)
Number Change 2000-2010
2000 2002 2004 2006 2008 2010 Number Percent Total employment 146,236.0 144,014.0 145,612.3 150,620.1 150,931.7 143,068.2 -3,167.8 -2.2% Health Care Employment 11,231.0 11,887.0 12,406.7 12,948.2 13,626.6 14,069.2 2,838.2 25.3% Ambulatory Care (total) 4,320.0 4,634.0 4,946.3 5,282.9 5,660.8 5,975.9 1,655.9 38.3% Offices of Health Practitioners6 3,099.0 3,190.0 3,337.0 3,508.3 3,713.3 3,818.2 719.2 23.2% Home Care7 633.0 680.0 773.2 867.1 958.0 1,080.6 447.6 70.7% All Other Ambulatory Care 588.0 764.0 836.1 907.5 989.5 1,077.1 489.1 83.2% Hospitals (private, state, and local)8 4,919.0 5,148.0 5,300.9 5,437.6 5,667.2 5,695.9 776.9 15.8% Nursing Care Facilities9 1,992.0 2,105.0 2,159.5 2,227.7 2,298.6 2,397.4 405.4 20.4%
Sources: U.S. Department of Labor, Bureau of Labor Statistics: Employment Outlook 2010-2010, 2008-2018, 2006-2016, 2004-
2014, 2002-2012, 2000-2010; Employment and Output by Industry, Table 2.7; Current Employment Survey, 2000-2010. Health care employment comprises a growing share of the total U.S. workforce.
In 2010, there were more than 19 million jobs either in the health sector or in health occupations
outside of the health sector, accounting for over 13% of the total U.S. workforce. Of those 19
6 Includes offices of physicians, dentists, chiropractors, podiatrists, and other community-based providers. 7 Home care employment numbers for 2000 and 2002 from Current Employment Statistics. Health care employment was not listed separately in Employment Outlook reports until 2004. 8 State and locally operated hospitals projected separately between 2000 and 2006 but combined for purposes of this report. Federally operated hospitals are excluded from this analysis. 9 Information cited in this report on total health care employment and employment in nursing care facilities includes nursing care facilities and continuing care retirement communities but excludes mental retardation, mental health, and substance abuse facilities and other residential care facilities. Numbers for the excluded facilities between 2000 and 2006 are from Current Employment Statistics.

8
million jobs in 2010, more than 14 million jobs, or nearly 11% of U.S. employment, were in the
health sector, including both health and non-health-related occupations. The remaining 4 million
jobs, or 2.8% of U.S. employment, were in health occupations outside of the health sector
(Exhibits 2 and 3).
Exhibit 2 The U.S. Health Workforce, 2010
(in thousands)
The Health Sector Health Occupation Jobs
Exhibit 3 The U.S. Health Workforce, 2010 (In thousands)
Health Occupation
Jobs Other Jobs Totals Health Care Settings 10,079.1 3,990.1 14,069.2 Other Work Settings 4,942.2 124,056.8 128,999.0
Totals 15,021.3 128,046.9 143,068.2
Number
Percent of Civilian Labor
Workforce Health occupation jobs in health care settings 10,079.1 7.0%Other jobs in health care settings 4,942.2 3.5%Health occupation jobs in other settings 3,990.1 2.8%Total U.S. Health Care Jobs 19,011.4 13.3%
Sources: U.S. Department of Labor, Bureau of Labor Statistics, National Employment Matrix, employment by industry,
occupation, and percent distribution, 2010 and projected 2020.
4,942 health occupation
jobs in other sectors
3,990 other jobs in the
health sector 10,079 health
occupation jobs in the health sector

9
Between 2008 and 2010, jobs in health occupations both within and outside of the health
sector increased, while “other jobs” in the health sector declined.
While employment in the health sector grew overall between 2008 and 2010, the growth was
only in health occupations. “Other job” categories showed reductions in employment in the
health sector, including financial clerks, food preparation workers, laundry workers, and
housekeepers. In contrast, while 8.2 million “other” jobs were lost in other work sectors, nearly
130,000 jobs were created for health professionals in those same settings (Exhibit 4).
Exhibit 4 Changes in The U.S. Health Workforce, 2008-2010 (In thousands)
Health Occupation
Jobs Other Jobs Totals Health Care Settings 479.6 -236.8 245.2 Other Work Settings 128.9 -8,235.2 -8,108.7
Totals 601.6 -8,472.0 -7,863.5
Sources: U.S. Department of Labor, Bureau of Labor Statistics, National Employment Matrix, employment by industry, occupation, and percent distribution, 2010 and projected 2020; National Employment Matrix, employment by industry,
occupation, and percent distribution, 2008 and projected 2018.

10
Between 2010 and 2020, employment in the country’s health sector is projected to grow at a
significantly higher rate than all other employment sectors.
Health sector employment is projected to grow from over 14 million jobs in 2010 to nearly 18.3
million jobs in 2020, an increase of 30%, compared to only 13% growth for jobs in all other
employment sectors (Exhibits 5 and 6).
Exhibit 5
Job Growth in the Health Sector Compared to All Other Employment Sectors in the U.S. 2000-2010 and Projected 2010-2020 (in thousands)
Employment Increase 2000 2010 2020 2000-2010 2010-2020 Other Sector Employment 135,005.0 128,999.0 145,262.7 -6,006.0 16,263.7Health Sector Employment 11,231.0 14,069.2 18,274.4 2,838.2 4,205.2Total Employment 146,236.0 143,068.2 163,537.1 -3,167.8 20,468.9
Exhibit 6
Percentage Job Growth in the Health Sector Compared to All Other Employment Sectors in the U.S., 2000-2010 and Projected 2010-2020
Sources: U.S. Department of Labor, Bureau of Labor Statistics, National Employment Matrix, employment by industry, occupation, and percent distribution, 2010 and projected 2020; Employment and Output by Industry, Table 2.7; Current
Employment Survey, 2000-2010.

11
By 2020, nearly one in nine jobs in the U.S. is projected to be in the health sector.
Between 2000 and 2010, the health sector added the most jobs, outpacing job growth for all other
service sectors combined. During the same period, jobs in goods producing and in agriculture,
forestry, hunting and fishing, and the self-employed declined. Health sector employment is
expected to comprise a larger share of total U.S. employment by 2020 than it has in the past. By
2020, that proportion is projected to increase to more than one in nine jobs (11%), and 80% of
employment in the U.S. will be in service sectors10 (Exhibits 7 and 8).
Exhibit 7 Change in U.S. Employment by Job Sector, 2000-2010
Change in Jobs
2000 2010 2020 2000-2010 2010-2020 Health Care Sector 11,230.9 14,069.2 18,274.4 2,838.3 4,205.2Other Service Sectors 96,624.4 98,660.9 112,405.6 2,036.5 13,744.7Goods Producing 24,569.7 17,705.5 19,496.7 -6,864.2 1,791.2Agriculture, forestry, hunting, fishing, and self-employed 13,811.0 12,632.6 13,360.8 -1,178.4 728.2
Total Employment 146,236.0 143,068.2 163,537.5 -3,167.8 20,469.3
Exhibit 8 Projected Percent Distribution by Job Sector, 20205
Sources: U.S. Department of Labor, Bureau of Labor Statistics, National Employment Matrix, employment by industry, occupation, and percent distribution, 2010 and projected 2020; Employment and Output by Industry, Table 2.7; Current
Employment Survey, 2000-2010.
10 Besides health, other service sectors include retail and wholesale trade, information technology services, banking, education, government, transportation, and utilities. Other sectors include manufacturing, construction, mining, and agriculture, forestry, fishing, and hunting.

12
Between 2010 and 2020, the fastest job growth in the health sector nationally is projected in
home health care, followed by offices of health practitioners.
Home health care is projected to experience the fastest job growth across all health settings, with
an average annual growth of more than 8% between 2010 and 2020 (87,000 new jobs per year),
surpassing the average annual growth for home health care between 2000 and 2010.
Additionally, jobs in offices of health practitioners are projected to grow by over 3% annually
(139,000 new jobs) and jobs in nursing homes are projected to increase by more than 2% (60,000
new jobs) annually between 2010 and 2020. Jobs in hospitals are projected to grow by nearly 2%
annually during the same period (94,000 new jobs) (Exhibit 9).
Exhibit 9
Average Annual Job Growth for Selected Settings within the U.S. Health Sector, 2000-2010 and 2010-2020
Sources: U.S. Department of Labor, Bureau of Labor Statistics, National Employment Matrix, employment by industry, occupation, and percent distribution, 2010 and projected 2020; Employment and Output by Industry, Table 2.7; Current
Employment Survey, 2000-2010.

13
Between 2010 and 2020, offices of health practitioners in the U.S. are projected to add
almost 1.4 million new jobs and, by 2020, comprise more than 29% of jobs in the health
sector by 2020.
Employment in offices of health practitioners is expected to increase by nearly 1.4 million new
jobs between 2010 and 2020. By 2020, jobs in offices of health practitioners will represent 29%
of total health sector jobs. Hospitals are projected to add over 940,000 jobs between 2010 and
2020, and jobs in home health care are estimated to increase by nearly 900,000 over the same
period (Exhibits 10 and 11).
Exhibit 10 Job Increase by Setting in the U.S. Health Sector, 2010 and 2020 (in thousands)
Number of Jobs Job
Increase 2010 2020 Ambulatory Care 5,975.9 8,633.2 2,657.3 Offices of Health Practitioners 3,818.2 5,209.6 1,391.4 Home Health Care 1,080.6 1,952.4 871.8 Other Ambulatory Care 1,077.1 1,471.2 394.1 Hospitals (private, state, and local) 5,695.9 6,638.4 942.5 Nursing Homes 2,397.4 3,002.8 605.4
Exhibit 11
Projected Percent of Jobs by Setting in the U.S. Health Sector, 2020
Sources: U.S. Department of Labor, Bureau of Labor Statistics, National Employment Matrix, employment by industry, occupation, and percent distribution, 2010 and projected 2020.

14
Offices of physicians are projected to add nearly 760,000 new jobs nationally between 2010
and 2020.
Offices of physicians are projected to grow by nearly 33% between 2010 and 2020, adding
almost 760,000 new jobs, representing more than 54% of all new jobs in ambulatory care
settings. Offices of other health practitioners, such as chiropractors or podiatrists, and offices of
dentists are each projected to grow substantially between 2010 and 2020 (369,000 and 265,000
jobs respectively) (Exhibit 12).
Exhibit 12 Job Growth for Offices of Health Practitioners in the U.S. between 2010 and 2020
Sources: U.S. Department of Labor, Bureau of Labor Statistics, National Employment Matrix, employment by industry, occupation, and percent distribution, 2010 and projected 2020.
B. Health Occupations Employment Between 2010 and 2020, nearly 7.5 million health workers will be needed nationally to fill
new jobs and to replace workers who leave their jobs across all employment sectors.
The total number of health workers across all employment sectors will increase by more than 4.7
million between 2010 and 2018 (Appendix 1). In addition, another 2.7 million health workers
will be needed to replace individuals expected to leave their jobs (e.g., retirements, attrition from
the profession, etc.) over the same period.

15
Between 2010 and 2020, 16 of the 30 occupations with the largest percentage increases are
in health care, including the top two.
Jobs for both personal care aides and home health aides are projected to increase substantially
between 2010 and 2020, by 71% and 69%, respectively. The projected fastest growing health
occupations include:
• Personal care aides (71%);
• Home health aides (69%);
• Veterinary technologists and technicians (52%);
• Physical therapy assistants (46%);
• Diagnostic medical sonographers (44%);
• Occupational therapy assistants (43%);
• Physical therapy aides (43%);
• Medical secretaries (41%);
• Marriage and family therapists (41%); and
• Physical therapists (39%).
Between 2010 and 2020, eight of the 30 occupations with the largest numerical increase in
jobs are in health care, including three of the top four.
Jobs for RNs are projected to grow by almost 712,000 between 2010 and 2020, the largest
growing profession in the U.S., followed by home health aides and personal care aides. The
health occupations with the largest projected growth include:
• Registered nurses (712,000);
• Home health aides (706,000);
• Personal care aides (607,000);
• Nursing aides, orderlies, and attendants (302,000);
• Medical secretaries (210,000);
• Licensed practical and licensed vocational nurses (169,000);
• Physicians and surgeons (168,000); and
• Medical assistants (163,000).

16
Over 1.2 million new RNs will be needed in the U.S. between 2010 and 2020 to fill new and
existing jobs.
Between 2010 and 2020, more than 1.2 million new RNs will be needed nationwide, including
almost 500,000 to replace RNs leaving the profession. During the same period, nearly 840,000
home health aides; about 675,000 personal and home care aides; almost 500,000 nursing aides,
orderlies, and attendants; and nearly 370,000 LPNs will be needed to fill new and existing jobs
(Exhibit 13).
Exhibit 13 Selected Health Occupations with Greatest Need for New Workers between 2010 and 2020
Sources: U.S. Department of Labor, Bureau of Labor Statistics, National Employment Matrix, employment by industry,
occupation, and percent distribution, 2010 and projected 2020.

17
RN job growth between 2010 and 2020 in the U.S. is projected to be greatest in hospitals
and offices of health practitioners.
Demand for RNs in health care settings is projected to grow between 2010 and 2020, with more
than 662,000 RN jobs created. The largest growth in RNs jobs will occur in hospitals (389,000),
followed by offices of health practitioners (115,000) and home health care (81,000). Nearly
50,000 new jobs will be created for RNs in employment settings outside of health care (Exhibit
14).
Exhibit 14 Job Growth for RNs by Health Sector Setting, 2010-2020
Sources: U.S. Department of Labor, Bureau of Labor Statistics, National Employment Matrix, employment by industry, occupation, and percent distribution, 2010 and projected 2020.

18
CONCLUSION
While the recent recession adversely affected employment within the overall economy, jobs for
health professionals were not nearly as impacted, both within and outside of the health sector.
Between 2008 and 2010, over 600,000 new jobs were created for health professionals, with
almost 480,000 added in the health sector. The health sector did experience job loss though, with
nearly 240,000 “other jobs” lost in the health sector between 2008 and 2010, such as janitorial
and food service workers.
The health sector is projected to continue to grow between 2010 and 2020, adding more than 4
million jobs during that time. Much of that growth is projected in offices of health practitioners
and home health care. While the projections indicate that the health sector will continue to grow
faster than the overall economy, many of the high growth jobs, such as home health aides;
personal care aides; nursing aides, orderlies, and attendants; or licensed practical nurses; will
require minimally a high school diploma (or equivalent) or a postsecondary non-degree
certificate. Other high growth jobs, such as medical secretaries, veterinary technologists and
technicians, physical therapy assistants, and occupational therapy assistants will require an
associate degree.

2010 2020 Number Percent15,021.3 19,744.0 4,722.7 31.4% 7,428.6
Registered nurses 29-1111 2,737.4 3,449.3 711.9 26.0% 1,207.4Home health aides 31-1011 1,017.7 1,723.9 706.3 69.4% 837.5Personal and home care aides 39-9021 861.0 1,468.0 607.0 70.5% 675.2Nursing aides, orderlies, and attendants 31-1012 1,505.3 1,807.2 302.0 20.1% 496.1Licensed practical and licensed vocational nurses 29-2061 752.3 920.8 168.5 22.4% 369.2Physicians and surgeons 29-1060 691.0 859.3 168.3 24.4% 305.1Medical secretaries 43-6013 508.7 718.9 210.2 41.3% 278.4Medical assistants 31-9092 527.6 690.4 162.9 30.9% 243.8Pharmacy technicians 29-2052 334.4 442.6 108.3 32.4% 166.3Dental assistants 31-9091 297.2 388.9 91.6 30.8% 154.0Medical and health services managers 11-9111 303.0 371.0 68.0 22.4% 141.9Pharmacists 29-1051 274.9 344.6 69.7 25.4% 139.6Emergency medical technicians and paramedics 29-2041 226.5 301.9 75.4 33.3% 120.8Dental hygienists 29-2021 181.8 250.3 68.5 37.7% 104.9Physical therapists 29-1123 198.6 276.0 77.4 39.0% 100.6Radiologic technologists and technicians 29-2037 219.9 281.0 61.0 27.8% 95.1Health care social workers 21-1022 152.7 203.9 51.2 33.5% 87.4Clinical, counseling, and school psychologists 19-3031 154.3 188.0 33.7 21.9% 82.3Medical records and health information technicians 29-2071 179.5 217.3 37.7 21.0% 73.7Mental health counselors 21-1014 120.3 163.9 43.6 36.3% 69.4Mental health and substance abuse social workers 21-1023 126.1 165.6 39.5 31.3% 69.4Dentists, general 29-1021 130.7 158.3 27.6 21.1% 66.4All other health care support workers 31-9799 202.3 237.0 34.8 17.2% 65.8Rehabilitation counselors 21-1015 129.8 166.4 36.6 28.2% 64.4Occupational therapists 29-1122 108.8 145.2 36.4 33.5% 57.1Massage therapists 31-9011 153.7 184.6 30.9 20.1% 55.9Veterinary technologists and technicians 29-2056 80.2 121.9 41.7 52.0% 55.7Medical and clinical laboratory technicians 29-2012 161.2 184.9 23.8 14.7% 55.1Respiratory therapists 29-1126 112.7 143.9 31.2 27.7% 52.7Speech-language pathologists 29-1127 123.2 152.0 28.8 23.4% 52.3Medical and clinical laboratory technologists 29-2011 169.4 188.6 19.2 11.3% 52.1Environmental scientists and specialists, including health 19-2041 89.4 106.1 16.7 18.7% 43.2Medical scientists, except epidemiologists 19-1042 100.0 136.5 36.4 36.4% 42.6Substance abuse and behavioral disorder counselors 21-1011 85.5 108.9 23.4 27.3% 41.7Physical therapist assistants 31-2021 67.4 98.2 30.8 45.7% 41.2Physician assistants 29-1071 83.6 108.3 24.7 29.5% 40.6Health care technologists and technicians, all other 29-2799 93.5 115.2 21.7 23.2% 40.4Health educators 21-1091 63.4 86.6 23.2 36.5% 36.9Dietitians and nutritionists 29-1031 64.4 77.1 12.7 19.7% 35.4Veterinarians 29-1131 61.4 83.4 22.0 35.9% 34.2Surgical technologists 29-2055 93.6 111.3 17.7 18.9% 33.9Health care practitioners and technical workers, all other 29-9799 60.4 71.9 11.5 19.0% 32.8Diagnostic medical sonographers 29-2032 53.7 77.1 23.4 43.5% 31.7Opticians, dispensing 29-2081 62.6 80.7 18.1 28.9% 30.6Physical therapist aides 31-2022 47.0 67.3 20.3 43.1% 27.6Occupational health and safety specialists 29-9011 58.7 63.7 5.0 8.5% 25.7Chiropractors 29-1011 52.6 67.4 14.9 28.3% 25.3Psychiatric technicians 29-2053 74.9 86.4 11.6 15.5% 24.6Optometrists 29-1041 34.2 45.5 11.3 33.1% 23.4Marriage and family therapists 21-1013 36.0 50.8 14.8 41.2% 22.6Environmental engineers 17-2081 51.4 62.7 11.3 21.9% 22.6Pharmacy aides 31-9095 50.8 65.3 14.5 28.6% 22.3Medical equipment repairers 49-9062 37.9 49.9 11.9 31.5% 22.3Cardiovascular technologists and technicians 29-2031 49.4 63.9 14.5 29.3% 22.1Veterinary assistants and laboratory animal caretakers 31-9096 73.2 83.6 10.4 14,2% 21.6Health diagnosing and treating practitioners, all other 29-1199 55.6 66.2 10.6 19.0% 21.2Medical transcriptionists 31-9094 95.1 100.7 5.6 5.9% 20.2Environmental science and protection technicians, including health 19-4091 29.6 36.6 7.0 23.6% 19.5Psychiatric aides 31-1013 67.7 77.9 10.2 15.1% 19.0Occupational therapist assistants 31-2011 28.5 40.8 12.3 43.3% 16.8Therapists, all other 29-1128 33.1 42.3 9.2 27.9% 16.3Medical equipment preparers 31-9093 49.2 57.8 8.6 17.5% 16.2Ophthalmic laboratory technicians 51-9083 29.8 33.6 3.8 12.8% 13.2Dental laboratory technicians 51-9081 40.9 41.2 0.3 0.8% 13.2
Total job openings due to growth and net replacements,
2010 - 2020
Appendix 1: Health Care Employment by Occupation, 2010 and Projected 2020 (In Thousands of Jobs)
Matrix CodeOccupation
Employment Change
Source: Bureau of Labor Statistics: Employment by Occupation, 2010 and Projected 2020

2010 2020 Number Percent15,021.3 19,744.0 4,722.7 31.4% 7,428.6
Total job openings due to growth and net replacements,
2010 - 2020
Appendix 1: Health Care Employment by Occupation, 2010 and Projected 2020 (In Thousands of Jobs)
Matrix CodeOccupation
Employment Change
Athletic trainers 29-9091 18.2 23.7 5.5 30.0% 11.9Recreational therapists 29-1125 22.4 26.3 3.8 17.1% 11.9Ambulance drivers and attendants, except emergency medical technicians 53-3011 19.6 25.9 6.3 32.1% 10.1Psychologists, all other 19-3039 17.5 20.6 3.2 18.2% 8.7Environmental engineering technicians 17-3025 18.8 23.3 4.6 24.3% 8.2Health and safety engineers, except mining safety engineers and inspectors 17-2111 23.7 26.8 3.1 13.0% 8.2Dietetic technicians 29-2051 24.2 28.1 3.9 16.0% 8.1Forensic science technicians 19-4092 13.0 15.4 2.4 18.6% 7.9Nuclear medicine technologists 29-2033 21.9 26.1 4.1 18.9% 7.5Radiation therapists 29-1124 16.9 20.3 3.4 20.3% 6.7Audiologists 29-1181 13.0 17.8 4.8 36.8% 5.6Podiatrists 29-1081 12.9 15.5 2.6 20.0% 5.1Occupational health and safety technicians 29-9012 10.6 12.0 1.4 12.9% 5.1Medical appliance technicians 51-9082 14.2 14.7 0.5 3.7% 5.0Orthodontists 29-1023 8.3 10.1 1.8 21.1% 4.2Oral and maxillofacial surgeons 29-1022 8.0 9.7 1.7 21.3% 4.1Occupational therapist aides 31-2012 7.5 9.9 2.5 33.0% 3.6Dentists, all other specialistst 29-1029 7.8 8.7 0.9 11.7% 3.2Respiratory therapy technicians 29-2054 13.8 14.3 0.6 4.1% 3.0Orthotists and prosthetists 29-2091 6.3 7.0 0.8 12.1% 2.0Epidemiologists 19-1041 5.0 6.1 1.2 23.6% 1.5Prosthodontists 29-1024 1.0 1.2 0.2 21.4% 0.5
Source: Bureau of Labor Statistics: Employment by Occupation, 2010 and Projected 2020