health, absence, disability, and presenteeism cost...
TRANSCRIPT
Health, Absence, Disability, and PresenteeismCost Estimates of Certain Physical and MentalHealth Conditions Affecting U.S. Employers
Ron Z. Goetzel, PhDStacey R. Long, MSRonald J. Ozminkowski, PhDKevin Hawkins, PhDShaohung Wang, PhDWendy Lynch, PhD
Evidence about the total cost of health, absence, short-term disability,and productivity losses was synthesized for 10 health conditions. Costestimates from a large medical/absence database were combined withfindings from several published productivity surveys. Ranges of condi-tion prevalence and associated absenteeism and presenteeism (on-the-job-productivity) losses were used to estimate condition-related costs.Based on average impairment and prevalence estimates, the overalleconomic burden of illness was highest for hypertension ($392 pereligible employee per year), heart disease ($368), depression and othermental illnesses ($348), and arthritis ($327). Presenteeism costs werehigher than medical costs in most cases, and represented 18% to 60%of all costs for the 10 conditions. Caution is advised when interpretingany particular source of data, and the need for standardization infuture research is noted. (J Occup Environ Med. 2004;46:398–412)
B usiness leaders are becoming in-creasingly aware of the productivity-related cost burden imposed by cer-tain health and disease conditions,manifested by employee absence andon-the-job productivity losses.1– 4
Several investigators have developedinnovative methods to quantify pro-ductivity losses and to translate thoselosses into dollar terms for specifichealth and disease categories5–12 oracross multiple health condi-tions.13,14 The tools used in suchstudies, and the results obtained,vary significantly from 1 researcherto another. As Sennett has noted,“Productivity is particularly difficultto calculate, due in part to the lack ofstandard metrics.”15 Nonetheless,there is growing interest on the partof employers and insurers to gener-ate estimates of productivity decre-ments related to common health anddisease conditions found in theworkplace. (See, for example, theeffort by the Washington BusinessGroup on Health [WBGH] and theIntegrated Benefits Institute [IBI] toestablish standard metrics for theCouncil on Employee Health andProductivity, web address: http://www.wbgh.org [date of most recentaccess: 8/03]).
This article compiles data fromvarious approaches to measuringproductivity losses in the workplacerelated to certain prevalent andcostly health conditions. Using astandard yardstick that quantifies ab-sence and on-the-job productivityloss, we examine various studies thatattempt to quantify productivity im-
From the Institute for Health and Productivity Studies, Cornell University (Dr Goetzel); TheMEDSTAT Group (Dr Goetzel, Ms Long, Dr Ozminkowski, Dr Hawkins, Dr Wang); and LynchConsulting (Dr Lynch).
Address correspondence to: Ronald J. Ozminkowski, PhD, The MEDSTAT Group, Inc., 777 EastEisenhower Parkway, 804B, Ann Arbor, MI 48108; E-mail address: [email protected].
Copyright © by American College of Occupational and Environmental Medicine
DOI: 10.1097/01.jom.0000121151.40413.bd
398 Health and Productivity Cost Estimates • Goetzel et al
pacts associated with multiple healthconditions common to employees.We then comment about the state ofknowledge in the field of productiv-ity assessments and implications foroccupational medicine professionals.
BackgroundPrevious research identified the
top10 most costly physical and men-tal health conditions for which directmedical expenditures were highestfor U.S. employers.16 That researchhas been used by employers to iden-tify health and disease conditionsthat account for a large portion of anorganization’s medical cost burden.More recently, administrative datacomprising absenteeism records andshort-term disability claims havebeen linked to the medical experi-ence of employees for some largeemployers to improve estimates ofthe financial consequences of thetop10 most costly and prevalent con-ditions.14 In both studies, cardiovas-cular disease, musculoskeletal disor-ders, ear, nose and throat conditions,hypertension, diabetes, and depres-sion-related illness were found to becostly conditions affecting employers.
Armed with this information, em-ployers could develop or implementtargeted health and disease manage-ment programs with the aim of im-proving health and saving money fortheir organizations. There is someevidence that well-designed andproperly implemented health anddisease management programs canimprove the quality of health caredelivered to workers, improve theirday-to-day functioning, and lowertheir health risks.17,18 In addition,there is a growing body of evidenceindicating that well-designed andwell-implemented programs have thepotential to save money and producea positive return on investment.19,20
In documenting the cost burden ofhealth and disease conditions, re-search has progressed through sev-eral stages. Early studies examinedinpatient and outpatient insuranceclaims.16 However, several investi-gators have noted that medical costs
represent only a portion of total ex-penditures. For example, Goetzel etal. found that medical costs ac-counted for less than half of the totalhealth- and productivity-related ex-penditures that employers face.21
Their estimate was based on an anal-ysis of several broad health and pro-ductivity benefit programs, includingthose directed at health insurance,short-term disability, workers’ com-pensation, incidental absence, andemployee turnover.
In a more recent, focused, andin-depth analysis of medical, phar-macy, absence, and disability data byGoetzel and colleagues,14 the authorsconcluded that employee absenceand disability associated with certainhealth and disease conditions consti-tuted 29% of the health- and produc-tivity-related expenditures for partic-ular physical health conditions and47% of the expenditures for mentalhealth conditions. This study did notinclude other categories such asworkers’ compensation, turnover,and other human resource expendi-tures. Independently, others have in-vestigated on-the-job productivitylosses, or “presenteeism,” anothermissing piece in the Goetzel et al.analyses, but thus far, these studieshave not been aggregated using com-mon metrics.
Finally, no studies have attemptedto combine information from admin-istrative claims databases and self-report measures of presenteeism intoa cohesive view of the total andcomponent-based cost burden of cer-tain physical and mental illness con-ditions. This information would beuseful to employers, because itwould allow them to better coordi-nate services overseen by varioushuman resource and benefit programmanagers (eg, those in charge ofgroup health benefits, absence man-agement, short-term disability, occu-pational medicine, health promotion,employee assistance, prescriptiondrug management, behavioral health,and so on). Also, such informationwould help employers evaluatewhether health and disease manage-
ment programs are likely to achievea positive financial impact whenconsidering their multiple expendi-ture components. Consequently,more accurate return-on-investmentcalculations could be generated.
This study compares and contraststhe different estimates of absenceand presenteeism costs imposed bycertain disease conditions. The anal-ysis combines data from administra-tive records of medical treatment (ie,inpatient and outpatient medicalrecords and drug claims), administra-tive data related to employee absenceand disability, and estimates of ab-sence and presenteeism losses ob-tained from a variety of self-reportinstruments and surveys. Becausevery few employers currently collectand combine individual-level healthand productivity data (with notableexception of such companies as DowChemical and Bank One), an ap-proach that integrates multiple esti-mates of productivity losses for sev-eral common disease conditions wasdeveloped. Methods and results aredescribed subsequently.
Data Sources
Health and ProductivityManagement AdministrativeClaims Database
The Medstat MarketScan Healthand Productivity Management(HPM) database was used to gener-ate metrics from administrativeclaims for this study. The HPM da-tabase contains person-level infor-mation on 374,799 employees overthe 3-year period from 1997 to 1999.It includes information about benefitplan enrollment, inpatient and outpa-tient healthcare services, pharmaceu-tical claims, absence records, andshort-term disability (STD) claimsfor workers at 6 large corporationswith locations in 43 states. A morecomplete description of the databaseis provided in Goetzel et al.14
The HPM database was used toidentify high-prevalence and high-cost physical and mental healthconditions affecting large U.S. em-
JOEM • Volume 46, Number 4, April 2004 399
ployers, considering medical, phar-maceutical, absence, and disabilityexpenses associated with theseconditions.14 The top 10 physicalhealth conditions identified were:1) angina pectoris, chronic mainte-nance; 2) essential hypertension; 3)diabetes mellitus; 4) mechanical lowback pain; 5) acute myocardial in-farction; 6) chronic obstructive pul-monary disease; 7) back disordersnot specified as low back; 8) traumato spine and spinal cord; 9) sinusitis;and 10) diseases of the ear, nose andthroat or mastoid process, not else-where classified.
Similarly, the top 10 mental healthconditions identified were: 1) bipolardisorder, chronic maintenance; 2) de-pression; 3) depressive episode in bi-polar disease; 4) neurotic, personalityand nonpsychotic disorders; 5) alco-holism; 6) anxiety disorders; 7)schizophrenia, acute phase; 8) bipolardisorders, severe mania; 9) nonspecificneurotic, personality and nonpsychoticdisorders; and 10) psychoses.
To enlarge the number and varietyof conditions examined, the top 20physical health conditions were alsoexamined and then combined intocomposite health conditions that in-cluded several subcategories of dis-ease. These combined conditions in-cluded cardiovascular disease;musculoskeletal disorders; arthritis;ear, nose and throat conditions; can-cers; and depression-related mentalhealth conditions.
Survey-Based Estimates ofAbsenteeism and PresenteeismLosses
Recently, there have been severalindependent efforts to quantify on-the-job productivity losses resultingfrom poor health.22 For example, theHealth Limitations Questionnaire(HLQ), developed at the ErasmusUniversity Rotterdam Institute forMedical Technology, is designed tocollect data on the relationshipamong illness, treatment, and workperformance.23 The 23-item instru-ment has been used on several study
populations, including a representa-tive sample of the general popula-tion, migraine patients, and patientswith hip or knee problems.
The Work Limitations Question-naire (WLQ), developed at the NewEngland Medical Center, is a 25-iteminstrument that measures the impactof chronic health problems or treat-ment on job performance. An acuteillness version of the instrument alsois available. The WLQ questionnairehas undergone extensive validity andreliability testing.24 The question-naire has been implemented across avariety of conditions, including rheu-matoid arthritis, headache, epilepsy,and osteoarthritis.25
The Work Productivity and Activ-ity Impairment Questionnaire(WPAI) is a presenteeism instrumentdeveloped by Reilly Associates, inpartnership with University of TexasMedical Branch at Galveston andMarion Merrell Dow.26 Two ver-sions of the WPAI exist; 1 coversgeneral health and the other can ad-dress a specific health problem ofinterest. The 2 versions can be com-bined to capture the effect of bothtypes of problems on work. The in-strument has undergone predictiveand concurrent validation, but littlework has been done to show theconstruct validity of the instrument.A recent study examined productiv-ity in reflux disorder patients usingthe specific health problem versionof the WPAI.27
A common feature of these instru-ments is that they measure the gen-eral notion of productivity loss in theworkplace as affected by health.They are designed to assess overallproductivity losses related to healthstatus or the effects of a particularhealth condition on productivity dec-rements. Recently, studies byKessler et al.,28 Stewart,29 Borden etal.,30 Goetzel et al.,31 Ozminkowskiet al.,32 and Burton33 have usedlarge-scale survey methods to quan-tify financial losses related to severalhealth conditions measured simulta-neously.
We identified 5 examples of large-scale presenteeism studies performedby the previously mentioned investi-gators in which surveys were admin-istered to employee populations andin which estimates for absence andpresenteeism losses were derived formultiple health and diseases condi-tions, not just 1. The rationale foronly considering studies that askedabout multiple health and diseaseconditions was that we were inter-ested in conducting side-by-sidecomparisons of these conditions. Inprinciple, respondents could weightheir productivity loss estimates forany given health condition againstany other condition simultaneously,thus providing a more complete as-sessment of the relative losses asso-ciated for any given condition.
The 5 multicondition studies in-cluded in the analysis are describedsubsequently.
The Employer Health Coalitionof Tampa, Florida, HealthyPeople/Productive CommunitySurvey
The Employer Health Coalition(EHC) administered the HealthyPeople/Productive Community Sur-vey in 1998 and 1999 to employeesof 8 large employer members of thecoalition (a ninth company joined in1999).30 (This analysis focuses onthe 1999 results.) In 1998, 10 healthconditions were selected for thestudy based on their high prevalenceand cost as determined by the em-ployer participants. In 1999, 7 addi-tional health conditions were in-cluded in the survey. The conditionsof interest included: allergy, arthritis,asthma, breast cancer, colon cancer,depression, diabetes, heart disease,hepatitis, high-risk pregnancy/cesareansection, hypertension, lower back pain/sciatica, migraine, neck/upper back/spine conditions, other respiratory con-ditions, peptic ulcer/acid refluxdisease, and prostate cancer.
The survey was administered bymail to employees in 2 waves. Thefirst wave included a general health
400 Health and Productivity Cost Estimates • Goetzel et al

and productivity questionnaire con-taining approximately 200 items.The second wave of questionnaireswas sent to individuals to inquireabout specific conditions. In the re-port prepared by EHC, the research-ers report mailing 23,389 employeepackets, of which 22,772 were deliv-ered. Of those delivered, 6003 werereturned, yielding a response rate of26%. In wave 2, 3910 surveys werecompleted out of 13,056 surveysmailed and delivered, yielding a 28%response rte.
Key questions on the surveys thatare relevant to the current study in-clude a dichotomous screening ques-tion asking whether the respondentexperienced a given condition withinthe previous month (operationallydefined as the previous 20 work-days), whether the respondent wasabsent from work because of thecondition, and, if so, for how manydays, and how much time was lost asa result of impairment at work (pre-senteeism) because of the condition.Work impairment was measured us-ing a Likert scale for questions relat-ing to interpersonal communication,work quality, and overall productiv-ity. Information on the reliability andvalidity of this survey is provided inLoeppke et al.34; evidence of reli-ability was noted as moderate, andvalidity has been assessed (but notpublished in much detail) for severaldiseases.
The American Productivity AuditAdvancePCS administered a 15-
minute telephone survey over a 10-month period to more than 25,000randomly selected U.S. workers anda random subsample of those whowere not working for pay.29 TheAmerican Productivity Audit (APA)survey was designed to measure lostproductive time related to the follow-ing health conditions: allergies, asth-ma/skin allergies, cold/flu, dentalproblems, fatigue, gastrointestinalproblems, headache/pain, menstrualpain, prescription drug side effects,and feeling sad/blue.35 The recallperiod for the survey was 2 weeks
when asking about the prevalence ofany given condition and 1 weekwhen asking about absence and pre-senteeism losses. Additionally, thesurvey asked about presenteeismlosses on any given day when theindividual was affected by the con-dition of interest.
Specifically, the survey consistedof various modules. A job visualiza-tion module asked about the tasksand activities performed at work. Alost productive time module capturedinformation about the number of fulldays missed from work in the pasttwo weeks and whether the misseddays were the result of a medicalcondition. Absence was also re-corded for late starts at work, earlydeparture, or missing time during themiddle of the workday. Additionally,questions were asked about the num-ber of days when the employee wasat work but not feeling well, missedhours at work, and how performancewas reduced because of health prob-lems. Performance decrements in-cluded losing concentration, repeat-ing a job, working more slowly thanusual, feeling fatigued, or generally“doing nothing.” Participants wereasked to rate their performance on ascale that quantified presenteeism asfollows: all the time (100%), most ofthe time (75%), half of the time(50%), some of the time (25%), andnone of the time (0%).
The McArthur FoundationMidlife Development in theUnited States Survey
The research team headed by DrRon Kessler at Harvard Universityadministered the McArthur Founda-tion Midlife Development in theUnited States (MIDUS) presentee-ism instrument to 2074 adults, aged25 to 54.28 The survey focused onwork impairment related to severalcommonly occurring chronic condi-tions: arthritis, asthma, autoimmunedisease, cancer, diabetes, generalanxiety disorder, heart disease, hy-pertension, major depression, panic,substance dependence, and ulcer.
The survey asked about condition-related absenteeism from work(work-loss days) and presenteeism(work cutback days) defined as beinghalf as productive as on a normalworkday. The recall period for thesurvey was the previous month, or 20workdays.
The survey first inquired about12-month prevalence of the previ-ously listed conditions (ie, “in thepast 12 months have you experi-enced or been treated for any of thefollowing?”). Questions were thenasked about work-loss days andwork cutback days (ie, how manydays were you . . . totally unable towork, cutback on your work, or un-able to carry out normal householdwork activities because of physicalhealth or mental health problems?).Information on work loss and workcutback was combined to form asummary work impairment measurein which work cutback was countedas half a lost workday. (Unfortu-nately, because of the way data werecollected and reported by the inves-tigators, productivity losses associ-ated with absenteeism and STDcould not be distinguished from on-the-job losses, or presenteeism.)
A current version of the MIDUSsurvey is named the Health and Per-formance Questionnaire (HPQ) andis described in a recent review ofhealth and productivity measures byLoeppke et al.34 Work performanceimpairment is measured on a Likertscale along the following dimen-sions: workload, health problems,and actual performance. Loeppke etal. classify the evidence of reliabilityfor the HPQ as “moderate.” Recentvalidation of the instrument pro-duced strong correlations betweenself-reported absences and actual ab-sences. Furthermore, poor scores onglobal questions about ability to per-form one’s job were significantlycorrelated with business perfor-mance scores, including supervisorratings, 360 evaluations, and callcenter worker performance.36
JOEM • Volume 46, Number 4, April 2004 401
The Bank One WorkerProductivity Index
Bank One recorded absence, STD,and presenteeism data for telephonecustomer service operator employeesat its Elgin, Illinois, location in1995.33 Absence and disabilityrecords were used to measure actualtime away from work. On-the-jobproductivity losses were calculatedbased on an electronic time-keepingsystem that measured the time spentaway from the employee’s worksta-tion. Of the 1039 employees at thesite, 564 completed a health riskappraisal (HRA) instrument that re-corded feelings of distress and risksfor diabetes, hypertension, high cho-lesterol, and being overweight. Ab-sence and disability records wereused to record the presence of certaindisease states, including mental ill-ness problems, respiratory disease,digestive disorders, musculoskeletalproblems, and cancer. Absence,STD, and presenteeism losses wererecorded over a 1-week period. Thedata collected using multiple meth-ods were combined into a standardmeasure referred to as the WorkProductivity Index (WPI).
The WPI composite measure wasbased on time away from work be-cause of illness and STD absence, aswell as time lost because of an em-ployee’s failure to maintain produc-tivity standards established by theBank, referred to by the authors as apresenteeism measure. The methodsused to create the presenteeism com-ponent of the WPI index were de-scribed in detail by Burton et al.33 Inshort, presenteeism was based on callcenter operators’ ability to providecorrect information to customerswith good interpersonal skills. In ad-dition, time spent servicing custom-ers was tracked by a computerizedsystem linked to the customer ser-vice employees’ workstations, whichrecorded time “logged off” or timespent putting customers on hold.What distinguishes the presenteeismassessment as measured by the WPIis that administrative and computer-
ized records were used to recordproductivity losses rather than rely-ing on individual self-report.
The Work Productivity ShortInventory
The Work Productivity Short In-ventory (WPSI) was developed toestimate decrements in employeeproductivity associated with 15 com-mon disease conditions.31 Eleven ofthese conditions pertain directly toemployees, and 4 pertain to caregiv-ing provided by employees to theirspouses, dependents, or elders. The11 employee-specific conditions in-clude allergies, respiratory infec-tions, arthritis, asthma, anxiety disor-der, depression and bipolar disorder,stress, diabetes, hypertension, mi-graine and other major headaches,and coronary heart disease/high cho-lesterol. The 4 conditions pertainingto the care of spouses, elders, ordependents include Alzheimer’s dis-ease; and pediatric allergies, otitismedia, and respiratory infections.
Three versions of the WPSI weredeveloped that differed according tothe length of the recall period (12months, 3 months, or 2 weeks). Re-liability and content, predictive, andconstruct validity metrics generatedfrom the WPSI were assessed toestimate the degree to which theWPSI can meet its intended pur-pose.32 The instrument was designedto measure the absence or presenceof certain disease conditions, ab-sence associated with those condi-tions, and presenteeism losses expe-rienced when suffering from theconditions. In addition to asking re-spondents to note basic demographicinformation, the WPSI asks respon-dents to note their perceived healthstatus and the amount of absenteeismresulting from 15 medical conditions(in days). It also asks about the amountof unproductive time (in hours) spentat work when affected by these condi-tions (ie, presenteeism).
What distinguishes the WPSI fromsome of the other instruments de-scribed here is that it compels the
respondent to make a finite calcula-tion of days and hours when a givencondition affected the respondent’stime away from work or their pro-ductivity at the workstation. Theconstruction of the WPSI allows forthe possibility that an individualcould suffer from a given conditionbut have no absenteeism or presen-teeism problems associated with thatcondition. Thus, by design, a moreconservative assessment of produc-tivity losses could be ascertained us-ing this instrument when comparedwith instruments that assume that,when an individual reports having agiven health condition, all absenceand presenteeism losses would occuras a result of that condition.
The data used for this analysiswere generated from a March 2003administration of the WPSI survey toemployees from a regional office ofa large telecommunications company(n � 619).
MethodsThe HPM database14 provided the
initial list of prevalent and costlyconditions considered for this study.As noted previously, we identifiedphysical and mental illnesses thatwere prevalent and costly for em-ployers, using that database. We thenexamined the results of multicondi-tion surveys performed by investiga-tors using the instruments describedhere. Some of the surveys reportedresults in the form of days absentfrom work or hours lost as a result ofpresenteeism during the recall pe-riod, whereas others presented find-ings in terms of the percent of timeabsent or impaired. In some cases,productivity losses were reported foronly those individuals experiencing agiven condition, whereas in othercases, the data were presented acrossall persons surveyed. To deal withvariations found in survey and re-porting methods, we developed stan-dard metrics to compare absenteeismand presenteeism rates across instru-ments. As shown subsequently, wecalculated the absenteeism and pre-senteeism losses as the percent of
402 Health and Productivity Cost Estimates • Goetzel et al

eligible work time available per yearamong all employees in the survey.
The formula used for the standardabsenteeism metric was:
�x�absdaysw/condition*Ncondition
n*240 �*100
where:x�absdaysw/condition � mean absence
days per year per person amongthose affected by the condition
Ncondition � number of personsreporting being affected by the con-dition
n � total sample size queried240 � total days eligible to work
per yearThe formula for the presenteeism
metric was:
��x�imphoursduetocondition*Ncondition
8 �*y�daysw/condition
n*240 �*100
where:x� imphoursduetocondition � mean hours
per day per person impaired by thecondition
Ncondition � number of personsreporting being affected by the con-dition
8 � total hours worked per dayy�daysw/condition � mean days per
year per person affected by the con-dition (from WPSI survey)
n � total sample size queried240 � total days eligible to work
per yearIt should be noted that a year was
used as a reference point becausemost employers analyze their healthand productivity data within an an-nual time framework.
Health and disease conditions thatwere common across 2 or more ofthe surveys were selected for analy-sis. In some cases, related diseaseswere combined into one category.For example, the EHC, MIDUS,WPI, and WPSI surveys asked aboutdepression and/or bipolar disorder,whereas the APA inquired about the
extent to which employees experi-enced feelings of being sad or blue.Thus, we combined these conditionstogether into a category called de-pression/sadness/mental illness. (Theterm mental illness was used by Bur-ton et al., although very few employ-ees fell into that broad category intheir analysis; most reported beingdepressed.) Similarly, cold/flu andrespiratory conditions were com-bined into a single category; anddifferent types of cancer were aggre-gated into an “any cancer” category.
Our analysis focused on a top 10list of conditions that were commonacross surveys and highlighted inGoetzel et al.’s14 analysis of admin-istrative claims. The top 10 condi-tions common across surveys were:1) allergy, 2) arthritis, 3) asthma, 4)any cancer, 5) depression/sadness, 6)diabetes, 7) heart disease, 8) hyper-tension, 9) migraine/headache, and10) respiratory infections.
After converting all of the absen-teeism and presenteeism rates forthese diseases into standard percent-age metrics, the average, low, andhigh values were examined. Differ-ences between the low and high rateswere categorized as being high(greater than 20% points), medium(between 11% and 19% points), andlow (10 or fewer percentage points).Condition prevalence estimates werealso compared across the datasources, using this same classifica-tion system. In addition, we consid-ered prevalence rates of the targetconditions for adults aged18 andabove from the National Health In-terview Survey (NHIS) conducted bythe National Center for Health Sta-tistics. The NHIS is a general surveyof health status among Americans,whether employed or not.37
To monetize the absenteeism andpresenteeism rates, we multipliednumber of unproductive hours by$23.15, which represents the year-2001 average hourly wages and ben-efits for all U.S. companies, as re-ported by the Bureau of LaborStatistics.38
Next, we added the direct medicalcosts for the 10 diseases to the indi-rect (absenteeism and STD) cost in-formation, all of which were derivedfrom the HPM analyses describedpreviously. These were then added tothe costs associated with presentee-ism that were obtained by manipulat-ing the results from the publishedpresenteeism survey analyses de-scribed previously. The result was anestimate of the total economic bur-den associated with certain physicaland mental illness conditions.
Two sets of numbers are presentedin the Results section subsequently; 1set is based on the average presen-teeism cost estimates, and the otheruses the lowest presenteeism costestimates across the available surveyinstruments. The lower-bound condi-tion-specific amounts present moreconservative estimates of presentee-ism losses. Both sets of numbers arereported in per-capita terms to pro-vide payment figures that most em-ployers and financial analysts wouldbe familiar with. Thus, the medical,drug, and productivity dollar valueswere summed for all employees witheach condition. Those dollars formthe numerator for the per-capita fig-ures. The denominator was cast as allemployees covered by the healthplan to make the numbers compara-ble across studies.
Total costs and a breakdown of thecomponent-level (eg, inpatient, out-patient, pharmaceutical, absentee-ism, STD, presenteeism) costs werealso examined and reported subse-quently.
ResultsTable 1 presents the prevalence
estimates for each selected conditionas reported by the 5 surveys, as wellas from the HPM and NHIS data-bases. Of the top 10 conditions ex-amined in which more than 1 preva-lence estimate was recorded, allergyand migraine/headache conditionswere found to be most prevalent,with average values of 25.8% and25.6%, respectively. However, wefound relatively high variability
JOEM • Volume 46, Number 4, April 2004 403

across the survey instruments in thereported condition prevalence rates.For example, the prevalence esti-mates for allergies ranged from a lowof 9% reported in the NHIS to a highof 41% in the WPSI surveyed popu-lation. Only prevalence estimates forall cancers (average 2.0%) and dia-betes (average 3.9%) were consid-ered somewhat stable across surveytools, with less than a 10 percentage-point difference between the highestand lowest prevalence estimates forthese conditions. Seasonal or cyclicalconditions (eg, allergies, depression,migraine headaches, and respiratorydisorders) tended to have the highestvariability in prevalence estimates.
Using our standardized metric ofpercent of work time lost, condition-specific absenteeism rates for the top10 conditions are summarized in Ta-ble 2 for employees who reportedhaving these conditions. In contrastto the prevalence estimates, therewas less variability across surveys
with regard to reported absenteeism.Although the APA survey reportedrates of absenteeism consistentlyhigher than those observed in mostof the other surveys, rates within theconditions among the other surveys,as well as the findings from Med-stat’s HPM administrative database,were relatively consistent. An excep-tion, however, was the depression/sadness/mental illness category. Inthis disease category, absence ratesranged from 0.9% of available work-days (2.2 days/year) in the WPSIsurvey to 23.7% of available work-days (56.9 days) in the Bank OneWPI study.
Next, we examined findings onpresenteeism for individuals withany given condition, a key measureof interest for this analysis (Table 3).In most cases, estimates of presen-teeism were available from 3 or moresurvey tools for each of the selectedconditions. After standardizing theestimates of presenteeism from days
or hours of impairment during thestudy observation windows acrossthe instruments to the common met-ric of percent of daily work timeimpaired, we found the rates of re-ported presenteeism within each dis-ease area were relatively similaracross the survey tools for most con-ditions. One exception was migraineheadache, in which the range of pre-senteeism loss was between 8.3%and 28.5%. The APA mean presen-teeism loss was reported as 8.3% andthe WPSI and EHC reported rates of24.8% and 28.5%, respectively. Pa-tients with migraine/headache, respi-ratory disorders, and depression/sadness/mental illness reported thelargest presenteeism losses of the 10conditions examined in this analysis.
Figure 1 summarizes the estimatedper-employee-per-year presenteeismcost estimate for each of the 10targeted conditions. The costs werecalculated assuming an average an-nual salary and benefits of $44,448
TABLE 1Comparison of Condition Prevalence Rates Across Studies and Databases
Condition EHC APA MIDUS WPI WPSIHPM
Database NHIS Average Low High Range Measures
Range (0–10 �low, 11–19 �
med, 20� � hi)
Allergy 25.8% 27.5% 41.0% 9.0% 25.8% 9.0% 41.0% 32.0% 4 HiArthritis 15.4% 12.6% 10.5% 3.5% 20.0% 12.4% 3.5% 20.0% 16.5% 5 MedAsthma 4.2% 11.0% 14.6% 8.7% 2.4% 9.0% 8.3% 2.4% 14.6% 12.2% 6 MedAutoimmune disease 4.3% 4.3% 4.3% 4.3% 0.0% 1 N/AAny cancer 2.0% 0.5% 0.6% 0.8% 6.2% 2.0% 0.5% 6.2% 5.7% 5 LowBreast cancer 0.9% 0.1% 0.5% 0.1% 0.9% 0.8% 2 LowColon cancer 0.4% 0.4% 0.4% 0.4% 0.0% 1 N/ADental problems 9.0% 9.0% 9.0% 9.0% 0.0% 1 N/ADepression/sadness
mental illness10.3% 26.5% 16.5% 17.4% 4.9% 3.4% 13.2% 3.4% 26.5% 23.1% 6 Hi
Diabetes 5.0% 3.7% 2.7% 2.1% 4.9% 5.3% 3.9% 2.7% 5.3% 2.6% 6 LowGastrointestinal/di-
gestive1.3% 1.3% 1.3% 1.3% 0.0% 1 N/A
General anxiety dis. 4.0% 13.6% 8.8% 4.0% 13.6% 9.6% 2 LowHeart disease 3.8% 3.4% 2.0% 16.9% 5.9% 6.4% 2.0% 16.9% 14.9% 5 MedHepatitis 1.1% 1.1% 1.1% 1.1% 0.0% 1 N/AHigh cholesterol 4.6% 4.6% 4.6% 4.6% 0.0% 1 N/AHigh risk pregnancy 2.8% 2.8% 2.8% 2.8% 0.0% 1 N/AHypertension 17.2% 12.4% 8.5% 4.8% 12.4% 19.0% 12.4% 8.5% 19.0% 10.5% 6 MedMenstrual problems 23.7% 23.7% 23.7% 23.7% 0.0% 1 N/AMigraine/headache 7.9% 51.7% 27.0% 15.7% 25.6% 7.9% 51.7% 43.8% 4 HiMuskuloskeletal,
neck, back, spine36.5% 1.2% 20.1% 19.3% 1.2% 36.5% 35.3% 3 Hi
Obesity 29.8% 29.8% 29.8% 29.8% 0.0% 1 N/ARespiratory disorders
(except asthma)7.8% 6.1% 1.3% 16.5% 22.6% 10.9% 1.3% 22.6% 21.3% 5 Hi
404 Health and Productivity Cost Estimates • Goetzel et al
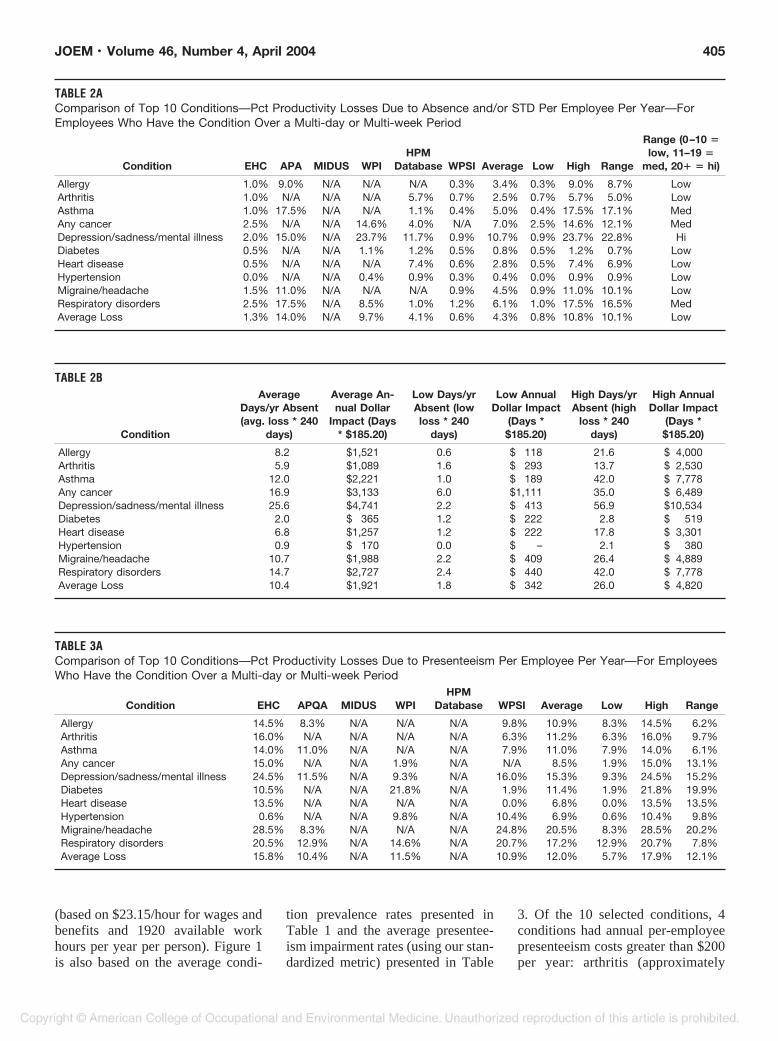
(based on $23.15/hour for wages andbenefits and 1920 available workhours per year per person). Figure 1is also based on the average condi-
tion prevalence rates presented inTable 1 and the average presentee-ism impairment rates (using our stan-dardized metric) presented in Table
3. Of the 10 selected conditions, 4conditions had annual per-employeepresenteeism costs greater than $200per year: arthritis (approximately
TABLE 2AComparison of Top 10 Conditions—Pct Productivity Losses Due to Absence and/or STD Per Employee Per Year—ForEmployees Who Have the Condition Over a Multi-day or Multi-week Period
Condition EHC APA MIDUS WPIHPM
Database WPSI Average Low High Range
Range (0–10 �low, 11–19 �
med, 20� � hi)
Allergy 1.0% 9.0% N/A N/A N/A 0.3% 3.4% 0.3% 9.0% 8.7% LowArthritis 1.0% N/A N/A N/A 5.7% 0.7% 2.5% 0.7% 5.7% 5.0% LowAsthma 1.0% 17.5% N/A N/A 1.1% 0.4% 5.0% 0.4% 17.5% 17.1% MedAny cancer 2.5% N/A N/A 14.6% 4.0% N/A 7.0% 2.5% 14.6% 12.1% MedDepression/sadness/mental illness 2.0% 15.0% N/A 23.7% 11.7% 0.9% 10.7% 0.9% 23.7% 22.8% HiDiabetes 0.5% N/A N/A 1.1% 1.2% 0.5% 0.8% 0.5% 1.2% 0.7% LowHeart disease 0.5% N/A N/A N/A 7.4% 0.6% 2.8% 0.5% 7.4% 6.9% LowHypertension 0.0% N/A N/A 0.4% 0.9% 0.3% 0.4% 0.0% 0.9% 0.9% LowMigraine/headache 1.5% 11.0% N/A N/A N/A 0.9% 4.5% 0.9% 11.0% 10.1% LowRespiratory disorders 2.5% 17.5% N/A 8.5% 1.0% 1.2% 6.1% 1.0% 17.5% 16.5% MedAverage Loss 1.3% 14.0% N/A 9.7% 4.1% 0.6% 4.3% 0.8% 10.8% 10.1% Low
TABLE 2B
Condition
AverageDays/yr Absent(avg. loss * 240
days)
Average An-nual Dollar
Impact (Days* $185.20)
Low Days/yrAbsent (lowloss * 240
days)
Low AnnualDollar Impact
(Days *$185.20)
High Days/yrAbsent (high
loss * 240days)
High AnnualDollar Impact
(Days *$185.20)
Allergy 8.2 $1,521 0.6 $ 118 21.6 $ 4,000Arthritis 5.9 $1,089 1.6 $ 293 13.7 $ 2,530Asthma 12.0 $2,221 1.0 $ 189 42.0 $ 7,778Any cancer 16.9 $3,133 6.0 $1,111 35.0 $ 6,489Depression/sadness/mental illness 25.6 $4,741 2.2 $ 413 56.9 $10,534Diabetes 2.0 $ 365 1.2 $ 222 2.8 $ 519Heart disease 6.8 $1,257 1.2 $ 222 17.8 $ 3,301Hypertension 0.9 $ 170 0.0 $ – 2.1 $ 380Migraine/headache 10.7 $1,988 2.2 $ 409 26.4 $ 4,889Respiratory disorders 14.7 $2,727 2.4 $ 440 42.0 $ 7,778Average Loss 10.4 $1,921 1.8 $ 342 26.0 $ 4,820
TABLE 3AComparison of Top 10 Conditions—Pct Productivity Losses Due to Presenteeism Per Employee Per Year—For EmployeesWho Have the Condition Over a Multi-day or Multi-week Period
Condition EHC APQA MIDUS WPIHPM
Database WPSI Average Low High Range
Allergy 14.5% 8.3% N/A N/A N/A 9.8% 10.9% 8.3% 14.5% 6.2%Arthritis 16.0% N/A N/A N/A N/A 6.3% 11.2% 6.3% 16.0% 9.7%Asthma 14.0% 11.0% N/A N/A N/A 7.9% 11.0% 7.9% 14.0% 6.1%Any cancer 15.0% N/A N/A 1.9% N/A N/A 8.5% 1.9% 15.0% 13.1%Depression/sadness/mental illness 24.5% 11.5% N/A 9.3% N/A 16.0% 15.3% 9.3% 24.5% 15.2%Diabetes 10.5% N/A N/A 21.8% N/A 1.9% 11.4% 1.9% 21.8% 19.9%Heart disease 13.5% N/A N/A N/A N/A 0.0% 6.8% 0.0% 13.5% 13.5%Hypertension 0.6% N/A N/A 9.8% N/A 10.4% 6.9% 0.6% 10.4% 9.8%Migraine/headache 28.5% 8.3% N/A N/A N/A 24.8% 20.5% 8.3% 28.5% 20.2%Respiratory disorders 20.5% 12.9% N/A 14.6% N/A 20.7% 17.2% 12.9% 20.7% 7.8%Average Loss 15.8% 10.4% N/A 11.5% N/A 10.9% 12.0% 5.7% 17.9% 12.1%
JOEM • Volume 46, Number 4, April 2004 405
$252), hypertension ($247), depres-sion/sadness/mental illness ($246),and allergy ($222). Asthma, any can-cer, heart disease, and respiratorydisorders were estimated to have thelowest annual presenteeism-relatedcosts per employee per year.
Because of the considerable varia-tion found in prevalence estimatesacross the various survey tools, Fig-ure 1 also shows the ranges for eachcondition based on the highest andlowest reported prevalence esti-mates. Regardless of the prevalenceestimate used, the conditions that
continued to have the greatest impacton presenteeism costs were arthritis,hypertension, depression/sadness/mental illness, allergy, migraine/headache, and diabetes.
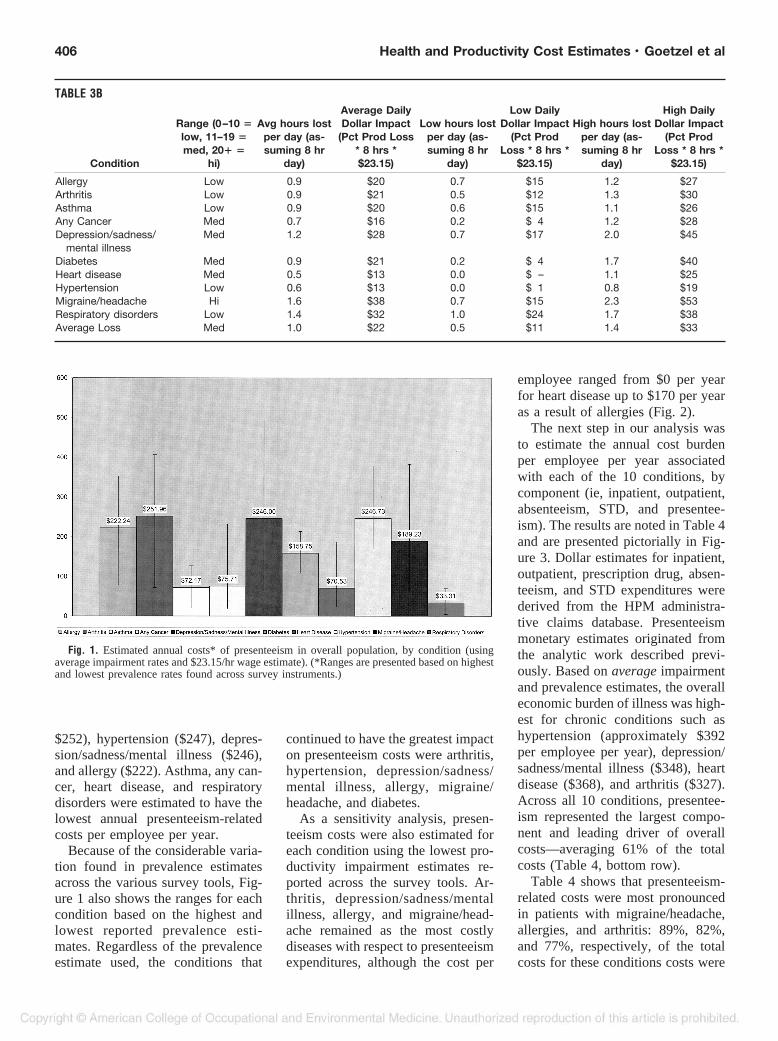
As a sensitivity analysis, presen-teeism costs were also estimated foreach condition using the lowest pro-ductivity impairment estimates re-ported across the survey tools. Ar-thritis, depression/sadness/mentalillness, allergy, and migraine/head-ache remained as the most costlydiseases with respect to presenteeismexpenditures, although the cost per
employee ranged from $0 per yearfor heart disease up to $170 per yearas a result of allergies (Fig. 2).
The next step in our analysis wasto estimate the annual cost burdenper employee per year associatedwith each of the 10 conditions, bycomponent (ie, inpatient, outpatient,absenteeism, STD, and presentee-ism). The results are noted in Table 4and are presented pictorially in Fig-ure 3. Dollar estimates for inpatient,outpatient, prescription drug, absen-teeism, and STD expenditures werederived from the HPM administra-tive claims database. Presenteeismmonetary estimates originated fromthe analytic work described previ-ously. Based on average impairmentand prevalence estimates, the overalleconomic burden of illness was high-est for chronic conditions such ashypertension (approximately $392per employee per year), depression/sadness/mental illness ($348), heartdisease ($368), and arthritis ($327).Across all 10 conditions, presentee-ism represented the largest compo-nent and leading driver of overallcosts—averaging 61% of the totalcosts (Table 4, bottom row).
Table 4 shows that presenteeism-related costs were most pronouncedin patients with migraine/headache,allergies, and arthritis: 89%, 82%,and 77%, respectively, of the totalcosts for these conditions costs were
TABLE 3B
Condition
Range (0–10 �low, 11–19 �med, 20� �
hi)
Avg hours lostper day (as-suming 8 hr
day)
Average DailyDollar Impact
(Pct Prod Loss* 8 hrs *$23.15)
Low hours lostper day (as-suming 8 hr
day)
Low DailyDollar Impact
(Pct ProdLoss * 8 hrs *
$23.15)
High hours lostper day (as-suming 8 hr
day)
High DailyDollar Impact
(Pct ProdLoss * 8 hrs *
$23.15)
Allergy Low 0.9 $20 0.7 $15 1.2 $27Arthritis Low 0.9 $21 0.5 $12 1.3 $30Asthma Low 0.9 $20 0.6 $15 1.1 $26Any Cancer Med 0.7 $16 0.2 $ 4 1.2 $28Depression/sadness/
mental illnessMed 1.2 $28 0.7 $17 2.0 $45
Diabetes Med 0.9 $21 0.2 $ 4 1.7 $40Heart disease Med 0.5 $13 0.0 $ – 1.1 $25Hypertension Low 0.6 $13 0.0 $ 1 0.8 $19Migraine/headache Hi 1.6 $38 0.7 $15 2.3 $53Respiratory disorders Low 1.4 $32 1.0 $24 1.7 $38Average Loss Med 1.0 $22 0.5 $11 1.4 $33
Fig. 1. Estimated annual costs* of presenteeism in overall population, by condition (usingaverage impairment rates and $23.15/hr wage estimate). (*Ranges are presented based on highestand lowest prevalence rates found across survey instruments.)
406 Health and Productivity Cost Estimates • Goetzel et al
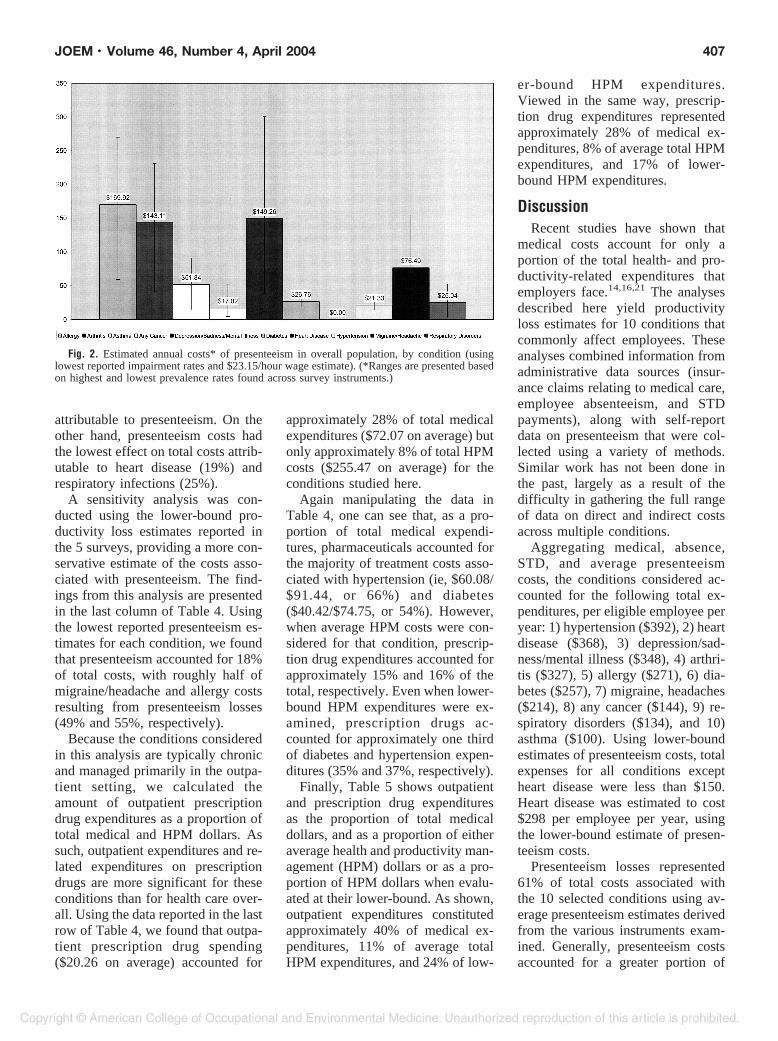
attributable to presenteeism. On theother hand, presenteeism costs hadthe lowest effect on total costs attrib-utable to heart disease (19%) andrespiratory infections (25%).
A sensitivity analysis was con-ducted using the lower-bound pro-ductivity loss estimates reported inthe 5 surveys, providing a more con-servative estimate of the costs asso-ciated with presenteeism. The find-ings from this analysis are presentedin the last column of Table 4. Usingthe lowest reported presenteeism es-timates for each condition, we foundthat presenteeism accounted for 18%of total costs, with roughly half ofmigraine/headache and allergy costsresulting from presenteeism losses(49% and 55%, respectively).
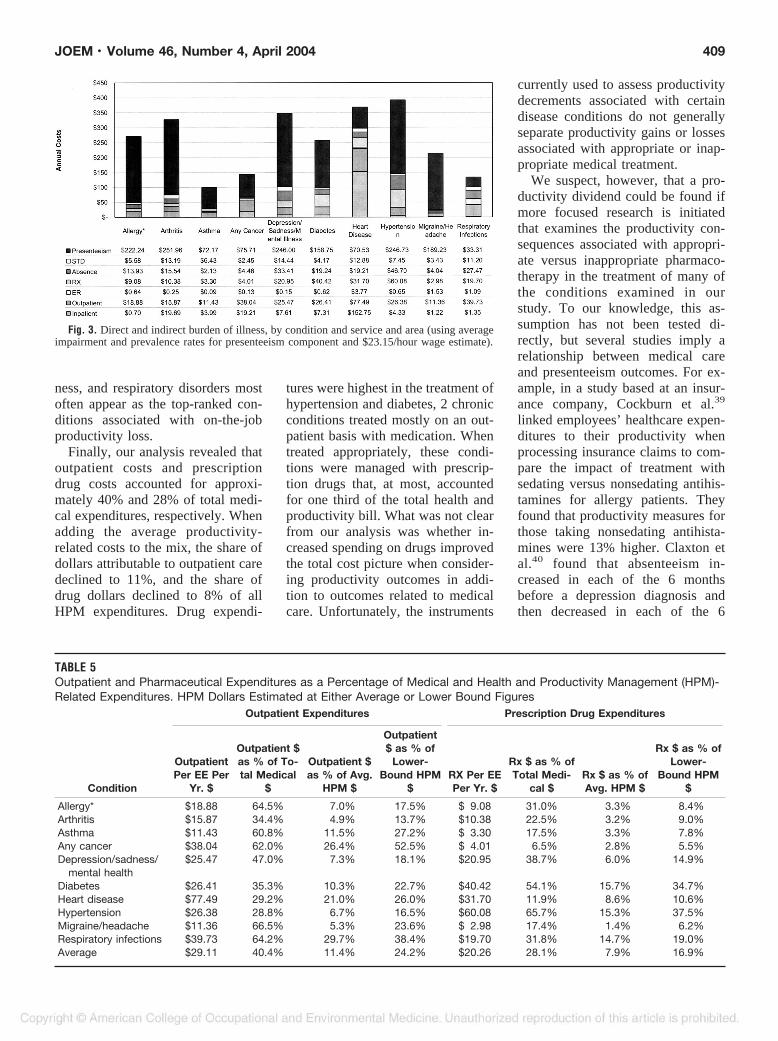
Because the conditions consideredin this analysis are typically chronicand managed primarily in the outpa-tient setting, we calculated theamount of outpatient prescriptiondrug expenditures as a proportion oftotal medical and HPM dollars. Assuch, outpatient expenditures and re-lated expenditures on prescriptiondrugs are more significant for theseconditions than for health care over-all. Using the data reported in the lastrow of Table 4, we found that outpa-tient prescription drug spending($20.26 on average) accounted for
approximately 28% of total medicalexpenditures ($72.07 on average) butonly approximately 8% of total HPMcosts ($255.47 on average) for theconditions studied here.
Again manipulating the data inTable 4, one can see that, as a pro-portion of total medical expendi-tures, pharmaceuticals accounted forthe majority of treatment costs asso-ciated with hypertension (ie, $60.08/$91.44, or 66%) and diabetes($40.42/$74.75, or 54%). However,when average HPM costs were con-sidered for that condition, prescrip-tion drug expenditures accounted forapproximately 15% and 16% of thetotal, respectively. Even when lower-bound HPM expenditures were ex-amined, prescription drugs ac-counted for approximately one thirdof diabetes and hypertension expen-ditures (35% and 37%, respectively).
Finally, Table 5 shows outpatientand prescription drug expendituresas the proportion of total medicaldollars, and as a proportion of eitheraverage health and productivity man-agement (HPM) dollars or as a pro-portion of HPM dollars when evalu-ated at their lower-bound. As shown,outpatient expenditures constitutedapproximately 40% of medical ex-penditures, 11% of average totalHPM expenditures, and 24% of low-
er-bound HPM expenditures.Viewed in the same way, prescrip-tion drug expenditures representedapproximately 28% of medical ex-penditures, 8% of average total HPMexpenditures, and 17% of lower-bound HPM expenditures.
DiscussionRecent studies have shown that
medical costs account for only aportion of the total health- and pro-ductivity-related expenditures thatemployers face.14,16,21 The analysesdescribed here yield productivityloss estimates for 10 conditions thatcommonly affect employees. Theseanalyses combined information fromadministrative data sources (insur-ance claims relating to medical care,employee absenteeism, and STDpayments), along with self-reportdata on presenteeism that were col-lected using a variety of methods.Similar work has not been done inthe past, largely as a result of thedifficulty in gathering the full rangeof data on direct and indirect costsacross multiple conditions.
Aggregating medical, absence,STD, and average presenteeismcosts, the conditions considered ac-counted for the following total ex-penditures, per eligible employee peryear: 1) hypertension ($392), 2) heartdisease ($368), 3) depression/sad-ness/mental illness ($348), 4) arthri-tis ($327), 5) allergy ($271), 6) dia-betes ($257), 7) migraine, headaches($214), 8) any cancer ($144), 9) re-spiratory disorders ($134), and 10)asthma ($100). Using lower-boundestimates of presenteeism costs, totalexpenses for all conditions exceptheart disease were less than $150.Heart disease was estimated to cost$298 per employee per year, usingthe lower-bound estimate of presen-teeism costs.
Presenteeism losses represented61% of total costs associated withthe 10 selected conditions using av-erage presenteeism estimates derivedfrom the various instruments exam-ined. Generally, presenteeism costsaccounted for a greater portion of
Fig. 2. Estimated annual costs* of presenteeism in overall population, by condition (usinglowest reported impairment rates and $23.15/hour wage estimate). (*Ranges are presented basedon highest and lowest prevalence rates found across survey instruments.)
JOEM • Volume 46, Number 4, April 2004 407

total costs in seasonal conditionssuch as allergies and in conditionsprone to symptomatic “flare-ups”such as migraine/headache, depres-sion, arthritis, and asthma comparedwith chronic conditions such as dia-betes, cancer, and heart disease. Alower-bound estimate of the propor-tion of total costs resulting frompresenteeism, using the most conser-vative estimate of presenteeismlosses, was 18%. This implies thatanywhere from approximately onefifth to approximately three fifths ofthe total dollars attributable to com-mon health conditions faced by em-ployers could be a result of on-the-job productivity losses. Thus, thisanalysis points to a potentially large
category of expenses as-yet unac-counted for by many employers whoare concerned about their health-related liabilities.
The analysis also highlights theenormous variability found in esti-mating on-the-job productivitylosses, as shown by the wide range ofestimates attributable to certain dis-ease categories. The amount of vari-ation is somewhat disconcertingwhen trying to get a clear sense ofthe “big picture.” This variation isprobably the result of the many waysin which diseases are defined andproductivity is addressed among thevarious surveys used. In some cases,overall productivity is assessed,whereas in other cases, respondents
are asked to estimate productivitylosses related to specific health con-ditions.
What is meant by productivity lossalso varies widely. Studies could fo-cus on the ability to concentrate, thequality of interpersonal communica-tion, the need to repeat a job, work-ing more slowly, or a comparison ofwork output to certain predefinedperformance measures. In the case ofthe WPI, electronic monitoring ofproductivity losses was used insteadof self-report methods.5 Thus, giventhe variability in measurement tools,one would expect highly variablepresenteeism estimates. Nonetheless,it is noteworthy that migraine/ head-aches, depression/sadness/mental ill-
TABLE 4AComparison of Top 10 Conditions—Estimate of Dollar Impact Due to Medical and Productivity Losses Per Employee PerYear—Across Entire Population (Not Just Those With Disease)
Condition Inpatient Outpatient ER Rx Total Medical Absence STDTotal Absence
STD
Allergy* $ 0.70 $18.88 $0.64 $ 9.08 $ 29.29 $13.93 $ 5.58 $19.51Arthritis $ 19.69 $15.87 $0.25 $10.38 $ 46.20 $15.54 $13.19 $28.73Asthma $ 3.99 $11.43 $0.09 $ 3.30 $ 18.82 $ 2.13 $ 6.43 $ 8.56Any cancer $ 19.21 $38.04 $0.13 $ 4.01 $ 61.38 $ 4.46 $ 2.45 $ 6.91Depression/sadness/mental illness $ 7.61 $25.47 $0.15 $20.95 $ 54.19 $33.41 $14.44 $47.85Diabetes $ 7.31 $26.41 $0.62 $40.42 $ 74.75 $19.24 $ 4.17 $23.41Heart disease $152.75 $77.49 $3.77 $31.70 $265.71 $19.21 $12.88 $32.09Hypertension $ 4.33 $26.38 $0.65 $60.08 $ 91.44 $46.70 $ 7.45 $54.15Migraine/headache $ 1.22 $11.36 $1.53 $ 2.98 $ 17.08 $ 4.04 $ 3.43 $ 7.47Respiratory infections $ 1.35 $39.73 $1.09 $19.70 $ 61.86 $27.47 $11.20 $38.67Average $ 21.82 $29.11 $0.89 $20.26 $ 72.07 $18.23 $ 8.12 $26.35
* Disease of ENT or Mastoid Process NEC for healthcare expenditures, absence, and STD estimates.
TABLE 4B
Condition
Survey BasedProductivity
Losses (Aver-age Estimate)
Survey BasedProductivityLosses (Low
Estimate)
Total (UsingAverage Pre-
senteeism Esti-mate)
Total (Using LowPresenteeism Esti-
mate)
% of total ex-penditures due
to presenteeism(Avg)
% of total expen-ditures due topresenteeism
(Low estimate)
Allergy* $222.24 $59.20 $271.04 $108.00 82% 55%Arthritis $251.96 $40.83 $326.88 $115.75 77% 35%Asthma $ 72.17 $14.69 $ 99.55 $ 42.07 72% 35%Any cancer $ 75.71 $ 4.22 $144.01 $ 72.52 53% 6%Depression/sadness/
mental illness$246.00 $38.53 $348.04 $140.57 71% 27%
Diabetes $158.75 $18.33 $256.91 $116.50 62% 16%Heart disease $ 70.53 $ 0.00 $368.34 $297.81 19% 0%Hypertension $246.73 $14.64 $392.31 $160.22 63% 9%Migraine/headache $189.23 $23.63 $213.78 $ 48.19 89% 49%Respiratory infections $ 33.31 $ 3.00 $133.84 $103.52 25% 3%Average $156.66 $21.71 $255.08 $120.13 61% 18%
408 Health and Productivity Cost Estimates • Goetzel et al
ness, and respiratory disorders mostoften appear as the top-ranked con-ditions associated with on-the-jobproductivity loss.
Finally, our analysis revealed thatoutpatient costs and prescriptiondrug costs accounted for approxi-mately 40% and 28% of total medi-cal expenditures, respectively. Whenadding the average productivity-related costs to the mix, the share ofdollars attributable to outpatient caredeclined to 11%, and the share ofdrug dollars declined to 8% of allHPM expenditures. Drug expendi-
tures were highest in the treatment ofhypertension and diabetes, 2 chronicconditions treated mostly on an out-patient basis with medication. Whentreated appropriately, these condi-tions were managed with prescrip-tion drugs that, at most, accountedfor one third of the total health andproductivity bill. What was not clearfrom our analysis was whether in-creased spending on drugs improvedthe total cost picture when consider-ing productivity outcomes in addi-tion to outcomes related to medicalcare. Unfortunately, the instruments
currently used to assess productivitydecrements associated with certaindisease conditions do not generallyseparate productivity gains or lossesassociated with appropriate or inap-propriate medical treatment.
We suspect, however, that a pro-ductivity dividend could be found ifmore focused research is initiatedthat examines the productivity con-sequences associated with appropri-ate versus inappropriate pharmaco-therapy in the treatment of many ofthe conditions examined in ourstudy. To our knowledge, this as-sumption has not been tested di-rectly, but several studies imply arelationship between medical careand presenteeism outcomes. For ex-ample, in a study based at an insur-ance company, Cockburn et al.39
linked employees’ healthcare expen-ditures to their productivity whenprocessing insurance claims to com-pare the impact of treatment withsedating versus nonsedating antihis-tamines for allergy patients. Theyfound that productivity measures forthose taking nonsedating antihista-mines were 13% higher. Claxton etal.40 found that absenteeism in-creased in each of the 6 monthsbefore a depression diagnosis andthen decreased in each of the 6
Fig. 3. Direct and indirect burden of illness, by condition and service and area (using averageimpairment and prevalence rates for presenteeism component and $23.15/hour wage estimate).
TABLE 5Outpatient and Pharmaceutical Expenditures as a Percentage of Medical and Health and Productivity Management (HPM)-Related Expenditures. HPM Dollars Estimated at Either Average or Lower Bound Figures
Condition
Outpatient Expenditures Prescription Drug Expenditures
OutpatientPer EE Per
Yr. $
Outpatient $as % of To-tal Medical
$
Outpatient $as % of Avg.
HPM $
Outpatient$ as % of
Lower-Bound HPM
$RX Per EEPer Yr. $
Rx $ as % ofTotal Medi-
cal $Rx $ as % ofAvg. HPM $
Rx $ as % ofLower-
Bound HPM$
Allergy* $18.88 64.5% 7.0% 17.5% $ 9.08 31.0% 3.3% 8.4%Arthritis $15.87 34.4% 4.9% 13.7% $10.38 22.5% 3.2% 9.0%Asthma $11.43 60.8% 11.5% 27.2% $ 3.30 17.5% 3.3% 7.8%Any cancer $38.04 62.0% 26.4% 52.5% $ 4.01 6.5% 2.8% 5.5%Depression/sadness/
mental health$25.47 47.0% 7.3% 18.1% $20.95 38.7% 6.0% 14.9%
Diabetes $26.41 35.3% 10.3% 22.7% $40.42 54.1% 15.7% 34.7%Heart disease $77.49 29.2% 21.0% 26.0% $31.70 11.9% 8.6% 10.6%Hypertension $26.38 28.8% 6.7% 16.5% $60.08 65.7% 15.3% 37.5%Migraine/headache $11.36 66.5% 5.3% 23.6% $ 2.98 17.4% 1.4% 6.2%Respiratory infections $39.73 64.2% 29.7% 38.4% $19.70 31.8% 14.7% 19.0%Average $29.11 40.4% 11.4% 24.2% $20.26 28.1% 7.9% 16.9%
JOEM • Volume 46, Number 4, April 2004 409
months after the onset of drug treat-ment for depression. In an earlieranalysis, Rizzo et al.41 used NationalMedical Expenditure Survey dataand showed that treatment for hyper-tension, heart disease, and depres-sion led to substantial reductions inabsenteeism-related expenditures. Astudy of 35 employers by the Insti-tute for Health and ProductivityManagement42 showed a correlationbetween medical expenditures andabsenteeism and presenteeism formusculoskeletal, mental health, re-spiratory, and gastrointestinal healthproblems.
Many other studies imply correla-tions between medical expendituresand absenteeism, short-term disabil-ity, or presenteeism. Examples in-clude studies of depression by Drusset al.43 and Kessler et al.,44 andstudies of migraine that were con-ducted by Fishman and Black45 andSchulman et al.46 Greenberg et al.47
focused on posttraumatic stress dis-order and anxiety disorder, notingthat approximately 10% of the totalcosts for these were related to work-place costs. Burton et al.48 andKessler et al.28 noted differences inabsenteeism and lower productivityat work for patients with severalchronic conditions, many of whichare among the ones we studies. Thisline of research is still in its earlydevelopment but it seems promising.
LimitationsSeveral limitations should be
noted as the estimates in this articleare reviewed. For example, the ab-senteeism and STD figures that wereobtained from the HPM databasecame from the same employers, butnot always the same employees. Thereality of the workplace is that ab-senteeism records either tend to bemissing for exempt staff or tend to bedecentralized; it was not feasible foremployers to collect this informationfor all employees, so we used thedata that were more readily avail-able. STD data were available formany more employees, but not allemployees have STD coverage.
Thus, we have medical data for moreemployees than those for whom ab-senteeism or STD data were avail-able. This could yield some measure-ment error, but we have shownelsewhere that the magnitude of thiserror is likely to be small.14 Produc-tivity data availability is a problemthat most large employers have andis not one that can be solved easilyby waiting for more complete data.
Another limitation worth notinghas to do with monetizing the absen-teeism and STD time loss. For thisarticle, we multiplied time losses byan average hourly wage and benefitfigure of $23.15 that was providedby the Bureau of Labor Statistics.This could have led to a conservativeestimate of the cost of lost time,however. As Pauly and others note,49
using wages to approximate thevalue of lost time could be too con-servative in team environments orfor more senior employees whosework loss affects others substan-tially.
Another challenge in conductingthis analysis was the lack of a stan-dard metric for reporting presentee-ism across the survey tools. Hence,the tools considered might not havebeen measuring exactly the samething. Despite this problem, we wereable to construct a common methodfor measuring absenteeism and pre-senteeism across survey instruments.We calculated the percent of eligiblework time available per year inwhich the employee was absent as aresult of the condition of interest, andthe percent of eligible work timeavailable per year in which the em-ployee’s work was impaired on thejob as a result of the condition ofinterest. These metrics relied on ac-curate reporting of prevalence esti-mates, and unfortunately, we foundsubstantial variability in the condi-tion prevalence estimates across thesurveys. Without a large number ofsurveys to draw from, it was difficultto infer outliers that could bedropped to stabilize prevalence esti-mates for our analysis. To addressthe variability in the prevalence esti-
mates, we performed sensitivityanalyses and examined how presen-teeism associated with each of theconditions would vary when lower-bound estimates were used.
We also discovered a great deal ofvariability in how conditions weredefined and presented to respon-dents. For example, employees couldhave been asked how often they feltsad or blue, were depressed, sufferedfrom major depression, or had men-tal illness. It stands to reason that thelack of consistency in defining theconditions of interest led to much ofthe variability in responses that wasobserved.
Next, we found that the timeframefor assessing productivity losses var-ied depending on the instrumentused. Some researchers used a2-week time window, others used 4weeks, and still others examined re-actions over a longer time period, upto 1 year. Because our intent was toexamine data on a level playing field,we converted the estimates to annualrates. Annual figures are most oftenused by employers when examiningtheir human resources data and inplanning and budgeting exercises.However, extrapolating values froma shorter time period to ones thatextend over 1 year is problematicand is likely to overestimate timelosses resulting from any given con-dition that could be short-lived.31
On average, we found that dollarestimates associated with presentee-ism were quite large, in many in-stances dwarfing the medical ex-penses. This is why we elected toshow average presenteeism dollar es-timates as well as lower-bound esti-mates, which were more conserva-tive. Currently, there is very littleuniformity in how presenteeism isassessed across instruments. Theanalysis presented here could high-light some of the problems associ-ated with estimating on-the-job pre-senteeism losses and could promptresearchers to establish commonmetrics and approaches to measuringthis important attribute relevant to allworkers and their employers.
410 Health and Productivity Cost Estimates • Goetzel et al
Further research should be con-ducted to update the findings wepresent in this article. Results fromadditional survey instruments shouldassist in stabilizing the estimates forprevalence and presenteeism. Ide-ally, direct medical costs, absentee-ism, disability, and presenteeismcosts would be estimated for thesame population of interest to avoidthe biases inherent in combining datafrom several studies.
ConclusionsThe study of health and its effect
on absence, disability, and produc-tivity loss is still in its infancy. Re-searchers have been working hardover the past few years to developvalid and reliable measures of pre-senteeism. However, to date, littleeffort has been directed at linkingself-report measures with adminis-trative records that capture health-care expenditures and absence anddisability data. This analysis hashighlighted the potential for assess-ing health-related productivitylosses, as well as many of the chal-lenges associated with such an un-dertaking.
Some could argue that the instru-ments examined in this analysis weredeveloped with different objectivesin mind and were applied to differentstudy populations, suggesting thatone-to-one comparisons across thesetools could be somewhat inappropri-ate. We might agree with these ob-jections. In real-world settings,where human resources executivesand their occupational medicinecounterparts face significant pro-grammatic and budgetary decisionseach day, there is a need for accurate,objective, and reliable tools thatmeasure productivity impacts associ-ated with treatment of various healthand disease conditions. Business ex-ecutives need to determine what theirpotential liability might be andwhere programs designed to improvehealth and workforce productivityshould be directed. For that to hap-pen, good tools and measures ofworker health and productivity are
needed. The profession is movingcloser to defining these tools andmeasures and determining when andwhere to use them. Once achieved,we will be better able to definewhether interventions work in im-proving employee health and pro-ductivity.
However, what should we do untilbetter tools are developed? In ourview, there is value in describingwhat is known so far, characterizingand highlighting that variation, hy-pothesizing about the reasons for thatvariation, identifying limitations soas not to mislead the audience, andidentifying needs for future investi-gation. That is what we tried to do inthis article. Until better estimates ofthe total burden of illness can begenerated, the preliminary estimatespresented here suggest where em-ployers can direct their attention tohelp solve the most pressing health-and productivity-related problems.
AcknowledgmentFunding for this study was provided by the
National Pharmaceutical Council.
References1. Berger ML, Murray JF, Xu J, et al.
Alternative valuations of work loss andproductivity. J Occup Environ Med.2001;43:18–24.
2. Brandt-Rauf P, Burton W, McCunneyRJ. Health, productivity, and occupa-tional medicine. J Occup Environ Med.2001;43:1.
3. Goetzel RZ, Ozminkowski RJ. Healthand productivity management: Emergingopportunities for health promotion pro-fessionals in the 21st century. Am JHealth Promo. 2000;14:211–214.
4. O’Donnell MP. Health and productivitymanagement: the concept, impact andopportunity: commentary to Goetzel andOzminkowski. Am J Health Promo.2000;14:215–217.
5. Burton WN, Conti DJ, Chen CY, et al.The economic burden of lost productivitydue to migraine headache: a specificworksite analysis. J Occup Environ Med.2002;44:523–529.
6. Burton WN, Conti DJ, Chen CY, et al.The impact of allergies and allergy treat-ment on worker productivity. J OccupEnviron Med. 2001;43:64–71.
7. Burton WN, Chen CY, Schultz AB, et al.
The economic costs associated with bodymass index in a workplace. J OccupEnviron Med. 1998;40:786–792.
8. Simon GE, Barber C, Birnbaum HG, etal. Depression and work productivity:The comparative costs of treatment ver-sus nontreatment. J Occup Environ Med.2001;43:2–9.
9. Claxton AJ, Chawla AJ, Kennedy S.Absenteeism among employees treatedfor depression. J Occup Environ Med.1999;41:605–611.
10. Muchmore L, Lynch WD, Gardner HH,et al. Prevalence of arthritis and associ-ated joint disorders in an employed pop-ulation and the associated healthcare,sick leave, disability, and workers’ com-pensation benefits cost and productivityloss for employers. J Occup EnvironMed. 2003;45:369–378.
11. Crystal-Peters J, Crown WH, GoetzelRZ, et al. The productivity costs of aller-gic rhinitis. Am J Manag Care. 2000;6:3,41–47.
12. Goetzel RZ, Ozminkowski RJ, SedererLI, et al. The business case for qualitymental health services: why employersshould care about the health and well-being of their employees. J Occup Envi-ron Med. 2002;44:320–330.
13. Burton WN, Conti DJ. Use of an inte-grated health data warehouse to measurethe employer cost of five chronic diseasestates. Dis Manage. 1998;1:17–26.
14. Goetzel RZ, Hawkins K, OzminkowskiRJ, et al. The health and productivity costburden of the ‘top-10� physical and men-tal health conditions affecting six largeUS employers in 1999. J Occup EnvironMed. 2003;45:5–14.
15. Sennett C. Proceedings from a confer-ence hosted by the National Institute forHealth Care Management (NIHCM) andthe Centers for Disease Control and Pre-vention (CDC), Washington, DC; Sep-tember 26–27, 2002:17.
16. Goetzel RZ, Ozminkowski RJ, MeneadesL, et al. Pharmaceuticals—cost or invest-ment: an employer’s perspective. J Oc-cup Environ Med. 2000;43:338–351.
17. Heaney CA, Goetzel RZ. A review ofhealth-related outcomes of multi-compo-nent worksite health promotion pro-grams. Am J Health Promo. 1997;11:3.
18. Riedel JE, Lynch W, Baase C, et al. Theeffect of disease prevention and healthpromotion on workplace productivity: aliterature review. Am J Health Promo.2001;15:167–191.
19. Goetzel RZ, Juday TR, Ozminkowski RJ.What’s the ROI?—A systematic reviewof return on investment (ROI) studies ofcorporate health and productivity man-
JOEM • Volume 46, Number 4, April 2004 411
agement initiatives. AWHP’s WorksiteHealth. 1999;12–21.
20. Aldana SG. Financial impact of healthpromotion programs: a comprehensivereview of the literature. Am J HealthPromo. 2001;15:296–320.
21. Goetzel RZ, Guindon AM, Turshen IJ, etal. Health and productivity manage-ment— establishing key performancemeasures, benchmarks and best practices.J Occup Environ Med. 2001;43:10–17.
22. Measuring Employee Productivity: AGuide to Self-Assessment Tools. Institutefor Health and Productivity Management;2001.
23. van Roijen L, Essink-Bot ML, Koopman-schap MA, et al. Labor and health statusin economic evaluation of health care.The Health and Labor Questionnaire. IntJ Technol Assess Health Care. 1996;12:405–415.
24. Lerner D, Amick BC, Rogers WH, et al.The Work Limitations Questionnaire.Med Care. 2001;39:72–85.
25. Lerner D, Reed JI, Massarotti E, et al.The Work Limitations Questionnaire’svalidity and reliability among patientswith osteoarthritis. J Clin Epidemiol.2002;55:197–208.
26. Wahlqvist P, Carlsson J, StalhammarNO, et al. Validity of a Work Productiv-ity and Activity Impairment Question-naire for patients with symptoms of gas-troesophageal reflux disease (WPAI-GERD): results from a cross sectionalstudy. Value Health. 2002;5:106–113.
27. Reilly MC, Zbrozek AS, Dukes EM. Thevalidity and reproducibility of a workproductivity and activity impairment in-strument. PharmacoEcon. 1993;4:353–365.
28. Kessler RC, Greenberg PE, MickelsonKD, et al. The effect of chronic medicalconditions on work loss and work cut-back. J Occup Environ Med. 2001;43:218–225.
29. Stewart W. The American ProductivityAudit (APA): What Is It and How Can ItBe Used by Employers? Presentation atthe Institute for Health and Productivity
Management (IHPM) Conference;Scottsdale, AZ; October 2001.
30. Borden S, Allen H, Barnes RJ. The hid-den competitive edge: Employee healthand productivity. Report prepared by theEmployers Health Coalition (EHC) ofTampa, FL, Dr. Frank M. Brocato, Pres-ident. Published by Managed Care Com-munications: Newton, MA, May 2000.Available at: http://www.ehcaccess.org/survey data.asp.
31. Goetzel RZ, Ozminkowski RJ, Long SR.Development and reliability analysis ofthe Work Productivity Short Inventory(WPSI) instrument measuring employeehealth and productivity. J Occup EnvironMed. 2003;45:743–762.
32. Ozminkowski RJ, Goetzel RZ, Long SR.A Validity analysis of the Work Produc-tivity Short Inventory (WPSI) instrumentmeasuring employee health and produc-tivity. J Occup Environ Med. In press.
33. Burton WN, Conti DJ, Chen CY, et al.The role of health risk factors and diseaseon worker productivity. J Occup EnvironMed. 1999;41:863–877.
34. Loeppke R, Hymel PA, Lofland JH, et al.Health-related workplace productivitymeasurement: general and migraine-specific recommendations from theACOEM expert panel. J Occup EnvironMed. 2003;45:4, 349–359.
35. Stewart WF, Ricci JA, Chee E, et al. Costof lost productive time among US work-ers with depression. JAMA. 2003;289:3135–3314.
36. Kessler RC, Barber C, Beck A, et al. Theworld health organization health andwork performance questionnaire. J Oc-cup Environ Med. 2003;45:156–174.
37. National Center for Health Statistics, Na-tional Health Interview Survey, 1998,series 10, No. 209, 15–39. Centers forDisease Control and Prevention (CDC) ascompiled from the CDC web site: http://www.cdc.gov/nchs/data/series/sr 10/sr10 209.pdf.
38. Gittleman M, Wiatrowski WJ. The BLSwage query system: a new tool to access
wage data. Monthly Labor Review On-line. 2001;124:22–27.
39. Cockburn IM, Bailit HL, Berndt ER, etal. Loss of work productivity due toillness and medical treatment. J OccupEnviron Med. 1999;41:1–6.
40. Claxton AJ, Chawla AJ, Kennedy S.Absenteeism among employees treatedfor depression. J Occup Environ Med.1999;41:605–611.
41. Rizzo J, Abbott T, Pashko S. Laborproductivity effects of prescribed medi-cations for chronically ill workers.Health Econ. 1996;5:249–265.
42. Institute for Health and ProductivityManagement. A View of Health and Pro-ductivity From Corporate America.Scottsdale, AZ: Institute for Health andProductivity Management; 2003.
43. Druss BG, Schlesinger M, Allen HM Jr.Depressive symptoms, satisfaction withhealth care, and 2-year work outcomes inan employed population. Am J Psychia-try. 2001;158:731–734.
44. Kessler RC, Barber C, Birnbaum HG, etal. Depression in the workplace: effectson short-term disability. Health Aff (Mill-wood). 1999;18:163–171.
45. Fishman P, Black L. Indirect costs ofmigraine in a managed care population.Cephalalgia. 1999;19:50–57.
46. Schulman EA, Cady RK, Batenhorst HD,et al. Effectiveness of sumatriptan inreducing productivity loss due to mi-graine: results of a randomized, double-blind, placebo-controlled clinical trial.Mayo Clin Proc. 2000;75:780–781.
47. Greenberg PE, Sisitsky T, Kessler RC, etal. The economic burden of anxiety dis-orders in the 1990s. J Clin Psychiatry.1999;60:427–435.
48. Burton WN, Conti DJ, Chen CY, et al.The role of health risk factors and diseaseon worker productivity. J Occup EnvironMed. 1999;41:863–877.
49. Pauly MV, Nicholson S, Xu J, et al. Ageneral model of the impact of absentee-ism on employers and employees. HealthEcon. 2002;11:221–231.
412 Health and Productivity Cost Estimates • Goetzel et al