hdfc prudence fund - poweraxis.compoweraxis.com/projects/emailer/hdfcmf/2014/... · hdfc prudence...
TRANSCRIPT
HDFC PRUDENCE FUNDHDFC PRUDENCE FUND(Open ended Balanced Scheme)
The Fund that has seen it all
Celebrating 20
11October 16, 2014
This product is suitable for investors who are seeking*:� Capital appreciation over long term� Investment predominantly in equity and equity related instruments of medium
to large sized companies • High risk (BROWN)
* Investors should consult their financial advisers if in doubt about whether the product is suitable for them. Fund Inception date: February 1, 1994
Note: Risk is represented as:
(BLUE) investors understand that their principal will be at low risk
(YELLOW) investors understand that their principal will be at medium risk
(BROWN) investors understand that their principal will be at high risk
Celebrating 20 years*of Prudent
investing
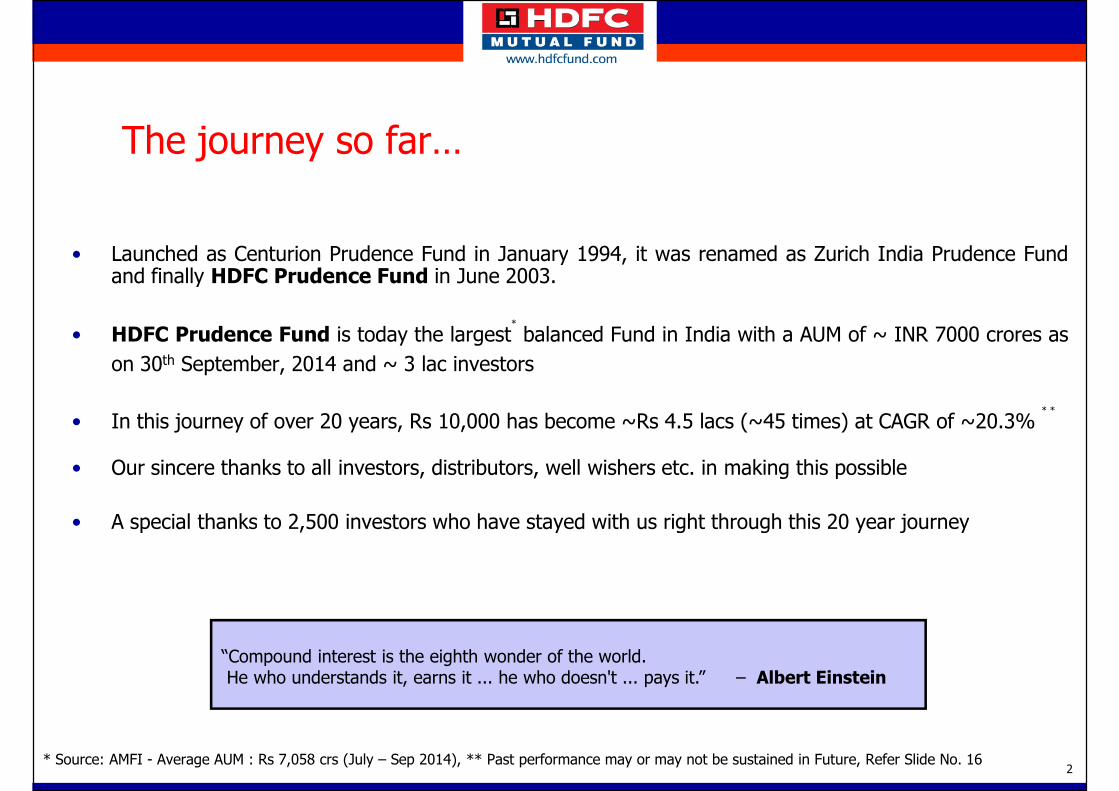
The journey so far…
• Launched as Centurion Prudence Fund in January 1994, it was renamed as Zurich India Prudence Fundand finally HDFC Prudence Fund in June 2003.
• Launched as Centurion Prudence Fund in January 1994, it was renamed as Zurich India Prudence Fundand finally HDFC Prudence Fund in June 2003.
• HDFC Prudence Fund is today the largest*
balanced Fund in India with a AUM of ~ INR 7000 crores as
on 30th September, 2014 and ~ 3 lac investors
• In this journey of over 20 years, Rs 10,000 has become ~Rs 4.5 lacs (~45 times) at CAGR of ~20.3%* *
• Our sincere thanks to all investors, distributors, well wishers etc. in making this possible
• A special thanks to 2,500 investors who have stayed with us right through this 20 year journey
2
• A special thanks to 2,500 investors who have stayed with us right through this 20 year journey
2
“Compound interest is the eighth wonder of the world. He who understands it, earns it ... he who doesn't ... pays it.” – Albert Einstein
* Source: AMFI - Average AUM : Rs 7,058 crs (July – Sep 2014), ** Past performance may or may not be sustained in Future, Refer Slide No. 16
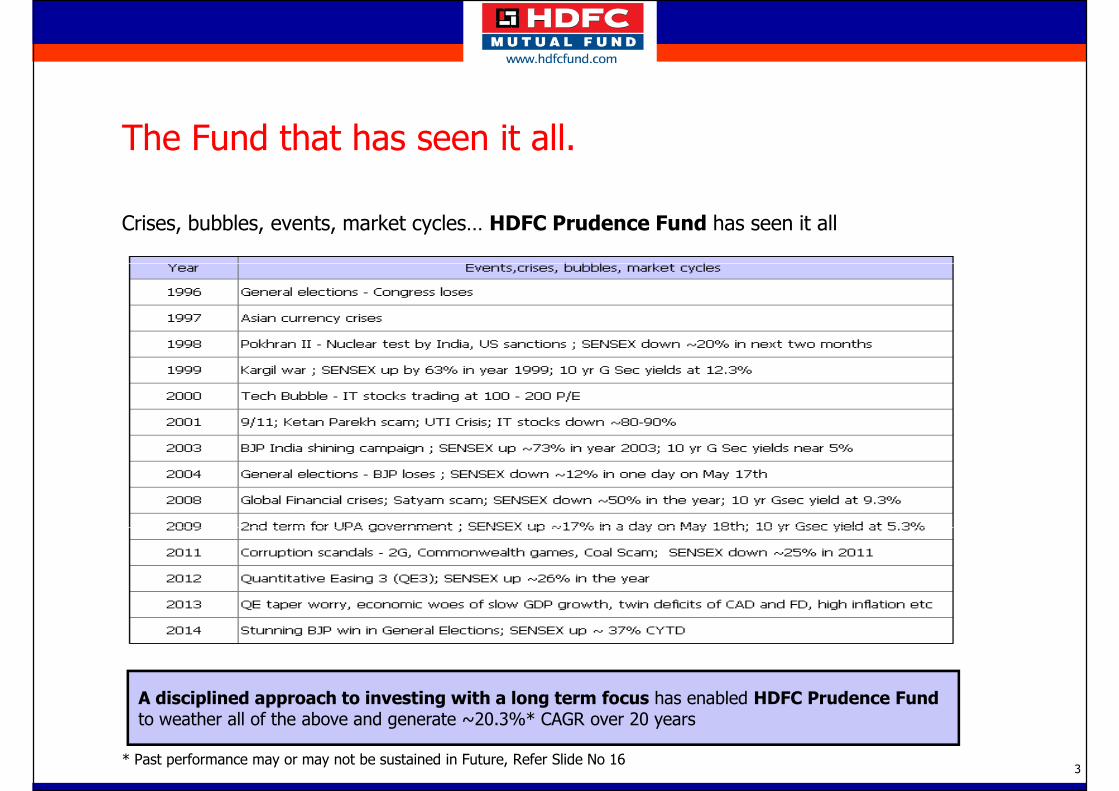
The Fund that has seen it all.
Crises, bubbles, events, market cycles… HDFC Prudence Fund has seen it all
33
A disciplined approach to investing with a long term focus has enabled HDFC Prudence Fundto weather all of the above and generate ~20.3%* CAGR over 20 years
* Past performance may or may not be sustained in Future, Refer Slide No 16
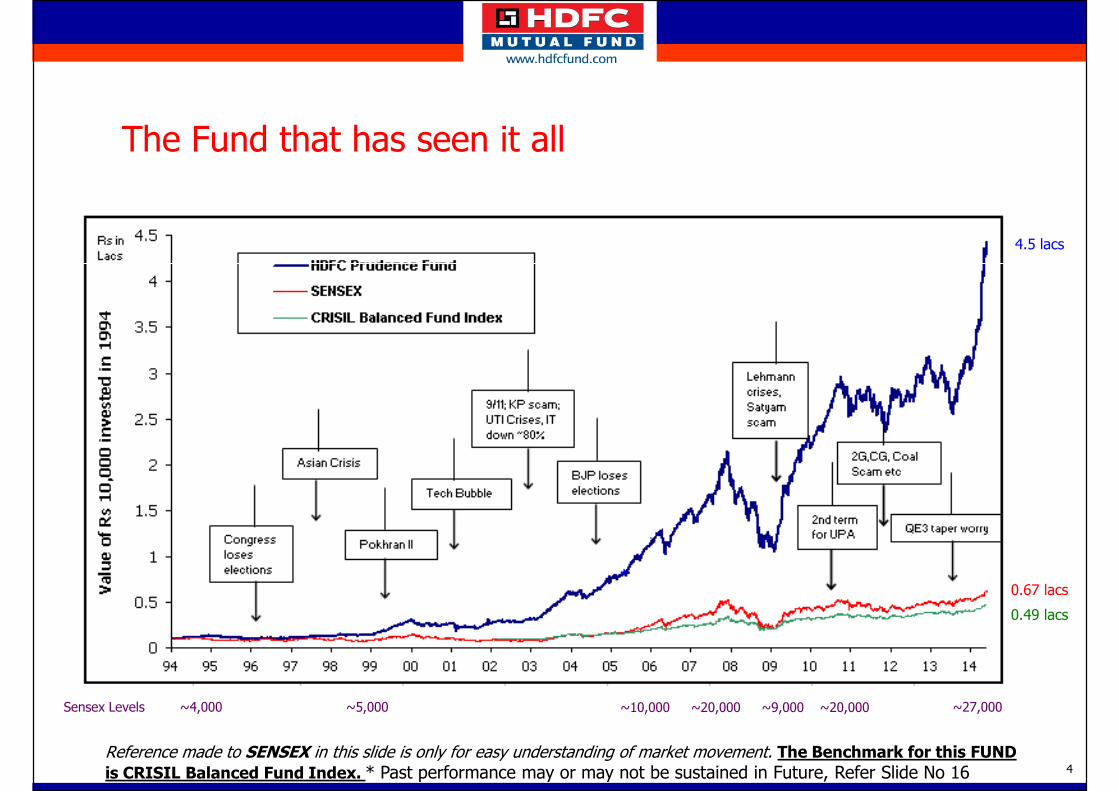
The Fund that has seen it all
4.5 lacs
Reference made to SENSEX in this slide is only for easy understanding of market movement. The Benchmark for this FUND
is CRISIL Balanced Fund Index. * Past performance may or may not be sustained in Future, Refer Slide No 16
~20,000~5,000Sensex Levels ~10,000 ~9,000 ~20,000 ~27,000~4,000
0.67 lacs
0.49 lacs
4
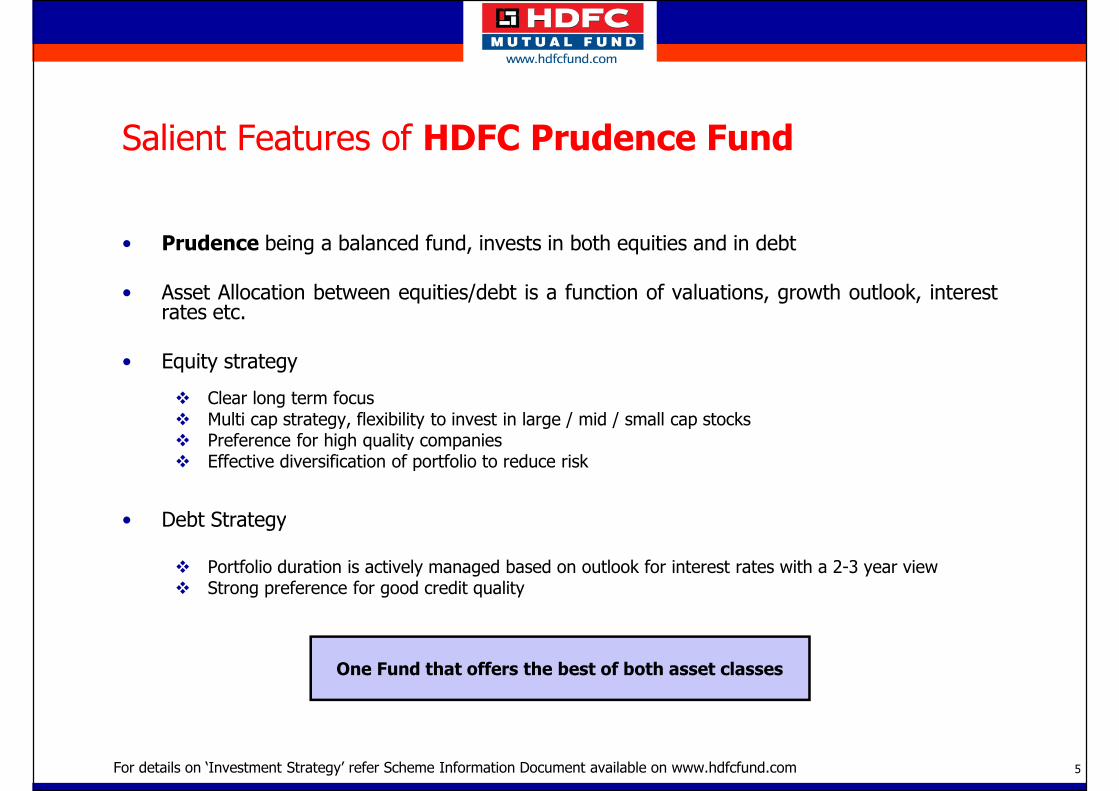
Salient Features of HDFC Prudence Fund
• Prudence being a balanced fund, invests in both equities and in debt
• Asset Allocation between equities/debt is a function of valuations, growth outlook, interestrates etc.
• Equity strategy
� Clear long term focus� Multi cap strategy, flexibility to invest in large / mid / small cap stocks� Preference for high quality companies� Effective diversification of portfolio to reduce risk
• Debt Strategy
5
• Debt Strategy
� Portfolio duration is actively managed based on outlook for interest rates with a 2-3 year view� Strong preference for good credit quality
5
One Fund that offers the best of both asset classes
For details on ‘Investment Strategy’ refer Scheme Information Document available on www.hdfcfund.com
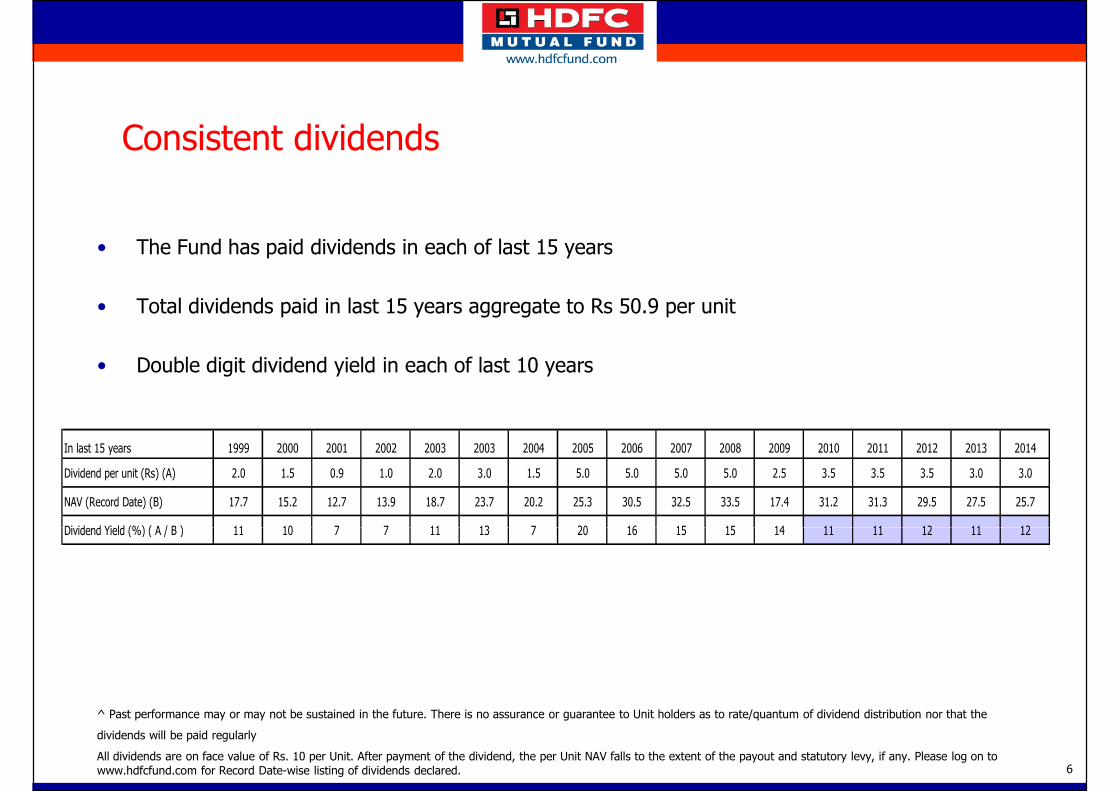
Consistent dividends
• The Fund has paid dividends in each of last 15 years
• Total dividends paid in last 15 years aggregate to Rs 50.9 per unit
• Double digit dividend yield in each of last 10 years
In last 15 years 1999 2000 2001 2002 2003 2003 2004 2005 2006 2007 2008 2009 2010 2011 2012 2013 2014
Dividend per unit (Rs) (A) 2.0 1.5 0.9 1.0 2.0 3.0 1.5 5.0 5.0 5.0 5.0 2.5 3.5 3.5 3.5 3.0 3.0
NAV (Record Date) (B) 17.7 15.2 12.7 13.9 18.7 23.7 20.2 25.3 30.5 32.5 33.5 17.4 31.2 31.3 29.5 27.5 25.7
Dividend Yield (%) ( A / B ) 11 10 7 7 11 13 7 20 16 15 15 14 11 11 12 11 12
6
^ Past performance may or may not be sustained in the future. There is no assurance or guarantee to Unit holders as to rate/quantum of dividend distribution nor that the
dividends will be paid regularly
All dividends are on face value of Rs. 10 per Unit. After payment of the dividend, the per Unit NAV falls to the extent of the payout and statutory levy, if any. Please log on to
www.hdfcfund.com for Record Date-wise listing of dividends declared.
Dividend Yield (%) ( A / B ) 11 10 7 7 11 13 7 20 16 15 15 14 11 11 12 11 12
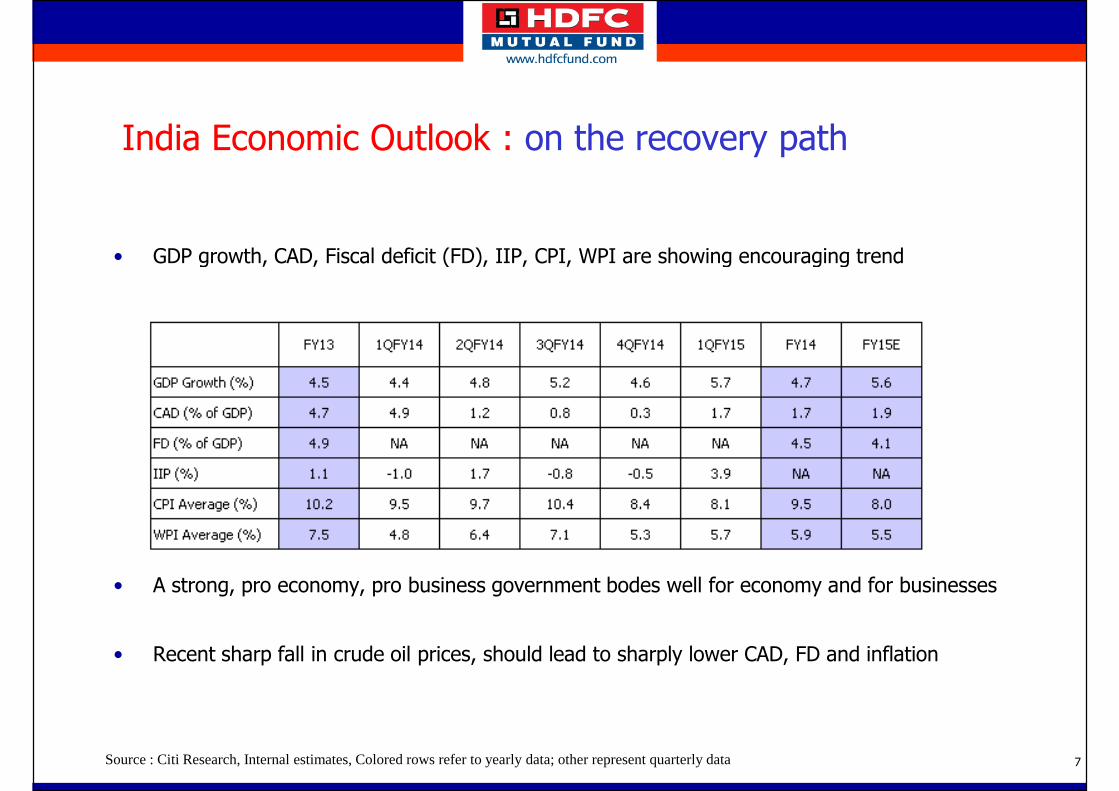
India Economic Outlook : on the recovery path
• GDP growth, CAD, Fiscal deficit (FD), IIP, CPI, WPI are showing encouraging trend • GDP growth, CAD, Fiscal deficit (FD), IIP, CPI, WPI are showing encouraging trend
• A strong, pro economy, pro business government bodes well for economy and for businesses
• Recent sharp fall in crude oil prices, should lead to sharply lower CAD, FD and inflation
7Source : Citi Research, Internal estimates, Colored rows refer to yearly data; other represent quarterly data
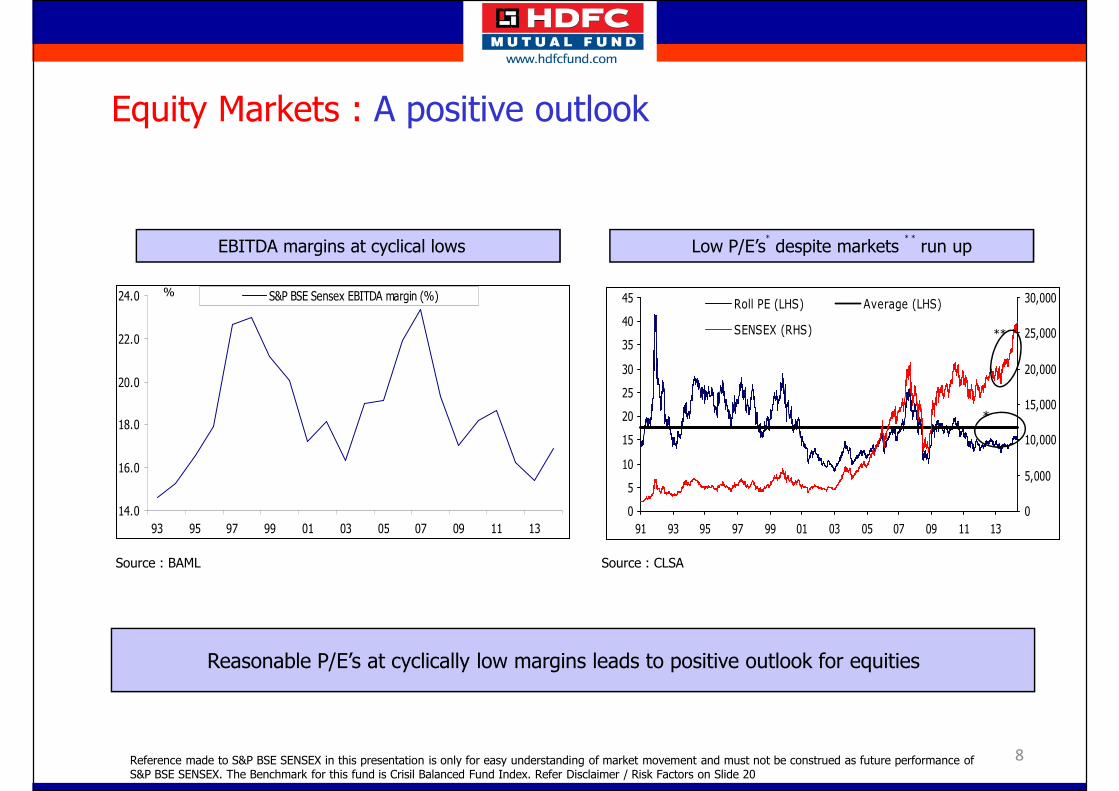
Equity Markets : A positive outlook
Low P/E’s*
despite markets * *
run upEBITDA margins at cyclical lows
FY14.0
16.0
18.0
20.0
22.0
24.0
93 95 97 99 01 03 05 07 09 11 13
S&P BSE Sensex EBITDA margin (%)%
0
5
10
15
20
25
30
35
40
45
91 93 95 97 99 01 03 05 07 09 11 13
0
5,000
10,000
15,000
20,000
25,000
30,000Roll PE (LHS) Average (LHS)
SENSEX (RHS) **
*
Reasonable P/E’s at cyclically low margins leads to positive outlook for equities
Source : BAML
8Reference made to S&P BSE SENSEX in this presentation is only for easy understanding of market movement and must not be construed as future performance of S&P BSE SENSEX. The Benchmark for this fund is Crisil Balanced Fund Index. Refer Disclaimer / Risk Factors on Slide 20
93 95 97 99 01 03 05 07 09 11 13
Source : CLSA
91 93 95 97 99 01 03 05 07 09 11 13
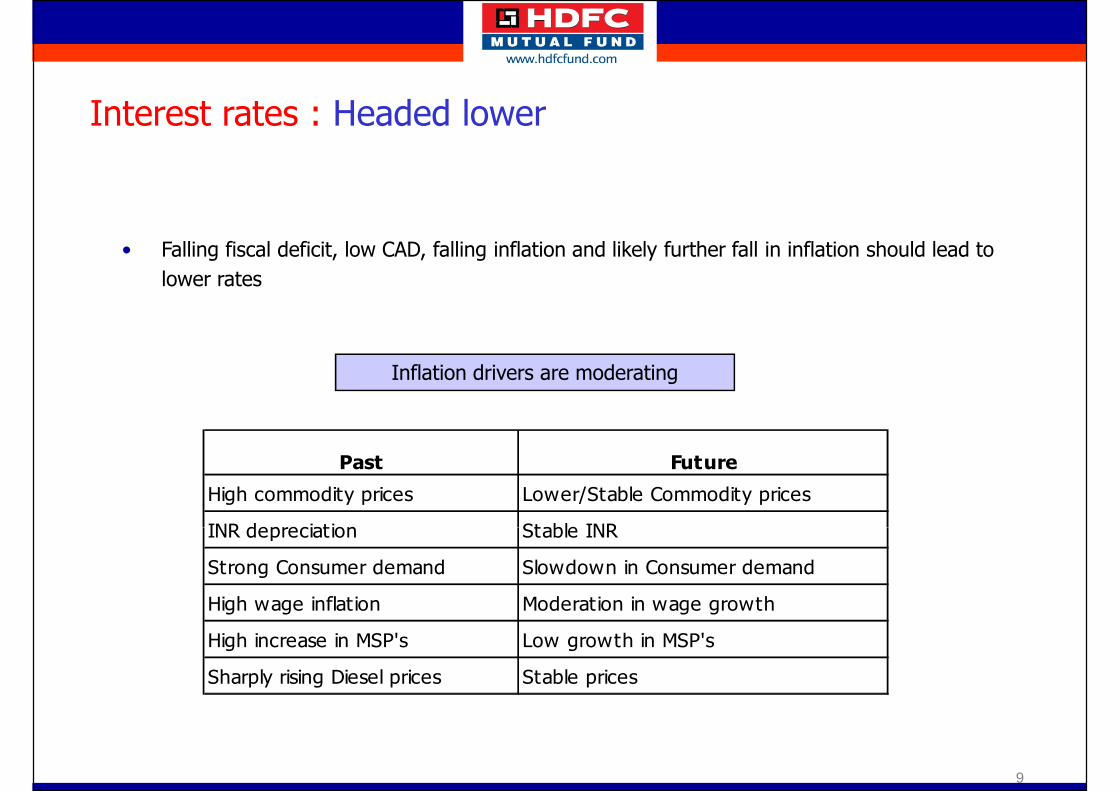
Interest rates : Headed lower
• Falling fiscal deficit, low CAD, falling inflation and likely further fall in inflation should lead to
Past Future
High commodity prices Lower/Stable Commodity prices
INR depreciation Stable INR
lower rates
Inflation drivers are moderating
INR depreciation Stable INR
Strong Consumer demand Slowdown in Consumer demand
High wage inflation Moderation in wage growth
High increase in MSP's Low growth in MSP's
Sharply rising Diesel prices Stable prices
9
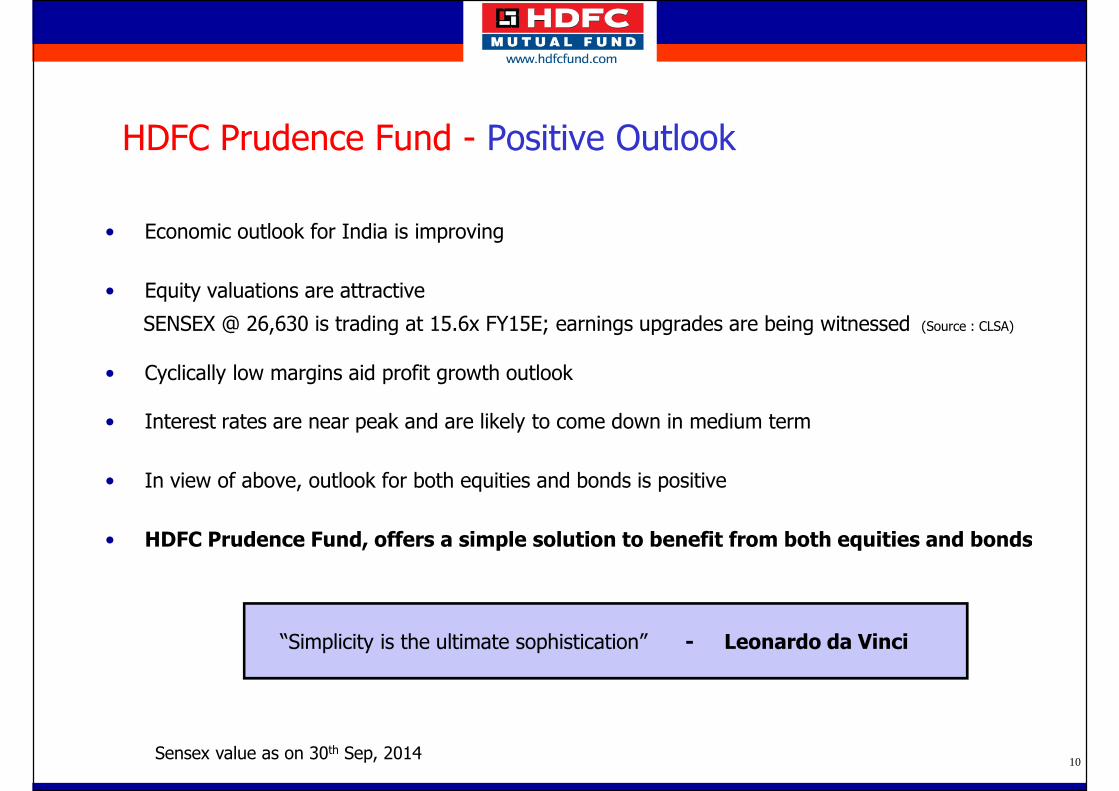
HDFC Prudence Fund - Positive Outlook
• Economic outlook for India is improving
• Equity valuations are attractive
SENSEX @ 26,630 is trading at 15.6x FY15E; earnings upgrades are being witnessed (Source : CLSA)
• Cyclically low margins aid profit growth outlook
• Interest rates are near peak and are likely to come down in medium term
• In view of above, outlook for both equities and bonds is positive
• HDFC Prudence Fund, offers a simple solution to benefit from both equities and bonds• HDFC Prudence Fund, offers a simple solution to benefit from both equities and bonds
10
“Simplicity is the ultimate sophistication” - Leonardo da Vinci
Sensex value as on 30th Sep, 2014
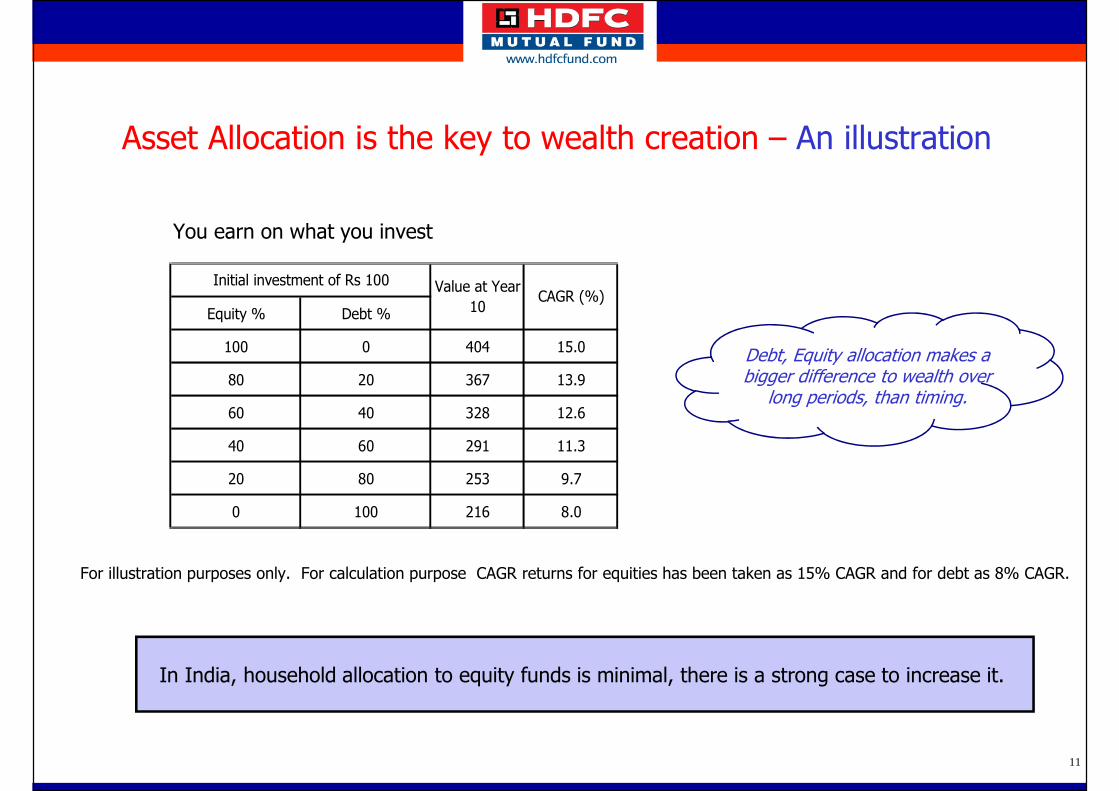
Asset Allocation is the key to wealth creation – An illustration
You earn on what you invest
Debt, Equity allocation makes a bigger difference to wealth over
long periods, than timing.
Equity % Debt %
100 0 404 15.0
80 20 367 13.9
60 40 328 12.6
40 60 291 11.3
20 80 253 9.7
0 100 216 8.0
Initial investment of Rs 100 Value at Year
10CAGR (%)
11 11
For illustration purposes only. For calculation purpose CAGR returns for equities has been taken as 15% CAGR and for debt as 8% CAGR.
In India, household allocation to equity funds is minimal, there is a strong case to increase it.

The benefits of long term investing
Study based on return distribution of HDFC Prudence Fund over 20 years
Following table represents monthly rolling returns over last 20 years of HDFC Prudence Fund distributed over different
holding periods and return brackets, e.g., returns have been more than 15% p.a. in ~57% of 1 year holdingholding periods and return brackets, e.g., returns have been more than 15% p.a. in ~57% of 1 year holding
periods, more than 15% p.a. in ~63% of 3 year holding periods, more than 15% p.a. in ~81% 5 year holding periods
and more than 15% p.a. in ~100% of 10, 15 and 20 years holding periods
CAGR (%) 1 Year 3 Years 5 Years 10 Years 15 Years 20 Years
more than 20 49 46 55 83 94 56more than 15 57 63 81 100 100 100more than 10 65 75 96 100 100 100more than 0 76 96 100 100 100 100
more than -10 89 100 100 100 100 100more than -20 96 100 100 100 100 100less than -20 4 0 0 0 0 0
• It can be clearly seen, that as the holding period increases, return profile improves
• This is consistent with the belief that equities are a long term asset class and that risk reduces as holding period increases
12
“Time spent in markets is more important than timing the markets”
12Performance data computed till September, 2014
less than -20 4 0 0 0 0 0
^ Past performance may or may not be sustained in the future.
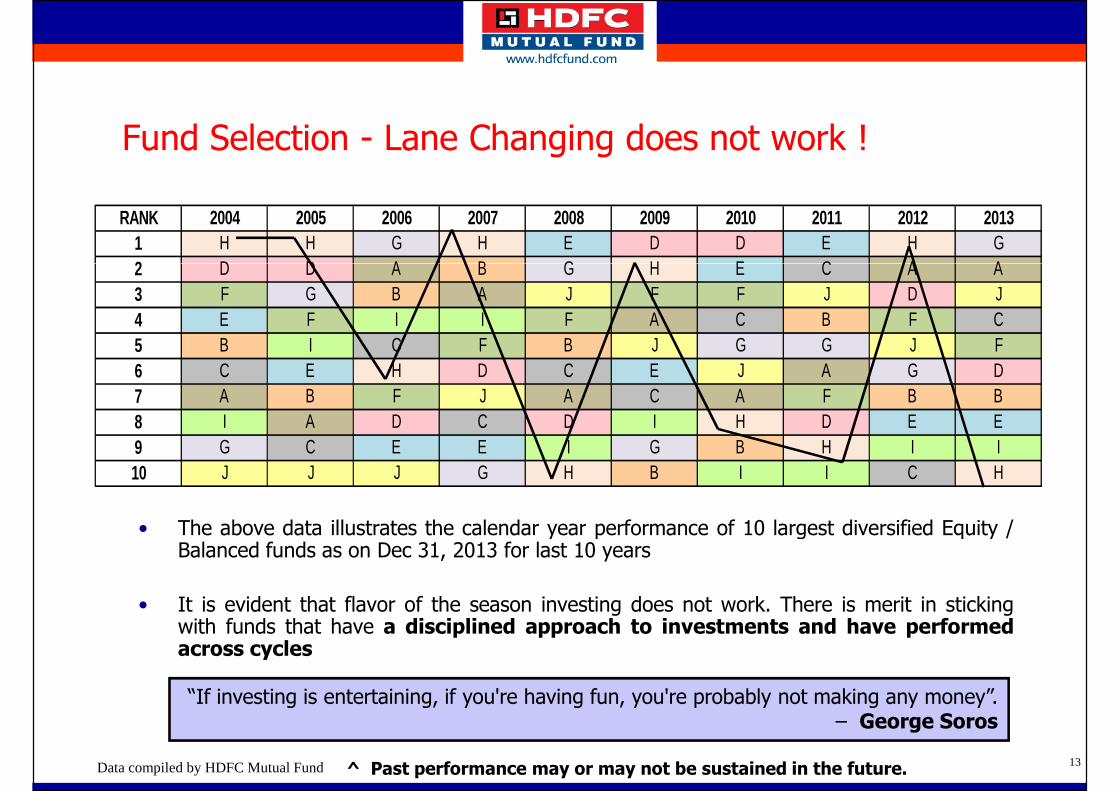
Fund Selection - Lane Changing does not work !
RANK 2004 2005 2006 2007 2008 2009 2010 2011 2012 20131 H H G H E D D E H G2 D D A B G H E C A A
• The above data illustrates the calendar year performance of 10 largest diversified Equity /
2 D D A B G H E C A A3 F G B A J F F J D J4 E F I I F A C B F C5 B I C F B J G G J F6 C E H D C E J A G D7 A B F J A C A F B B8 I A D C D I H D E E9 G C E E I G B H I I10 J J J G H B I I C H
• The above data illustrates the calendar year performance of 10 largest diversified Equity /Balanced funds as on Dec 31, 2013 for last 10 years
• It is evident that flavor of the season investing does not work. There is merit in stickingwith funds that have a disciplined approach to investments and have performedacross cycles
Data compiled by HDFC Mutual Fund
“If investing is entertaining, if you're having fun, you're probably not making any money”. – George Soros
13^ Past performance may or may not be sustained in the future.
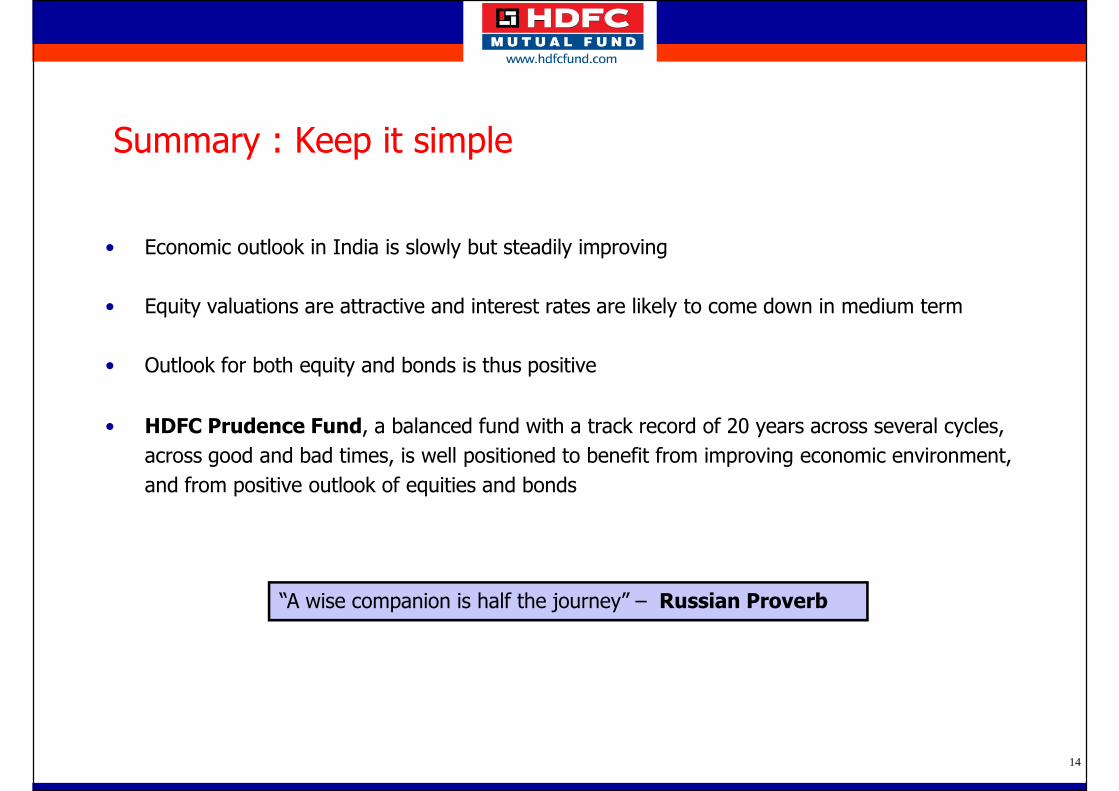
Summary : Keep it simple
• Economic outlook in India is slowly but steadily improving
• Equity valuations are attractive and interest rates are likely to come down in medium term
• Outlook for both equity and bonds is thus positive
• HDFC Prudence Fund, a balanced fund with a track record of 20 years across several cycles,
across good and bad times, is well positioned to benefit from improving economic environment,
and from positive outlook of equities and bonds
“A wise companion is half the journey” – Russian Proverb
14
Performance (As on September 30, 2014)
Refer Disclaimer / Risk Factors on Slide: 22 Slide 15 15
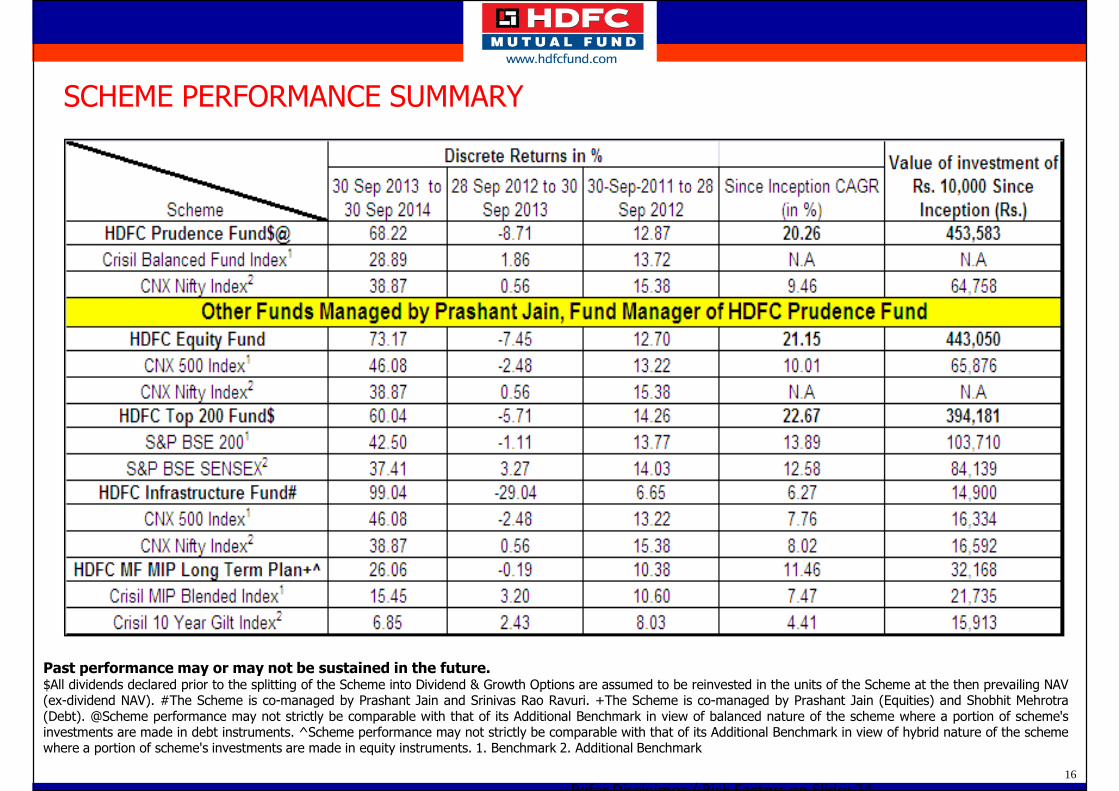
SCHEME PERFORMANCE SUMMARY
Refer Disclaimer / Risk Factors on Slide: 24
Past performance may or may not be sustained in the future.$All dividends declared prior to the splitting of the Scheme into Dividend & Growth Options are assumed to be reinvested in the units of the Scheme at the then prevailing NAV(ex-dividend NAV). #The Scheme is co-managed by Prashant Jain and Srinivas Rao Ravuri. +The Scheme is co-managed by Prashant Jain (Equities) and Shobhit Mehrotra(Debt). @Scheme performance may not strictly be comparable with that of its Additional Benchmark in view of balanced nature of the scheme where a portion of scheme'sinvestments are made in debt instruments. ^Scheme performance may not strictly be comparable with that of its Additional Benchmark in view of hybrid nature of the schemewhere a portion of scheme's investments are made in equity instruments. 1. Benchmark 2. Additional Benchmark
16
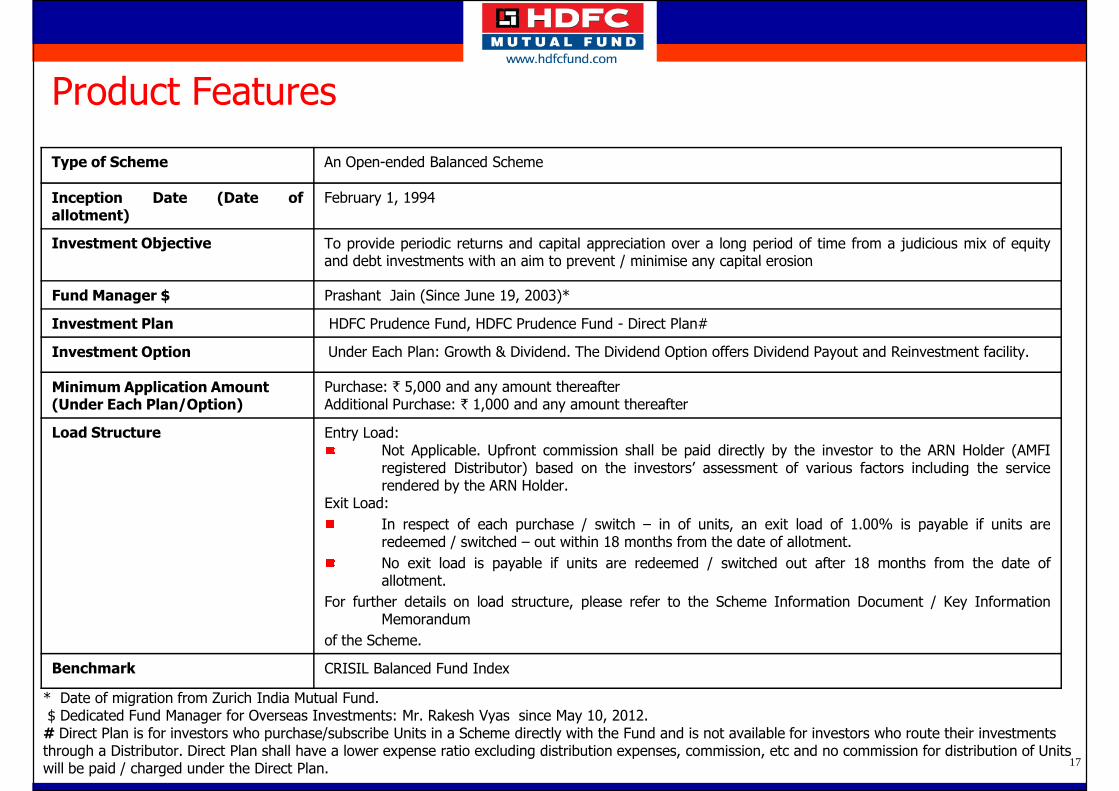
Product Features
Type of Scheme An Open-ended Balanced Scheme
Inception Date (Date ofallotment)
February 1, 1994
Investment Objective To provide periodic returns and capital appreciation over a long period of time from a judicious mix of equityand debt investments with an aim to prevent / minimise any capital erosionand debt investments with an aim to prevent / minimise any capital erosion
Fund Manager $ Prashant Jain (Since June 19, 2003)*
Investment Plan HDFC Prudence Fund, HDFC Prudence Fund - Direct Plan#
Investment Option Under Each Plan: Growth & Dividend. The Dividend Option offers Dividend Payout and Reinvestment facility.
Minimum Application Amount(Under Each Plan/Option)
Purchase: ` 5,000 and any amount thereafterAdditional Purchase: ` 1,000 and any amount thereafter
Load Structure Entry Load:Not Applicable. Upfront commission shall be paid directly by the investor to the ARN Holder (AMFIregistered Distributor) based on the investors’ assessment of various factors including the servicerendered by the ARN Holder.
Exit Load:
In respect of each purchase / switch – in of units, an exit load of 1.00% is payable if units are
17
* Date of migration from Zurich India Mutual Fund. $ Dedicated Fund Manager for Overseas Investments: Mr. Rakesh Vyas since May 10, 2012.# Direct Plan is for investors who purchase/subscribe Units in a Scheme directly with the Fund and is not available for investors who route their investments through a Distributor. Direct Plan shall have a lower expense ratio excluding distribution expenses, commission, etc and no commission for distribution of Units will be paid / charged under the Direct Plan.
In respect of each purchase / switch – in of units, an exit load of 1.00% is payable if units areredeemed / switched – out within 18 months from the date of allotment.
No exit load is payable if units are redeemed / switched out after 18 months from the date ofallotment.
For further details on load structure, please refer to the Scheme Information Document / Key InformationMemorandum
of the Scheme.
Benchmark CRISIL Balanced Fund Index
17
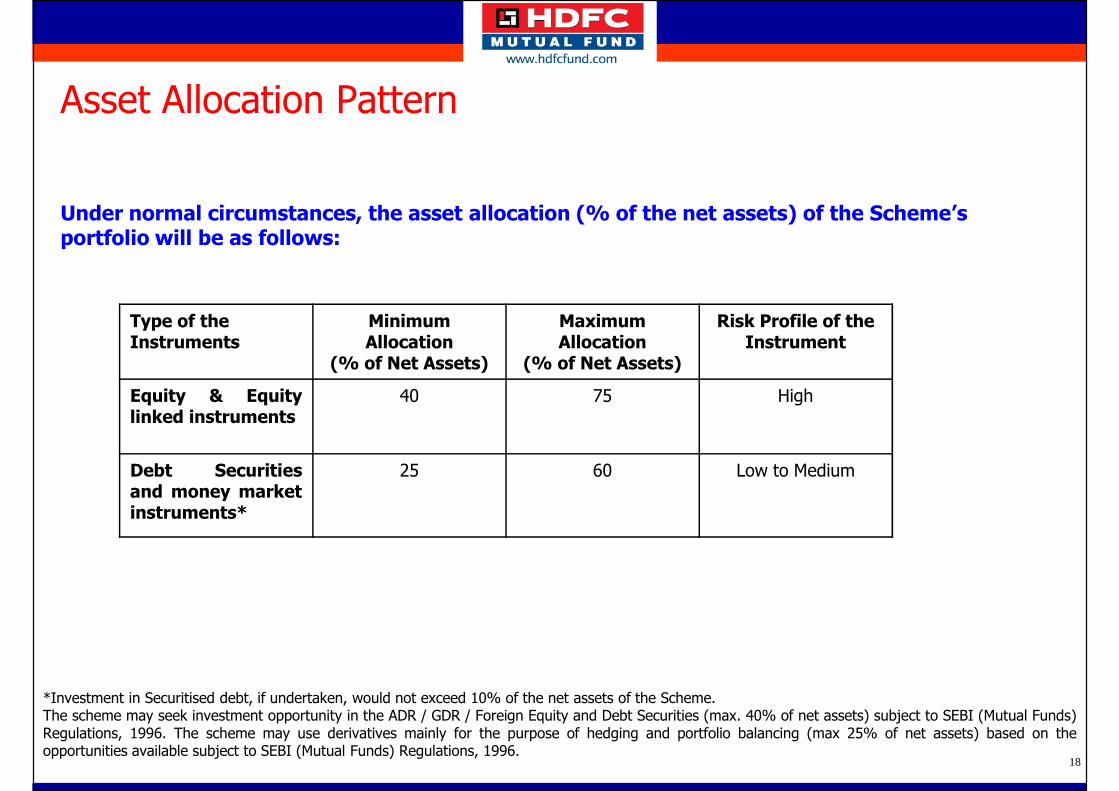
Asset Allocation Pattern
Under normal circumstances, the asset allocation (% of the net assets) of the Scheme’s portfolio will be as follows:
Type of the Instruments
Minimum Allocation
(% of Net Assets)
Maximum Allocation
(% of Net Assets)
Risk Profile of the Instrument
Equity & Equitylinked instruments
40 75 High
Debt Securitiesand money marketinstruments*
25 60 Low to Medium
18
*Investment in Securitised debt, if undertaken, would not exceed 10% of the net assets of the Scheme.The scheme may seek investment opportunity in the ADR / GDR / Foreign Equity and Debt Securities (max. 40% of net assets) subject to SEBI (Mutual Funds)Regulations, 1996. The scheme may use derivatives mainly for the purpose of hedging and portfolio balancing (max 25% of net assets) based on theopportunities available subject to SEBI (Mutual Funds) Regulations, 1996.
18
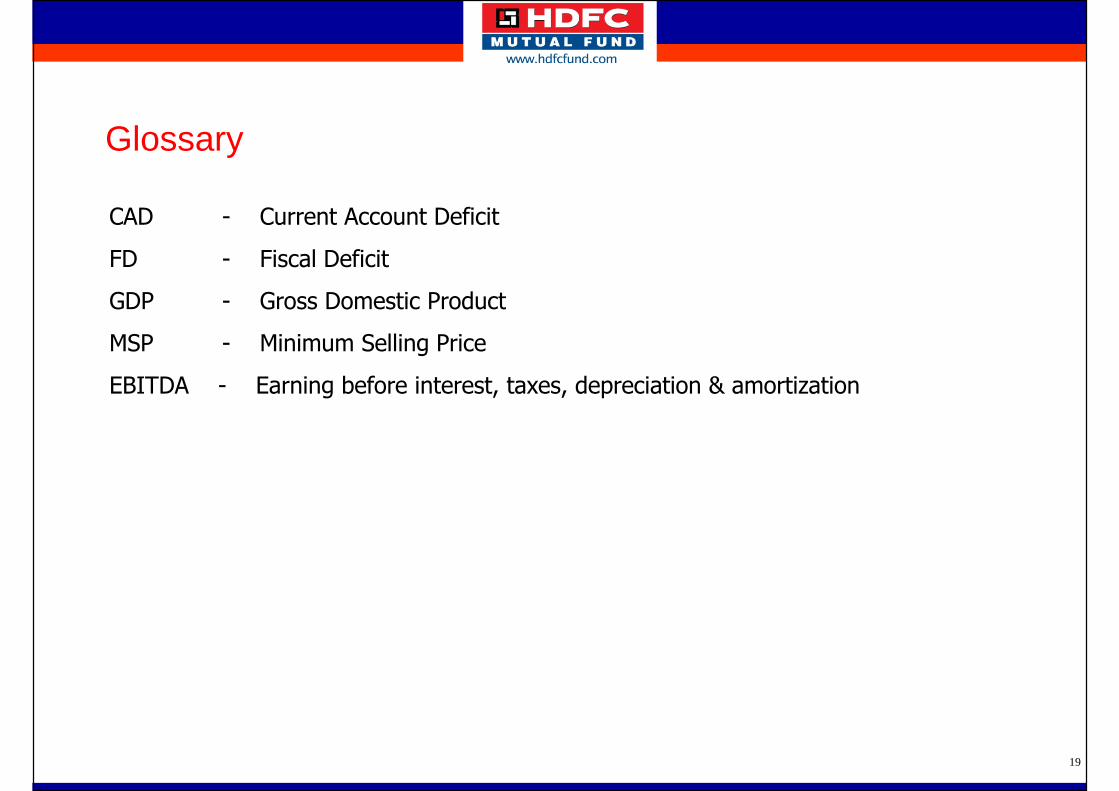
Glossary
CAD - Current Account Deficit
FD - Fiscal DeficitFD - Fiscal Deficit
GDP - Gross Domestic Product
MSP - Minimum Selling Price
EBITDA - Earning before interest, taxes, depreciation & amortization
19
Thank You
20 20
DISCLAIMER
The views expressed herein are based on the basis of internal data, publicly available information and other sources believed to be reliable. Any calculations made are approximations, meant as guidelines only, which you must confirm before relying on them. The information contained in this document is for general purposes only and is not an offer to sell or a solicitation to buy/sell any mutual fund units/securities. The document is given in summary form and does not purport to be complete. The document does not have regard to specific given in summary form and does not purport to be complete. The document does not have regard to specific investment objectives, financial situation and the particular needs of any specific person who may receive this document. The information/ data herein alone are not sufficient and should not be used for the development or implementation of an investment strategy. The same should not be construed as investment advice to any party. The statements contained herein are based on our current views and involve known and unknown risks and uncertainties that could cause actual results, performance or events to differ materially from those expressed or implied in such statements. Neither HDFC Asset Management Company (HDFC AMC) and HDFC Mutual Fund (the Fund) nor any person connected with them, accepts any liability arising from the use of this document. The recipient(s) before acting on any information herein should make his/her/their own investigation and seek appropriate professional advice and shall alone be fully responsible / liable for any decision taken on the basis of information contained herein.
21
decision taken on the basis of information contained herein.
MUTUAL FUND INVESTMENTS ARE SUBJECT TO MARKET RISKS, READ ALL SCHEME RELATED DOCUMENTS CAREFULLY.
21