hca investor presentation - hca...
TRANSCRIPT

HCA Investor Presentation

Forward Looking Statements andNon‐GAAP Financial Measures
This presentation may contain certain forward‐looking statements provided by Company management. These statements are intended to be covered by the safe‐harbor provisions of the Private Securities Litigation Reform Act of 1995. Forward‐looking statements include all statements that do not relate solely to historical or current facts, including statements regarding future operations, financial results, cash flows, costs and cost management initiatives, capital structure management, growth rates, and operational and strategic initiatives, and can also be identified by the use of words like “may,” “believe,” “will,” “expect,” “project,” “estimate,” “anticipate,” “intend,” “plan,” “initiative,” “continue” or words or phrases of similar meaning. These forward‐looking statements speak only as of the date hereof and are based on our current plans and expectations and are subject to a number of known and unknown uncertainties and risks, many of which are beyond our control. These risks and uncertainties are described under headings such as “Risk Factors” in our annual report on Form 10‐K for the year ended December 31, 2015 and other reports filed with the Securities and Exchange Commission. As a consequence, current plans, anticipated actions and future financial position and results of operations may differ significantly from those expressed in any forward‐looking statements in today’s presentation. You are cautioned not to unduly rely on such forward‐looking statements when evaluating the information presented and we do not intend to update any of these forward‐looking statements.
The presentation may contain certain non‐GAAP measures, including Adjusted EBITDA. The Company’s earnings release for the year ended December 31, 2015 and quarter ended March 31, 2016 located on the Company’s investor relations page at www.hcahealthcare.com, includes a reconciliation of the difference between certain non‐GAAP financial measures with the most directly comparable financial measure calculated in accordance with GAAP. These non‐GAAP financial measures should not be considered alternatives to the GAAP financial measures.
References to “Company” used herein refer to HCA Holdings, Inc. and its affiliates, unless otherwise stated or indicated by context.
2

Positioned to succeed
Healthcare industry overview
Who we are
3
Who we are
Pearland Medical CenterPearland, TexasOpened February 2015

Sources of differentiation
Deep andexperiencedleadership
Scale
Diversifiedportfolio
Financialstrength
Strongoperatingculture
5

Nashville34%
Tampa/ St. Pete28%
Denver32%
Dallas/Fort Worth
18%Austin40%
Houston19%
Kansas City23%
Miami/Fort Lauderdale
22%
Las Vegas32%
Western Idaho
Idaho Falls
Wichita
OklahomaCity
Las Vegas
El Paso
BrownsvilleMcAllen
Corpus Christi
New Orleans
Central Louisiana
LafayettePanhandle
Tallahassee Jacksonville
North Central FloridaOrlando
Treasure Coast
Charleston
Myrtle Beach
New Hampshire
Augusta
Middle GA
Chattanooga
NWGAAtlanta
TerreHaute
Frankfort
NOVA
SWVA
Anchorage
London
Richmond37%
San Jose17%
Salt Lake 20%
Diversified portfolio in growing markets
6Note: Percentages represent current market share1
San Antonio36%

Diversified mix of facilities and services
7
Acute Care
Shared Services
Access Centers
168
44K
Ambulatory Services
Hospitals
Licensed Beds
116
15
GI Centers
Urgent Care Centers
66
55
Freestanding ERs
Physicians
Physician Clinics
~830
35K
Active Medical Staff
ASCs
Enterprise Services

8
Admissions 3.8%
4.8%Equivalent Admissions
ER Visits
Surgeries
7.1%
2.5%
Values represent 2015Percentages represent 5 year CAGR: 2010 – 2015
Revenue 7.2%
1.9M
3.1M
8.1M
1.4M
$39.7B
Delivering strong consistent performance

Converting to solid EBITDA growth
9
5‐year Adjusted EBITDA CAGR: 6.2%
5 year adjusted EBITDA CAGR: 2010 – 2015
In Billions
$5.9
$7.9
$5.0
$5.5
$6.0
$6.5
$7.0
$7.5
$8.0
$8.5
2010 2011 2012 2013 2014 2015

Deploying a balanced capital allocation
10Use of Cash Flows from March 2011 IPO through 1Q 2016
Acquisitions
Cash Flows from Operations
Capital Expenditures
Special Dividends
Share Repurchases
$21.5B
$10.2B
$3.5B
$3.2B
$6.8B

Advancing the patient experience
11
Patient Experience
Big Data/Best
Practices
Partnering with
Physicians
Competent Employees
Technology
106 Hospitals 2015 Top Performers by the Joint Commission
Values:• Safe• High quality• Efficient• Compassionate

Healthcare industry overview
StoneSprings Hospital CenterDulles, VirginiaOpened December 2015

Positive industry outlook
13
U.S. health spending projected to grow 5.8% annually from 2014‐20242
• Improving economic conditions• Aging population• Clinical innovation• ACA coverage expansion
Stable pricing environment
No significant change in competitive dynamics
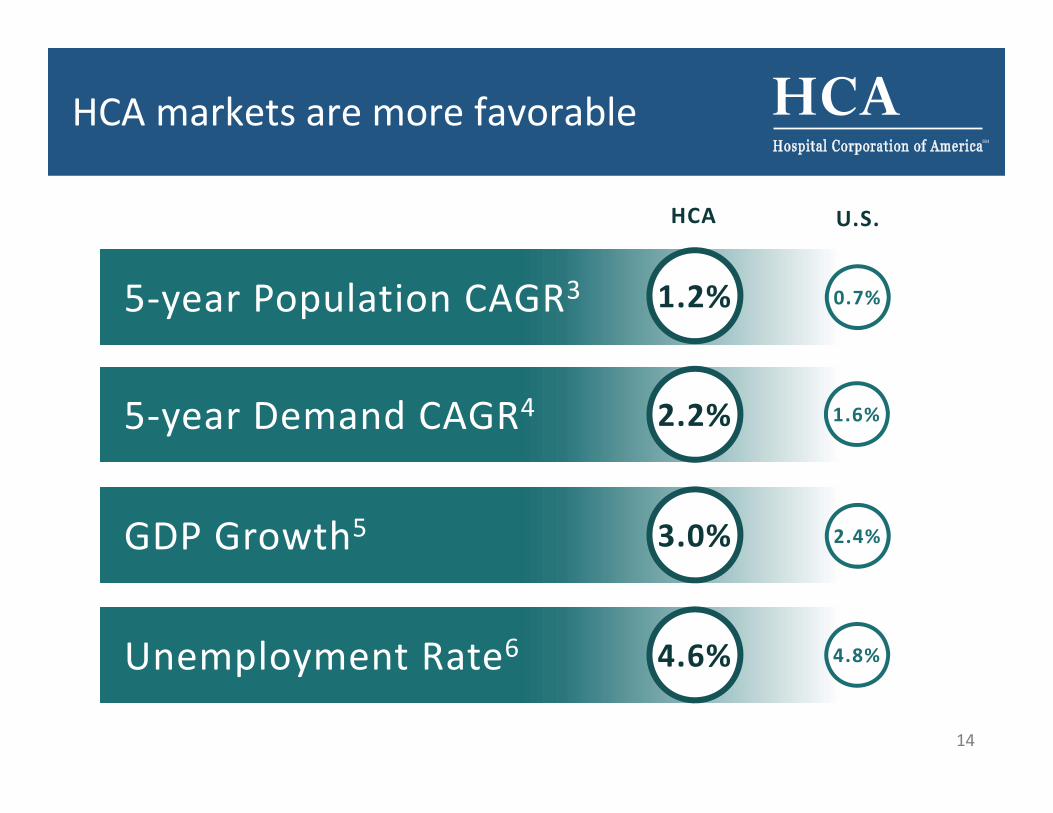
5‐year Population CAGR3
5‐year Demand CAGR4
GDP Growth5
Unemployment Rate6
HCA markets are more favorable
14
2.4%
U.S.HCA
3.0%
4.6%
0.7%
1.6%2.2%
1.2%
4.8%

3.9M* remaining eligible enrollees7, 8, 9
Healthcare reform potential remains
15
Texas1.5M*
HCA Medicaid Expansion State10Florida
840K*
<15% of HCA beds in Medicaid expansion states
*Remaining eligible enrollees within HCA markets only7, 8, 9

Positioned to succeed
Citrus Park Emergency RoomTampa, FloridaOpened June 2015

Be the provider system of choice
17
Local Sustainable Growth
Coordination Across
Continuum
Access and Convenience
Operational Excellence
Strong Physician
Relationships
Comprehensive Service Lines

Leveraging our scale locally
18
Economies
Innovation
Capital
Make our business better
Drive more growth
Get to market faster
Support even better execution
19
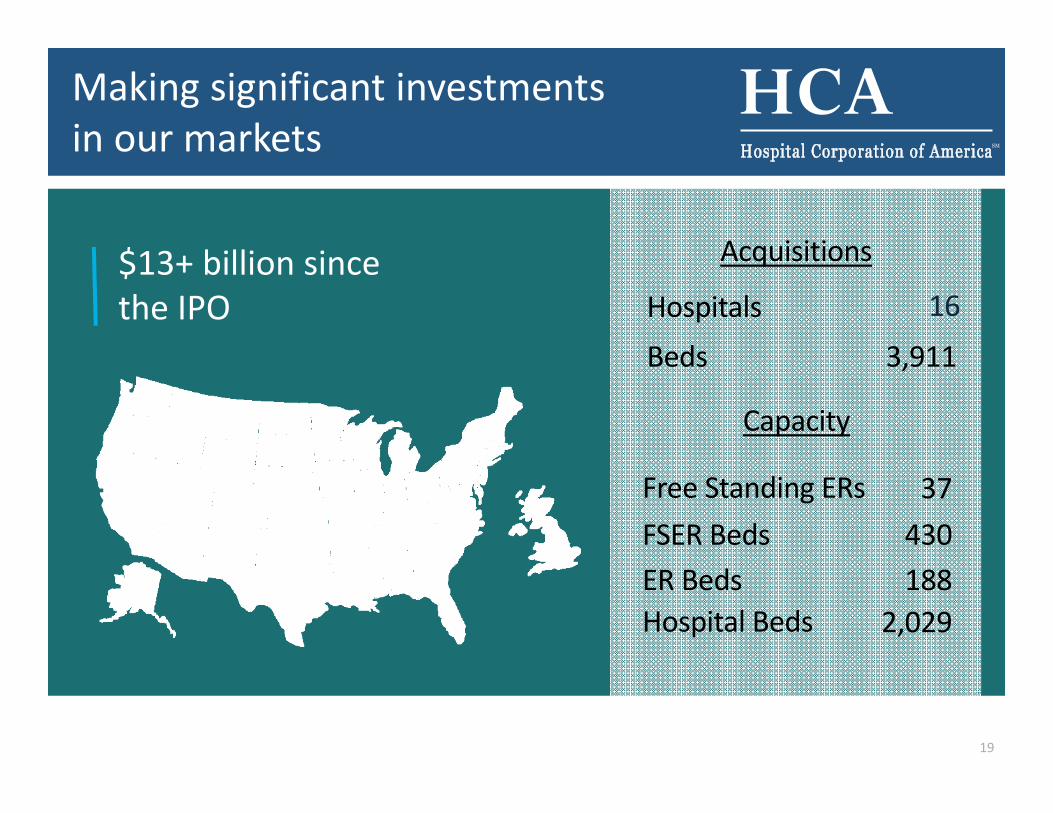
37Free Standing ERs
188ER Beds430FSER Beds
2,029Hospital Beds
3,911BedsHospitals 16
Making significant investments in our markets
$13+ billion since the IPO
Acquisitions
Capacity

Nashville market overview
3
5
3
3
5
7
214Minute Clinics
12 Hospital Campuses1 Children’s Campus1 Behavioral Campus2,000 Beds1 Trauma Center
10 CareSpotUrgent Care Centers
17 Imaging Centers
7 AmbulatorySurgery Centers
66 TriStar Medical Group Locations
3 Freestanding ERs
1 Transfer Center
7 Health Parks
2
20
5 Oncology Centers

23.8%
23.9%
24.0%
24.1%
24.2%
24.3%
24.4%
24.5%
24.6%
24.7%
2012 2013 2014 2015*
Sustaining market share growth
21
24.0%
24.6%
Share gains over PY in 23 of 38 Markets
HCA Growth in 16 of 19 Service Lines
Note: Percentages represent current market share1Market Share Notes: Source = State data via Stratasan* 9 months ending September 30, 2015

Sources of differentiation
Deep andexperiencedleadership
Scale
Diversifiedportfolio
Financialstrength
Strongoperatingculture
22

23
Notes and Sources
1 Market Share Notes:• Same Store. Composit ion Market ( In Market + In Migrat ion)• Stat ist ics are based on data for the most recent ly avai lable 48 month period for 38 def ined markets.• Analys is inc ludes data for 34 markets through 3Q’15 and & 4 markets through 4Q’14 (CA)• Source = State data via Stratasan
2 CMS Off ice of the Actuary in the Centers for Medicare & Medicaid Services, July 2015. NHE Project ions 2014 ‐2024 Forecast Summary: https://www.cms.gov/Research ‐Stat ist ics ‐Data ‐and ‐Systems/Stat ist ics ‐Trends ‐and ‐Reports/NationalHealthExpendData/Downloads/proj2014.pdf
3 ESRI – 5 year CAGR, 2015 ‐2020 populat ion project ion
4 Sg2 – 5 year CAGR, 2015 ‐2020 inpat ient admiss ions Demand based on epidemiology and populat ion forecasts , 2014 base year. Excludes normal newborns.
5 U.S. Dept. of Commerce, Bureau of Economic Analys is ‐ 2014% Real GDP Growth over 2013: U.S. Bureau of Economic Analys is , National Real GDP (mi l l ions of chained 2009 dol lars , http:// www.bea.gov/newsreleases/nat ional/gdp/ gdpnewsrelease.htm. EMBARGOED UNTIL RELEASE AT 8:30 A.M. EST, Nov 24, 2015
6 U.S. Dept. of Labor, Bureau of Labor Stat ist ics ‐ November 2015P Unemployment Rate, Not Seasonal ly Adjusted. Table 1. Civ i l ian labor force and unemployment by state and metropol i tan area. http://www.bls .gov/news.release/metro.t01.htm. As of December 31, 2015.
7 HHS, Off ice of the Assistant Secretary For Planning and Evaluat ion (ASPE), 2015 Plan Select ions by ZIP Code in the Health Insurance Market Place. Published Apri l 2015. Kaiser Family Foundat ion
8 Potentia l enrol lment el ig ible populat ion def ined as people who were uninsured or buying their own insurance before the ACA went into effect , who are not el ig ible for Medicaid or employer coverage, who are not in the coverage gap, and who are cit izens or authorized immigrants.
9 HCA market ZIP codes were mapped to Publ ic Use Microdata Areas (PUMA) uti l ized by Kaiser Family Foundat ion for i ts enrol lment penetrat ion est imates.
10 Kaiser Family Foundat ion. Status of State Action on the Medicaid Expansion Decis ion as December 17, 2015.