hazelnut workers in turkey rev1 - fairlabor.org · child labor is the widespread employment of...
TRANSCRIPT
Improving Workers’ Lives Worldwide
Hazelnut Workers in turkey:Demographic Profiling; Duzce, Ordu, & Sakarya; 2016
Report prepared by the Fair Labor Association (FLA) Pilot Implemented by Development Workshop Cooperative and the FLA
september 2017
www.fairlabor.org 1
Hazelnut Workers in turkey: Demographic Profiling; Duzce, ordu, & sakarya; 2016
table of Contentsexecutive summary ................................................................................................................................................... 2
introduction ............................................................................................................................................................... 4
methodology .............................................................................................................................................................. 4
1. General DemoGrapHiC profile of Workers anD tHeir HouseHolDs .................................... 5
1.1 Gender, age Groups and location Distribution of all individuals in Worker Households ................ 5
1.2 Demographics of Working individuals ..................................................................................................... 6
1.3 subjective Household income assessment .............................................................................................11
2. WorkinG CHilDren anD younG Workers ...........................................................................................11
2.1 Demographics of Working Household members according to age ....................................................11
2.2 Directly surveyed individuals ..................................................................................................................15
3. Comparison of seasonal anD non-seasonal Workers ............................................................19
4. Comparison of eastern (orDu) Vs. Western (DuzCe anD sakarya) reGions .................. 23
4.1 Home City and language ......................................................................................................................... 23
4.2 socio-economic structure of the family ..............................................................................................24
4.3 seasonal migration ................................................................................................................................... 28
4.4 Working and living Conditions ...............................................................................................................31
Funding for this report was provided by the United States Department of Labor. This material does not necessarily reflect the views or policies of the United States Department of Labor, nor does the mention of trade names, commercial products, or organizations imply endorsement by the United States Government.
Photo credits: cover photo by ceyda oner. thanks to Larissa Araz, sarah Faith, and ceyda oner for photos throughout.
www.fairlabor.org 2
Hazelnut Workers in turkey: Demographic Profiling; Duzce, ordu, & sakarya; 2016
the demographic characteristics of workers engaged in hazelnut harvesting
reveal a vulnerable labor force. Moderately more women than men work
during the harvest, which is performed overwhelmingly by youth and young
adults. While literacy has been near-universally achieved among harvest
workers, except for a tiny minority of older workers, educational achievement
is concentrated at the high school level, with high school graduation rates
that are much lower than the national average. Hazelnut harvest workers
overwhelmingly have not received any occupational training outside of school.
When employed, they are generally thrust into the hazelnut harvest without
job training. While it can be argued that unskilled workers without job training
perform satisfactorily in the manual labor tasks required by the hazelnut
harvest, this lack of training could become a concern when certain additional
tasks are performed by the workers that may
be deemed dangerous to their health, such
as those involving the use of chemicals and
pesticides.
Two distinct groups of workers emerge clearly
in the comparison between the Western
Duzce-Sakarya region and the Eastern
Ordu region. The western region employs
exclusively migrant seasonal workers, while
the eastern region overwhelmingly employs
local non-seasonal workers as well as a
small number of migrant seasonal workers.
The seasonal workers involved in hazelnut
harvesting are drawn predominantly from
the Kurdish-speaking urban centers in the
southeast of Turkey, while non-seasonal
workers are from the local rural surroundings
of Ordu and are Turkish-speaking. The
seasonal workers from these urban centers
do not own land, work exclusively on
the hazelnut harvest and are part of the
urban poor, whereas non-seasonal workers
overwhelmingly own land, work on harvesting
multiple crops and are either part of the rural
poor or are small rural land owners.
In general, non-seasonal hazelnut harvesting
workers have a slightly to moderately better
life and working conditions than the seasonal
executive summary
www.fairlabor.org 3
Hazelnut Workers in turkey: Demographic Profiling; Duzce, ordu, & sakarya; 2016
workers, including slightly better wages
and slightly shorter hours. Non-seasonal
workers also naturally do not face the
long-distance transportation costs
from their hometowns to the harvest
zones and have better accommodation
conditions, especially compared to the
cramped temporary living spaces of
seasonal workers, which in some cases
present safety or health hazards. The
living conditions of the small group of
seasonal workers in the eastern region
are usually even lower than their western
region seasonal counterparts. Seasonal
workers almost universally only perform
the primary task of collecting hazelnuts,
whereas non-seasonal workers take on
the additional specialized tasks.
The most striking problem with respect
to the working conditions of hazelnut
harvest workers is extremely long
working days coupled with seven-
day weeks without a day of rest. This
excessive overwork without proper
compensation is universal, and affects
children and young workers who are
basically treated as adults. In fact, this
research suggested that children and young workers work for even longer
hours than adult workers. The other major violation of regulations against
child labor is the widespread employment of children as migrant seasonal
workers. Possible handling of dangerous chemicals, and health risks posed by
manually carrying heavy loads of harvested hazelnut bags are also a concern
for children.
While we can not speak of a structured regime of forced labor, elements of
forced labor practices are present in hazelnut harvesting, such as daily wages being
paid as a lump sum at the end of harvest season rather than periodically — in
some cases after seasonal workers return to their hometowns. Related to this
phenomenon is the prevalence of a labor intermediary system that burdens the
workers with the requirement to pay commissions. Furthermore, there are no
written contracts, and multiple individuals from the same locations or families
are often dependent on the same employers, which makes them collectively
vulnerable to pressure and actions from these employers.
www.fairlabor.org 4
Hazelnut Workers in turkey: Demographic Profiling; Duzce, ordu, & sakarya; 2016
iNtroductioN
methodology
this report presents a detailed overview of individuals involved in the hazelnut
harvest and their households, through descriptive and comparative statistics
identifying the difference between local and seasonal-migrant workers, with
a special focus on child labor and/or forced labor. These findings improve
our understanding of the labor force involved in the hazelnut harvest and will
aid project partners in targeted interventions that provide solutions to the
problems of workers.
This research was designed with the purpose of developing a general profile
of workers in hazelnut harvesting, more specifically of those working in the
orchards providing hazelnuts for Nestlé and its two main first-tier suppliers,
Balsu and Olam Progıda. The orchards were selected randomly from within
the supply chain of these companies in villages within the scope of the USDOL
project “Partnership to Reduce Child Labor and Forced Labor in Imported
Agricultural Products: Piloting the USDA Guidelines in the Hazelnut Supply
Chain in Turkey.”
fla researchers administered a questionnaire comprising individual-level and
household-level questions in order to assess household structure, income,
poverty, working conditions and access to welfare services. At the individual
level, researchers asked questions on gender, age, marital status, literacy, and
educational and occupational status. At the household level, questions dealt
with place of origin, migration background and motives, property ownership,
access to social security and social aid, housing, indebtedness and sources of
income.
A total of 95 interviews were conducted face-to-face in the orchards with
workers employed in the hazelnut harvest. These covered 56 orchards that
form the base of the supply chain linking FLA-affiliated first-tier suppliers
Balsu and Olam to FLA affiliate Nestlé in Turkey. The surveys yielded
information on 702 individuals belonging to the worker households. The field
research took place in August 2016 in three provinces in the Black Sea region
of Turkey, with Duzce and Sakarya grouped together as the Western Region,
and Ordu representing the Eastern Region. Of 702 individuals, 574 were from
the Western region while 128 were from the Eastern region.
Hazelnut Workers in turkey: Demographic Profiling; Duzce, ordu, & sakarya; 2016
www.fairlabor.org 5
1. General DemoGrapHiC profile of Workers anD tHeir HouseHolDs
1.1 Gender, age Groups and location Distribution of all individuals in Worker Households
Graph 1: Gender distribution of worker households
Graph 2: AGe distribution in surveyed households
42.2%
56.7%
1.1%
Male Female Not Reported
Not Reported0 – 6 6 – 11 11 – 15 15 – 18 18 – 25 25 – 35 35 – 45 45 – 55 55 – 65 65+
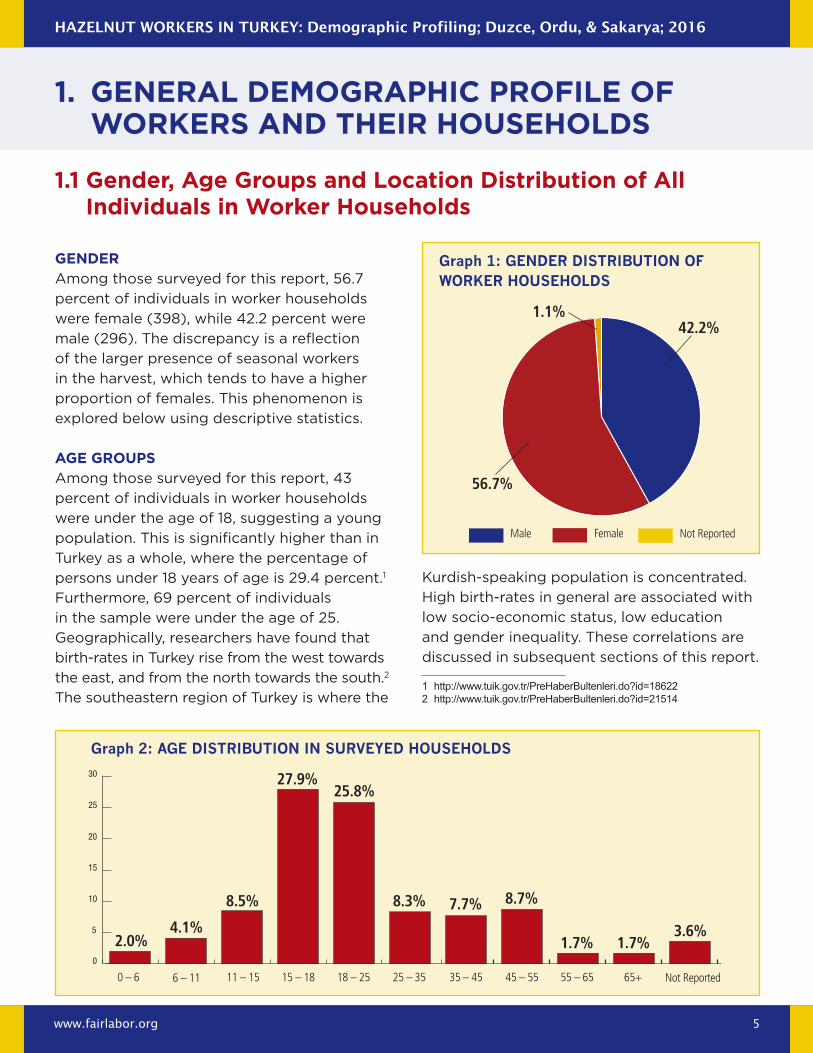
GenDerAmong those surveyed for this report, 56.7
percent of individuals in worker households
were female (398), while 42.2 percent were
male (296). The discrepancy is a reflection
of the larger presence of seasonal workers
in the harvest, which tends to have a higher
proportion of females. This phenomenon is
explored below using descriptive statistics.
aGe GroupsAmong those surveyed for this report, 43
percent of individuals in worker households
were under the age of 18, suggesting a young
population. This is significantly higher than in
Turkey as a whole, where the percentage of
persons under 18 years of age is 29.4 percent.1
Furthermore, 69 percent of individuals
in the sample were under the age of 25.
Geographically, researchers have found that
birth-rates in Turkey rise from the west towards
the east, and from the north towards the south.2
The southeastern region of Turkey is where the
Kurdish-speaking population is concentrated.
High birth-rates in general are associated with
low socio-economic status, low education
and gender inequality. These correlations are
discussed in subsequent sections of this report.
0
5
10
15
20
25
30
2.0%4.1%
8.5%
27.9%25.8%
8.3% 7.7% 8.7%
1.7% 1.7%3.6%
1 http://www.tuik.gov.tr/PreHaberBultenleri.do?id=186222 http://www.tuik.gov.tr/PreHaberBultenleri.do?id=21514
Hazelnut Workers in turkey: Demographic Profiling; Duzce, ordu, & sakarya; 2016
www.fairlabor.org 6
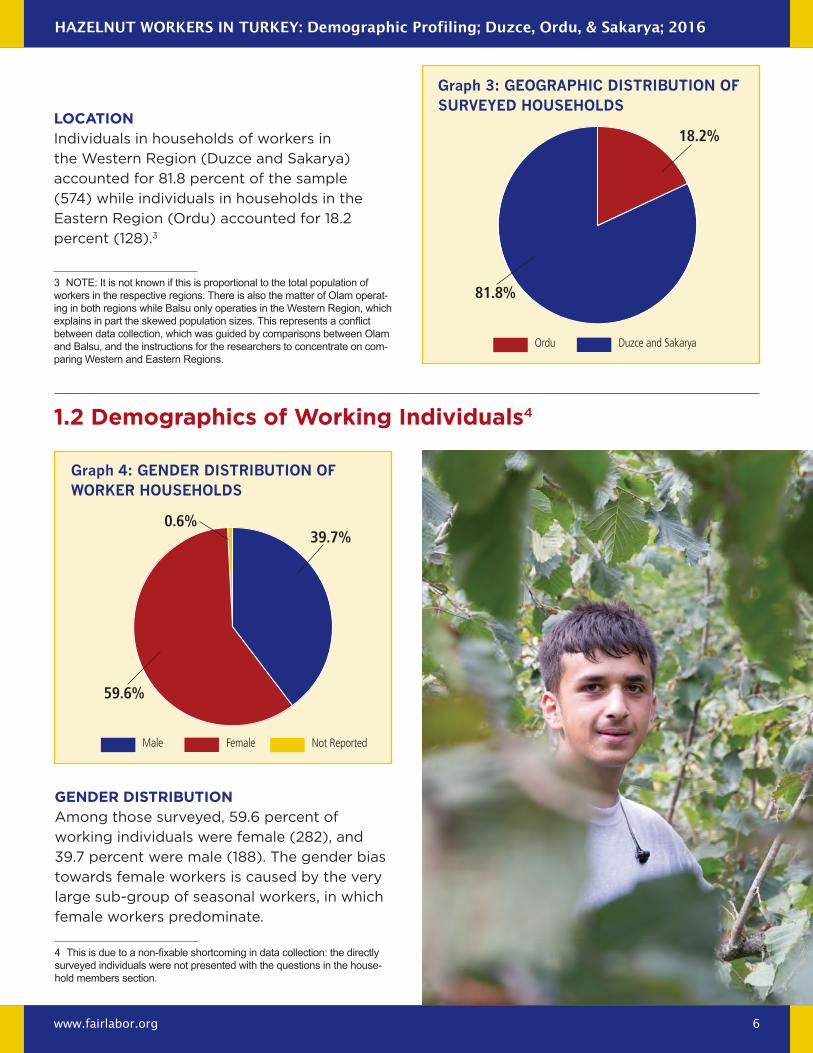
loCationIndividuals in households of workers in
the Western Region (Duzce and Sakarya)
accounted for 81.8 percent of the sample
(574) while individuals in households in the
Eastern Region (Ordu) accounted for 18.2
percent (128).3
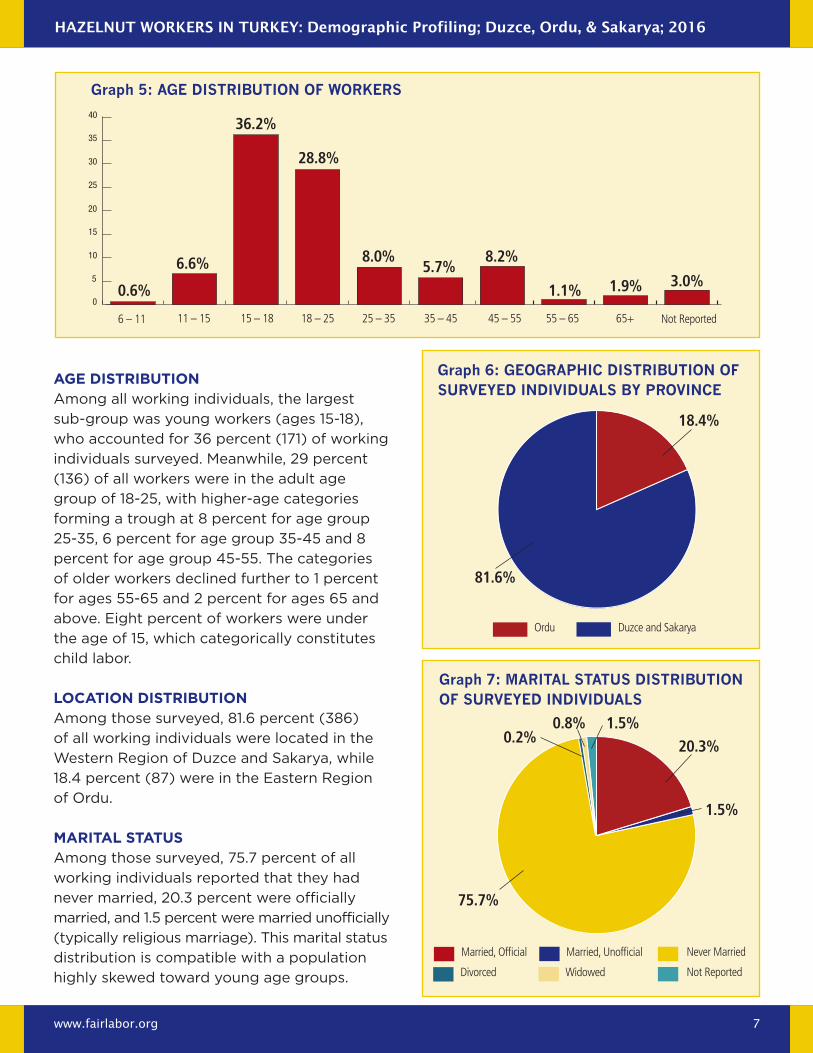
GenDer DistributionAmong those surveyed, 59.6 percent of
working individuals were female (282), and
39.7 percent were male (188). The gender bias
towards female workers is caused by the very
large sub-group of seasonal workers, in which
female workers predominate.
3 NOTE: It is not known if this is proportional to the total population of workers in the respective regions. There is also the matter of Olam operat-ing in both regions while Balsu only operaties in the Western Region, which explains in part the skewed population sizes. This represents a conflict between data collection, which was guided by comparisons between Olam and Balsu, and the instructions for the researchers to concentrate on com-paring Western and Eastern Regions.
Graph 3: GeoGrAphic distribution of surveyed households
18.2%
81.8%
Ordu Duzce and Sakarya
1.2 Demographics of Working individuals4
Graph 4: Gender distribution of worker households
39.7%
59.6%
0.6%
Male Female Not Reported
4 This is due to a non-fixable shortcoming in data collection: the directly surveyed individuals were not presented with the questions in the house-hold members section.
Hazelnut Workers in turkey: Demographic Profiling; Duzce, ordu, & sakarya; 2016
www.fairlabor.org 7
aGe DistributionAmong all working individuals, the largest
sub-group was young workers (ages 15-18),
who accounted for 36 percent (171) of working
individuals surveyed. Meanwhile, 29 percent
(136) of all workers were in the adult age
group of 18-25, with higher-age categories
forming a trough at 8 percent for age group
25-35, 6 percent for age group 35-45 and 8
percent for age group 45-55. The categories
of older workers declined further to 1 percent
for ages 55-65 and 2 percent for ages 65 and
above. Eight percent of workers were under
the age of 15, which categorically constitutes
child labor.
loCation DistributionAmong those surveyed, 81.6 percent (386)
of all working individuals were located in the
Western Region of Duzce and Sakarya, while
18.4 percent (87) were in the Eastern Region
of Ordu.
marital statusAmong those surveyed, 75.7 percent of all
working individuals reported that they had
never married, 20.3 percent were officially
married, and 1.5 percent were married unofficially
(typically religious marriage). This marital status
distribution is compatible with a population
highly skewed toward young age groups.
Graph 5: AGe distribution of workers
Not Reported6 – 11 11 – 15 15 – 18 18 – 25 25 – 35 35 – 45 45 – 55 55 – 65 65+
0
5
10
15
20
25
30
35
40
0.6%
6.6%
36.2%
28.8%
8.0%5.7%
8.2%
1.1% 1.9% 3.0%
Graph 6: GeoGrAphic distribution of surveyed individuAls by province
18.4%
81.6%
Ordu Duzce and Sakarya
Graph 7: MAritAl stAtus distribution of surveyed individuAls
20.3%
1.5%
75.7%
0.2%0.8% 1.5%
Married, Official
Divorced
Married, Unofficial
Widowed
Never Married
Not Reported
Hazelnut Workers in turkey: Demographic Profiling; Duzce, ordu, & sakarya; 2016
www.fairlabor.org 8
5 http://www.tuik.gov.tr/PreHaberBultenleri.do?id=21519
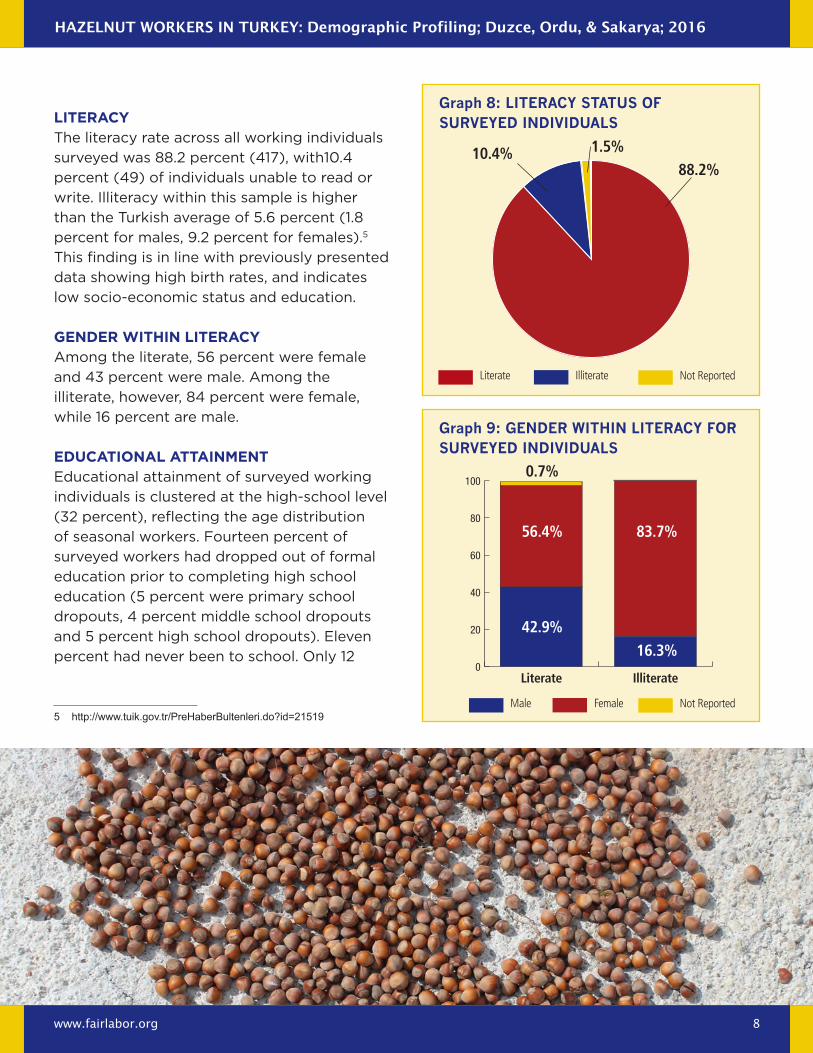
literaCyThe literacy rate across all working individuals
surveyed was 88.2 percent (417), with10.4
percent (49) of individuals unable to read or
write. Illiteracy within this sample is higher
than the Turkish average of 5.6 percent (1.8
percent for males, 9.2 percent for females).5
This finding is in line with previously presented
data showing high birth rates, and indicates
low socio-economic status and education.
GenDer WitHin literaCyAmong the literate, 56 percent were female
and 43 percent were male. Among the
illiterate, however, 84 percent were female,
while 16 percent are male.
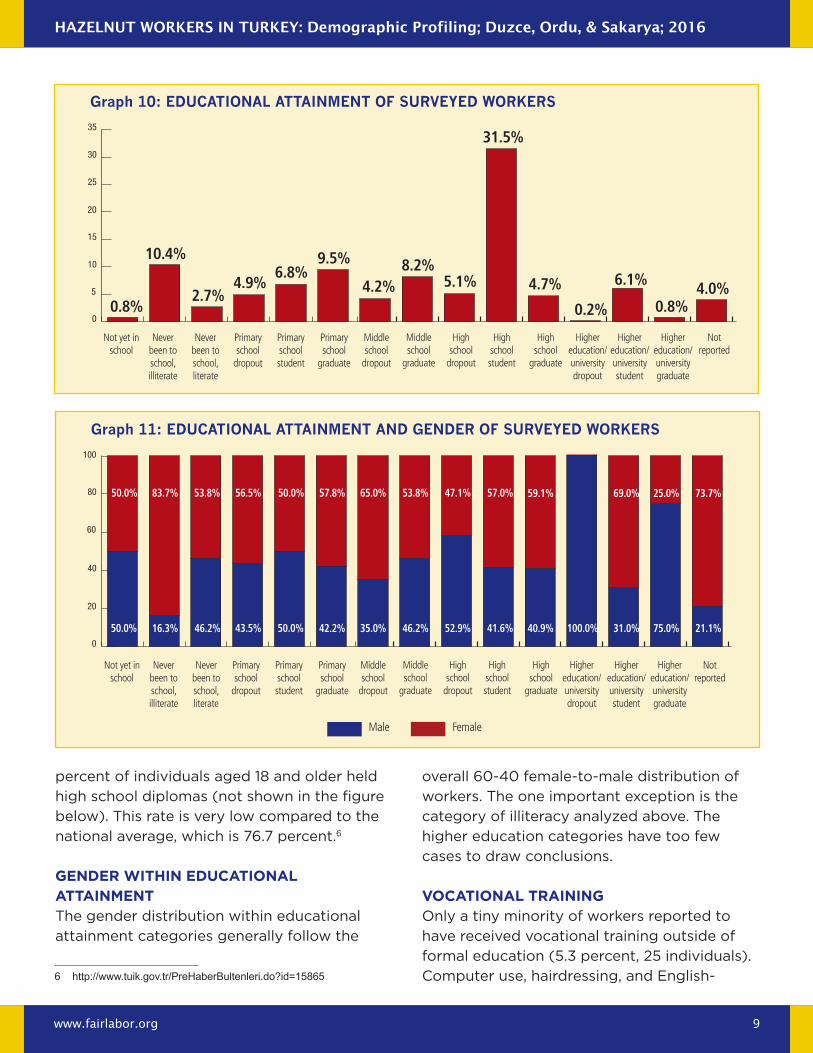
eDuCational attainmentEducational attainment of surveyed working
individuals is clustered at the high-school level
(32 percent), reflecting the age distribution
of seasonal workers. Fourteen percent of
surveyed workers had dropped out of formal
education prior to completing high school
education (5 percent were primary school
dropouts, 4 percent middle school dropouts
and 5 percent high school dropouts). Eleven
percent had never been to school. Only 12
Graph 8: literAcy stAtus of surveyed individuAls
88.2%10.4% 1.5%
Literate Illiterate Not Reported
Graph 9: Gender within literAcy for surveyed individuAls
0
20
40
60
80
100
Literate Illiterate
42.9%16.3%
56.4% 83.7%
0.7%
Male Female Not Reported
Hazelnut Workers in turkey: Demographic Profiling; Duzce, ordu, & sakarya; 2016
www.fairlabor.org 9
percent of individuals aged 18 and older held
high school diplomas (not shown in the figure
below). This rate is very low compared to the
national average, which is 76.7 percent.6
GenDer WitHin eDuCational attainmentThe gender distribution within educational
attainment categories generally follow the
overall 60-40 female-to-male distribution of
workers. The one important exception is the
category of illiteracy analyzed above. The
higher education categories have too few
cases to draw conclusions.
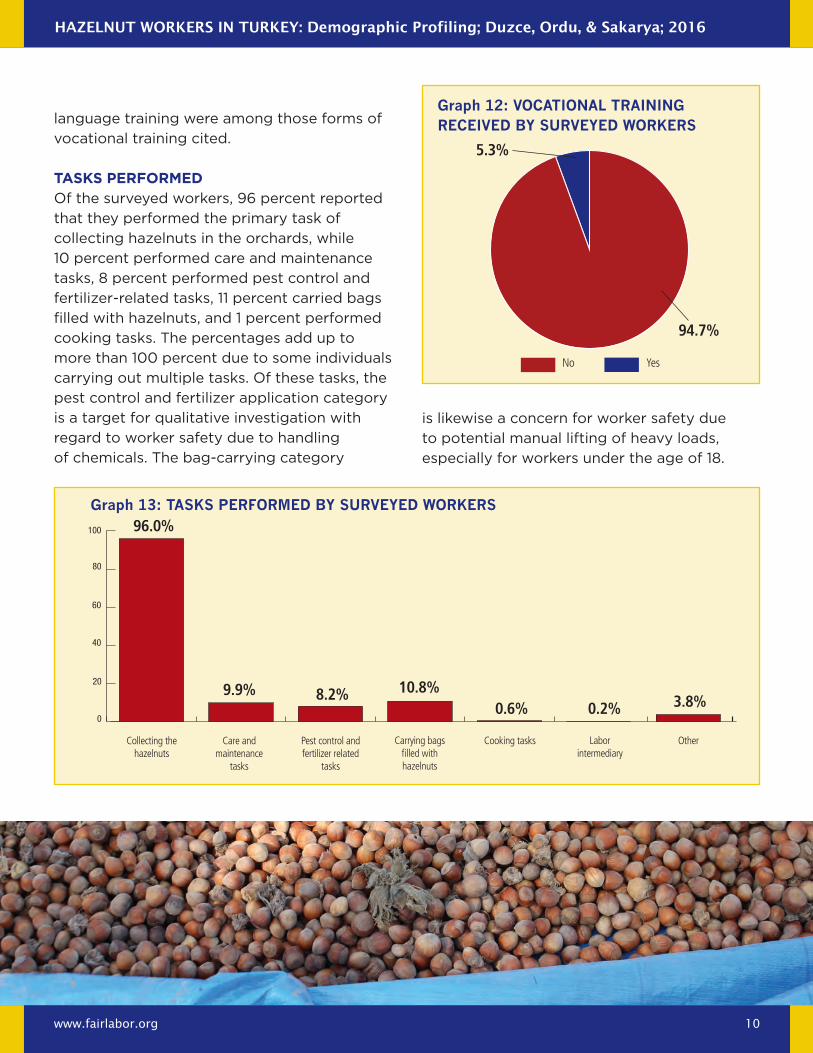
VoCational traininGOnly a tiny minority of workers reported to
have received vocational training outside of
formal education (5.3 percent, 25 individuals).
Computer use, hairdressing, and English-
Graph 10: educAtionAl AttAinMent of surveyed workers
Graph 11: educAtionAl AttAinMent And Gender of surveyed workers
Not reported
Not reported
Not yet in school
Not yet in school
Never been to school, illiterate
Never been to school, illiterate
Never been to school, literate
Never been to school, literate
Primary school
dropout
Primary school
dropout
Primary school student
Primary school student
Primary school
graduate
Primary school
graduate
Middle school
dropout
Middle school
dropout
Middle school
graduate
Middle school
graduate
High school
dropout
High school
dropout
High school student
High school student
High school
graduate
High school
graduate
Higher education/university dropout
Higher education/university dropout
Higher education/university student
Higher education/university student
Higher education/university graduate
Higher education/university graduate
0
5
10
15
20
25
30
35
0
20
40
60
80
100
0.8%
50.0% 50.0% 57.8% 65.0% 53.8% 47.1% 57.0% 59.1% 69.0% 25.0% 73.7%83.7% 53.8% 56.5%
50.0% 50.0% 42.2% 35.0% 46.2% 52.9% 41.6% 40.9% 31.0% 75.0% 21.1%16.3% 46.2% 43.5% 100.0%
10.4%
31.5%
2.7%4.9%
6.8%9.5%
4.2%8.2%
5.1% 4.7% 6.1%
0.2% 0.8%4.0%
6 http://www.tuik.gov.tr/PreHaberBultenleri.do?id=15865
Male Female
Hazelnut Workers in turkey: Demographic Profiling; Duzce, ordu, & sakarya; 2016
www.fairlabor.org 10
Graph 12: vocAtionAl trAininG received by surveyed workers
94.7%
5.3%
No Yes
language training were among those forms of
vocational training cited.
tasks performeDOf the surveyed workers, 96 percent reported
that they performed the primary task of
collecting hazelnuts in the orchards, while
10 percent performed care and maintenance
tasks, 8 percent performed pest control and
fertilizer-related tasks, 11 percent carried bags
filled with hazelnuts, and 1 percent performed
cooking tasks. The percentages add up to
more than 100 percent due to some individuals
carrying out multiple tasks. Of these tasks, the
pest control and fertilizer application category
is a target for qualitative investigation with
regard to worker safety due to handling
of chemicals. The bag-carrying category
is likewise a concern for worker safety due
to potential manual lifting of heavy loads,
especially for workers under the age of 18.
Graph 13: tAsks perforMed by surveyed workers
OtherCollecting the hazelnuts
Care and maintenance
tasks
Pest control andfertilizer related
tasks
Carrying bags filled with hazelnuts
Cooking tasks Labor intermediary
0
20
40
60
80
100 96.0%
9.9% 8.2% 10.8%0.6% 0.2% 3.8%
Hazelnut Workers in turkey: Demographic Profiling; Duzce, ordu, & sakarya; 2016
www.fairlabor.org 11
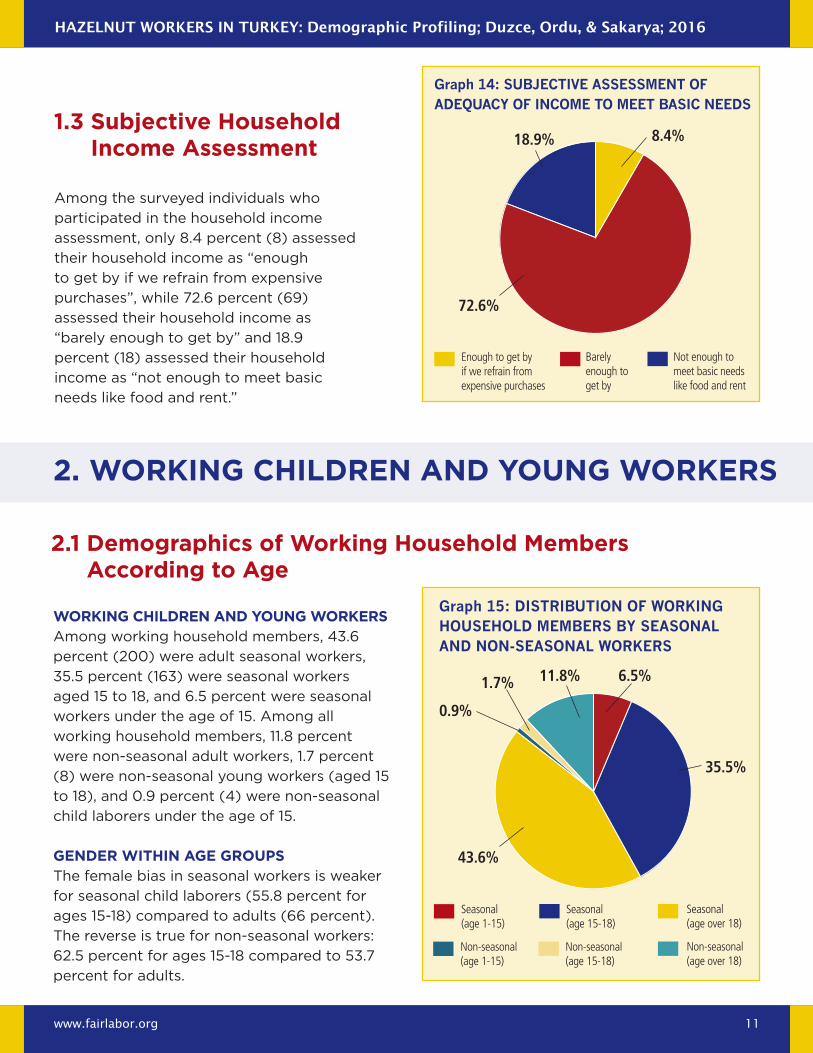
Working Children and Young WorkersAmong working household members, 43.6
percent (200) were adult seasonal workers,
35.5 percent (163) were seasonal workers
aged 15 to 18, and 6.5 percent were seasonal
workers under the age of 15. Among all
working household members, 11.8 percent
were non-seasonal adult workers, 1.7 percent
(8) were non-seasonal young workers (aged 15
to 18), and 0.9 percent (4) were non-seasonal
child laborers under the age of 15.
gender Within age groupsThe female bias in seasonal workers is weaker
for seasonal child laborers (55.8 percent for
ages 15-18) compared to adults (66 percent).
The reverse is true for non-seasonal workers:
62.5 percent for ages 15-18 compared to 53.7
percent for adults.
Among the surveyed individuals who
participated in the household income
assessment, only 8.4 percent (8) assessed
their household income as “enough
to get by if we refrain from expensive
purchases”, while 72.6 percent (69)
assessed their household income as
“barely enough to get by” and 18.9
percent (18) assessed their household
income as “not enough to meet basic
needs like food and rent.”
1.3 subjective household income assessment
Graph 14: Subjective aSSeSSment of adequacy of income to meet baSic needS
8.4%
72.6%
18.9%
Not enough to meet basic needs like food and rent
Barely enough to get by
Enough to get by if we refrain from expensive purchases
2. Working Children and Young Workers
2.1 demographics of Working household Members according to age
Graph 15: diStribution of workinG houSehold memberS by SeaSonal and non-SeaSonal workerS
6.5%
35.5%
43.6%
0.9%
1.7% 11.8%
Seasonal (age 1-15)
Non-seasonal (age 1-15)
Seasonal (age 15-18)
Non-seasonal (age 15-18)
Seasonal (age over 18)
Non-seasonal (age over 18)

Hazelnut Workers in turkey: Demographic Profiling; Duzce, ordu, & sakarya; 2016
www.fairlabor.org 12
Graph 16: Gender within AGe Groups
Graph 17: literAcy within AGe Groups
Seasonal (age 1-15)
Seasonal (age 1-15)
Seasonal (age 15-18)
Seasonal (age 15-18)
Seasonal (age over 18)
Seasonal (age over 18)
Non-seasonal (age 1-15)
Non-seasonal (age 1-15)
Non-seasonal (age 15-18)
Non-seasonal (age 15-18)
Non-seasonal (age over 18)
Non-seasonal (age over 18)
0
20
40
60
80
100
0
20
40
60
80
100
43.3% 25.0%
75.0%
100.0% 100.0%
37.5%
55.8% 62.5%66.0%
20.0%
53.7%
14.8%
46.3%
85.2%
56.7%
56.7%
42.9%
42.9%
33.5%
80.0%
1.2%
0.6%3.3%
0.5%
Male
Literate
Female
Illiterate
Not Reported
Not Reported
CiVil statusTwo respondents between the ages of 15 and
18 were reported as married. One of these
reported to be officially married and the other
unofficially married.
literaCy WitHin aGe GroupsPractically no illiteracy was reported in
working household member children and
youth. There seems to have been significant
progress in Turkey on this count when
contrasted with the 15 percent (8) illiteracy
rate among non-seasonal working adult
household members and the 20 percent (40)
illiteracy rate among seasonal working adult
household members.
Hazelnut Workers in turkey: Demographic Profiling; Duzce, ordu, & sakarya; 2016
www.fairlabor.org 13
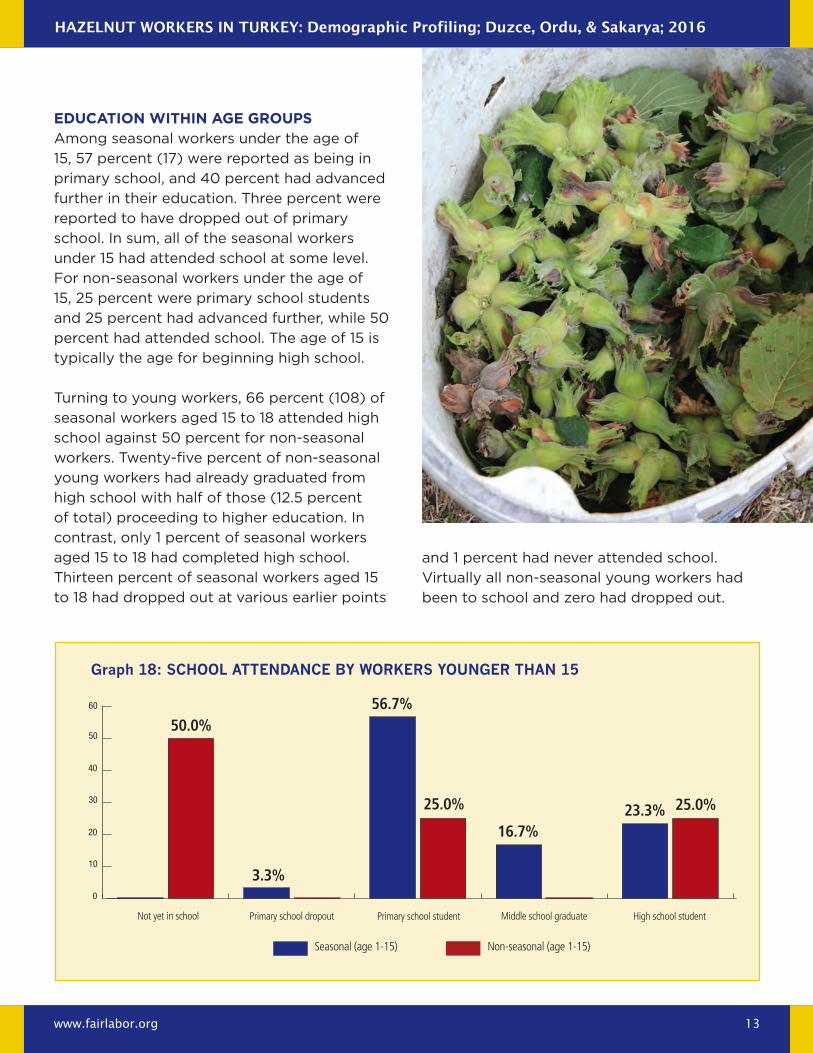
eDuCation WitHin aGe GroupsAmong seasonal workers under the age of
15, 57 percent (17) were reported as being in
primary school, and 40 percent had advanced
further in their education. Three percent were
reported to have dropped out of primary
school. In sum, all of the seasonal workers
under 15 had attended school at some level.
For non-seasonal workers under the age of
15, 25 percent were primary school students
and 25 percent had advanced further, while 50
percent had attended school. The age of 15 is
typically the age for beginning high school.
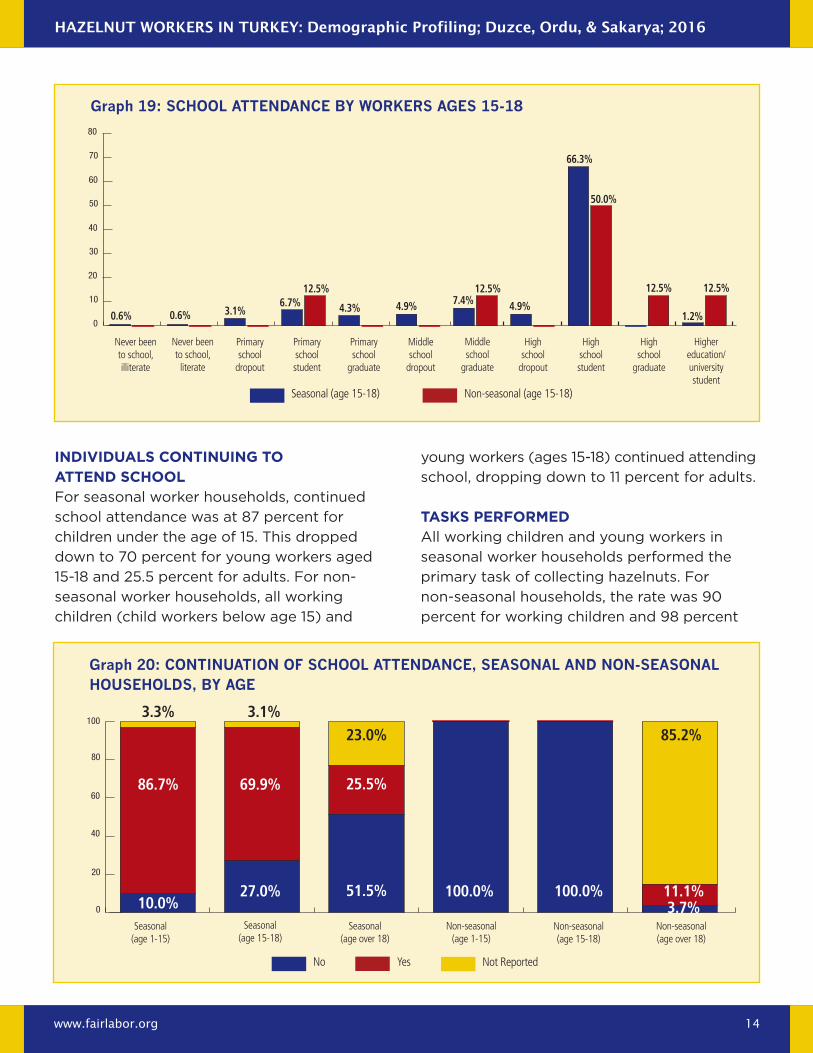
Turning to young workers, 66 percent (108) of
seasonal workers aged 15 to 18 attended high
school against 50 percent for non-seasonal
workers. Twenty-five percent of non-seasonal
young workers had already graduated from
high school with half of those (12.5 percent
of total) proceeding to higher education. In
contrast, only 1 percent of seasonal workers
aged 15 to 18 had completed high school.
Thirteen percent of seasonal workers aged 15
to 18 had dropped out at various earlier points
Graph 18: school AttendAnce by workers younGer thAn 15
Not yet in school Primary school dropout Primary school student Middle school graduate High school student
0
10
20
30
40
50
60
3.3%
56.7%
25.0% 25.0%
16.7%23.3%
50.0%
Seasonal (age 1-15) Non-seasonal (age 1-15)
and 1 percent had never attended school.
Virtually all non-seasonal young workers had
been to school and zero had dropped out.
Hazelnut Workers in turkey: Demographic Profiling; Duzce, ordu, & sakarya; 2016
www.fairlabor.org 14
Graph 19: school AttendAnce by workers AGes 15-18
Never been to school, illiterate
Never been to school, literate
Primary school
dropout
Primary school student
Primary school
graduate
Middle school
dropout
Middle school
graduate
High school
dropout
High school student
High school
graduate
Higher education/university student
0
10
20
30
40
50
60
70
80
0.6% 0.6% 3.1%6.7%
12.5% 12.5%
4.9%
66.3%
50.0%
12.5% 12.5%
1.2%4.3% 4.9% 7.4%
Seasonal (age 15-18) Non-seasonal (age 15-18)
inDiViDuals ContinuinG to attenD sCHoolFor seasonal worker households, continued
school attendance was at 87 percent for
children under the age of 15. This dropped
down to 70 percent for young workers aged
15-18 and 25.5 percent for adults. For non-
seasonal worker households, all working
children (child workers below age 15) and
young workers (ages 15-18) continued attending
school, dropping down to 11 percent for adults.
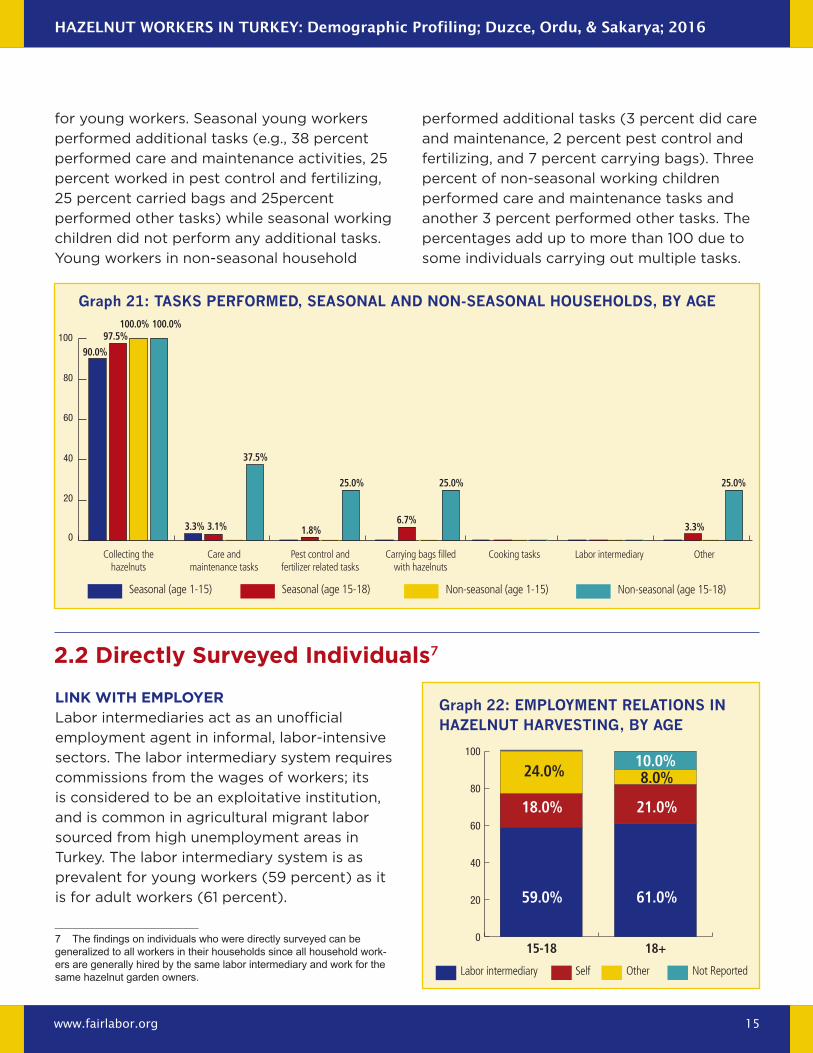
tasks performeDAll working children and young workers in
seasonal worker households performed the
primary task of collecting hazelnuts. For
non-seasonal households, the rate was 90
percent for working children and 98 percent
Graph 20: continuAtion of school AttendAnce, seAsonAl And non-seAsonAl households, by AGe
Seasonal (age 1-15)
Seasonal (age 15-18)
Seasonal (age over 18)
Non-seasonal (age 1-15)
Non-seasonal (age 15-18)
Non-seasonal (age over 18)
0
20
40
60
80
100
100.0% 100.0%
23.0% 85.2%
3.7%11.1%
10.0%
86.7% 69.9% 25.5%
27.0% 51.5%
3.1%3.3%
No Yes Not Reported
Hazelnut Workers in turkey: Demographic Profiling; Duzce, ordu, & sakarya; 2016
www.fairlabor.org 15
for young workers. Seasonal young workers
performed additional tasks (e.g., 38 percent
performed care and maintenance activities, 25
percent worked in pest control and fertilizing,
25 percent carried bags and 25percent
performed other tasks) while seasonal working
children did not perform any additional tasks.
Young workers in non-seasonal household
performed additional tasks (3 percent did care
and maintenance, 2 percent pest control and
fertilizing, and 7 percent carrying bags). Three
percent of non-seasonal working children
performed care and maintenance tasks and
another 3 percent performed other tasks. The
percentages add up to more than 100 due to
some individuals carrying out multiple tasks.
link WitH employerLabor intermediaries act as an unofficial
employment agent in informal, labor-intensive
sectors. The labor intermediary system requires
commissions from the wages of workers; its
is considered to be an exploitative institution,
and is common in agricultural migrant labor
sourced from high unemployment areas in
Turkey. The labor intermediary system is as
prevalent for young workers (59 percent) as it
is for adult workers (61 percent).
7 The findings on individuals who were directly surveyed can be generalized to all workers in their households since all household work-ers are generally hired by the same labor intermediary and work for the same hazelnut garden owners.
Graph 21: tAsks perforMed, seAsonAl And non-seAsonAl households, by AGe
OtherCollecting the hazelnuts
Care and maintenance tasks
Pest control andfertilizer related tasks
Carrying bags filled with hazelnuts
Cooking tasks Labor intermediary
0
20
40
60
80
100
90.0%
3.3% 3.3%3.1% 1.8%6.7%
37.5%
25.0% 25.0% 25.0%
97.5%100.0% 100.0%
Seasonal (age 1-15) Seasonal (age 15-18) Non-seasonal (age 1-15) Non-seasonal (age 15-18)
2.2 Directly surveyed individuals7
Graph 22: eMployMent relAtions in hAzelnut hArvestinG, by AGe
0
20
40
60
80
100
15-18 18+
59.0% 61.0%
18.0% 21.0%
24.0% 8.0%10.0%
Labor intermediary Self Other Not Reported
Hazelnut Workers in turkey: Demographic Profiling; Duzce, ordu, & sakarya; 2016
www.fairlabor.org 16
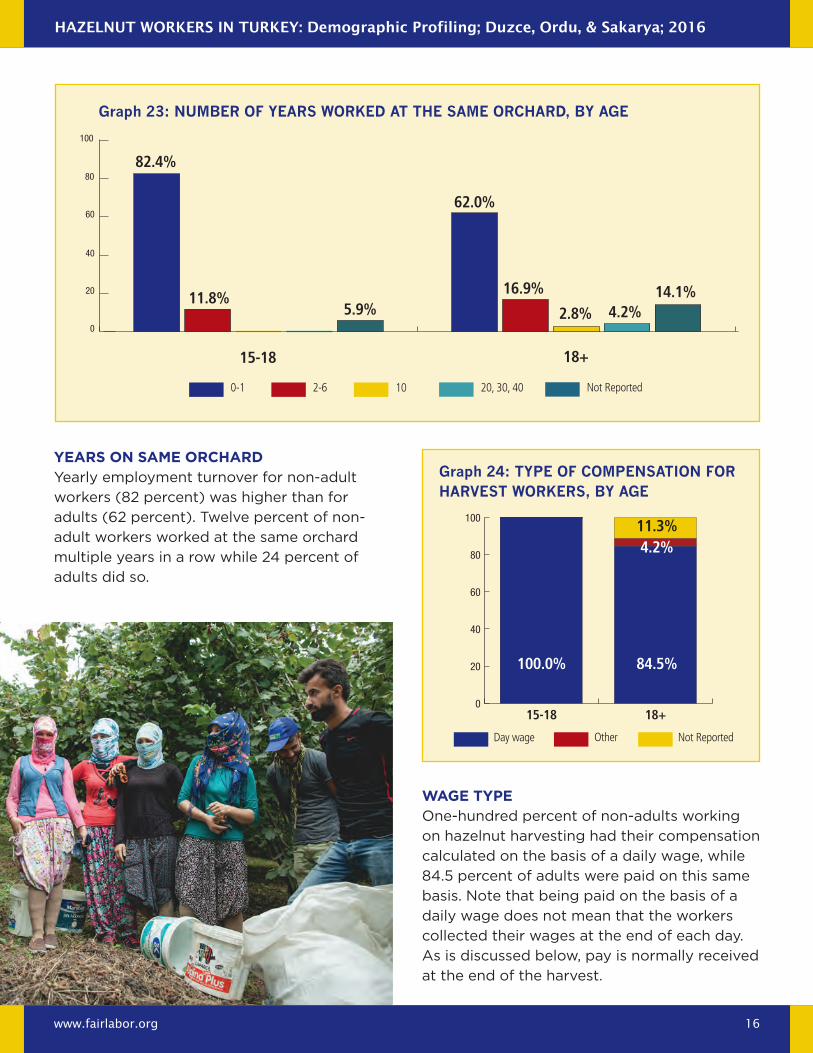
years on same orCHarDYearly employment turnover for non-adult
workers (82 percent) was higher than for
adults (62 percent). Twelve percent of non-
adult workers worked at the same orchard
multiple years in a row while 24 percent of
adults did so.
Graph 23: nuMber of yeArs worked At the sAMe orchArd, by AGe
15-18 18+
0
20
40
60
80
100
0-1 2-6 10 20, 30, 40 Not Reported
Graph 24: type of coMpensAtion for hArvest workers, by AGe
0
20
40
60
80
100
15-18 18+
100.0% 84.5%
4.2%
82.4%
11.8%5.9%
62.0%
16.9%
2.8% 4.2%14.1%
11.3%
Day wage Other Not Reported
WaGe typeOne-hundred percent of non-adults working
on hazelnut harvesting had their compensation
calculated on the basis of a daily wage, while
84.5 percent of adults were paid on this same
basis. Note that being paid on the basis of a
daily wage does not mean that the workers
collected their wages at the end of each day.
As is discussed below, pay is normally received
at the end of the harvest.
Hazelnut Workers in turkey: Demographic Profiling; Duzce, ordu, & sakarya; 2016
www.fairlabor.org 17
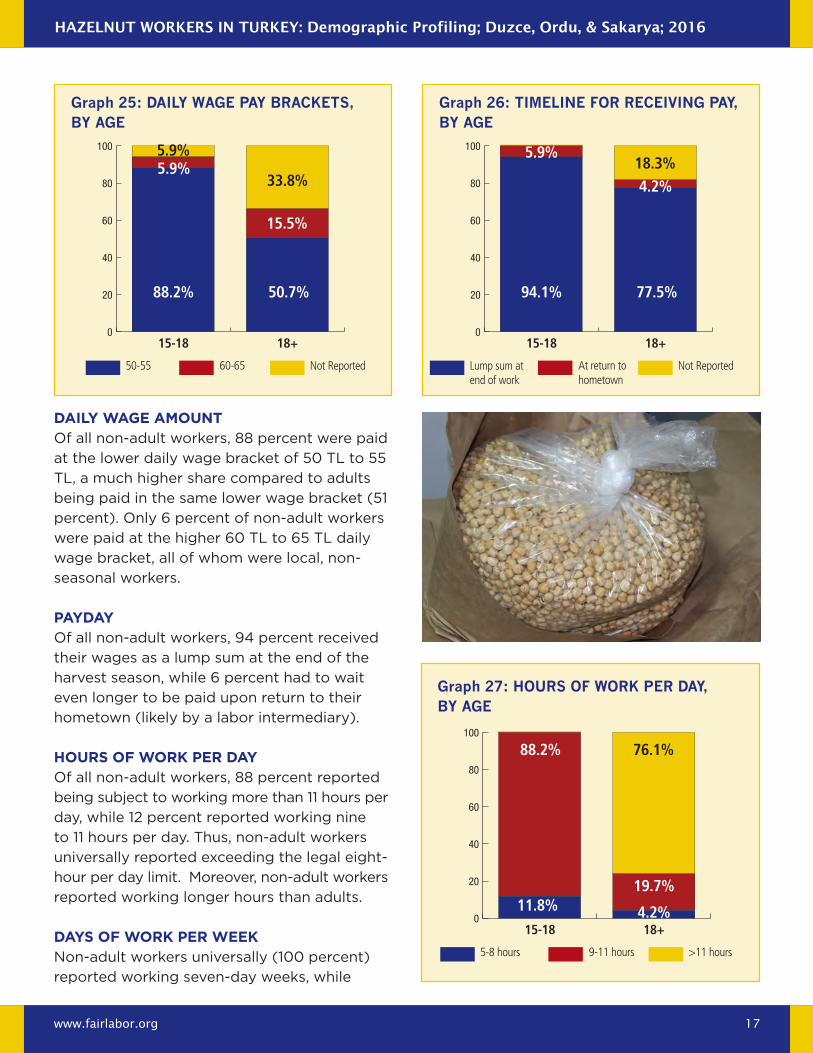
Daily WaGe amountOf all non-adult workers, 88 percent were paid
at the lower daily wage bracket of 50 TL to 55
TL, a much higher share compared to adults
being paid in the same lower wage bracket (51
percent). Only 6 percent of non-adult workers
were paid at the higher 60 TL to 65 TL daily
wage bracket, all of whom were local, non-
seasonal workers.
payDayOf all non-adult workers, 94 percent received
their wages as a lump sum at the end of the
harvest season, while 6 percent had to wait
even longer to be paid upon return to their
hometown (likely by a labor intermediary).
Hours of Work per DayOf all non-adult workers, 88 percent reported
being subject to working more than 11 hours per
day, while 12 percent reported working nine
to 11 hours per day. Thus, non-adult workers
universally reported exceeding the legal eight-
hour per day limit. Moreover, non-adult workers
reported working longer hours than adults.
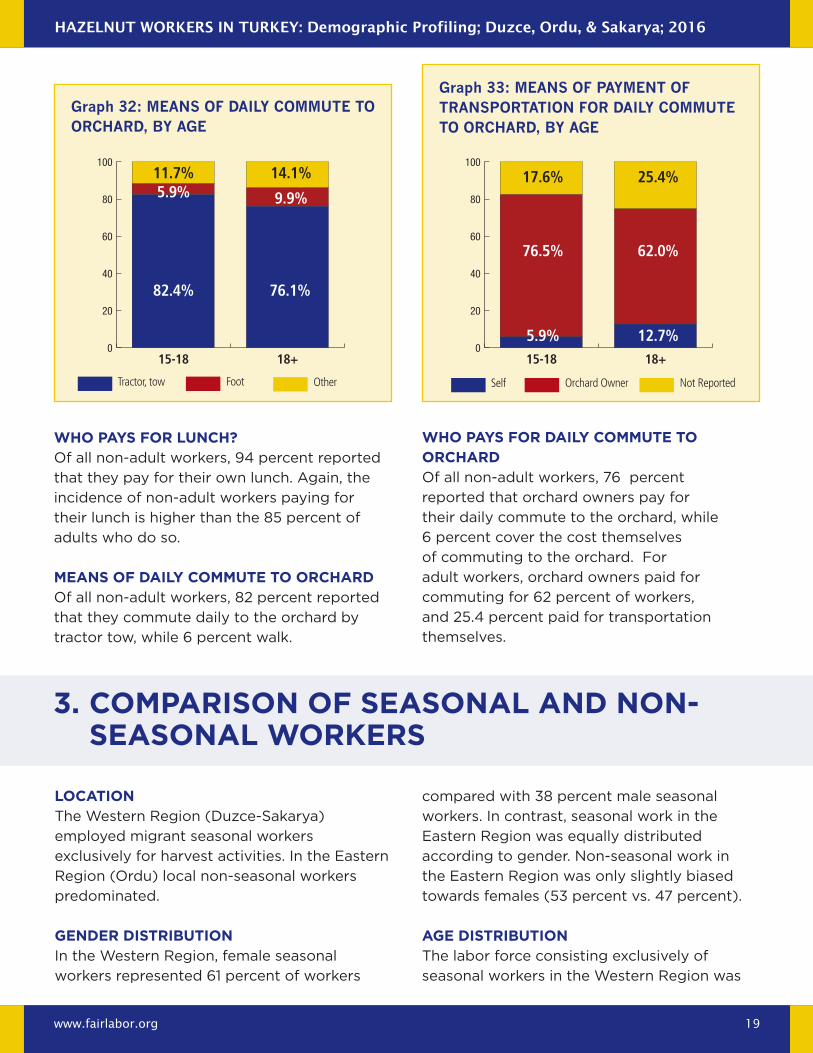
Days of Work per WeekNon-adult workers universally (100 percent)
reported working seven-day weeks, while
Graph 25: dAily wAGe pAy brAckets, by AGe
Graph 26: tiMeline for receivinG pAy, by AGe
Graph 27: hours of work per dAy, by AGe
0
20
40
60
80
100
0
20
40
60
80
100
0
20
40
60
80
100
15-18 15-18
15-18
18+ 18+
18+
88.2% 94.1%50.7% 77.5%
4.2%11.8%
15.5%
4.2%
19.7%
5.9%5.9%
88.2%
33.8%18.3%
76.1%
5.9%
50-55 Lump sum at end of work
5-8 hours
60-65 At return to hometown
9-11 hours
Not Reported Not Reported
>11 hours
Hazelnut Workers in turkey: Demographic Profiling; Duzce, ordu, & sakarya; 2016
www.fairlabor.org 18
Graph 28: dAys of work per week, by AGe
Graph 29: nuMber of breAks per dAy, by AGe
Graph 30: provider of lunch MeAl, by AGe
Graph 31: responsible for pAyinG for lunch, by AGe
0
20
40
60
80
100
0
20
40
60
80
100
0
20
40
60
80
100
0
20
40
60
80
100
15-18 15-18
15-18 15-18
18+ 18+
18+ 18+
1.4% 5.9%
94.1% 94.1%
2.8%
56.3%
15.5% 14.1%
1.4%
42.3%
84.5% 84.5%
82.4%
5.9% 5.9%
100.0% 11.8%95.8%
1.4%
0-2 days 1-2 times
Self Self
5-6 days 3-4 times
Field Owner Field Owner Not Reported
7 days >5 times
because non-adults worked longer working
longer hours than adults). Lunch breaks were
universally taken by non-adult and adult
workers.
lunCH proViDerOf all non-adult workers, 94 percent reported
that they provided their own lunch meal. Once
again their situation is worse than their adult
counterparts, 85 percent of whom provided
lunch themselves.
95.8 percent of adults reported this same
work intensity. Combined with the data on the
length of the working day above, non-adult
workers typically worked more than 77-hour
weeks, which is practically twice the legal
limit of 40 hours of work per week. This is
unfettered abuse of non-adult workers.
number of breaks per DayAccording to respondents, non-adult workers
took more breaks per day than adults (in part
Hazelnut Workers in turkey: Demographic Profiling; Duzce, ordu, & sakarya; 2016
www.fairlabor.org 19
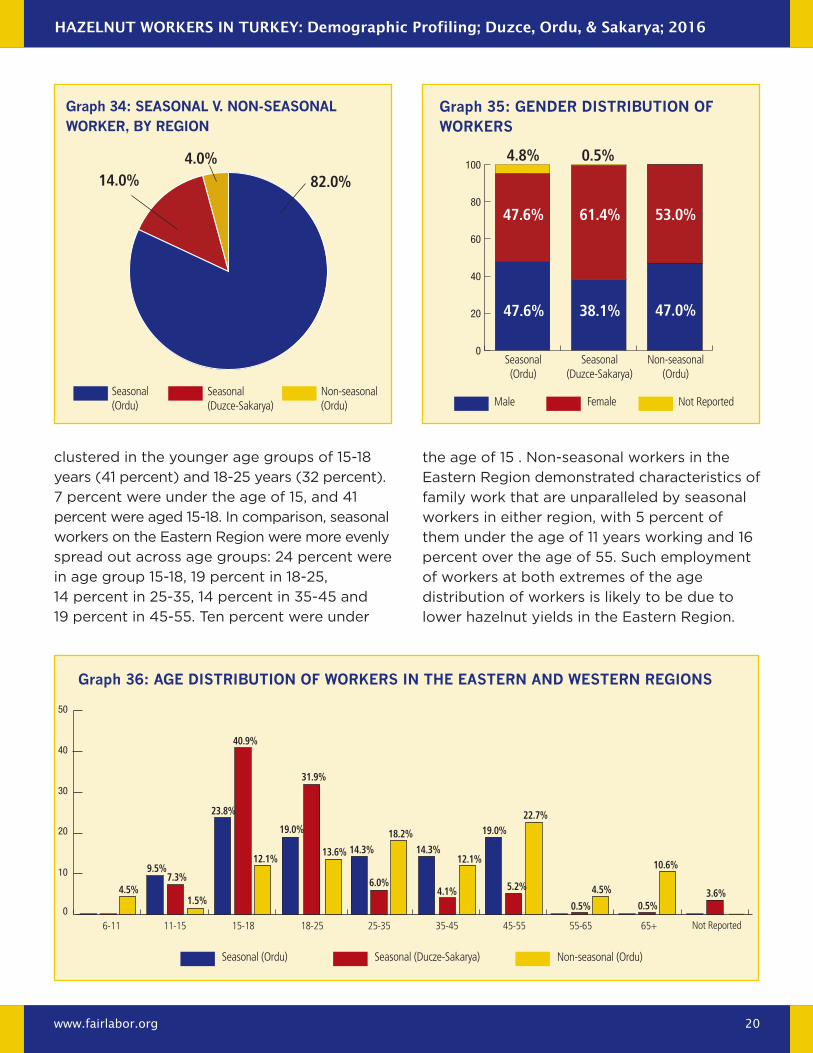
WHo pays for lunCH?Of all non-adult workers, 94 percent reported
that they pay for their own lunch. Again, the
incidence of non-adult workers paying for
their lunch is higher than the 85 percent of
adults who do so.
means of Daily Commute to orCHarDOf all non-adult workers, 82 percent reported
that they commute daily to the orchard by
tractor tow, while 6 percent walk.
Graph 32: MeAns of dAily coMMute to orchArd, by AGe
Graph 33: MeAns of pAyMent of trAnsportAtion for dAily coMMute to orchArd, by AGe
0
20
40
60
80
100
0
20
40
60
80
100
15-18 15-1818+ 18+
82.4%
5.9%
9.9%
62.0%
25.4%17.6%11.7% 14.1%
76.1%
12.7%
5.9%
76.5%
Tractor, tow SelfFoot Other Orchard Owner Not Reported
WHo pays for Daily Commute to orCHarDOf all non-adult workers, 76 percent
reported that orchard owners pay for
their daily commute to the orchard, while
6 percent cover the cost themselves
of commuting to the orchard. For
adult workers, orchard owners paid for
commuting for 62 percent of workers,
and 25.4 percent paid for transportation
themselves.
3. Comparison of seasonal anD non-seasonal Workers
loCationThe Western Region (Duzce-Sakarya)
employed migrant seasonal workers
exclusively for harvest activities. In the Eastern
Region (Ordu) local non-seasonal workers
predominated.
GenDer DistributionIn the Western Region, female seasonal
workers represented 61 percent of workers
compared with 38 percent male seasonal
workers. In contrast, seasonal work in the
Eastern Region was equally distributed
according to gender. Non-seasonal work in
the Eastern Region was only slightly biased
towards females (53 percent vs. 47 percent).
aGe DistributionThe labor force consisting exclusively of
seasonal workers in the Western Region was
Hazelnut Workers in turkey: Demographic Profiling; Duzce, ordu, & sakarya; 2016
www.fairlabor.org 20
clustered in the younger age groups of 15-18
years (41 percent) and 18-25 years (32 percent).
7 percent were under the age of 15, and 41
percent were aged 15-18. In comparison, seasonal
workers on the Eastern Region were more evenly
spread out across age groups: 24 percent were
in age group 15-18, 19 percent in 18-25,
14 percent in 25-35, 14 percent in 35-45 and
19 percent in 45-55. Ten percent were under
the age of 15 . Non-seasonal workers in the
Eastern Region demonstrated characteristics of
family work that are unparalleled by seasonal
workers in either region, with 5 percent of
them under the age of 11 years working and 16
percent over the age of 55. Such employment
of workers at both extremes of the age
distribution of workers is likely to be due to
lower hazelnut yields in the Eastern Region.
Graph 34: seAsonAl v. non-seAsonAl worker, by reGion
82.0%14.0%4.0%
Seasonal (Ordu)
Seasonal (Duzce-Sakarya)
Non-seasonal (Ordu)
Graph 35: Gender distribution of workers
0
20
40
60
80
100
47.6% 38.1% 47.0%
53.0%61.4%47.6%
4.8% 0.5%
Male Female Not Reported
Seasonal (Ordu)
Seasonal (Duzce-Sakarya)
Non-seasonal (Ordu)
Graph 36: AGe distribution of workers in the eAstern And western reGions
6-11 11-15 15-18 18-25 25-35 35-45 45-55 55-65 65+ Not Reported0
10
20
30
40
50
1.5%
7.3%9.5%
4.5%
10.6%
22.7%19.0%
5.2%
0.5%0.5%
4.5%
23.8%
12.1%13.6%
18.2%
31.9%
40.9%
19.0%
14.3%
6.0%
12.1%
4.1%
14.3%
3.6%
Seasonal (Ordu) Seasonal (Ducze-Sakarya) Non-seasonal (Ordu)
Hazelnut Workers in turkey: Demographic Profiling; Duzce, ordu, & sakarya; 2016
www.fairlabor.org 21
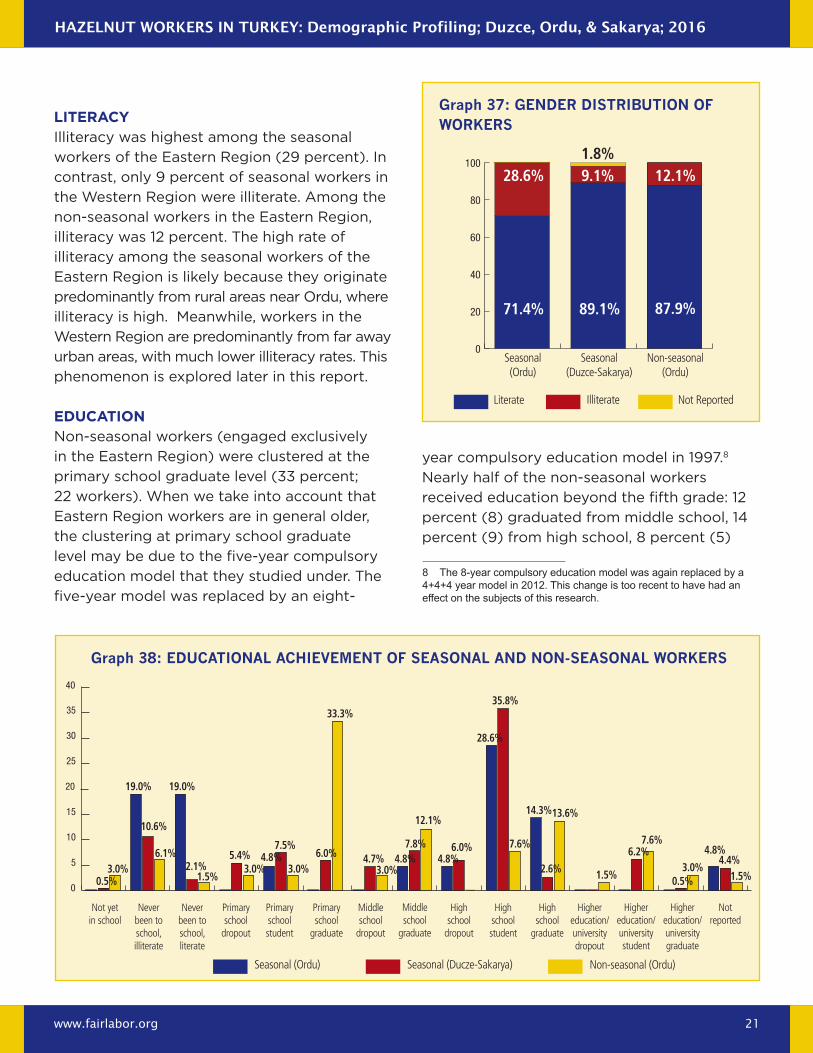
literaCy Illiteracy was highest among the seasonal
workers of the Eastern Region (29 percent). In
contrast, only 9 percent of seasonal workers in
the Western Region were illiterate. Among the
non-seasonal workers in the Eastern Region,
illiteracy was 12 percent. The high rate of
illiteracy among the seasonal workers of the
Eastern Region is likely because they originate
predominantly from rural areas near Ordu, where
illiteracy is high. Meanwhile, workers in the
Western Region are predominantly from far away
urban areas, with much lower illiteracy rates. This
phenomenon is explored later in this report.
eDuCationNon-seasonal workers (engaged exclusively
in the Eastern Region) were clustered at the
primary school graduate level (33 percent;
22 workers). When we take into account that
Eastern Region workers are in general older,
the clustering at primary school graduate
level may be due to the five-year compulsory
education model that they studied under. The
five-year model was replaced by an eight-
Graph 37: Gender distribution of workers
0
20
40
60
80
100
71.4% 89.1% 87.9%
12.1%9.1%28.6%1.8%
Literate Illiterate Not Reported
Seasonal (Ordu)
Seasonal (Duzce-Sakarya)
Non-seasonal (Ordu)
Graph 38: educAtionAl AchieveMent of seAsonAl And non-seAsonAl workers
Never been to school, illiterate
Not yet in school
Never been to school, literate
Primary school
dropout
Primary school student
Primary school
graduate
Middle school
dropout
Middle school
graduate
High school
dropout
High school student
High school
graduate
Not reported
Higher education/university dropout
Higher education/university student
Higher education/university graduate
0
5
10
15
20
25
30
35
40
0.5%3.0%
19.0% 19.0%
10.6%
6.1%2.1%
1.5%3.0% 3.0% 3.0%
5.4%7.5%
4.8% 6.0%
28.6%
35.8%
12.1%
7.6%
14.3%13.6%
2.6% 1.5%
6.2%7.6%
4.8%4.4%
1.5%0.5%3.0%
33.3%
4.7% 4.8% 4.8%7.8% 6.0%
Seasonal (Ordu) Seasonal (Ducze-Sakarya) Non-seasonal (Ordu)
year compulsory education model in 1997.8
Nearly half of the non-seasonal workers
received education beyond the fifth grade: 12
percent (8) graduated from middle school, 14
percent (9) from high school, 8 percent (5)
8 The 8-year compulsory education model was again replaced by a 4+4+4 year model in 2012. This change is too recent to have had an effect on the subjects of this research.
Hazelnut Workers in turkey: Demographic Profiling; Duzce, ordu, & sakarya; 2016
www.fairlabor.org 22
enrolled in higher education and 3 percent (2)
graduated from higher education. In contrast,
the seasonal workers of the Eastern Region
are clustered in two categories: workers
never having been to school (38 percent or
8 - half of whom are illiterate) and high school
students (29 percent or 6); 14 percent were
high school graduates, and virtually none
have been enrolled in higher education. The
exclusively seasonal workers of the Western
Region were also clustered at the high school
student level (36 percent; 138 workers), 6
percent were in higher education and 1 percent
graduated from higher education.
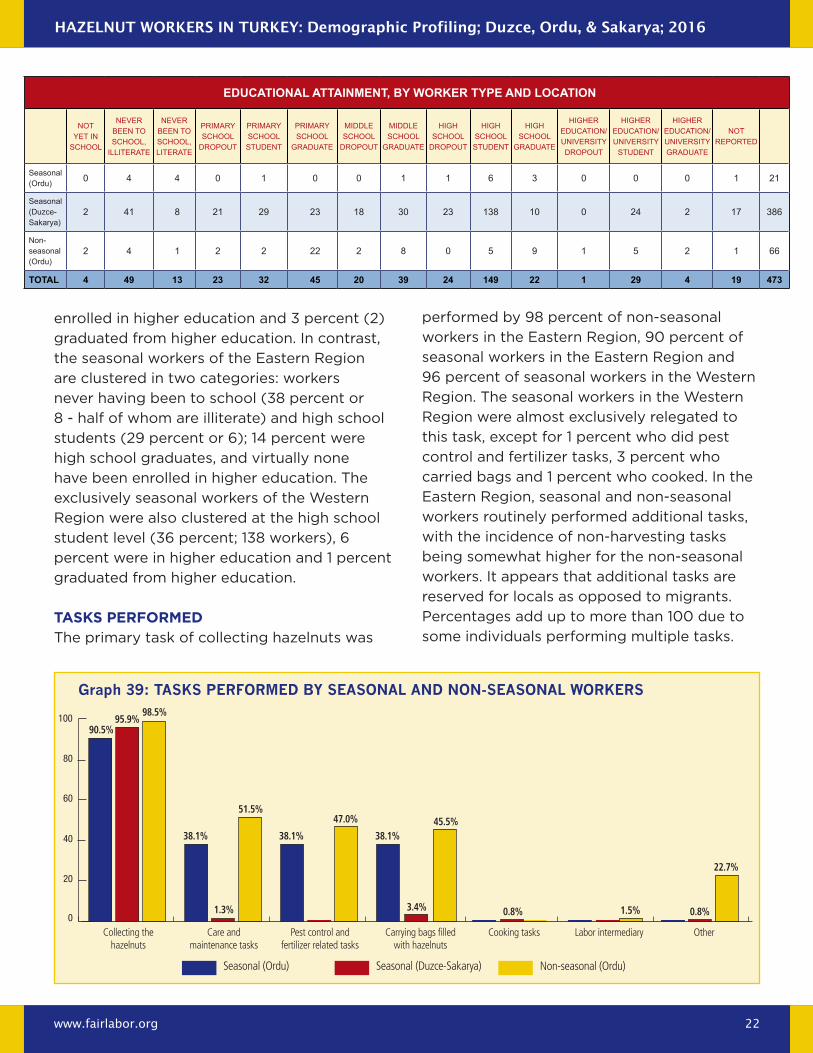
tasks performeDThe primary task of collecting hazelnuts was
Educational attainmEnt, by WorkEr typE and location
NOT yET IN
scHOOl
NEvER BEEN TO scHOOl,
IllITERaTE
NEvER BEEN TO scHOOl, lITERaTE
PRImaRy scHOOl
dROPOuT
PRImaRy scHOOl sTudENT
PRImaRy scHOOl
gRaduaTE
mIddlE scHOOl
dROPOuT
mIddlE scHOOl
gRaduaTE
HIgH scHOOl
dROPOuT
HIgH scHOOl sTudENT
HIgH scHOOl
gRaduaTE
HIgHER EducaTION/ uNIvERsITy dROPOuT
HIgHER EducaTION/ uNIvERsITy
sTudENT
HIgHER EducaTION/ uNIvERsITy gRaduaTE
NOT REPORTEd
seasonal (Ordu) 0 4 4 0 1 0 0 1 1 6 3 0 0 0 1 21
seasonal (duzce-sakarya)
2 41 8 21 29 23 18 30 23 138 10 0 24 2 17 386
Non-seasonal (Ordu)
2 4 1 2 2 22 2 8 0 5 9 1 5 2 1 66
total 4 49 13 23 32 45 20 39 24 149 22 1 29 4 19 473
performed by 98 percent of non-seasonal
workers in the Eastern Region, 90 percent of
seasonal workers in the Eastern Region and
96 percent of seasonal workers in the Western
Region. The seasonal workers in the Western
Region were almost exclusively relegated to
this task, except for 1 percent who did pest
control and fertilizer tasks, 3 percent who
carried bags and 1 percent who cooked. In the
Eastern Region, seasonal and non-seasonal
workers routinely performed additional tasks,
with the incidence of non-harvesting tasks
being somewhat higher for the non-seasonal
workers. It appears that additional tasks are
reserved for locals as opposed to migrants.
Percentages add up to more than 100 due to
some individuals performing multiple tasks.
Graph 39: tAsks perforMed by seAsonAl And non-seAsonAl workers
OtherCollecting the hazelnuts
Care and maintenance tasks
Pest control andfertilizer related tasks
Carrying bags filled with hazelnuts
Cooking tasks Labor intermediary0
20
40
60
80
10090.5%
38.1%
0.8%1.3%
38.1% 38.1%
51.5%47.0% 45.5%
3.4%
22.7%
1.5%0.8%
95.9%98.5%
Seasonal (Ordu) Seasonal (Duzce-Sakarya) Non-seasonal (Ordu)
Hazelnut Workers in turkey: Demographic Profiling; Duzce, ordu, & sakarya; 2016
www.fairlabor.org 23
4. Comparison of eastern (orDu) Vs. Western (DuzCe anD sakarya) reGions
Graph 40: oriGin of seAsonAl workers, by reGion
0
20
40
60
80
100
16.7%
3.0% 1.5%
11.9%
38.8%
1.5% 4.5%
95.5%
83.3%
25.4%
4.5%
13.4%
Seasonal (Ordu) Seasonal (Duzce-Sakarya) Non-seasonal (Ordu)
Antep Batman Diyarbakir Hakkari Istanbul Mardin Ordu Sanliurfa Siirt Sirnak Syria- Tell Abyad
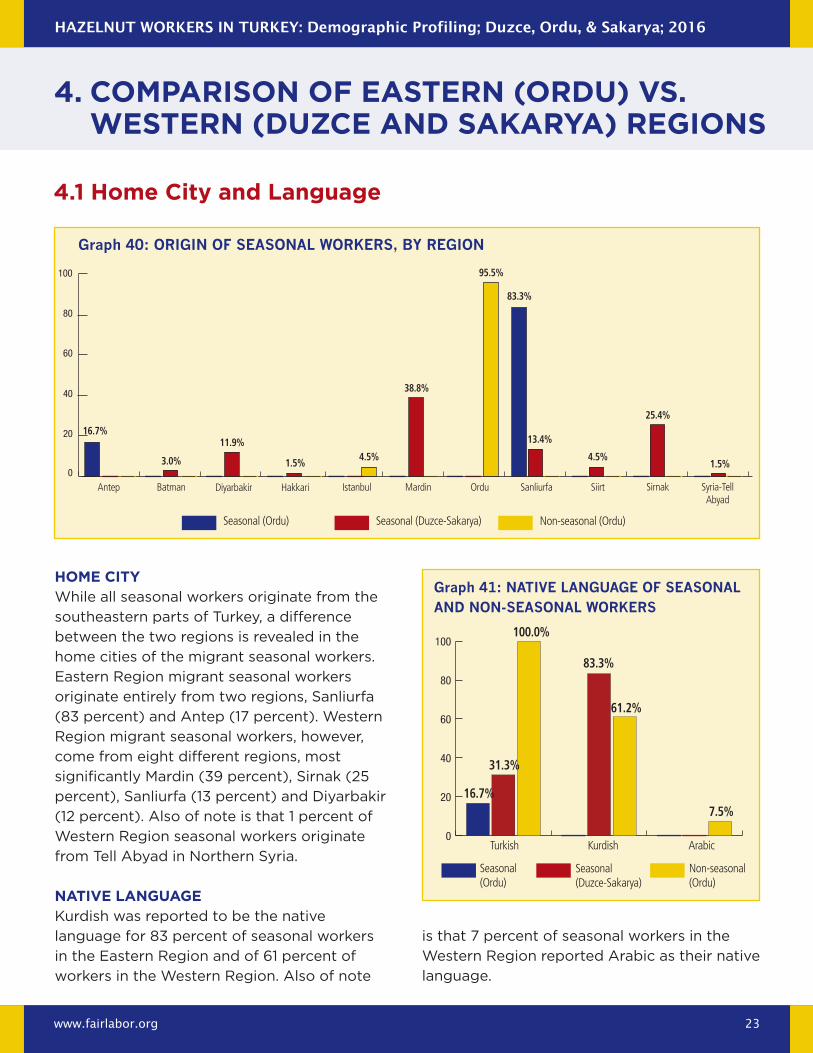
4.1 Home City and language
Home CityWhile all seasonal workers originate from the
southeastern parts of Turkey, a difference
between the two regions is revealed in the
home cities of the migrant seasonal workers.
Eastern Region migrant seasonal workers
originate entirely from two regions, Sanliurfa
(83 percent) and Antep (17 percent). Western
Region migrant seasonal workers, however,
come from eight different regions, most
significantly Mardin (39 percent), Sirnak (25
percent), Sanliurfa (13 percent) and Diyarbakir
(12 percent). Also of note is that 1 percent of
Western Region seasonal workers originate
from Tell Abyad in Northern Syria.
natiVe lanGuaGeKurdish was reported to be the native
language for 83 percent of seasonal workers
in the Eastern Region and of 61 percent of
workers in the Western Region. Also of note
is that 7 percent of seasonal workers in the
Western Region reported Arabic as their native
language.
Graph 41: nAtive lAnGuAGe of seAsonAl And non-seAsonAl workers
0
20
40
60
80
100
Seasonal (Ordu)
Seasonal (Duzce-Sakarya)
Non-seasonal (Ordu)
16.7%
31.3%
100.0%
83.3%
61.2%
7.5%
Turkish Kurdish Arabic
Hazelnut Workers in turkey: Demographic Profiling; Duzce, ordu, & sakarya; 2016
www.fairlabor.org 24
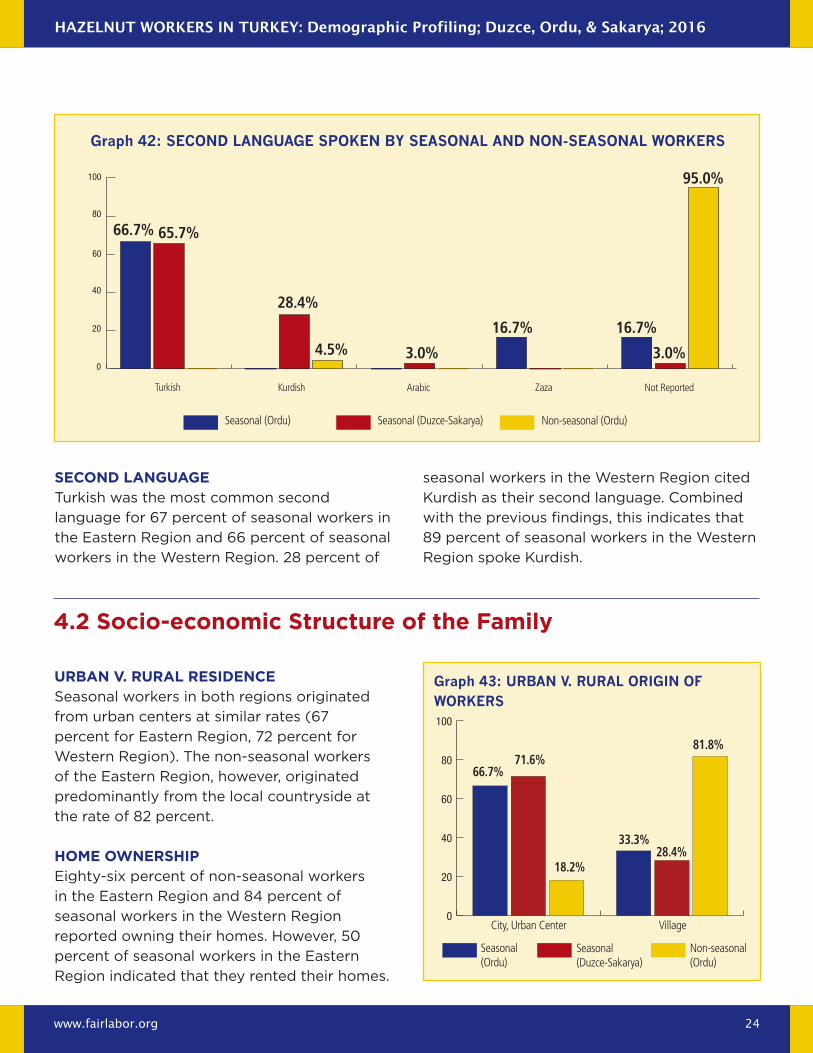
Graph 42: second lAnGuAGe spoken by seAsonAl And non-seAsonAl workers
Turkish Kurdish Arabic Zaza Not Reported
0
20
40
60
80
100
4.5% 3.0% 3.0%
16.7% 16.7%
95.0%
66.7% 65.7%
28.4%
Seasonal (Ordu) Seasonal (Duzce-Sakarya) Non-seasonal (Ordu)
seConD lanGuaGeTurkish was the most common second
language for 67 percent of seasonal workers in
the Eastern Region and 66 percent of seasonal
workers in the Western Region. 28 percent of
seasonal workers in the Western Region cited
Kurdish as their second language. Combined
with the previous findings, this indicates that
89 percent of seasonal workers in the Western
Region spoke Kurdish.
4.2 socio-economic structure of the family
urban V. rural resiDenCeSeasonal workers in both regions originated
from urban centers at similar rates (67
percent for Eastern Region, 72 percent for
Western Region). The non-seasonal workers
of the Eastern Region, however, originated
predominantly from the local countryside at
the rate of 82 percent.
Home oWnersHipEighty-six percent of non-seasonal workers
in the Eastern Region and 84 percent of
seasonal workers in the Western Region
reported owning their homes. However, 50
percent of seasonal workers in the Eastern
Region indicated that they rented their homes.
Graph 43: urbAn v. rurAl oriGin of workers
0
20
40
60
80
100
Seasonal (Ordu)
Seasonal (Duzce-Sakarya)
Non-seasonal (Ordu)
66.7%71.6%
18.2%28.4%
33.3%
81.8%
City, Urban Center Village
Hazelnut Workers in turkey: Demographic Profiling; Duzce, ordu, & sakarya; 2016
www.fairlabor.org 25
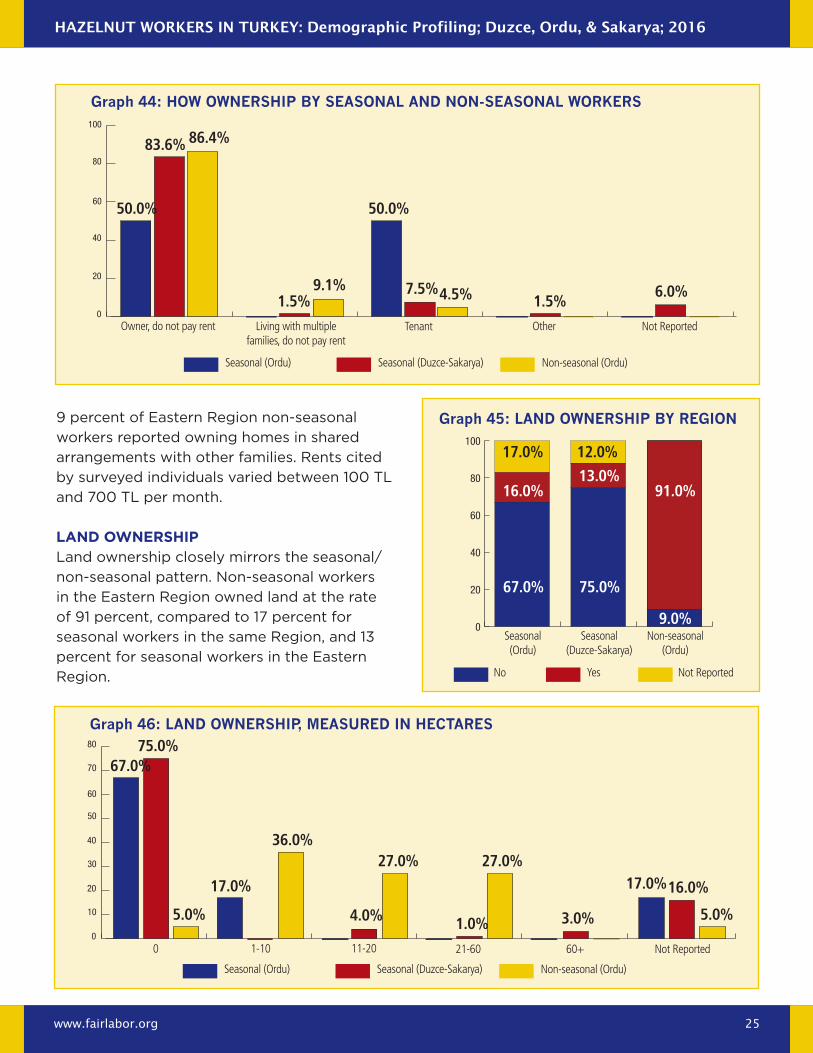
9 percent of Eastern Region non-seasonal
workers reported owning homes in shared
arrangements with other families. Rents cited
by surveyed individuals varied between 100 TL
and 700 TL per month.
lanD oWnersHipLand ownership closely mirrors the seasonal/
non-seasonal pattern. Non-seasonal workers
in the Eastern Region owned land at the rate
of 91 percent, compared to 17 percent for
seasonal workers in the same Region, and 13
percent for seasonal workers in the Eastern
Region.
Graph 44: how ownership by seAsonAl And non-seAsonAl workers
Graph 46: lAnd ownership, MeAsured in hectAres
Owner, do not pay rent
0
Living with multiple families, do not pay rent
1-10
Tenant
11-20
Other
21-60 60+
Not Reported
Not Reported
0
20
40
60
80
100
0
10
20
30
40
50
60
70
80
1.5%
17.0%
7.5%
50.0%
36.0%
4.5%
1.0%
27.0%27.0%
6.0%
17.0%16.0%
5.0%
1.5%
3.0%
50.0%
5.0%
83.6%
67.0%
86.4%
75.0%
9.1%
4.0%
Seasonal (Ordu)
Seasonal (Ordu)
Seasonal (Duzce-Sakarya)
Seasonal (Duzce-Sakarya)
Non-seasonal (Ordu)
Non-seasonal (Ordu)
Graph 45: lAnd ownership by reGion
0
20
40
60
80
100
67.0% 75.0%
9.0%
91.0%13.0%
16.0%
17.0% 12.0%
No Yes Not Reported
Seasonal (Ordu)
Seasonal (Duzce-Sakarya)
Non-seasonal (Ordu)
Hazelnut Workers in turkey: Demographic Profiling; Duzce, ordu, & sakarya; 2016
www.fairlabor.org 26
lanD size (in 1000 m2 - turkisH aCres) Even when seasonal workers do own land, the
size of their plots of is much smaller than for
non-seasonal workers. All respondents stating
that they owned land reported that they
actively cultivated their lands. The preferred
crops raised on this land were reported to be
hazelnuts, wheat, corn and potatoes.
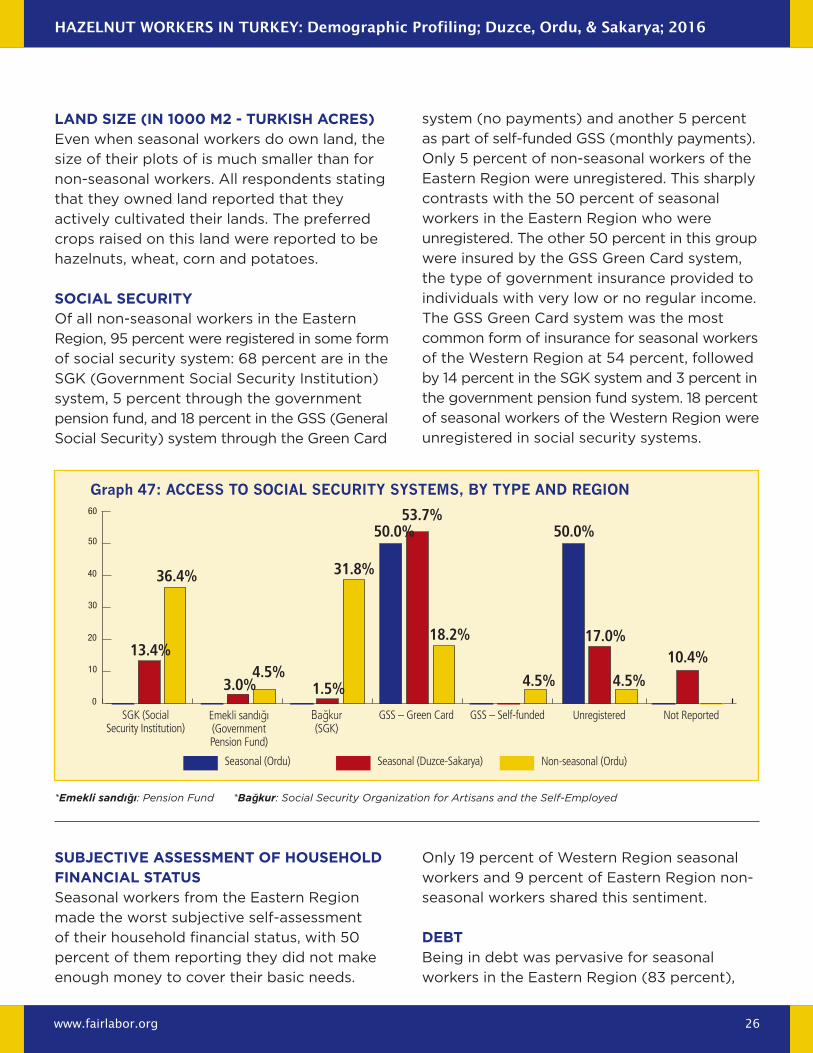
soCial seCurityOf all non-seasonal workers in the Eastern
Region, 95 percent were registered in some form
of social security system: 68 percent are in the
SGK (Government Social Security Institution)
system, 5 percent through the government
pension fund, and 18 percent in the GSS (General
Social Security) system through the Green Card
system (no payments) and another 5 percent
as part of self-funded GSS (monthly payments).
Only 5 percent of non-seasonal workers of the
Eastern Region were unregistered. This sharply
contrasts with the 50 percent of seasonal
workers in the Eastern Region who were
unregistered. The other 50 percent in this group
were insured by the GSS Green Card system,
the type of government insurance provided to
individuals with very low or no regular income.
The GSS Green Card system was the most
common form of insurance for seasonal workers
of the Western Region at 54 percent, followed
by 14 percent in the SGK system and 3 percent in
the government pension fund system. 18 percent
of seasonal workers of the Western Region were
unregistered in social security systems.
Graph 47: Access to sociAl security systeMs, by type And reGion
SGK (Social Security Institution)
GSS – Green Card GSS – Self-funded Unregistered Not ReportedEmekli sandığı (Government Pension Fund)
Bağkur (SGK)
0
10
20
30
40
50
60
4.5%
31.8%
4.5% 4.5%
18.2%
50.0% 50.0%53.7%
10.4%17.0%
3.0%
13.4%
36.4%
1.5%
Seasonal (Ordu) Seasonal (Duzce-Sakarya) Non-seasonal (Ordu)
*Emekli sandığı: Pension Fund *Bağkur: Social Security Organization for Artisans and the Self-Employed
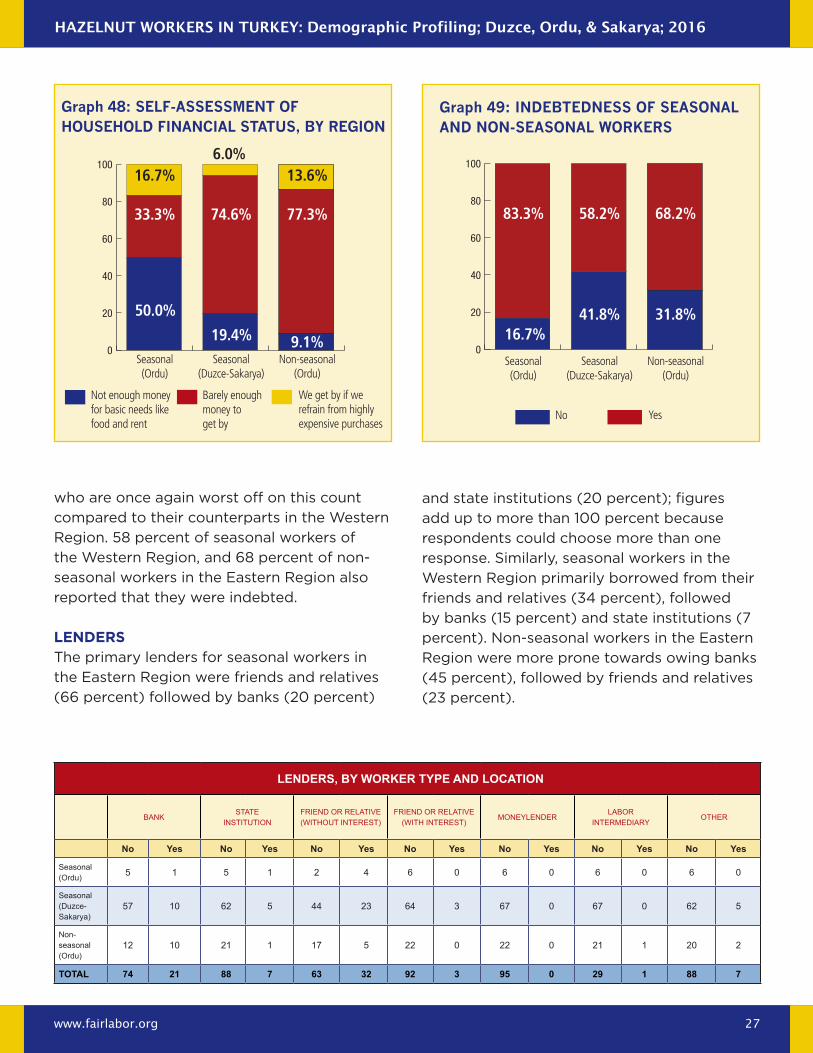
subjeCtiVe assessment of HouseHolD finanCial statusSeasonal workers from the Eastern Region
made the worst subjective self-assessment
of their household financial status, with 50
percent of them reporting they did not make
enough money to cover their basic needs.
Only 19 percent of Western Region seasonal
workers and 9 percent of Eastern Region non-
seasonal workers shared this sentiment.
DebtBeing in debt was pervasive for seasonal
workers in the Eastern Region (83 percent),
Hazelnut Workers in turkey: Demographic Profiling; Duzce, ordu, & sakarya; 2016
www.fairlabor.org 27
who are once again worst off on this count
compared to their counterparts in the Western
Region. 58 percent of seasonal workers of
the Western Region, and 68 percent of non-
seasonal workers in the Eastern Region also
reported that they were indebted.
lenDersThe primary lenders for seasonal workers in
the Eastern Region were friends and relatives
(66 percent) followed by banks (20 percent)
Graph 48: self-AssessMent of household finAnciAl stAtus, by reGion
Graph 49: indebtedness of seAsonAl And non-seAsonAl workers
0
20
40
60
80
100
0
20
40
60
80
100
50.0%
16.7%19.4%41.8%
9.1%
31.8%
77.3% 68.2%74.6% 58.2%33.3% 83.3%
16.7% 13.6%6.0%
No Yes
Seasonal (Ordu)
Seasonal (Ordu)
Seasonal (Duzce-Sakarya)
Seasonal (Duzce-Sakarya)
Non-seasonal (Ordu)
Non-seasonal (Ordu)
Not enough money for basic needs like food and rent
Barely enough money to get by
We get by if we refrain from highly expensive purchases
and state institutions (20 percent); figures
add up to more than 100 percent because
respondents could choose more than one
response. Similarly, seasonal workers in the
Western Region primarily borrowed from their
friends and relatives (34 percent), followed
by banks (15 percent) and state institutions (7
percent). Non-seasonal workers in the Eastern
Region were more prone towards owing banks
(45 percent), followed by friends and relatives
(23 percent).
lEndErs, by WorkEr typE and location
BaNksTaTE
INsTITuTIONFRIENd OR RElaTIvE (WITHOuT INTEREsT)
FRIENd OR RElaTIvE (WITH INTEREsT)
mONEylENdERlaBOR
INTERmEdIaRyOTHER
no yes no yes no yes no yes no yes no yes no yes
seasonal (Ordu) 5 1 5 1 2 4 6 0 6 0 6 0 6 0
seasonal (duzce-sakarya)
57 10 62 5 44 23 64 3 67 0 67 0 62 5
Non-seasonal (Ordu)
12 10 21 1 17 5 22 0 22 0 21 1 20 2
total 74 21 88 7 63 32 92 3 95 0 29 1 88 7
Hazelnut Workers in turkey: Demographic Profiling; Duzce, ordu, & sakarya; 2016
www.fairlabor.org 28
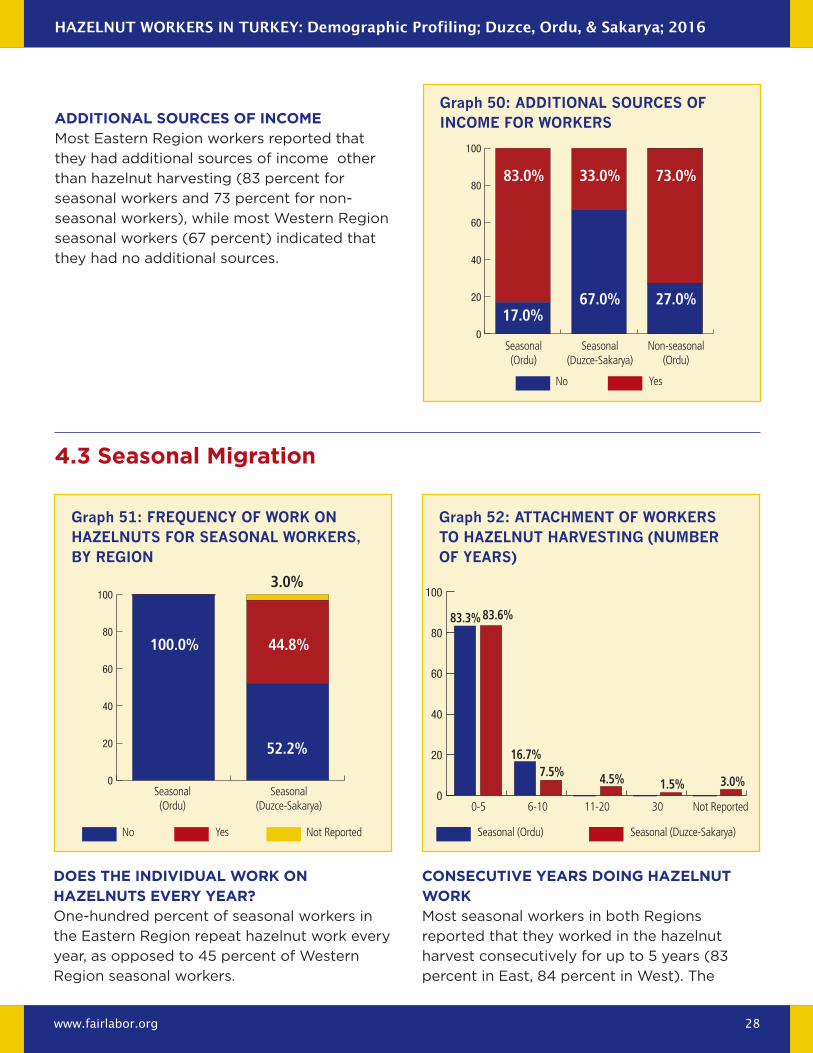
aDDitional sourCes of inComeMost Eastern Region workers reported that
they had additional sources of income other
than hazelnut harvesting (83 percent for
seasonal workers and 73 percent for non-
seasonal workers), while most Western Region
seasonal workers (67 percent) indicated that
they had no additional sources.
4.3 seasonal migration
Graph 50: AdditionAl sources of incoMe for workers
0
20
40
60
80
100
17.0%67.0% 27.0%
73.0%33.0%83.0%
No Yes
Seasonal (Ordu)
Seasonal (Duzce-Sakarya)
Non-seasonal (Ordu)
Does tHe inDiViDual Work on Hazelnuts eVery year?One-hundred percent of seasonal workers in
the Eastern Region repeat hazelnut work every
year, as opposed to 45 percent of Western
Region seasonal workers.
ConseCutiVe years DoinG Hazelnut WorkMost seasonal workers in both Regions
reported that they worked in the hazelnut
harvest consecutively for up to 5 years (83
percent in East, 84 percent in West). The
Graph 51: frequency of work on hAzelnuts for seAsonAl workers, by reGion
Graph 52: AttAchMent of workers to hAzelnut hArvestinG (nuMber of yeArs)
0
20
40
60
80
100
0
20
40
60
80
100
52.2%
44.8%
3.0%
83.3% 83.6%
16.7%7.5% 4.5% 1.5% 3.0%
100.0%
Seasonal (Ordu) 0-5 6-10 11-20 30 Not Reported
Seasonal (Duzce-Sakarya)
No Yes Not Reported Seasonal (Ordu) Seasonal (Duzce-Sakarya)
Hazelnut Workers in turkey: Demographic Profiling; Duzce, ordu, & sakarya; 2016
www.fairlabor.org 29
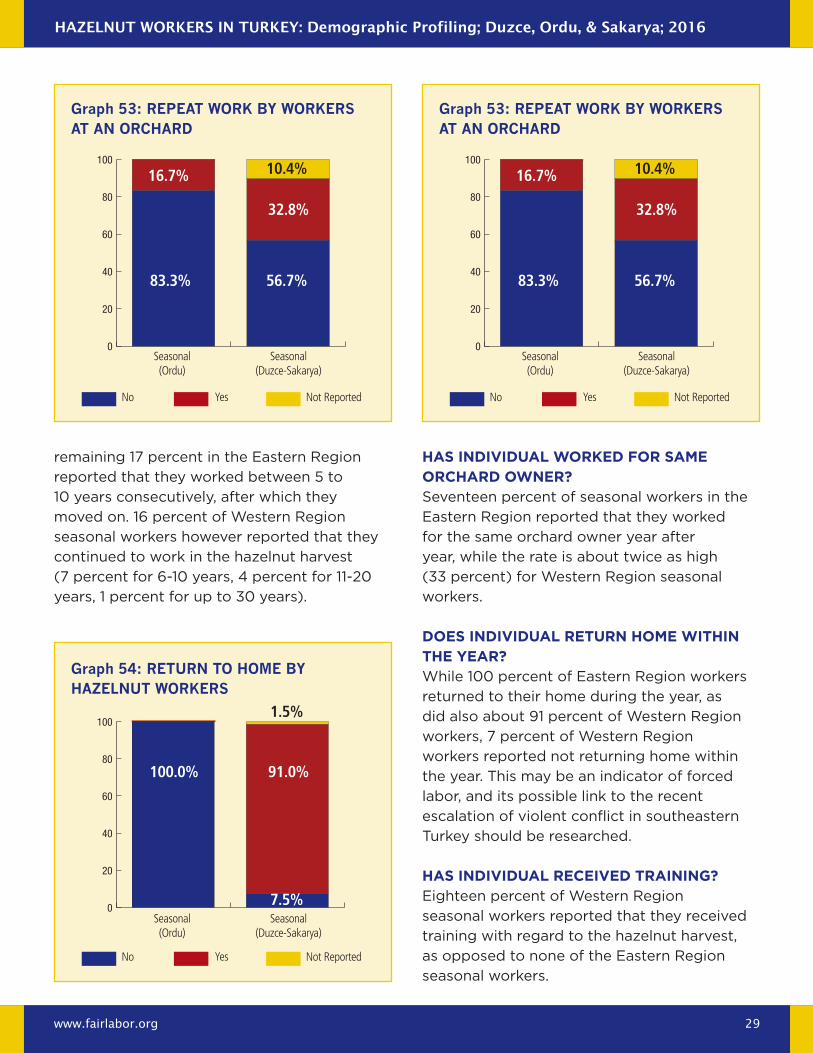
remaining 17 percent in the Eastern Region
reported that they worked between 5 to
10 years consecutively, after which they
moved on. 16 percent of Western Region
seasonal workers however reported that they
continued to work in the hazelnut harvest
(7 percent for 6-10 years, 4 percent for 11-20
years, 1 percent for up to 30 years).
Graph 53: repeAt work by workers At An orchArd
0
20
40
60
80
100
56.7%
32.8%
16.7% 10.4%
83.3%
Seasonal (Ordu)
Seasonal (Duzce-Sakarya)
No Yes Not Reported
Graph 53: repeAt work by workers At An orchArd
0
20
40
60
80
100
56.7%
32.8%
16.7% 10.4%
83.3%
Seasonal (Ordu)
Seasonal (Duzce-Sakarya)
No Yes Not Reported
Graph 54: return to hoMe by hAzelnut workers
0
20
40
60
80
100
7.5%
91.0%
1.5%
100.0%
Seasonal (Ordu)
Seasonal (Duzce-Sakarya)
No Yes Not Reported
Has inDiViDual WorkeD for same orCHarD oWner?Seventeen percent of seasonal workers in the
Eastern Region reported that they worked
for the same orchard owner year after
year, while the rate is about twice as high
(33 percent) for Western Region seasonal
workers.
Does inDiViDual return Home WitHin tHe year?While 100 percent of Eastern Region workers
returned to their home during the year, as
did also about 91 percent of Western Region
workers, 7 percent of Western Region
workers reported not returning home within
the year. This may be an indicator of forced
labor, and its possible link to the recent
escalation of violent conflict in southeastern
Turkey should be researched.
Has inDiViDual reCeiVeD traininG?Eighteen percent of Western Region
seasonal workers reported that they received
training with regard to the hazelnut harvest,
as opposed to none of the Eastern Region
seasonal workers.

Hazelnut Workers in turkey: Demographic Profiling; Duzce, ordu, & sakarya; 2016
www.fairlabor.org 30
DiD inDiViDual Work on otHer Crops?One-hundred percent of seasonal workers in
the Eastern Region reported that work on crops
other than hazelnuts during the year, while 57
percent of seasonal workers in the Western
Region stated that they worked in the hazelnut
harvest exclusively.
HoW many members of tHe HouseHolD partiCipate in seasonal Work?Multiple individuals in the same household tend to
join seasonal work in both regions. The groups of
workers are larger in the Western Region, with 21
percent joining in groups of 11 to 15, and 6 percent
joining in groups of 16 to 20. The dependency of
a multitude of persons on a single employer may
can be taken as a sign of forced labor.
Graph 55: trAininG for the hAzelnut hArvest, by reGion
Graph 56: other crops hArvested by seAsonAl workers, by reGion
0
20
40
60
80
100
0
20
40
60
80
100
73.1% 56.7%
17.9% 40.3%
9.0% 3.0%
100.0% 100.0%
Seasonal (Ordu)
Seasonal (Ordu)
Seasonal (Duzce-Sakarya)
Seasonal (Duzce-Sakarya)
No NoYes YesNot Reported Not Reported
Graph 57: nuMber of persons within A household workinG for the sAMe eMployer in hAzelnuts hArvestinG
0
10
20
30
40
50
60
70 66.7%
46.3%
33.3%
22.4%
4.5%6.0%
20.9%
1-5 6-10 11-15 16-19 Not Reported
Seasonal (Ordu) Seasonal (Duzce-Sakarya)
Hazelnut Workers in turkey: Demographic Profiling; Duzce, ordu, & sakarya; 2016
www.fairlabor.org 31
Graph 58: vehicles used by seAsonAl workers to trAvel to orchArds
Graph 59: vehicles used by seAsonAl workers to trAvel to orchArds
0
10
20
30
40
50
60
70
80
0
20
40
60
80
100
66.7%
100.0%73.1%
76.1%
9.0%
26.9%
7.5%
33.3%
1.5%6.0%
Minibus, Van SelfBus EmployerAutomobile Labor Intermediary
Other Not Reported
Seasonal (Ordu) Seasonal (Ordu)Seasonal (Duzce-Sakarya) Seasonal (Duzce-Sakarya)
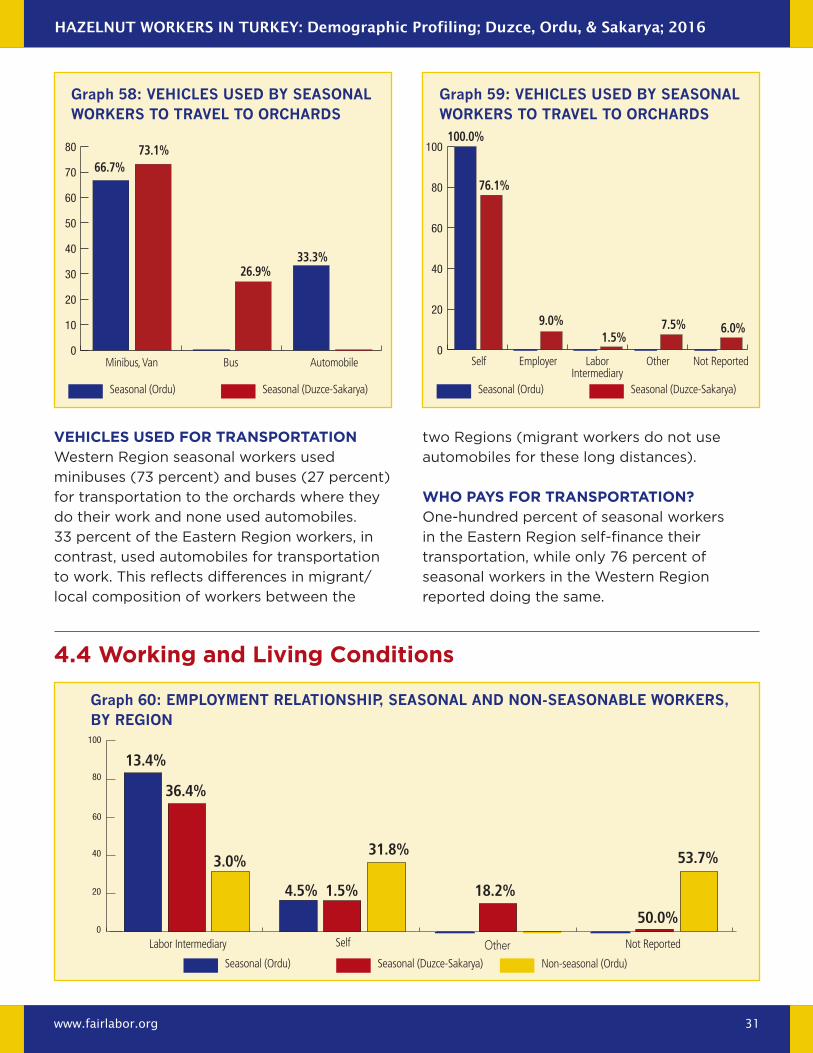
VeHiCles useD for transportationWestern Region seasonal workers used
minibuses (73 percent) and buses (27 percent)
for transportation to the orchards where they
do their work and none used automobiles.
33 percent of the Eastern Region workers, in
contrast, used automobiles for transportation
to work. This reflects differences in migrant/
local composition of workers between the
two Regions (migrant workers do not use
automobiles for these long distances).
WHo pays for transportation?One-hundred percent of seasonal workers
in the Eastern Region self-finance their
transportation, while only 76 percent of
seasonal workers in the Western Region
reported doing the same.
4.4 Working and living Conditions
Graph 60: eMployMent relAtionship, seAsonAl And non-seAsonAble workers, by reGion
Labor Intermediary Not ReportedSelf Other0
20
40
60
80
100
4.5%
31.8%
18.2%
50.0%
53.7%3.0%
13.4%
36.4%
1.5%
Seasonal (Ordu) Seasonal (Duzce-Sakarya) Non-seasonal (Ordu)
Hazelnut Workers in turkey: Demographic Profiling; Duzce, ordu, & sakarya; 2016
www.fairlabor.org 32
link to employerThe labor intermediary system is widespread
among seasonal workers. Of all seasonal
workers in the Western Region, 67 percent
related with their employer through a labor
intermediary rather than through a direct
relationship, while 83 percent of seasonal
workers in the Eastern Region did so. 32
percent of non-seasonal workers of the
Eastern Region were also subject to labor
intermediaries.
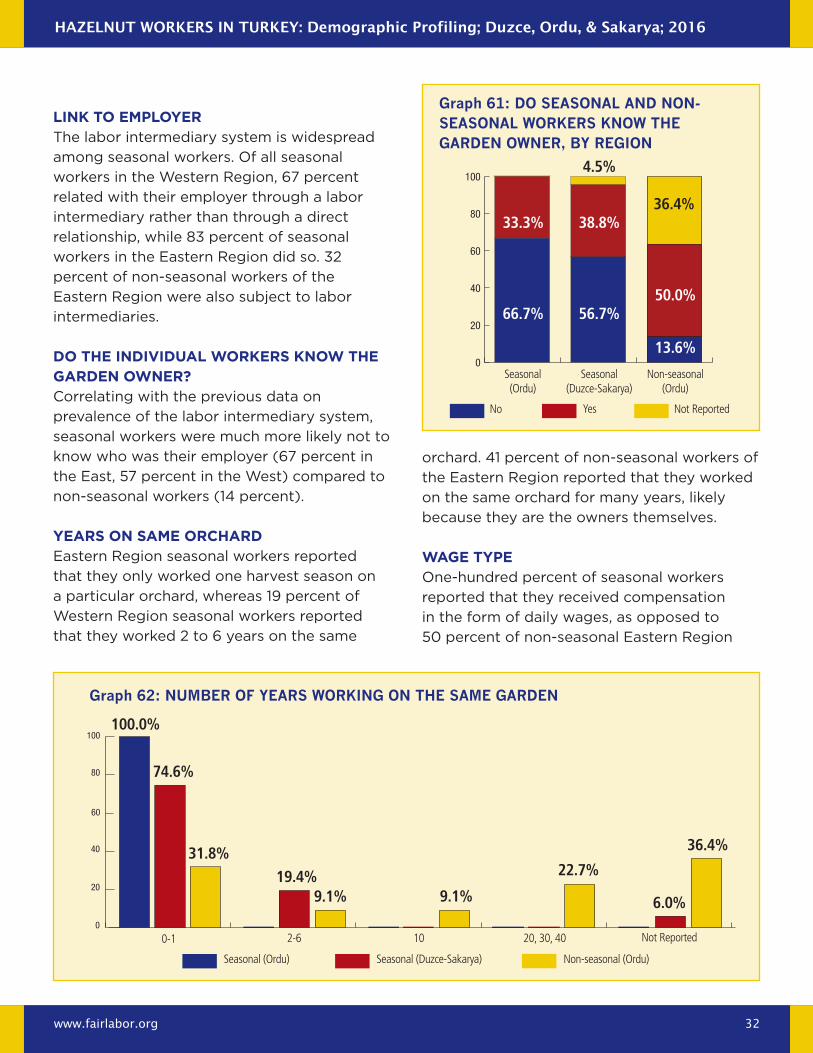
Do tHe inDiViDual Workers knoW tHe GarDen oWner?Correlating with the previous data on
prevalence of the labor intermediary system,
seasonal workers were much more likely not to
know who was their employer (67 percent in
the East, 57 percent in the West) compared to
non-seasonal workers (14 percent).
years on same orCHarDEastern Region seasonal workers reported
that they only worked one harvest season on
a particular orchard, whereas 19 percent of
Western Region seasonal workers reported
that they worked 2 to 6 years on the same
Graph 61: do seAsonAl And non-seAsonAl workers know the GArden owner, by reGion
0
20
40
60
80
100
66.7% 56.7%
13.6%
50.0%
36.4%38.8%
4.5%
33.3%
Seasonal (Ordu)
Seasonal (Duzce-Sakarya)
Non-seasonal (Ordu)
No Yes Not Reported
orchard. 41 percent of non-seasonal workers of
the Eastern Region reported that they worked
on the same orchard for many years, likely
because they are the owners themselves.
WaGe typeOne-hundred percent of seasonal workers
reported that they received compensation
in the form of daily wages, as opposed to
50 percent of non-seasonal Eastern Region
Graph 62: nuMber of yeArs workinG on the sAMe GArden
0-1 2-6 10 20, 30, 40 Not Reported0
20
40
60
80
100
19.4%9.1%
22.7%
6.0%
36.4%31.8%
100.0%
74.6%
9.1%
Seasonal (Ordu) Seasonal (Duzce-Sakarya) Non-seasonal (Ordu)
Hazelnut Workers in turkey: Demographic Profiling; Duzce, ordu, & sakarya; 2016
www.fairlabor.org 33
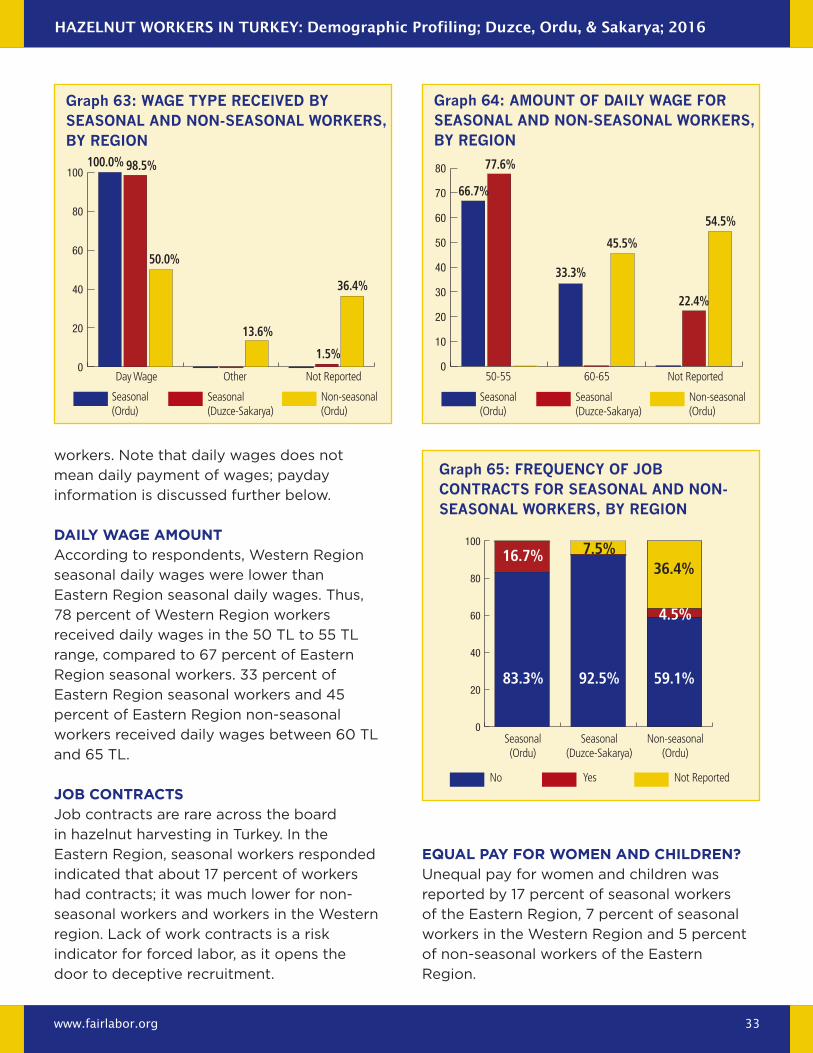
workers. Note that daily wages does not
mean daily payment of wages; payday
information is discussed further below.
Daily WaGe amountAccording to respondents, Western Region
seasonal daily wages were lower than
Eastern Region seasonal daily wages. Thus,
78 percent of Western Region workers
received daily wages in the 50 TL to 55 TL
range, compared to 67 percent of Eastern
Region seasonal workers. 33 percent of
Eastern Region seasonal workers and 45
percent of Eastern Region non-seasonal
workers received daily wages between 60 TL
and 65 TL.
job ContraCtsJob contracts are rare across the board
in hazelnut harvesting in Turkey. In the
Eastern Region, seasonal workers responded
indicated that about 17 percent of workers
had contracts; it was much lower for non-
seasonal workers and workers in the Western
region. Lack of work contracts is a risk
indicator for forced labor, as it opens the
door to deceptive recruitment.
Graph 63: wAGe type received by seAsonAl And non-seAsonAl workers, by reGion
Graph 64: AMount of dAily wAGe for seAsonAl And non-seAsonAl workers, by reGion
0
20
40
60
80
100
0
10
20
30
40
50
60
70
80
Seasonal (Ordu)
Seasonal (Ordu)
Seasonal (Duzce-Sakarya)
Seasonal (Duzce-Sakarya)
Non-seasonal (Ordu)
Non-seasonal (Ordu)
50.0%33.3%
98.5% 77.6%100.0%
66.7%
13.6%
45.5%
1.5%
22.4%36.4%
54.5%
Day Wage 50-55Other 60-65Not Reported Not Reported
Graph 65: frequency of job contrActs for seAsonAl And non-seAsonAl workers, by reGion
0
20
40
60
80
100
83.3% 92.5% 59.1%
4.5%
36.4%7.5%16.7%
Seasonal (Ordu)
Seasonal (Duzce-Sakarya)
Non-seasonal (Ordu)
No Yes Not Reported
equal pay for Women anD CHilDren?Unequal pay for women and children was
reported by 17 percent of seasonal workers
of the Eastern Region, 7 percent of seasonal
workers in the Western Region and 5 percent
of non-seasonal workers of the Eastern
Region.
Hazelnut Workers in turkey: Demographic Profiling; Duzce, ordu, & sakarya; 2016
www.fairlabor.org 34
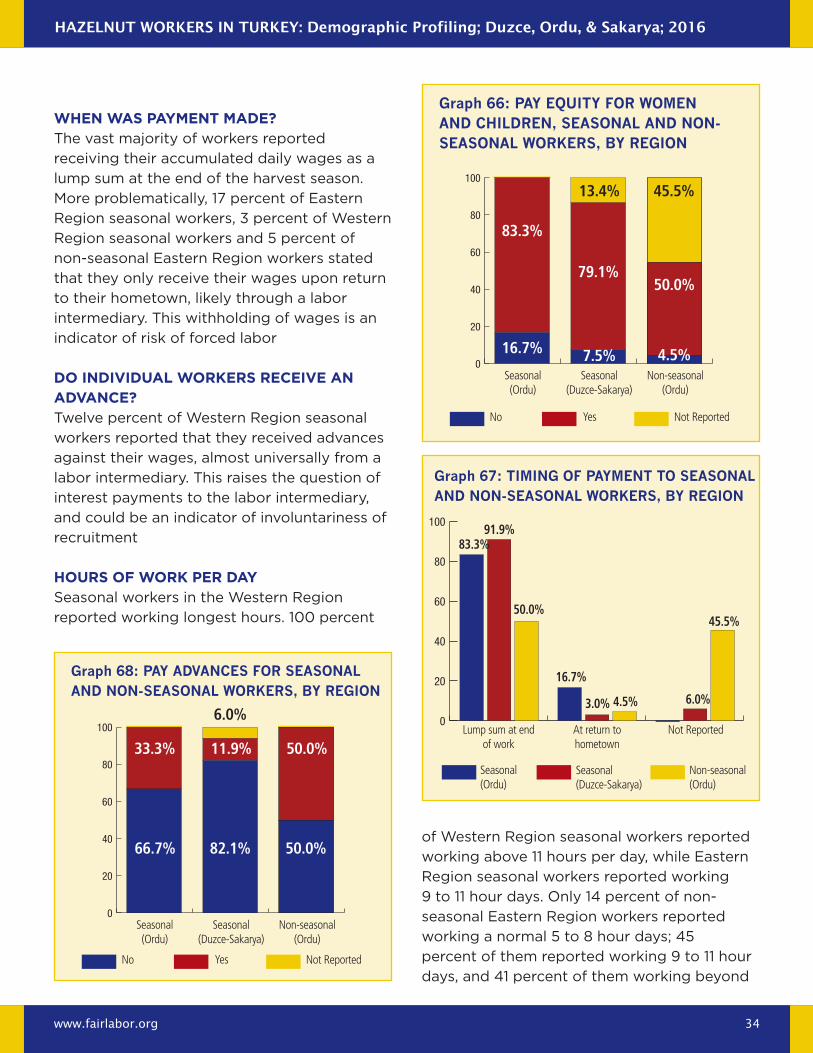
WHen Was payment maDe?The vast majority of workers reported
receiving their accumulated daily wages as a
lump sum at the end of the harvest season.
More problematically, 17 percent of Eastern
Region seasonal workers, 3 percent of Western
Region seasonal workers and 5 percent of
non-seasonal Eastern Region workers stated
that they only receive their wages upon return
to their hometown, likely through a labor
intermediary. This withholding of wages is an
indicator of risk of forced labor
Do inDiViDual Workers reCeiVe an aDVanCe?Twelve percent of Western Region seasonal
workers reported that they received advances
against their wages, almost universally from a
labor intermediary. This raises the question of
interest payments to the labor intermediary,
and could be an indicator of involuntariness of
recruitment
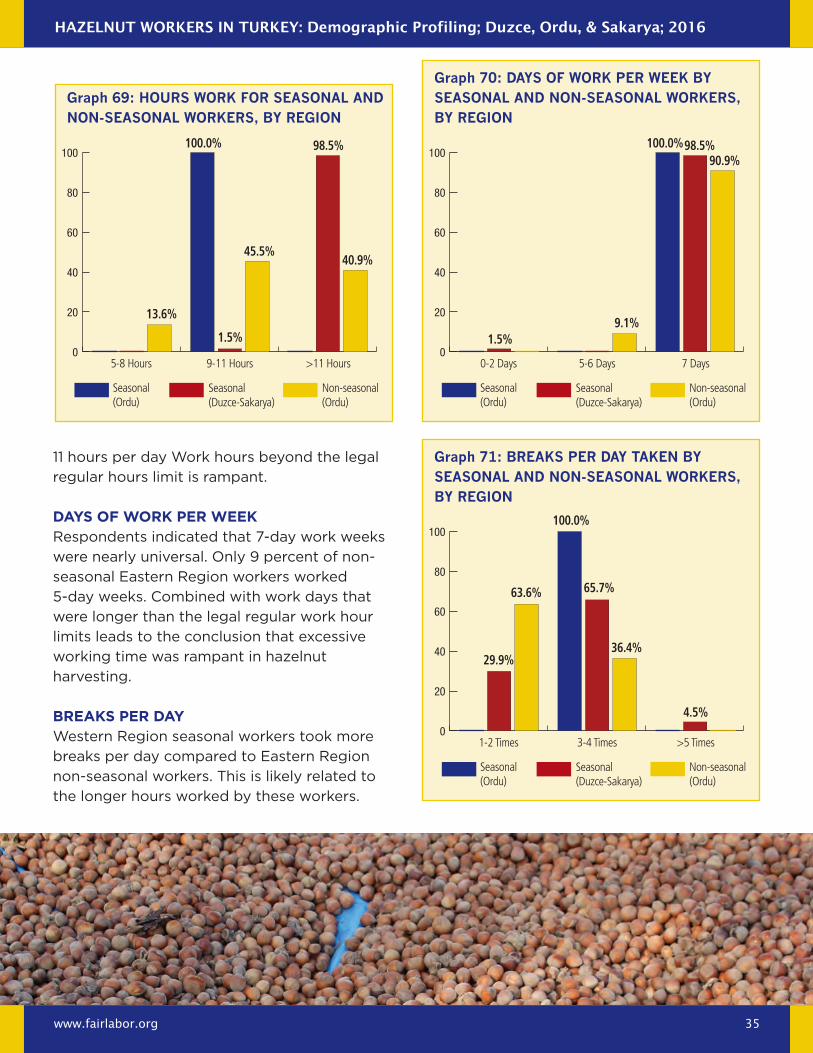
Hours of Work per DaySeasonal workers in the Western Region
reported working longest hours. 100 percent
Graph 67: tiMinG of pAyMent to seAsonAl And non-seAsonAl workers, by reGion
0
20
40
60
80
100
Seasonal (Ordu)
Seasonal (Duzce-Sakarya)
Non-seasonal (Ordu)
16.7%
3.0% 4.5%
50.0%
91.9%83.3%
6.0%
45.5%
Lump sum at end of work
At return to hometown
Not Reported
Graph 68: pAy AdvAnces for seAsonAl And non-seAsonAl workers, by reGion
0
20
40
60
80
100
33.3%
82.1% 50.0%
50.0%11.9%
6.0%
66.7%
Seasonal (Ordu)
Seasonal (Duzce-Sakarya)
Non-seasonal (Ordu)
No Yes Not Reported
of Western Region seasonal workers reported
working above 11 hours per day, while Eastern
Region seasonal workers reported working
9 to 11 hour days. Only 14 percent of non-
seasonal Eastern Region workers reported
working a normal 5 to 8 hour days; 45
percent of them reported working 9 to 11 hour
days, and 41 percent of them working beyond
Graph 66: pAy equity for woMen And children, seAsonAl And non-seAsonAl workers, by reGion
0
20
40
60
80
100
83.3%
7.5% 4.5%
50.0%79.1%
45.5%13.4%
16.7%
Seasonal (Ordu)
Seasonal (Duzce-Sakarya)
Non-seasonal (Ordu)
No Yes Not Reported
Hazelnut Workers in turkey: Demographic Profiling; Duzce, ordu, & sakarya; 2016
www.fairlabor.org 35
Graph 69: hours work for seAsonAl And non-seAsonAl workers, by reGion
Graph 70: dAys of work per week by seAsonAl And non-seAsonAl workers, by reGion
0
20
40
60
80
100
0
20
40
60
80
100
Seasonal (Ordu)
Seasonal (Ordu)
Seasonal (Duzce-Sakarya)
Seasonal (Duzce-Sakarya)
Non-seasonal (Ordu)
Non-seasonal (Ordu)
45.5%
1.5%
13.6%9.1%
100.0% 100.0%
1.5%
98.5% 98.5%
40.9%
90.9%
5-8 Hours 0-2 Days9-11 Hours 5-6 Days>11 Hours 7 Days
Graph 71: breAks per dAy tAken by seAsonAl And non-seAsonAl workers, by reGion
0
20
40
60
80
100
Seasonal (Ordu)
Seasonal (Duzce-Sakarya)
Non-seasonal (Ordu)
36.4%
100.0%
29.9%
63.6% 65.7%
4.5%
1-2 Times 3-4 Times >5 Times
11 hours per day Work hours beyond the legal
regular hours limit is rampant.
Days of Work per WeekRespondents indicated that 7-day work weeks
were nearly universal. Only 9 percent of non-
seasonal Eastern Region workers worked
5-day weeks. Combined with work days that
were longer than the legal regular work hour
limits leads to the conclusion that excessive
working time was rampant in hazelnut
harvesting.
breaks per DayWestern Region seasonal workers took more
breaks per day compared to Eastern Region
non-seasonal workers. This is likely related to
the longer hours worked by these workers.
Hazelnut Workers in turkey: Demographic Profiling; Duzce, ordu, & sakarya; 2016
www.fairlabor.org 36
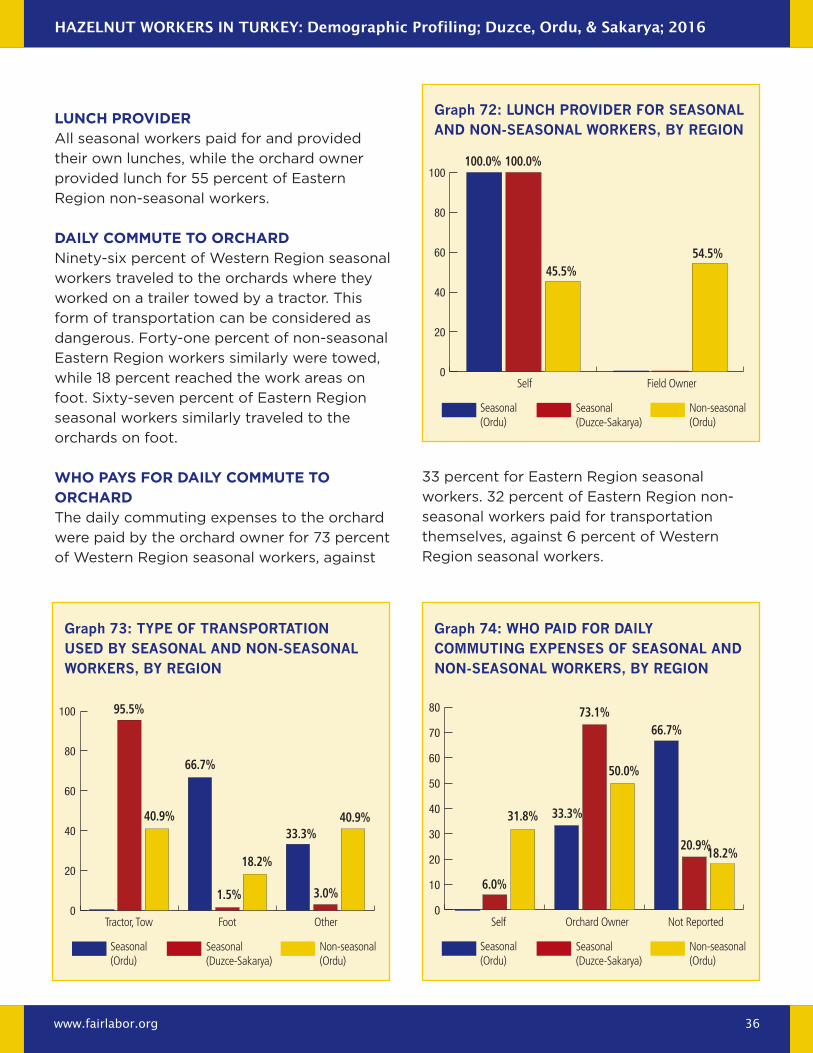
lunCH proViDerAll seasonal workers paid for and provided
their own lunches, while the orchard owner
provided lunch for 55 percent of Eastern
Region non-seasonal workers.
Daily Commute to orCHarDNinety-six percent of Western Region seasonal
workers traveled to the orchards where they
worked on a trailer towed by a tractor. This
form of transportation can be considered as
dangerous. Forty-one percent of non-seasonal
Eastern Region workers similarly were towed,
while 18 percent reached the work areas on
foot. Sixty-seven percent of Eastern Region
seasonal workers similarly traveled to the
orchards on foot.
WHo pays for Daily Commute to orCHarDThe daily commuting expenses to the orchard
were paid by the orchard owner for 73 percent
of Western Region seasonal workers, against
33 percent for Eastern Region seasonal
workers. 32 percent of Eastern Region non-
seasonal workers paid for transportation
themselves, against 6 percent of Western
Region seasonal workers.
Graph 72: lunch provider for seAsonAl And non-seAsonAl workers, by reGion
Graph 73: type of trAnsportAtion used by seAsonAl And non-seAsonAl workers, by reGion
Graph 74: who pAid for dAily coMMutinG expenses of seAsonAl And non-seAsonAl workers, by reGion
0
20
40
60
80
100
0
20
40
60
80
100
0
10
20
30
40
50
60
70
80
Seasonal (Ordu)
Seasonal (Ordu)
Seasonal (Ordu)
Seasonal (Duzce-Sakarya)
Seasonal (Duzce-Sakarya)
Seasonal (Duzce-Sakarya)
Non-seasonal (Ordu)
Non-seasonal (Ordu)
Non-seasonal (Ordu)
18.2%
66.7%
40.9%
50.0%
1.5%
33.3%
45.5%
6.0%
31.8%
100.0% 100.0%
95.5% 73.1%
33.3%
3.0%
66.7%
54.5%
40.9%
20.9%18.2%
Self
Tractor, Tow SelfFoot Orchard Owner
Field Owner
Other Not Reported
Hazelnut Workers in turkey: Demographic Profiling; Duzce, ordu, & sakarya; 2016
www.fairlabor.org 37
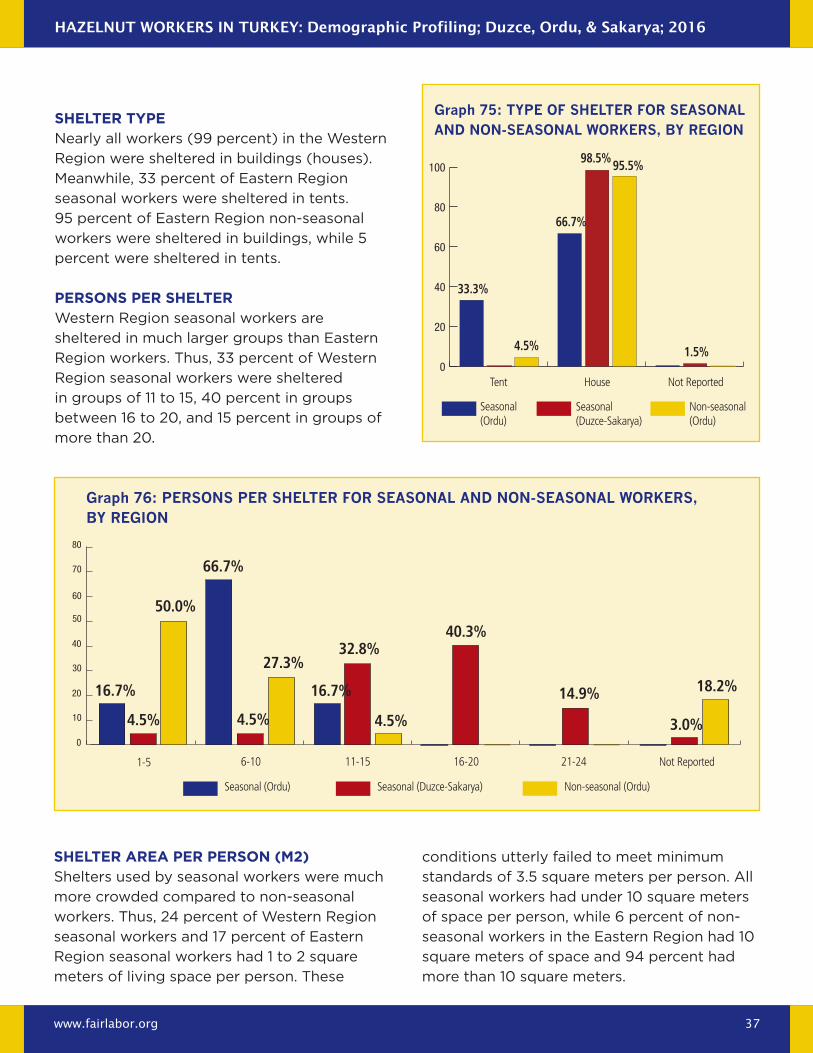
sHelter typeNearly all workers (99 percent) in the Western
Region were sheltered in buildings (houses).
Meanwhile, 33 percent of Eastern Region
seasonal workers were sheltered in tents.
95 percent of Eastern Region non-seasonal
workers were sheltered in buildings, while 5
percent were sheltered in tents.
persons per sHelterWestern Region seasonal workers are
sheltered in much larger groups than Eastern
Region workers. Thus, 33 percent of Western
Region seasonal workers were sheltered
in groups of 11 to 15, 40 percent in groups
between 16 to 20, and 15 percent in groups of
more than 20.
Graph 75: type of shelter for seAsonAl And non-seAsonAl workers, by reGion
0
20
40
60
80
100
Seasonal (Ordu)
Seasonal (Duzce-Sakarya)
Non-seasonal (Ordu)
95.5%
33.3%
4.5%
66.7%
98.5%
1.5%
Tent House Not Reported
Graph 76: persons per shelter for seAsonAl And non-seAsonAl workers, by reGion
1-5 6-10 11-15 16-20 21-24 Not Reported
0
10
20
30
40
50
60
70
80
27.3%
40.3%32.8%
14.9%
3.0%
18.2%16.7%
4.5% 4.5% 4.5%
66.7%
50.0%
16.7%
Seasonal (Ordu) Seasonal (Duzce-Sakarya) Non-seasonal (Ordu)
sHelter area per person (m2)Shelters used by seasonal workers were much
more crowded compared to non-seasonal
workers. Thus, 24 percent of Western Region
seasonal workers and 17 percent of Eastern
Region seasonal workers had 1 to 2 square
meters of living space per person. These
conditions utterly failed to meet minimum
standards of 3.5 square meters per person. All
seasonal workers had under 10 square meters
of space per person, while 6 percent of non-
seasonal workers in the Eastern Region had 10
square meters of space and 94 percent had
more than 10 square meters.
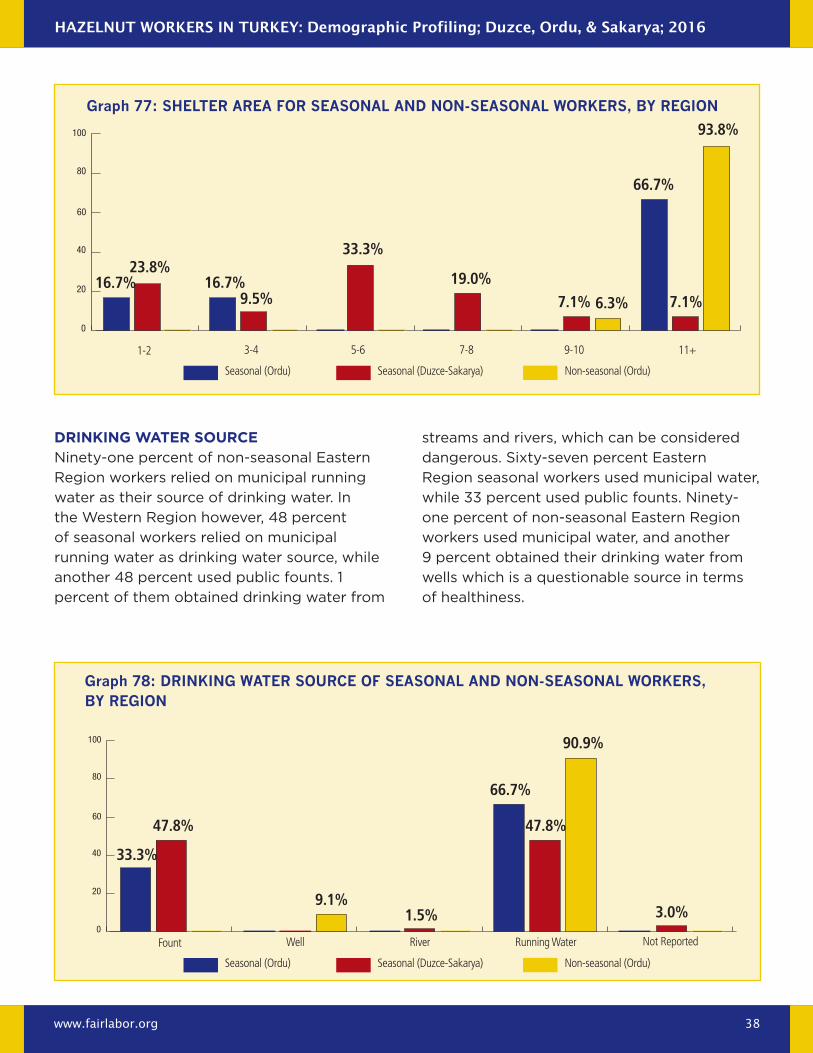
Hazelnut Workers in turkey: Demographic Profiling; Duzce, ordu, & sakarya; 2016
www.fairlabor.org 38
Graph 77: shelter AreA for seAsonAl And non-seAsonAl workers, by reGion
1-2 3-4 5-6 7-8 9-10 11+
0
20
40
60
80
100
6.3%7.1%
33.3%
66.7%
7.1%
93.8%
16.7%23.8%
9.5%19.0%16.7%
Seasonal (Ordu) Seasonal (Duzce-Sakarya) Non-seasonal (Ordu)
DrinkinG Water sourCeNinety-one percent of non-seasonal Eastern
Region workers relied on municipal running
water as their source of drinking water. In
the Western Region however, 48 percent
of seasonal workers relied on municipal
running water as drinking water source, while
another 48 percent used public founts. 1
percent of them obtained drinking water from
streams and rivers, which can be considered
dangerous. Sixty-seven percent Eastern
Region seasonal workers used municipal water,
while 33 percent used public founts. Ninety-
one percent of non-seasonal Eastern Region
workers used municipal water, and another
9 percent obtained their drinking water from
wells which is a questionable source in terms
of healthiness.
Graph 78: drinkinG wAter source of seAsonAl And non-seAsonAl workers, by reGion
Fount Well River Running Water Not Reported0
20
40
60
80
100
1.5%
90.9%
3.0%
47.8%
66.7%
33.3%
47.8%
9.1%
Seasonal (Ordu) Seasonal (Duzce-Sakarya) Non-seasonal (Ordu)
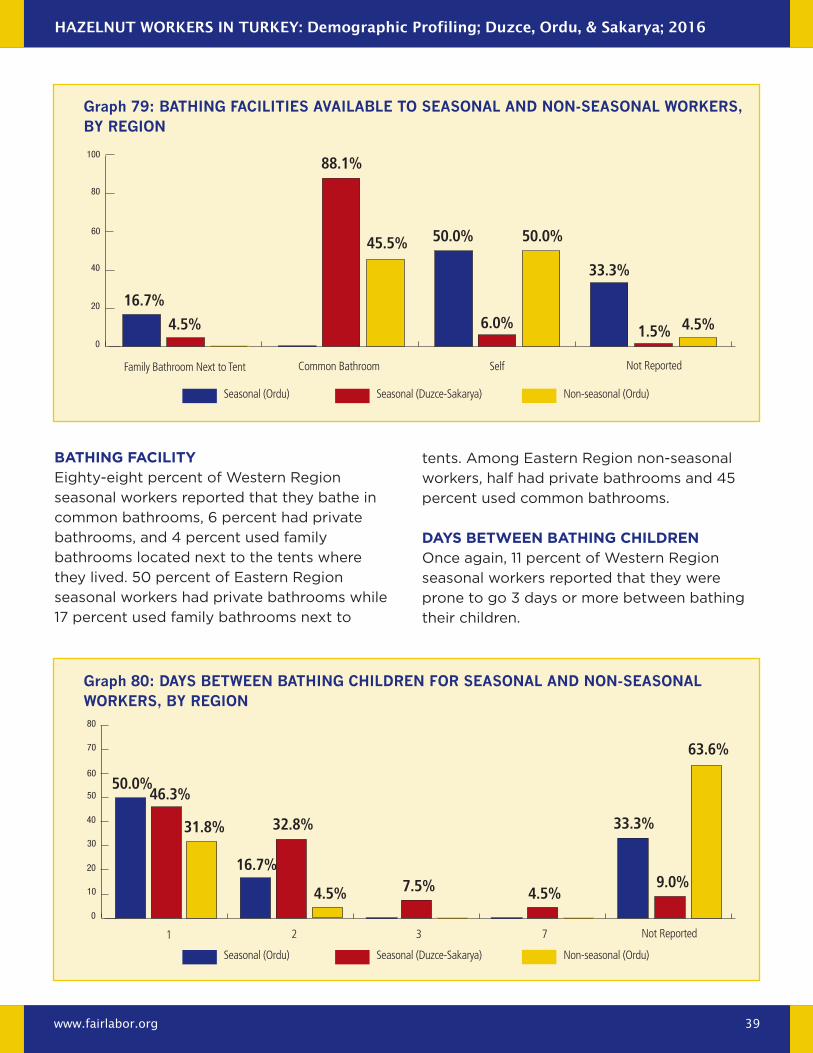
Hazelnut Workers in turkey: Demographic Profiling; Duzce, ordu, & sakarya; 2016
www.fairlabor.org 39
Graph 79: bAthinG fAcilities AvAilAble to seAsonAl And non-seAsonAl workers, by reGion
Family Bathroom Next to Tent Common Bathroom Self Not Reported
0
20
40
60
80
100
45.5%
33.3%
4.5%1.5%6.0%
50.0% 50.0%
16.7%
4.5%
88.1%
Seasonal (Ordu) Seasonal (Duzce-Sakarya) Non-seasonal (Ordu)
batHinG faCilityEighty-eight percent of Western Region
seasonal workers reported that they bathe in
common bathrooms, 6 percent had private
bathrooms, and 4 percent used family
bathrooms located next to the tents where
they lived. 50 percent of Eastern Region
seasonal workers had private bathrooms while
17 percent used family bathrooms next to
tents. Among Eastern Region non-seasonal
workers, half had private bathrooms and 45
percent used common bathrooms.
Days betWeen batHinG CHilDrenOnce again, 11 percent of Western Region
seasonal workers reported that they were
prone to go 3 days or more between bathing
their children.
Graph 80: dAys between bAthinG children for seAsonAl And non-seAsonAl workers, by reGion
1 2 3 7 Not Reported
0
10
20
30
40
50
60
70
80
7.5%
63.6%
9.0%
33.3%
4.5%
50.0%46.3%
31.8% 32.8%
4.5%
16.7%
Seasonal (Ordu) Seasonal (Duzce-Sakarya) Non-seasonal (Ordu)
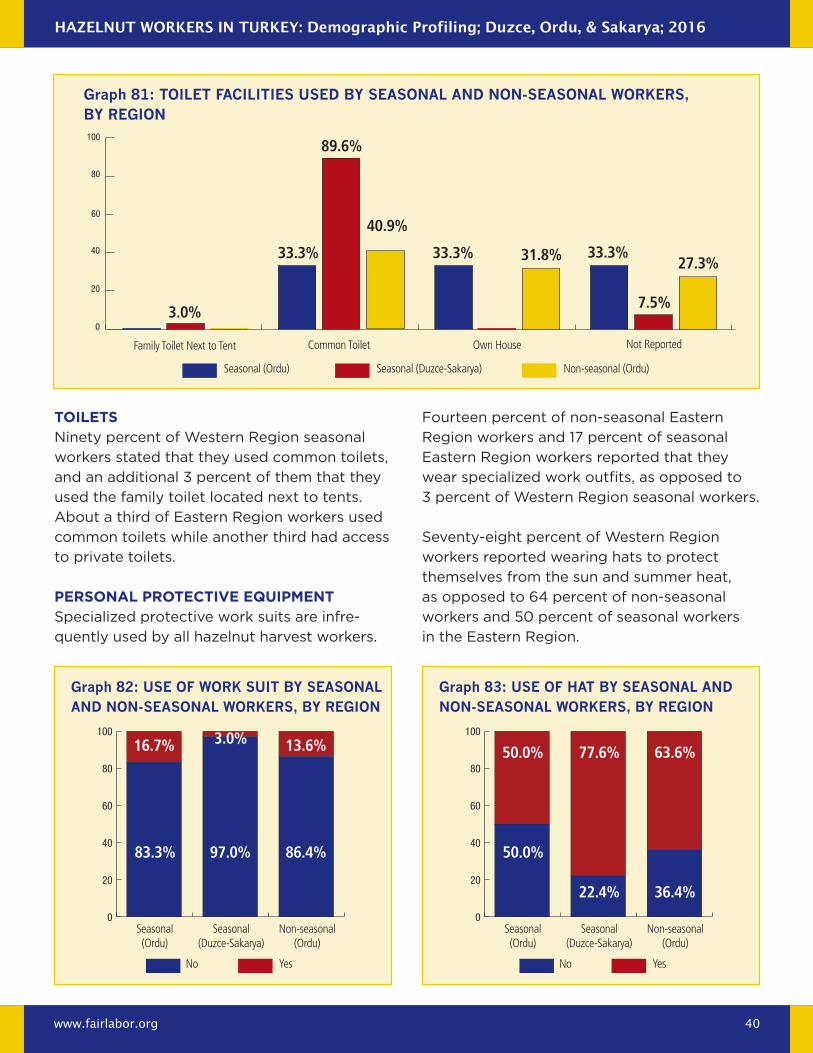
Hazelnut Workers in turkey: Demographic Profiling; Duzce, ordu, & sakarya; 2016
www.fairlabor.org 40
Graph 81: toilet fAcilities used by seAsonAl And non-seAsonAl workers, by reGion
Family Toilet Next to Tent Common Toilet Own House Not Reported
0
20
40
60
80
100
40.9%
33.3%27.3%
7.5%
33.3% 31.8%33.3%
3.0%
89.6%
Seasonal (Ordu) Seasonal (Duzce-Sakarya) Non-seasonal (Ordu)
Graph 82: use of work suit by seAsonAl And non-seAsonAl workers, by reGion
Graph 83: use of hAt by seAsonAl And non-seAsonAl workers, by reGion
0
20
40
60
80
100
0
20
40
60
80
100
16.7% 50.0%
97.0%
22.4%
86.4%
36.4%
13.6% 63.6%3.0%
77.6%
83.3% 50.0%
Seasonal (Ordu)
Seasonal (Ordu)
Seasonal (Duzce-Sakarya)
Seasonal (Duzce-Sakarya)
Non-seasonal (Ordu)
Non-seasonal (Ordu)
No NoYes Yes
toiletsNinety percent of Western Region seasonal
workers stated that they used common toilets,
and an additional 3 percent of them that they
used the family toilet located next to tents.
About a third of Eastern Region workers used
common toilets while another third had access
to private toilets.
personal proteCtiVe equipmentSpecialized protective work suits are infre-
quently used by all hazelnut harvest workers.
Fourteen percent of non-seasonal Eastern
Region workers and 17 percent of seasonal
Eastern Region workers reported that they
wear specialized work outfits, as opposed to
3 percent of Western Region seasonal workers.
Seventy-eight percent of Western Region
workers reported wearing hats to protect
themselves from the sun and summer heat,
as opposed to 64 percent of non-seasonal
workers and 50 percent of seasonal workers
in the Eastern Region.
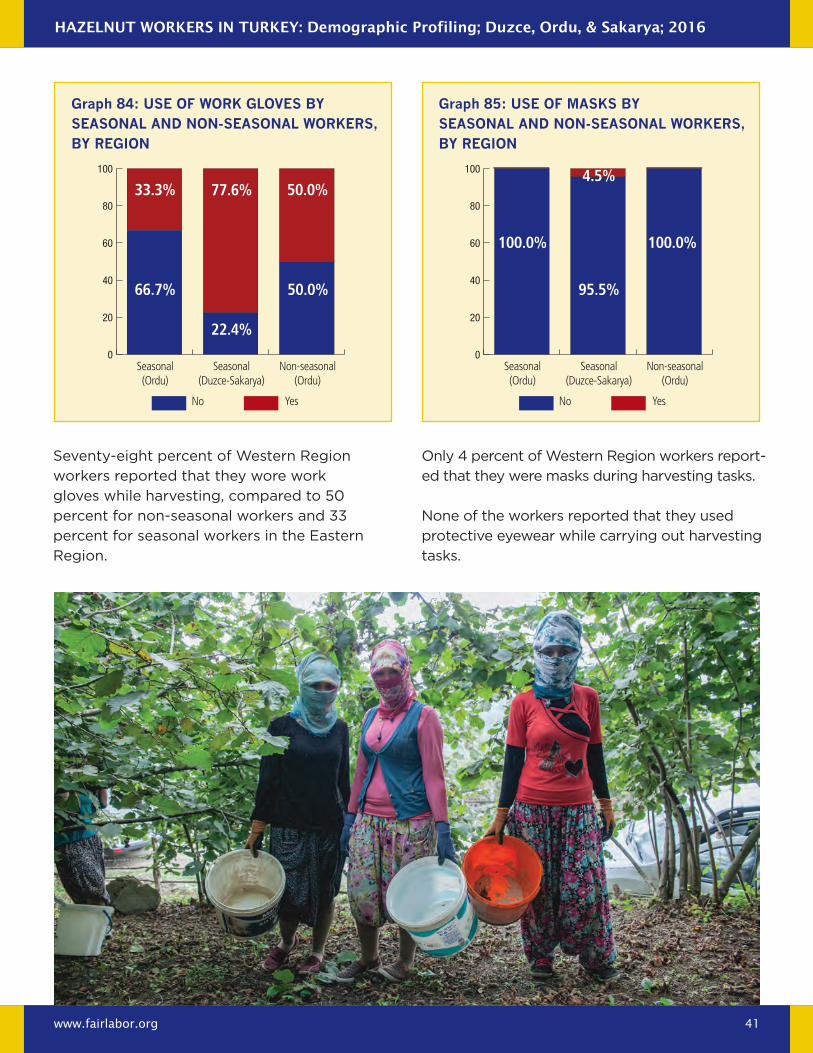
Hazelnut Workers in turkey: Demographic Profiling; Duzce, ordu, & sakarya; 2016
www.fairlabor.org 41
Graph 84: use of work Gloves by seAsonAl And non-seAsonAl workers, by reGion
Graph 85: use of MAsks by seAsonAl And non-seAsonAl workers, by reGion
0
20
40
60
80
100
0
20
40
60
80
100
50.0%
22.4%
95.5%66.7%
33.3% 77.6%4.5%
50.0%
100.0% 100.0%
Seasonal (Ordu)
Seasonal (Ordu)
Seasonal (Duzce-Sakarya)
Seasonal (Duzce-Sakarya)
Non-seasonal (Ordu)
Non-seasonal (Ordu)
No NoYes Yes
Seventy-eight percent of Western Region
workers reported that they wore work
gloves while harvesting, compared to 50
percent for non-seasonal workers and 33
percent for seasonal workers in the Eastern
Region.
Only 4 percent of Western Region workers report-
ed that they were masks during harvesting tasks.
None of the workers reported that they used
protective eyewear while carrying out harvesting
tasks.
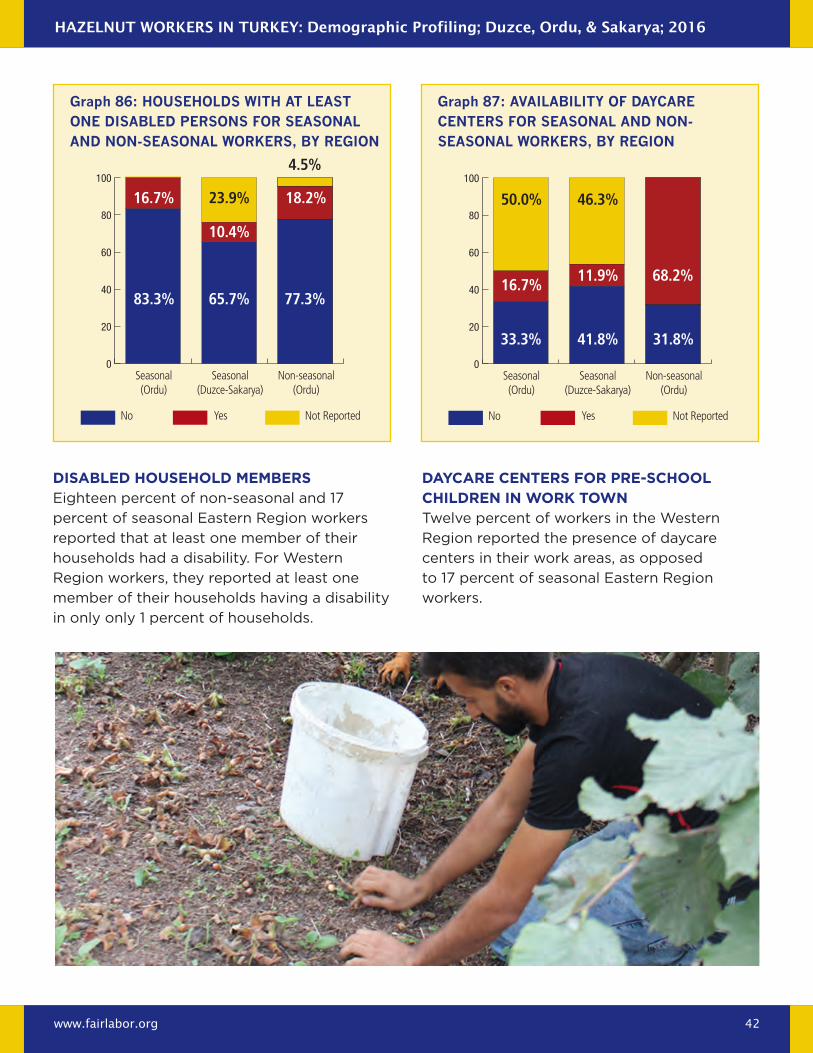
Hazelnut Workers in turkey: Demographic Profiling; Duzce, ordu, & sakarya; 2016
www.fairlabor.org 42
DisableD HouseHolD membersEighteen percent of non-seasonal and 17
percent of seasonal Eastern Region workers
reported that at least one member of their
households had a disability. For Western
Region workers, they reported at least one
member of their households having a disability
in only only 1 percent of households.
DayCare Centers for pre-sCHool CHilDren in Work toWnTwelve percent of workers in the Western
Region reported the presence of daycare
centers in their work areas, as opposed
to 17 percent of seasonal Eastern Region
workers.
Graph 87: AvAilAbility of dAycAre centers for seAsonAl And non-seAsonAl workers, by reGion
0
20
40
60
80
100
50.0%
41.8%
11.9%
31.8%
68.2%
46.3%
16.7%
33.3%
Seasonal (Ordu)
Seasonal (Duzce-Sakarya)
Non-seasonal (Ordu)
No Yes Not Reported
Graph 86: households with At leAst one disAbled persons for seAsonAl And non-seAsonAl workers, by reGion
0
20
40
60
80
100
16.7%
65.7%
10.4%
77.3%
18.2%23.9%
4.5%
83.3%
Seasonal (Ordu)
Seasonal (Duzce-Sakarya)
Non-seasonal (Ordu)
No Yes Not Reported