harvesting sector beta through broad sector indices
TRANSCRIPT
msci.com
Research Insight
Harvesting Sector Beta through Broad Sector Indices
Abhishek Gupta
Raman Aylur Subramanian
October 2013

MSCI Index Research msci.com © 2013 MSCI Inc. All rights reserved. Please refer to the disclaimer at the end of this document
Research Insight Harvesting Sector Beta through Broad Sector Indices
October 2013
2 of 16
Contents
Contents ................................................. ..................................... 2
Executive Summary ................................................................... 3
Section I: Global All Caps: The New Investable Equity Opportunity Set? ....................................................... 4
Section II: Why Sector Investing? .............................................. 6
All Cap Sector Investing .............................................................................................. 7
Section III: Sector Biases: An Opportunity ................................ 9
Fundamental Biases ................................................................................................... 9
Style Biases................................................................................................................... 9
Geographical Biases ................................................................................................ 10
Asynchronous Performance Cycles ........................................................................ 11
Section IV: Harvesting Sector Beta in Asset Allocation ........... 12
Section V: Conclusion ............................................................... 14
References ................................................................................ 15
Client Service Information is Available 24 Hours a Day ....................................... 16
Notice and Disclaimer .............................................................................................. 16
About MSCI ............................................................................................................... 16

MSCI Index Research msci.com © 2013 MSCI Inc. All rights reserved. Please refer to the disclaimer at the end of this document
Research Insight Harvesting Sector Beta through Broad Sector Indices
October 2013
3 of 16
Executive Summary The globalization of economies and the integration of capital markets have changed the landscape for equity investing. Institutional investors are increasingly investing in equities in both developed and emerging markets, and in large, mid and small cap stocks. With the accessibility to foreign markets continuing to rise and with trading costs falling, this “all cap” universe may now be the potential default investable opportunity set for many long-term institutional investors. Historically, institutional investors looked primarily to domestic large cap stocks because of their relative liquidity, accessibility and visibility. They were also thought to provide sufficient representation of a given market. However, over time, investors have increasingly recognized that a broader mix of stocks, including international, emerging markets, and small cap stocks have provided return, risk, and diversification benefits compared with narrower portfolios. Global institutional investors have, instead, begun to start with an “all cap” global universe from which to form policy portfolios and select mandates. This paper extends our understanding of global all caps to sector investing. Of late, sector-based approaches have caught the attention of institutional investors due to the significant role that global sectors/industries have played in driving the cross-section of security returns in developed markets. This paper explores how sector beta can be harvested through broad, i.e., all cap sector indices. Some sectors have a very significant representation in small caps and their inclusion goes some way to rectifying the biases which can arise from unconsciously underweighting small caps. We further discuss the various fundamental, style, geographical and performance biases that exist within sectors and the opportunities they present to investors. This paper is organized in the following sections. Section I lays out the foundation of global investing across all size segments and draws attention to the associated “small cap premium”. Section II highlights the rationale behind investing in sectors and their growing importance in the equity portfolio allocation space. It also illustrates how inclusion of small caps in Sector Indices has historically delivered superior performance. Section III discusses the biases that exist within sectors while Section IV presents uses for sector indices in asset allocation. Section V concludes.

MSCI Index Research msci.com © 2013 MSCI Inc. All rights reserved. Please refer to the disclaimer at the end of this document
Research Insight Harvesting Sector Beta through Broad Sector Indices
October 2013
4 of 16
Section I: Global All Caps: The New Investable Equity Opportunity Set? The globalization of economies and the integration of capital markets have changed the landscape for equity investing. Institutional investors are increasingly investing in equities in both developed and emerging markets, and in large, mid and small cap stocks. With accessibility to foreign markets continuing to rise and with trading costs falling, this all cap universe may now be the potential investable opportunity set for many long-term institutional investors. For most institutional investors, adopting a global all cap universe generally requires adding global small caps to their global large and mid cap equity allocations. Institutional investors who have moved to a global all cap approach may also subscribe to the investment belief that smaller companies should earn a risk premium over larger ones. The performance of small caps has been widely studied by academics and practitioners since the 1980s. Fama and French (1993) originally demonstrated that small caps have higher systematic risk which earns them a higher return premium. Another line of reasoning is that small caps are mispriced by investors due to behavioral biases (Lakonishok, Shleifer, and Vishny (1994)). These results are intriguing and await confirmation using a full range of investable stocks and practical investment criteria. Further research and practical experience have increasingly caused many institutional investors to include small caps in their global equity portfolios. This trend is underscored by the following considerations:
Historical Small Cap Premium: Investable small cap stocks have outperformed large and mid caps over the last decade and a half (8.4% gross annualized total return for the MSCI ACWI Small Cap Index compared to 2.4% for the MSCI ACWI Index, July 1998 – July 2013).
Diversification Potential: Because large cap, mid cap and small cap segments can experience swings in performance but not always at the same time, an all cap index may smooth out performance and provide additional diversification. Moreover, an all cap index can potentially capture the market’s true diversity through more economic sector representation.
Wider Spectrum of Opportunities: Investing across all cap segments reflects a more complete opportunity set, providing greater exposure to the equity risk premium. Also, an all cap approach allows an investor to hold stocks that may potentially grow from small to large cap over time.
More Access and Lower Costs: Small caps, once viewed as expensive to trade and illiquid, have become much less so today (see MSCI paper, ‘Small Caps – No Small Oversight’ (2012)). Although small caps generally remain less accessible and have higher transaction costs than large and mid caps, in many cases these accessibility issues appear to have eased over time as markets and trading environments have evolved.
Exhibit 1 shows the historical returns of certain flagship MSCI Standard Indices (which include only large and mid caps) in comparison to the corresponding MSCI Investable Market Indices (which include large, mid and small caps). Because of higher returns to small caps across the globe in the last decade and a half, the MSCI Investable Market Indices (MSCI ACWI IMI, MSCI ACWI ex USA IMI, MSCI EAFE IMI, MSCI Emerging Markets IMI, and MSCI USA IMI) earned superior returns and higher return-to-risk ratios than their large and mid cap counterparts.

MSCI Index Research msci.com © 2013 MSCI Inc. All rights reserved. Please refer to the disclaimer at the end of this document
Research Insight Harvesting Sector Beta through Broad Sector Indices
October 2013
5 of 16
Exhibit 1: Performance of MSCI Investable Market Indices (Large, Mid and Small Cap) versus MSCI Standard (Large and Mid Cap) Indices (July 1998- Jul 2013)
Exhibit 2 compares the performance of MSCI Small Cap Indices relative to the MSCI Standard (Large and Mid Cap) Indices. While significant and positive over the long run, the small cap premium has appreciable short-term volatility, and its exact size varies from market to market and over different time periods. Small caps experienced strong outperformance in the 2000s but not in the 1990s. Looking at just the past decade, the premium has been substantial. Exhibit 2: Performance of Different Cap Segments Can Be Cyclical—Cumulative USD Gross Returns of MSCI Small Cap Indices Relative to MSCI Standard Indices in Various Regions (May 1994-July 2013)

MSCI Index Research msci.com © 2013 MSCI Inc. All rights reserved. Please refer to the disclaimer at the end of this document
Research Insight Harvesting Sector Beta through Broad Sector Indices
October 2013
6 of 16
Section II: Why Sector Investing? Investors have traditionally made global equity portfolio allocations around conventional factors such as countries and regions, and fundamental style factors such as size, value, volatility and momentum. While such factors continue to be dominant in equity portfolio allocations, more recently, investors with views and opinions on the macro-economic environment and the linkages between macro-cycle and sector performance have transformed their views into actual investments using sector funds. The relative strength of country, style and sector effects plays a pivotal role in equity portfolio allocation decisions. One approach to determine the strength of these factors is through cross-sectional volatility (CSV). Cross-sectional volatility (CSV) is defined as the standard deviation of a set of asset returns over a period. This dispersion measure is of fundamental importance, as it represents the opportunity set for active portfolio management. For instance, if the dispersion of stock returns is very small, then all stocks behave similarly and there is little opportunity to outperform the market. Conversely, when CSV levels are high, performance differences among active managers are more pronounced, as shown by Ankrim and Ding (2002). Menchero and Morozov (2011) studied the contributions to CSV coming from countries, styles and industries. Exhibit 3 reveals that for Developed Markets, countries dominated industries from 1997 to 1999. From 1999 to 2003, however, the situation reversed, with industries dominating countries. From 2003 to 2009, both countries and industries were comparable and dominated style. As for Emerging Markets, country is the most dominant factor, though that trend is on the decline. In essence, while sectors are less important return drivers in the Emerging Markets, they are significant factors in Developed Markets. Exhibit 3: Cross Sectional Volatility: Percentage Contribution of Style, Country and Industry
Some of the reasons why institutional investors have increasingly invested in sectors include:
Firstly, historically different sectors have thrived in different stages of the business cycle (see Stovall (1996) and Bernstein (1995)). While some sectors have been pro-cyclical with their growth and slowdown periods synchronized with business cycle peaks and troughs, other sectors have behaved more defensively. For example, Consumer Staples has historically acted defensively in volatile markets and performed better than most cyclical sectors during recessionary periods. Conversely, Information Technology has historically exhibited growth characteristics and performed well during economic

MSCI Index Research msci.com © 2013 MSCI Inc. All rights reserved. Please refer to the disclaimer at the end of this document
Research Insight Harvesting Sector Beta through Broad Sector Indices
October 2013
7 of 16
expansions. Some investors believe such differences present a multitude of alpha seeking investment strategies for Global equity portfolio managers who have views on the macro-economic environment. Secondly, low correlation among sectors, particularly between cyclical and defensive, provides the potential for substantial diversification benefits. Thirdly, historically sector composition has been very stable as the sector classification of a company changes only when the company’s operations undergo significant change. Consequently, sectors have also experienced low turnover. MSCI Sector Indices are based on the Global Industry Classification Standard (GICS®)1 that was developed in 1999 by MSCI and Standard & Poor’s to provide an efficient, detailed and flexible investment tool to capture the breadth, depth and evolution of industry sectors. GICS was designed to meet the need for an accurate, complete and standard industry definition. The GICS standard is representative of the equity universe and has been widely accepted as an industry analysis framework for investment research, portfolio management and asset allocation. One of the drawbacks of pure sector investing, however, is the reduced opportunity set, in comparison to investing in all stocks. However, several investors believe that in the context of the equity portfolio allocation process, sectors overcome this drawback, and provide substantial benefits, mainly arising from low correlation with other components of the equity allocation framework.
All Cap Sector Investing
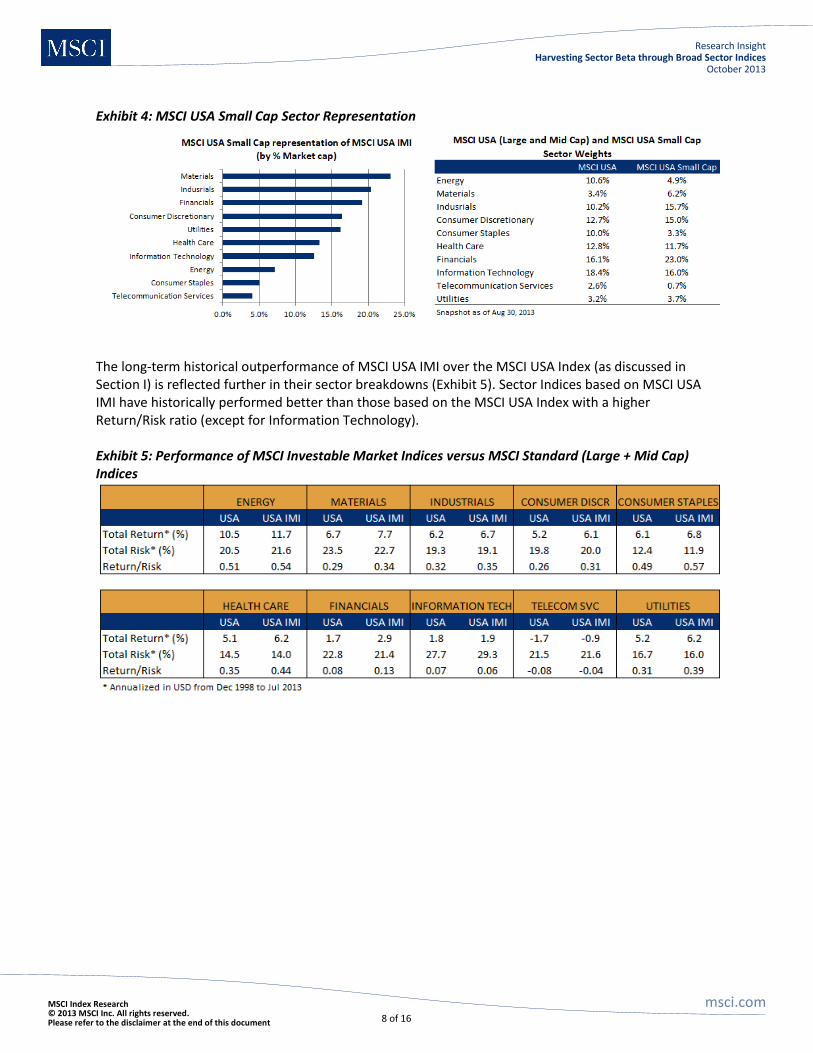
The MSCI paper, ‘Small Caps – No Small Oversight’ (2012), reviews the significance of small caps in institutional portfolios. As of August 30 2013, small caps represented 14.3% of MSCI USA IMI, with some sectors having higher small cap representation than others (Exhibit 4). Small caps also had higher representation in cyclical sectors such as Materials, Industrials and Consumer Discretionary. On the other hand, sectors that employ economies of scale such as Energy, Consumer Staples and Telecommunication Services had lower small cap representation. Moreover, within sectors, there are important industry-level differences. For instance, as of Aug 30, 2013, in Health Care, pharmaceutical companies are tilted towards large caps, while biotech companies are tilted towards small caps. Within Financials, diversified financials are tilted towards large caps, while real estate firms are tilted towards small caps. Small caps also tend to be overweight cyclical sectors (Consumer Discretionary, Industrials, Materials) and underweight defensives (Health Care, Telecommunication Services, Consumer Staples).
These tilts can have significant return implications during different phases of the business cycle.
1 The GICS structure includes 10 sectors, 24 industry groups, 68 industries and 154 sub-industries.
MSCI Index Research msci.com © 2013 MSCI Inc. All rights reserved. Please refer to the disclaimer at the end of this document
Research Insight Harvesting Sector Beta through Broad Sector Indices
October 2013
8 of 16
Exhibit 4: MSCI USA Small Cap Sector Representation
The long-term historical outperformance of MSCI USA IMI over the MSCI USA Index (as discussed in Section I) is reflected further in their sector breakdowns (Exhibit 5). Sector Indices based on MSCI USA IMI have historically performed better than those based on the MSCI USA Index with a higher Return/Risk ratio (except for Information Technology). Exhibit 5: Performance of MSCI Investable Market Indices versus MSCI Standard (Large + Mid Cap) Indices

MSCI Index Research msci.com © 2013 MSCI Inc. All rights reserved. Please refer to the disclaimer at the end of this document
Research Insight Harvesting Sector Beta through Broad Sector Indices
October 2013
9 of 16
Section III: Sector Biases: An Opportunity Managing biases within sectors is both a challenge and a potential opportunity for portfolio managers. Portfolio managers and investors who allocate across sectors may use information on sector biases in deciding how much and when to allocate capital. Some may try to achieve a balance of stocks with different characteristics across sectors when they do not have a view on the desirability of a particular characteristic, while others may seek to exploit opportunities presented by these biases. For example, investors who believe that fundamental sector valuations (e.g., Price/Earnings) are unreasonably far below their long-term average may wish to overweight that sector. Likewise, an investor who believes that momentum will be a key driver to equity performance may consider overweighting sectors that have high exposure to the Momentum factor. Other biases include geographical and asynchronous performance cycles.
Fundamental Biases Most institutional investors are familiar with the main differences between sectors. Broadly speaking, Information Technology stocks, on an average, had higher Price/Earnings ratios whereas these were lower for Energy and Utilities stocks during May 1994 to July 2013 (Exhibit 6). Financials and Utilities historically carried higher leverage. In recessionary periods, non-cyclical segments such as food and beverages, home products, and other consumer staples tend to hold up and have stable earnings and cash flows relative to cyclical industries. A few examples of sector differences are shown in Exhibit 6. Exhibit 6: Fundamental Characteristics Differ among Sectors
Style Biases Systematic risk premia such as value, size or momentum can account for a substantial part of long-term institutional portfolio performance, (see Briand, Melas & Urwin (2011)). Several indices have been developed over the last few years to capture such systematic risk premia. However, risk premia or their combinations may also be captured to some extent through sector indices. Exhibit 7 shows sector exposures to various style factors in the Barra Global Equity Model (GEM2). We can see some clear differences between the sectors as of May 2013: for example, as measured by the Volatility factor, Consumer Staples and Utilities are the most defensive sectors, whereas Materials has

MSCI Index Research msci.com © 2013 MSCI Inc. All rights reserved. Please refer to the disclaimer at the end of this document
Research Insight Harvesting Sector Beta through Broad Sector Indices
October 2013
10 of 16
the highest exposure. Consumer Discretionary and Information Technology rank highest is their exposures to the Growth and Liquidity factors.
Exhibit 7: MSCI USA IMI: Active Style Factor Exposures, Barra Global Equity Model (GEM2) (May 31, 2013)
However, sector factor exposures can change significantly over time. For instance, at the beginning of an industry’s life cycle, the industry can have positive exposure to growth and leverage and negative exposure to dividend yield and value. As industries mature, these exposures can drift (for example, the exposure of the Wireless Telecom industry to the Growth factor peaked at 4.1 in January 1990 but fell to 0.5 by May 2010). Snapshots like Exhibits 6 & 7 can be helpful for asset managers. However, to execute more complex analyses, such as identifying how much return or risk is derived from a particular characteristic, this information needs to be supplemented. Factor exposures can be used with the model’s estimated factor returns to help quantify a sector’s return due to the common factors. This exercise, called return attribution, enables a manager to see the part of return that arose from each bias.
Geographical Biases With continued trends in globalization, many companies increasingly operate across several countries and regions. Consequently, their revenues may be exposed to economic activity in many regions other than their home country. Sector attributes often drive the extent to which revenues are derived from business operations outside of the home country. While some sectors operate across several countries, others are more domestically oriented. Exhibit 8 presents the exposure of the MSCI USA IMI Sector Indices to various geographic segments as of July 2013. Materials, Information Technology and Consumer Staples had higher exposure to Emerging Markets (EM) while more domestically oriented sectors such as Financials, Telecom and Utilities had significantly lower EM exposure.
Exhibit 8: MSCI USA IMI Sector Indices Economic Exposure (%)

MSCI Index Research msci.com © 2013 MSCI Inc. All rights reserved. Please refer to the disclaimer at the end of this document
Research Insight Harvesting Sector Beta through Broad Sector Indices
October 2013
11 of 16
Asynchronous Performance Cycles Sectors can go through long, sometimes multi-year, periods of out- and underperformance (Exhibit 9). For instance, during the period between 2000 and 2001, while the Information Technology sector underperformed as a result of the ‘Technology Bust’, other sectors such as Financials and Consumer Staples outperformed MSCI USA IMI. Between 2006 and 2008, while Energy outperformed, Financials underperformed MSCI USA IMI. Cyclicality in performance as well as asynchronous performance cycles of various sector indices over different parts of the business and macro cycles provide the potential for diversification. Exhibit 9: MSCI USA IMI Sector Indices Offer Diversification Benefits— Cumulative Relative Returns (May 1994 to Jul 2013)
The potential for diversification can be further seen in the correlations between monthly active returns shown in Exhibit 10. Notably, the active returns of Information Technology, Telecommunication Services and Consumer Discretionary had very low or negative correlation with the other MSCI USA IMI Sector Indices during the observed period. Exhibit 10: Active Return Correlation for MSCI USA IMI Sector Indices (May 1994 to Jul 2013)
MSCI Index Research msci.com © 2013 MSCI Inc. All rights reserved. Please refer to the disclaimer at the end of this document
Research Insight Harvesting Sector Beta through Broad Sector Indices
October 2013
12 of 16
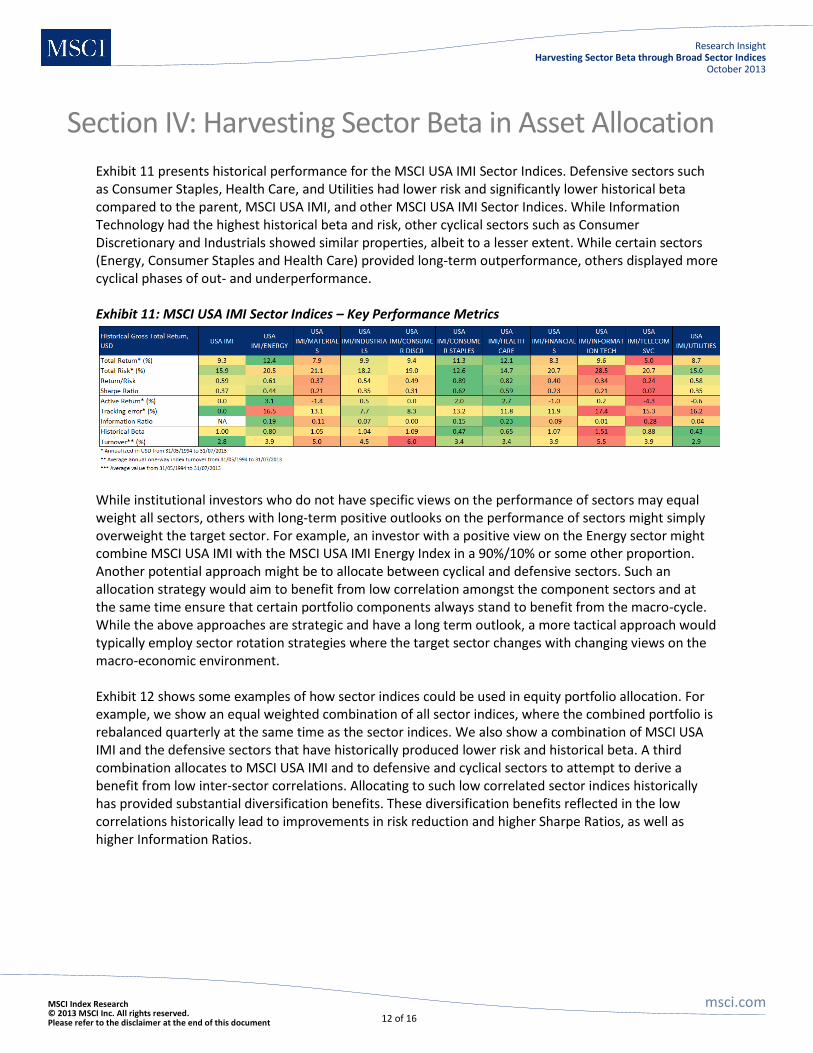
Section IV: Harvesting Sector Beta in Asset Allocation Exhibit 11 presents historical performance for the MSCI USA IMI Sector Indices. Defensive sectors such as Consumer Staples, Health Care, and Utilities had lower risk and significantly lower historical beta compared to the parent, MSCI USA IMI, and other MSCI USA IMI Sector Indices. While Information Technology had the highest historical beta and risk, other cyclical sectors such as Consumer Discretionary and Industrials showed similar properties, albeit to a lesser extent. While certain sectors (Energy, Consumer Staples and Health Care) provided long-term outperformance, others displayed more cyclical phases of out- and underperformance. Exhibit 11: MSCI USA IMI Sector Indices – Key Performance Metrics
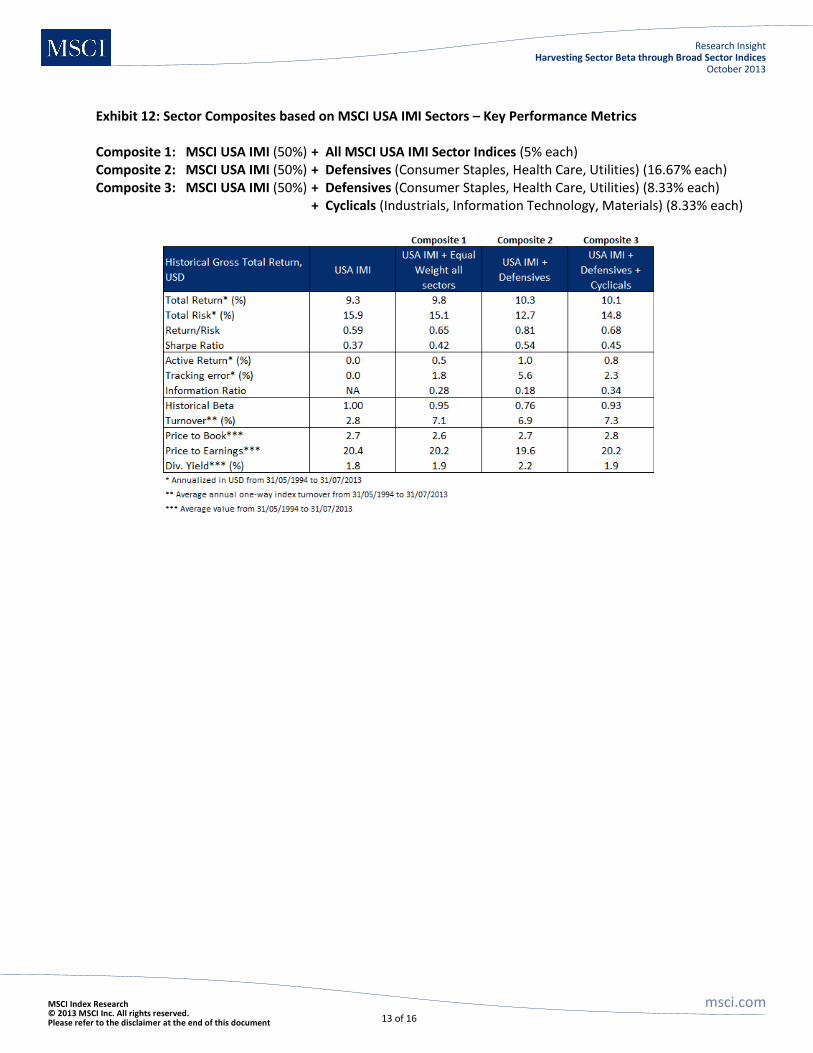
While institutional investors who do not have specific views on the performance of sectors may equal weight all sectors, others with long-term positive outlooks on the performance of sectors might simply overweight the target sector. For example, an investor with a positive view on the Energy sector might combine MSCI USA IMI with the MSCI USA IMI Energy Index in a 90%/10% or some other proportion. Another potential approach might be to allocate between cyclical and defensive sectors. Such an allocation strategy would aim to benefit from low correlation amongst the component sectors and at the same time ensure that certain portfolio components always stand to benefit from the macro-cycle. While the above approaches are strategic and have a long term outlook, a more tactical approach would typically employ sector rotation strategies where the target sector changes with changing views on the macro-economic environment. Exhibit 12 shows some examples of how sector indices could be used in equity portfolio allocation. For example, we show an equal weighted combination of all sector indices, where the combined portfolio is rebalanced quarterly at the same time as the sector indices. We also show a combination of MSCI USA IMI and the defensive sectors that have historically produced lower risk and historical beta. A third combination allocates to MSCI USA IMI and to defensive and cyclical sectors to attempt to derive a benefit from low inter-sector correlations. Allocating to such low correlated sector indices historically has provided substantial diversification benefits. These diversification benefits reflected in the low correlations historically lead to improvements in risk reduction and higher Sharpe Ratios, as well as higher Information Ratios.
MSCI Index Research msci.com © 2013 MSCI Inc. All rights reserved. Please refer to the disclaimer at the end of this document
Research Insight Harvesting Sector Beta through Broad Sector Indices
October 2013
13 of 16
Exhibit 12: Sector Composites based on MSCI USA IMI Sectors – Key Performance Metrics Composite 1: MSCI USA IMI (50%) + All MSCI USA IMI Sector Indices (5% each) Composite 2: MSCI USA IMI (50%) + Defensives (Consumer Staples, Health Care, Utilities) (16.67% each) Composite 3: MSCI USA IMI (50%) + Defensives (Consumer Staples, Health Care, Utilities) (8.33% each)
+ Cyclicals (Industrials, Information Technology, Materials) (8.33% each)

MSCI Index Research msci.com © 2013 MSCI Inc. All rights reserved. Please refer to the disclaimer at the end of this document
Research Insight Harvesting Sector Beta through Broad Sector Indices
October 2013
14 of 16
Section V: Conclusion The globalization of economies and the integration of capital markets have changed the landscape for equity investing. Institutional investors are increasingly investing in equities in both developed and emerging markets, and in large, mid and small cap stocks. Investors choosing to adopt global equity allocation face the challenge of covering an opportunity set that spans developed and emerging markets and a range of market capitalizations. Empirical research shows that global sectors/industries and fundamental style factors now play a very significant role in driving the cross-section of security returns in developed markets. While country factors dominated industry factors in the late 1990s, industry factors have become equal or even more important drivers of developed market stock returns than country factors over the last decade. This highlights the increased importance of global sector allocation decisions relative to country allocation decisions in developed markets. Additionally, small caps as a source of equity risk premia has been well documented in finance literature. Institutional investors who consider allocating mandates along sectors may prefer broad sector indices that include small cap securities. Moving beyond the universe of large and mid cap stocks into the small cap segment aims to increase the sector opportunity set for investors, which may potentially provide diversification benefits and a potential opportunity to enhance performance.

MSCI Index Research msci.com © 2013 MSCI Inc. All rights reserved. Please refer to the disclaimer at the end of this document
Research Insight Harvesting Sector Beta through Broad Sector Indices
October 2013
15 of 16
References “Global ‘All Cap’: The New Investable Equity Opportunity Set?”, MSCI Research Bulletin, October 2012. Fama, E., and K. French (1993) “Common risk factors in the returns on stocks and bonds,” Journal of Financial Economics 33(1), 3-56. Lakonishok, J., A. Shleifer, and R. Vishny (1994), “Contrarian Investment, Extrapolation, and Risk,” The Journal of Finance 49 (5), 1541-78. Kang, X., F.Nielsen and G.Fachinotti. 2010. “The New Classic Equity Allocation?” MSCI Research Insights Menchero, J., and A. Morozov (2011), “Decomposing Global Equity Cross-Sectional Volatility”, Financial Analysts Journal, vol. 67, no. 5 (September/October):58–67. Ankrim, Ernest M., and Zhuanxin Ding. 2002. “Cross-Sectional Volatility and Return Dispersion.” Financial Analysts Journal, vol. 58, no. 5 (September/October):67–73. Bender, J., R. Briand, G. Fachinotti, and S. Ramachandran (2012), “Small Caps – No Small Oversight”, MSCI Research Insight, March 2012. “Uncovering Biases within Sectors (2010)”, MSCI Research Bulletin, July 2010. Subramanian, M., D. Melas, R. Briand, S. Ramachandran (2012), “Economic Exposure to Emerging Markets”, MSCI Research Insight, May 2012. “Sector Performance Across Business Cycles” MSCI Research Bulletin, November 2009.

MSCI Index Research msci.com © 2013 MSCI Inc. All rights reserved. Please refer to the disclaimer at the end of this document
Research Insight Harvesting Sector Beta through Broad Sector Indices
October 2013
16 of 16
Client Service Information is Available 24 Hours a Day [email protected]
Notice and Disclaimer This document and all of the information contained in it, including without limitation all text, data, graphs, charts (collec tively, the “Information”) is the property of MSCI Inc. or its
subsidiaries (collectively, “MSCI”), or MSCI’s licensors, direct or indirect suppliers or any third party involved in making or compiling any Information (collectively, with MSCI, the “Information Providers”) and is provided for informational purposes only. The Information may not be reproduced or redisseminated in whole or in part without prior written permission from MSCI.
The Information may not be used to create derivative works or to verify or correct other data or information. For example (but without limitation), the Information may not be used to create indices, databases, risk models, analytics, software, or in connection with the issuing, offering, sponsoring, managing or marketing of any securities, portfolios, financial products or other investment vehicles utilizing or based on, linked to, tracking or otherwise derived from the Information or any other MSCI data, information, products or services.
The user of the Information assumes the entire risk of any use it may make or permit to be made of the Information. NONE OF THE INFORMATION PROVIDERS MAKES ANY EXPRESS OR IMPLIED WARRANTIES OR REPRESENTATIONS WITH RESPECT TO THE INFORMATION (OR THE RESULTS TO BE OBTAINED BY THE USE THEREOF), AND TO THE MAXIMUM EXTENT PERMITTED BY APPLICABLE LAW, EACH INFORMATION PROVIDER EXPRESSLY DISCLAIMS ALL IMPLIED WARRANTIES (INCLUDING, WITHOUT LIMITATION, ANY IMPLIED WARRANTIES OF ORIGINALITY, ACCURACY, TIMELINESS, NON-INFRINGEMENT, COMPLETENESS, MERCHANTABILITY AND FITNESS FOR A PARTICULAR PURPOSE) WITH RESPECT TO ANY OF THE INFORMATION.
Without limiting any of the foregoing and to the maximum extent permitted by applicable law, in no event shall any Information Provider have any liability regarding any of the Information for any direct, indirect, special, punitive, consequential (including lost profits) or any other damages even if notified of the possibility of such damages. The foregoing shall not exclude or limit any liability that may not by applicable law be excluded or limited, including without limitation (as applicable), any liability for death or personal injury to the extent that such injury results from the negligence or willful default of itself, its servants, agents or sub-contractors.
Information containing any historical information, data or analysis should not be taken as an indication or guarantee of any future performance, analysis, forecast or prediction. Past performance does not guarantee future results.
None of the Information constitutes an offer to sell (or a solicitation of an offer to buy), any security, financial product or other investment vehicle or any trading strategy.
You cannot invest in an index. MSCI does not issue, sponsor, endorse, market, offer, review or otherwise express any opinion regarding any investment or financial product that may be based on or linked to the performance of any MSCI index.
MSCI’s indirect wholly-owned subsidiary Institutional Shareholder Services, Inc. (“ISS”) is a Registered Investment Adviser under the Investment Adv isers Act of 1940. Except with respect to any applicable products or services from ISS (including applicable products or services from MSCI ESG Research, which are provided by ISS), neither MSCI nor any of its products or services recommends, endorses, approves or otherwise expresses any opinion regarding any issuer, securities, financial products or instruments or trading strategies and neither MSCI nor any of its products or services is intended to constitute investment advice or a recommendation to make (or refrain from making) any kind of investment decision and may not be relied on as such.
The MSCI ESG Indices use ratings and other data, analysis and information from MSCI ESG Research. MSCI ESG Research is produced by ISS or its subsidiaries. Issuers mentioned or included in any MSCI ESG Research materials may be a client of MSCI, ISS, or another MSCI subsidiary, or the parent of, or affiliated with, a client of MSCI, ISS, or another MSCI subsidiary, including ISS Corporate Services, Inc., which provides tools and services to issuers. MSCI ESG Research materials, including materials utilized in any MSCI ESG Indices or other products, have not been submitted to, nor received approval from, the United States Securities and Exchange Commission or any other regulatory body.
Any use of or access to products, services or information of MSCI requires a license from MSCI. MSCI, Barra, RiskMetrics, IPD, ISS, FEA, InvestorForce, and other MSCI brands and product names are the trademarks, service marks, or registered trademarks of MSCI or its subsidiaries in the United States and other jurisdictions. The Global Industry Classification Standard (GICS) was developed by and is the exclusive property of MSCI and Standard & Poor’s. “Global Industry Classification Standard (GICS)” is a service mark of MSCI and Standard & Poor’s.
About MSCI MSCI Inc. is a leading provider of investment decision support tools to investors globally, including asset managers, banks, hedge funds and pension funds. MSCI products and services include indices, portfolio risk and performance analytics, and governance tools.
The company’s flagship product offerings are: the MSCI indices with approximately USD 7.5 trillion estimated to be benchmarked to them on a worldwide basis
1; Barra multi-asset class factor models, portfolio risk and performance analytics; RiskMetrics multi-asset class market and
credit risk analytics; IPD real estate information, indices and analytics; MSCI ESG (environmental, social and governance) Research screening, analysis and ratings; ISS corporate governance research, data and outsourced proxy voting and reporting services; and FEA valuation models and risk management software for the energy and commodities markets. MSCI is headquartered in New York, with research and commercial offices around the world.
1As of March 31, 2013, as reported on July 31, 2013 by eVestment, Lipper and Bloomberg
Americas Europe, Middle East & Africa Asia Pacific
Americas Atlanta Boston Chicago Montreal Monterrey New York San Francisco Sao Paulo Stamford Toronto
1.888.588.4567 (toll free) + 1.404.551.3212 + 1.617.532.0920 + 1.312.675.0545 + 1.514.847.7506 + 52.81.1253.4020 + 1.212.804.3901 + 1.415.836.8800 + 55.11.3706.1360 +1.203.325.5630 + 1.416.628.1007
Cape Town Frankfurt Geneva London Milan Paris
+ 27.21.673.0100 + 49.69.133.859.00 + 41.22.817.9777 + 44.20.7618.2222 + 39.02.5849.0415 0800.91.59.17 (toll free)
China North China South Hong Kong Seoul Singapore Sydney Tokyo
10800.852.1032 (toll free) 10800.152.1032 (toll free) + 852.2844.9333 00798.8521.3392 (toll free) 800.852.3749 (toll free) + 61.2.9033.9333 + 81.3.5226.8222