harvesting, processing, marketing, and quality...
TRANSCRIPT
I Harvesting, Processing,
I Marketing, and
Quality Assurance
A Workshop
March 30-3 1 , 1992
Newport, Oregon
Oregon Sea GrantORESU-W-92-00 1
ORRSU-W-92-001 C2
PACIFICWHITING
Harvesting, Processing,Marketing, andQuality Assurance
Edited by Gilbert SylviaandMichael T. Morrissey
m Oregon Sea GrantCorvallis, Oregon

Oregon Sea Grant, Corvallis, Oregon State University,Administrative Services A402, CorvalIis, Oregon 97331-2134
0 1992 by Oregon State University. All rights reserved.
@$ LO-@
ISBN l-881826-07-4


support v
Preface vi
Acknowledgments vii
Oregon’s Whiting Fishery: A Case Study in CooperativeDevelopment 1
Barry Fisher
SEAFOOD TECHNOLOGYQuality Issues in the Pacific Whiting Fisheries 9
Michael T. Morrissey, Gregory Peters, and Gilbert Sylvia
Use of Various Grades of Surimi with an Application of LeastCost Formulation 17
Jae W. Park
Cryoprotection of Surimi 20Tyre C. Lanier and Grant A MacDonald
Product Alternatives for Pacific Whiting 29Edward Kolbe, Cheng-Kuang Hsu, Tyre C. Lanier, Grant AMacDonald, Michael T. Morrissey, and Ricardo Simpson
Use of Potato Inhibitor in Pacific Whiting Surimi 33Roy W. Porter
Proteolysis of Pacific Whiting and Its Inhibition 36Haejung An, Yun-Chin Chung, and Michael T. Morrissey
QUALITY ASSURANCE
Quality Assurance Programs for Pacific Whiting 41Gilbert Sylvia and Lisa Gaines
Hazard Analysis and Critical Control Points for ArgentineHake (Merluccius hubbsi) Processing Plants 47
Enrique Bertullo
European Quality Requirements for Hake 50Joachim Werner
The Importance of Quality Assurance for the Introduction ofPacific Hake into Traditional Frozen Seafood Markets 66
Jim Daniels
Panel Discussion on Quality Assurance 58
Panel Discussion on the Cooperative Efforts of Fishermen andProcessors to Improve Product Quality of Pacific Whiting 60
i i i

MARKETINGSurimi Market-Boom or Bust 65
Ron Jensen
Global Markets for Surimi-based Products 67Joseph Zalke
The Situation of Global Surimi, with Special Emphasis on theJapanese Market 73
Ichiro Kano
Market Promotion Opportunities and Challenges for PacificWhiting 66
Dalton Hobbs
Product Characteristics and Market Demand for PacificWhiting 82
Gilbert Sylvia and Gregory Peters
Panel Discussion on Marketing of Pacific Whiting 87
BIOLOGY AND MANAGEMENTHow the Biology of Pacific Whiting Might Constrain theDevelopment and Stability of the Fishery 91
Mark E. Wilkins
Potential Yield from the Pacific Whiting Fishery 96David B. Sampson
A Multiple-Objective Bioeconomic Policy Model of the PacificWhiting (Merluccius productus) Fishery 194
Roberto R. Enriquez and Gilbert Sylvia
Panel Discussion on Biology and Management of PacificWhiting 111
Closing Remarks 112Barry Fisher
iv
SUPPORT
A number of agencies and individuals have supported research inPacific whiting fisheries over the years. Among them are thefollowing
USDA/CSRA--Special Research Grant Agreement 92-34 276-7140Oregon State University Agriculture Experiment StationOregon Sea GrantNational Marine Fisheries ServiceCenter for Applied Agricultural ResearchOregon Trawl CommissionOregon Department of AgricultureCaptain Barry Fisher
This book is funded by the NationalOceanic and Atmospheric Administra-tion, through Oregon Sea Grant (grantnumber NA89AA-D-SGlO8). The viewsexpressed herein are those of theauthors and do not necessarily reflectthe views of NOAA or any of itssubagencies.
PUBLICATION CREDITSTechnical Editor: Sandy RidlingtonDiscussion Reporter: Anne Shriver

The domestication of the Pacific whitingfishery has resulted in an opportunity for sig-nificant cooperation between the fishing indus-try and research institutions. Merlucciusproductus has a number of behavioral and in-trinsic characteristics that make controllingproduct quality a challenging problem. Thesecharacteristics include high recruitment vari-ability, complex migration patterns, a rela-tively soft flesh, a fat layer associated withrancidity, the presence of myxosporidean para-sites, and high levels of protease enzymes inthe muscle tissue. These characteristics affectfishing practices, methods of processing, andmarket decisions. A number of ongoing re-search projects are designed to help us under-stand these relationships, including how differ-ent variables, such as time and temperature,affect product quality.
When we convened this workshop, our prin-cipal idea was to present information gatheredfrom our ongoing research efforts as well asthe efforts of others in the domestic and inter-national hake/whiting fisheries. Our hope isthat this information can be used to developprofitable quality-assurance programs and im-prove market opportunities. We were delightedwith the response to the workshop in both at-
tendance and active participation of the audi-ence during the discussions and question andanswer periods. The workshop proved to be atwo-way street, with considerable give andtake between industry and researchers. Ourhope is that this interaction will continue asproduct quality and market-related issuesarise over the next several years.
The workshop was designed to cover a widerange of important topics in the Pacific whitingfisheries, including food technology, productquality, marketing, biology, and fisheriespolicy. As part of the newly formed Coastal Or-egon Marine Experiment Station (COMES) atOregon State University, we feel that this com-prehensive approach to fisheries issues fitsperfectly with the mission of the COMES pro-gram, which recognizes the need for interdisci-plinary research in order to optimally managethe fishery resources.
Gilbert SylviaHatfield Marine Science CenterNewport, Oregon
Michael T. MorrisseyOSU Seafood LaboratoryAstoria, Oregon
vi

ACKNO-MENTS
We wish to acknowledge the many privatecompanies, public agencies, and individualsthat contributed to the success of this work-shop. We thank the Depoe Bay Fish Company,Newport Shrimp Company, Ocean Foods ofAstoria, Pacific Coast Seafoods, Point AdamsPacking Company, and Oregon Trawl Commis-sion for their generous financial sponsorship.We would especially like to thank the othermembers of the organizational committee fortheir efforts, including Barry Fisher (MidwaterTrawler’s Association), Joe Easley (OregonTrawl Commission), Jay Rasmussen (OregonCoastal Zone Management Association), HansBadtke (Resource Economist), Jerry Bates(Depoe Bay Fish Company), and Grant Larson(Ocean Foods of Astoria). Susan Mills and
Maureen Collson (Coastal Oregon Marine Ex-periment Station) and Georgia York (OregonCoastal Zone Management Association) de-serve special thanks for their yeomanly workin organizing the conference and attending tothe 1001 administrative details. SandyBidlington (Oregon Sea Grant) edited the pro-ceedings and oversaw their publication. AnneShriver (International Institute of FisheriesEconomics and Trade) summarized the discus-sions and the question and answer sessions.We also thank Bob Malouf and Sea Grant forpublishing these proceedings. Finally, wewould like to thank Lavem Weber (Superin-tendent, Coastal Oregon Marine ExperimentStation) for his support of and commitment toall of the research devoted to this effort and toaddressing issues related to the Pacific whiting
vii
Barry Fisher
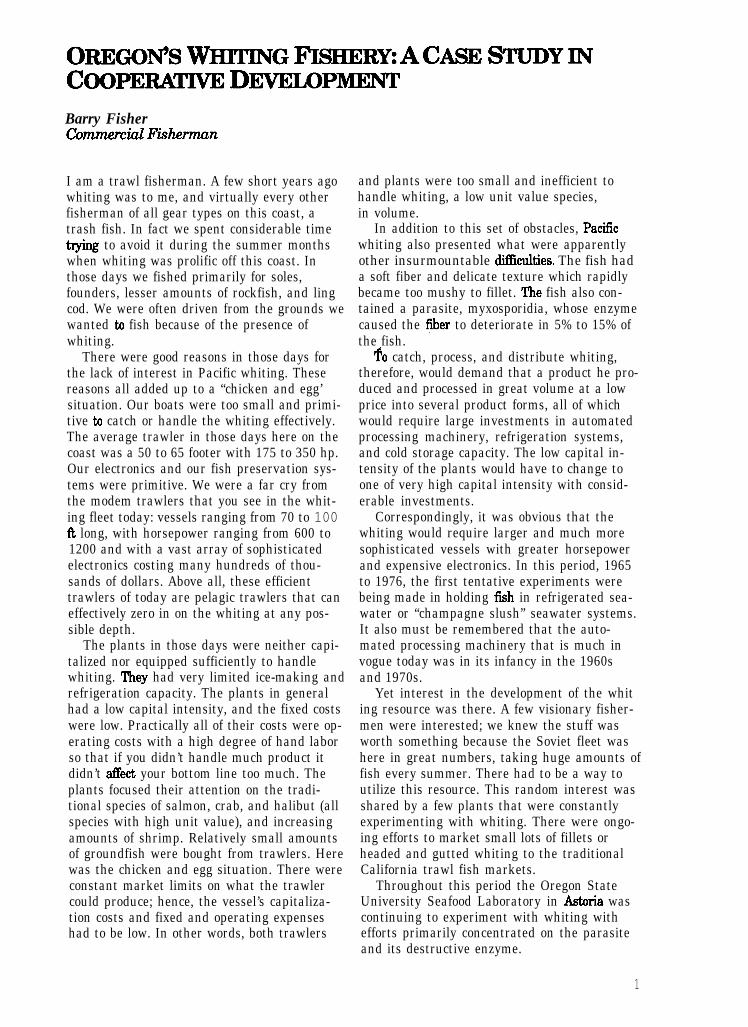
I am a trawl fisherman. A few short years agowhiting was to me, and virtually every otherfisherman of all gear types on this coast, atrash fish. In fact we spent considerable timetrying to avoid it during the summer monthswhen whiting was prolific off this coast. Inthose days we fished primarily for soles,founders, lesser amounts of rockfish, and lingcod. We were often driven from the grounds wewanted to fish because of the presence ofwhiting.
There were good reasons in those days forthe lack of interest in Pacific whiting. Thesereasons all added up to a “chicken and egg’situation. Our boats were too small and primi-tive to catch or handle the whiting effectively.The average trawler in those days here on thecoast was a 50 to 65 footer with 175 to 350 hp.Our electronics and our fish preservation sys-tems were primitive. We were a far cry fromthe modem trawlers that you see in the whit-ing fleet today: vessels ranging from 70 to 100R long, with horsepower ranging from 600 to1200 and with a vast array of sophisticatedelectronics costing many hundreds of thou-sands of dollars. Above all, these efficienttrawlers of today are pelagic trawlers that caneffectively zero in on the whiting at any pos-sible depth.
The plants in those days were neither capi-talized nor equipped sufficiently to handlewhiting. They had very limited ice-making andrefrigeration capacity. The plants in generalhad a low capital intensity, and the fixed costswere low. Practically all of their costs were op-erating costs with a high degree of hand laborso that if you didn’t handle much product itdidn’t affect your bottom line too much. Theplants focused their attention on the tradi-tional species of salmon, crab, and halibut (allspecies with high unit value), and increasingamounts of shrimp. Relatively small amountsof groundfish were bought from trawlers. Herewas the chicken and egg situation. There wereconstant market limits on what the trawlercould produce; hence, the vessel’s capitaliza-tion costs and fixed and operating expenseshad to be low. In other words, both trawlers
and plants were too small and inefficient tohandle whiting, a low unit value species,in volume.
In addition to this set of obstacles, Pa&cwhiting also presented what were apparentlyother insurmountable difhculties. The fish hada soft fiber and delicate texture which rapidlybecame too mushy to fillet. The fish also con-tained a parasite, myxosporidia, whose enzymecaused the fiber to deteriorate in 5% to 15% ofthe fish.
Rio catch, process, and distribute whiting,therefore, would demand that a product he pro-duced and processed in great volume at a lowprice into several product forms, all of whichwould require large investments in automatedprocessing machinery, refrigeration systems,and cold storage capacity. The low capital in-tensity of the plants would have to change toone of very high capital intensity with consid-erable investments.
Correspondingly, it was obvious that thewhiting would require larger and much moresophisticated vessels with greater horsepowerand expensive electronics. In this period, 1965to 1976, the first tentative experiments werebeing made in holding fish in refrigerated sea-water or “champagne slush” seawater systems.It also must be remembered that the auto-mated processing machinery that is much invogue today was in its infancy in the 1960sand 1970s.
Yet interest in the development of the whiting resource was there. A few visionary fisher-men were interested; we knew the stuff wasworth something because the Soviet fleet washere in great numbers, taking huge amounts offish every summer. There had to be a way toutilize this resource. This random interest wasshared by a few plants that were constantlyexperimenting with whiting. There were ongo-ing efforts to market small lots of fillets orheaded and gutted whiting to the traditionalCalifornia trawl fish markets.
Throughout this period the Oregon StateUniversity Seafood Laboratory in Astoria wascontinuing to experiment with whiting withefforts primarily concentrated on the parasiteand its destructive enzyme.
1

Cf greater significance in other parts of theworld, great strides were being made in fisb-ing gear technology (in particular pelagictrawling and its associated requisite electron-ics, such as sonars and net sounders). A rapidprofusion of automated processing equipmentwas being produced, and considerable progresswas being made in preservation systems fromthe vessel to the retail store. This era also sawthe beginnings of commutated products andanalog products and a growing recognitionthat certain types of seafood lent themselvesvery well to the production of consumer-ready,fully manufactured seafood products.
But a further catalyst was needed to bringabout a mode by which Oregon coastal boatscould successfully enter the whiting fishery.The Fisheries Conservation and ManagementAct of 1976 provided the missing link. This“20O-mile bill” gave Americans exclusive con-trol of the fisheries resources within their 200-mile fishery conservation zone. The Sovietsrecognized the priorities implicit in these con-trols and entered into a joint-venture companywith American interests. The Soviet economy,even in those days, was very weak. The Sovi-ets required continued access to our fishstocks, and they also needed a constant streamof hard currency for trade purposes since theirown currency was inconvertible on the worldmoney markets. A joint Soviet-American com-pany could successfully reach both of theseobjectives.
In 1978, after exhaustive political battleswithin the American fishing industry, the newSoviet-American joint venture began opera-tion. In August 1978, I purchased an 86-foottrawler with 780 hp, pelagic trawl gear, andassociated electronics. We began fishing opera-tions off the central Oregon coast, and after adisastrous two weeks during which we taughtourselves how to midwater trawl, we hit upaydirt” The pay dirt was modest. In a 24day period we harvested 958 metric tons (MT) of Pa-ciflc whiting, which was processed by two So-viet BMRTs into headed and gutted (H&G)whiting and some whiting block fillets. Thatfirst year we all lost money, but the concept ofsmall catcher boats delivering transferable codends with tows of up to 25 tons to the proces-sor vessel and the subsequent rapid processingand freezing of the fish was firmly proven. Thejoint venture would work.
In 1979 the Soviet-American joint venturefleet took approximately 11,000 MT of whiting.In 1980 approximately 48,000 MT were deliv-ered, and by this time all of us involved-theindependently owned American catcher boats,2
the leased Soviet processing ships, and the So-viet-American joint-venture company-weremaking good profits.
An expansion of operations into the Alas-kan area was planned to go afl.er variousflounders and cod fish. The first bottom fishjoint venture also proved to be enormouslysuccessful. By this time other American fisher-men were beginning to realize the potentialthe joint ventures offered for their efforts, eventhough American processing companies, byand large, were not interested in the enormousresources of whiting off the Pa&c Northwestcoast and the pollock, cod fish, and flounderresources in the Gulf of Alaska and theBering Sea.
A stroke of fate provided the next impetusfor a very rapid development in the Pa&cwhiting fishery. In 1979 the Brezhnev regimein the Soviet Union invaded Afghanistan. TheU.S. government almost immediately canceledfuture allocations of any groundfish resourcesin the American fishery conservation zone tothe Soviet Union. In one stroke of fortune theSoviets lost some 350,000 to 450,000 tons ofdirect allocations in the American zone. Thisfish had to be made up in some form, and theonly vehicle remaining to ensure product forSoviet consumption was the Soviet-Americanjoint venture. By the early 1980s the Soviet-American joint venture was taking over100,000 MT of whiting off this coast and betterthan 260,000 MT of flounder and cod fish inAlaska.
Ihis amount of fishing activity, as well asjoint ventures between American vessels andKorean and Japanese companies, broughtabout a boom in vessel construction and con-version on the Oregon coast for vessels to fishin the new joint ventures. Almost overnightthe economic potential for larger and morepowerful trawlers could be realized, not only inthe rapidly developing joint ventures with sev-eral nations, but because these same vesselscould also harvest large amounts of rockfish inthe winter fisheries off the Pacific Northwestcoast. This sizable fleet was rapidly acquiringthe experience necessary to fully prosecute thewhiting fishery in great volume. One part ofthe equation necessary to develop this impor-tant fishery in the State of Oregon had beenobtained: the catcher fleet was a reality.
Concurrently, considerable progress wasbeing made in a number of contingent neces-sary areas. The 1980s witnessed an explosionof interest and effort in the production ofsurimi. The Japanese fishing vessels had beenlargely pushed out of the Alaskan pollock fish-ery by the joint ventures.
The Japanese continued to procure theirsurimi requirements from the pollock fisheryby using surimi production factory ships asjoint venture partners with American catcherboats. By the mid-1980s considerable effortwas applied to the production of pollock surimiin Alaskan shore plants. After a few falsestarts, a rising volume of high-quality surimiproducts streamed from these plants. The req-uisite processing was highly automated, and itwas recognized that this same automatedequipment could be used to produce surimifrom whiting if the characteristics of whitingwould lend themselves to the productionof surimi.
Intensive marketing efforts were also madein the United States for the analog productsthat were manufactured from the surimi base.The public acceptance of these products provedto be very positive.
Work at the Oregon State University Sea-food Laboratory intensified. Great attentionwas being paid to efforts to counteract the ef-feds of the parasite. Product forms were beingtested and evaluated, and preservation sys-tems were being studied in order to overcomethe characteristics of whiting which led toshort shelf life in the vessels, plants, and retailoutlets. From all of these efforts, a qualitysurimi product from whiting began to beproduced.
Simultaneously, small but important effortswere being made in northern California to pro-duce round whole whiting, H&G product, andwhiting Sllets for the traditional Californiamarkets. Each year saw the production ofsome 1,660 to 2,099 MT, which provided some‘market reality experience.”
Economic greed can be an appreciable hu-man behavioral dynamic. More and moreshoreside processors were recognizing thesimple lesson that a great deal of money couldbe made from whiting after all, the catcherboats were doing it. It was evident that vastquantities of this product were being consumedin the Eastern European community, theThird World, and of greater import, the Westem European market. The domestic processorswere also beginning to feel the pinch of re-duced quotas in the traditional groundflsh fish-eries. Suddenly, as the markets expanded overmore and more space and versatile processingmachinery was being introduced, their accessto resources was diminishing.
Whiting became more and more of a conver-sational topic on the waterfronts of Newport,Coos Bay, and Astoria. It became obvious toeverybody that not only was the Oregon Sea-
food Laboratory heavily involved with whiting,but the National Marine Fisheries Service’sseafood technologists were continuing theirpioneering efforts, which had really begun inthe late 1960s with N?&F%sponsored programsto process and manufacture fish protein con-centrate, a fish flour, from whiting.
In August 1989, I requested a meeting withofficials of the Oregon State University SeaGrant program, the Oregon Department of Ag-riculture, the Oregon Economic DevelopmentDepartment, and the Oregon Trawl Commis-sion. During that meeting I quickly sketchedthe development of the Oregon trawl fleet intothe whiting fishery and presented our catchingcapability. I described the effective automatedprocessing machinery which was now availableto process whiting. I reviewed the market op-portunities for a variety of product forms that Ifelt could come from the whiting resource. Idescribed improved refrigerated preservationsystems that would allow the fish to be trans-ported to shore and processed in shoresideplants.
I next described the status of the traditionalgroundflsh stocks and pointed out that theywould become overstressed if the new wbitingtrawler fleet had to revert to fishing uponthose traditional stocks. I surveyed the suc-cessful Alaskan campaigns to produce surimifrom pollock as well as pollock fillets and filletblocks and stated that I felt the same thingcould be done with whiting.
All of the vital components for shoresideprocessing of whiting seemed to be in place. Itold the group that I felt that a catalyst wasnecessary to bring Oregon fully into the whit-ing business, from the fish in the oceanthrough product output from the doors of theprocessing plants. I felt that catalyst should bea detailed, thorough, and intensive study ofwhiting’s potential. We should look at thestrength and viability of the resource, competi-tive resources worldwide, the outlook and mar-ket opportunities for products that could beproduced from these resources, an intensivestudy of both the domestic and internationalmarkets for whiting products in the form ofH&G whiting, whiting fillets, whiting filletblocks, minced whiting products, and, ofcourse, surimi. Other areas that a study shouldcover were the requisite type and cost of capi-tal for both vessels and shore plants to success-fully produce these products, and all infra-structure requirements in terms of availableutilities, water resources, labor, environmentalcriteria, permitting requirements, transportroutes, and so on.
3
I felt that the study should issue from asingle administrative source and that becausewhiting was such an important resource to theState of Oregon, the funding should come from(1) industry, (2) the Oregon State UniversitySea Grant program, which could provide therequisite seafood technology, (3) the OregonDepartment of Agriculture (ODA), which wasalready engaged in the marketing of Oregonseafood product, and (4) the Oregon EconomicDevelopment Department (OEDD), which wouldbe a potential source of demonstration grantsand low-cost capital.
I then placed on the table my check for$10,090 and made the remark that it was timeto “ante up.” The stakes were high and the Or-egon coastal communities would benefitgreatly if we could succeed in bringing ashorefor processing and distribution the greater partof this enormous resource off our coast.
The response was overwhelmingly positive.By the time the meeting concluded, the direc-tor of ODA, the Sea Grant director, and the di-rector of OEDD had signed on with concretepledges of support Within a very few weeksthe monies had been secured. ODA and OEDDcame up with approximately $112,990 in directsupport of the study. OSU committed an enor-mous amount of in-kind research capabilityfrom the OSU Seafood Laboratory, organiza-tional services from the OSU Marine Ezten-sion program, and marine resource economicexpertise from the Coastal Oregon Marine Ex-periment Station.
It was decided that the Oregon Coastal ZoneManagement Association (CjCZMA) should bethe administering agency for the study becauseof its long history of positive accomplishmentson the Oregon coast and because the agencyhad the full support of the Oregon Legislature,from whom, of course, the funds would beobtained.
The first order of business was to decidethat a policy-setting Whiting Steering Commit-tee should be established to supervise thestudy. Accordingly the steering committee con-sisted of the director of OCZMA, the executivedirector of the Oregon Trawl Commission (acommodity commission to which all Oregontrawlers engaged in grotmdfish production be-long and whose principal activity is the promo-tion of marketing efforts for Oregon trawl-caught product), a representative of the ODA, arepresentative of OEDD, and me, a representa-tive of the Oregon whiting trawl fleet.
The various phases of the study were laidout, and appropriate consultants and institu-tions were given the authority and responsibil-4
ity to commence specific parts of the study.Each component had a well-defined scope ofwork, and critical relationships between thecomponents were identified and established.Great care went into the design of the market-ing survey, which proved to be one of the mostcomprehensive and well-designed marketingstudies ever attempted in the seafood industry.
The Whiting Steering Committee met on analmost monthly basis to review progress. Dur-ing the tenure of the study, key grants andlow-interest loans were obtained for a Newportbased processor who was enthusiastic aboutmoving into the whiting market. We learned agreat deal as the result of this plant’s activitiesin handling whiting from the point of capturethrough processing and into H&G frozen whit,ing, fresh H&G product, and fresh and frozenwhiting fillets.
The 0DAbegananimmediat.e andeffectivecampaign featuring whiting products and pro-motional activities nationally and intemation-ally. Valuable marketing experience was a con-stant input from the ODA back to the studygroup.
The OSU Seafood Lab began an intensiveseries of research projects to produce fresh andfrozen whiting surimi; continued effort was de-voted to overcoming the efhxts of themyzosporidian enzyme. The Seafood Dab alsoconcerned itself with experimental work onwhiting protease and inhibitors to be used inthe production of whiting surimi.
A related activity of the Coastal Oregon Ma-rine Experiment Station was to establish com-puter modeling techniques regarding effortsand methods needed to extract the highest pos-sible use of revenue from the whiting resourceover time and space, from fishing vesselsthrough to the consumer% plate.
The Whiting Steering Committee decidedthat a technical conference and seminar on Or-egon whiting would be a desirable and usefulactivity. We wanted to tell the Oregon whitingstory. We realized that the product was notpopular in the marketplace, and indeed thatmarket experience was limited. A conferencewas organized, and in August 1990,400 invita-tions were mailed to an audience that con-sisted primarily of seafood brokers and whole-salers who had handled Pacific whiting andalso great quantities of competing whitingproducts from all over the world.
The conference was a great success. Over140 people attended from all segments of theseafood industry: fishermen, processors, insti-tutional agencies, brokers, and wholesalers.The feedback from this conference provided

valuable information for the authors of thestudy. It afforded all of us a great slice of mar-ket reality. The experience engendered fromthis meeting provided not only feedback but co-gent guidelines for the conclusion of the studyand for industry, the O D A , OEDD and OSU.
The study was completed in February 1991and was presented to the Oregon State Legis-lature and the industry. The study yieldedgreat dividends. It clearly established for thePacific Northwest seafood industry that therewas now a body of considerable expertise thatcould be relied on to provide advice on anyphase of what was now being called the whit-ing industry. The study and the conferencealso clearly established in the industry notonly the need for interdisciplinary cooperationbut a general climate of cooperation betweenfishermen, processors, and marketers of whit-ing products. Finally, the whiting study conclu-sively established a means of entry into thewhiting business for several large outsidefirms desirous of obtaining or enlarging theirpresence in the seafood industry.
The cooperative planning and cooperativeefforts also allowed the industry to speak witha concerted, positive, and definitive voice in therealm of fishery politics. It became obviousthat the industry would have to procure aguaranteed allocation of the whiting resourceover time in order for the industry to succeed.It was now able to go to the Patic FisheryManagement Council to seek guaranteed allo-cations on an annual basis of sufGient re-sources to develop the industry.
These political efforts to date have been suc-cessful, and a united coastal whiting industryis in the last stages of securing the requisiteallocations. Here again, in the area of fisherypolitics, the whiting industry is accepted asjust that, a coherent industry.
The United States Secretary of Commercerecognized in August 1991 the validity of theconcept of guaranteed access to the whitingresource for catcher boats delivering whiting toshoreside processing plants. These guaranteedquotas established a priority over atrsea pro-cessors. Direct allocations proved to be the me-dium by which intensive investments would bemade in both processing plants and the catchervessels that would deliver the resource.
Enough market experience had been gainedin 1991 to dictate that whiting products werecompetitive and would be broadly accepted,providing that a quality product could be deliv-ered to these markets.
Landings of whiting to shore plants qua-drupled and quintupled from August 1991 to
the end of the season in November 1991. Thefall and winter of 1991 witnessed a rapidbuildup of catching and processing capabilityand capacity. Several major plants on the Or-egon coast decisively entered the whiting busi-ness with great emphasis being made on theproduction of surimi for the 1992 season. In-dustry surveys dictated that the plants’ re-quirements for whiting in 1992 would ap-proach 105,000 MT. Unutilized plant space hasrapidly begun to fill with automated processingmachinery. The shipyards on the Pa&%Northwest coast have been full all winter longwith trawlers converting to refrigerated seawa-ter holding systems and undergoing all therequisite reconstruction necessary to preservefish in this mode. Several vessels have ac-quired cod-end pumping systems to rapidlyand safely bring the catch aboard and preserveit in adequate refrigerated seawater systems.
It was against this backdrop of energy andactivity that the Whiting Steering Committeedecided to schedule this conference.
I think we on the Oregon coast have learnedsome valuable lessons in the past two years.The resource has always been there. We &her-men were given a couple of breaks that allowedus to catch that resource. We were able toprove that very good profits could be madefrom a resource with low unit value, providingthat the ~~source could be harvested in greatvolume. However, we were stymied in all at-tempts to progress beyond this point until suchtime as we recognized the other obstacles thatmust be overcome. We recognized that therewas a lot more to the fish business than justcatching fish. Markets had to be created. Themarket places worldwide had been undergoinggreat changes. Technology had brought us tothe point where we could profit from thesechanges but only if we attacked our problemsin a cooperative fashion and used a multitudeof talents across a broad array of problems. Asystem was needed. A system was created. Itwas that system, enforced by a comprehensivestudy, that brought us to the point where weare today, on the threshold of a new industry.
No one group-fishermen, processors,managers, researchers, or governmentofficials-could have succeeded alone inbuilding this industry. Under the rigiddiscipline of a cooperative effort, we haveachieved success. In 1992 and the years tocome, the entire coast will profit from thisnew industry. Oregon whiting products arenow ready to enter the domestic and intema-tional markets.
5


Seafood Technology

Michael T. MorrisseyCoastal Oregon Marine Experiment Station
Gregory PetersBioresource Engineering, Oregon State University
Gilbert SylviaCoastal Oregon Marine Experiment Station
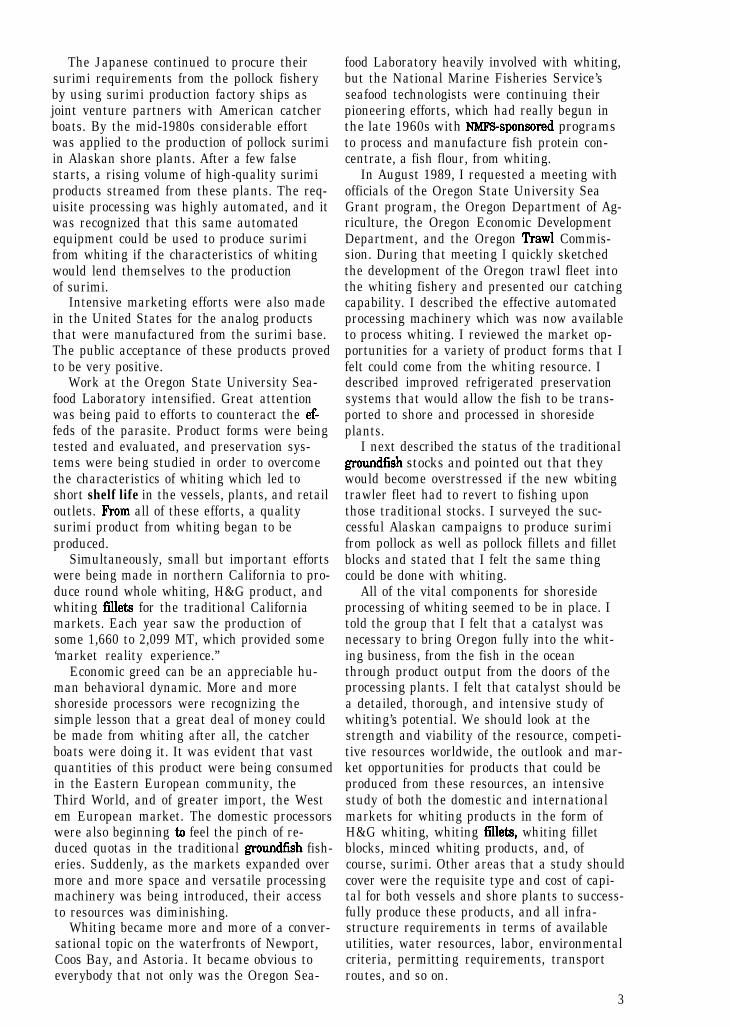
INTRODUCTIONPacXc whiting (Merluccius productus) is thelargest stock of trawl fish off the west coast ofthe contiguous United States. It has an aver-age maximum sustainable yield 0 of approximately 200,000 metric tons @IT) peryear. The fishery had been consideredunderutilized, since only a small proportion ofthe harvest was processed by the U.S. indus-try. Figure 1 shows the number of fishing sec-tors that have been involved in the Pa&%whiting fisheries since the late 1980s (Radtke1992). During the early part of the 1980s thefishery consisted of foreign fisheries (Korean,Japanese, and Russian) and joint venture GIWoperations between foreign mother ships and
coastal trawlers. The foreign fisheries werephased out by 1989. In 1991, there was suffi-cient interest by U.S. processors for Pacificwhiting that JV operations with foreign pro-cessing vessels were also excluded from thequota. ‘I’he U.S. shoreside plants increasedtheir operations from 0.5 MT in 1983 to 22.6MT in 1991.
There was a dramatic change in the domes-tic utilization of Pacific whiting last year. Thiswas driven by (1) the high price of surimi inthe global market and (2) technological ad-vances in using Pacific whiting for surimi.These advances focused on the use of proteaseinhibitors in surimi that would slow the pro-teolytic breakdown of muscle proteins that
Pacific Whiting LandingsThousand metric tons
2 5 0
2 0 0
150
100
50
01980 1981 1982 1983 1984 1985 1986 1987 1988 1989 1990 1991
Figure 1. Descriptionof Pacific whitingharvest 1980 through1981.
9

lead to weak gel strength. Nonetheless, evenwith these advances it has become obvious tothe fishing industry that Pacific whiting can-not be treated as other trawl-caught species.Intrinsic characteristics of the species, such asrelatively soft flesh, the presence of a fat layerassociated with rancidity, the infestation ofMyxosporidean parasites, and the high levelsof protease that rapidly break down the tissue,make it imperative that the fish be handleddifferently than other species. The Coastal Cr-egon Marine Experiment Station (COMES) hasbeen awarded several grants to study the qual-ity aspects of Pacific whiting and help the in-dustry develop quality guidelines for the har-vesting, handling, and processing of the fish.
Currently, there is a large variation in han-dling practices among fishermen and proces-sors. Several of the processes required to pro-duce a product with the quality characteristicsnecessary for generating profitable marketprices may not be suitable or cost effective forcoastal trawlers and processors (Sylvia and Pe-ters 1990). Consequently, fishermen and pro-cessors must carefully consider the trade-offsbetween quality and cost in developing indus-try standards for Pacific whiting. To maximizeprofit potential, it may not be cost-effective tonecessarily produce the bestquality productQuality guidelines must be based on optimiz-ing the industry profits, rather than only onproduct quality. With this type of objective,dialogue between industry and researchers be-comes easier and more productive. Data pre-sented in the following sections represent thefirst phase of determining what some of thequality parameters are for Pacific whiting asobserved in both the laboratory and local pro-cessing plants. Over the next several years,ongoing research will allow us to look at sea-sonal and regional variations. This data will
complement the research into how handlingand processing affect quality in the Pa&cwhiting fisheries; the results will assist the in-dustry in establishing profit-driven standards.
METHODOLOGYTo relate quality parameters to handling
and processing practices, we need to develop astandard method of measurement. In thisstudy, both objective and subjective evahmtiontechniques were used. The subjective measure-ment used was a Descriptive Evaluation Sys-tem (DES). The DES was developed from the Ca-nadian Ground&h Guide (Woyewoda andShaw 1995) and modified for Pacific whiting.This technique uses an observer in processingplants to subjectively determine quality pa-rameters, such as relative texture, degree ofdiscoloration, number of blood clots, and over-all appearance. The objective measurementsincluded the use of a Torrymeter, which is aninstrument that measures electrical currentalong two points on the instrument in contactwith the fish. Torrymeter values gradually de-crease as the electrical properties ofthe tissuechange after death. The values from this in-strument are related to the quality ofthe fishand can be correlated to specific quality pa-rameters such as texture.
Processing plants were visited on 35 differ-ent occasions during the 1991 season, and atotal of over 1,500 fish were sampled. Randomsamples from each lot of fish were taken andeach fish was analyzed and recorded. Table 1illustrates the sample data collection sheetused in this research and shows the attributesmeasured. Figure 2 demonstrates the DES andstandard methods for measuring the tempera-ture and texture of the fish.
Table 1. Sampled&a sheet*in-plant descriptiveevaluation ofPacifi whiting.
Fillets
Torrymeter reading l I I I I I I I I I I
10
1. Reoord tmperature
In order to assess whetherfish has been property iced atsea, determine its temperature.insert a thermomeW into thacollar of the fish and push itthrough the flesh to a point midwaydownthafiank.
Insert thermometer i
Ensure that the tip of the thermometeris completely embedded in the flesh.Leave it in place for about 1 minutebefore readrig and recordingtemperature.
Any accurate thermometer that can beinsetWed into the flesh is suitable. A dial orprobe type may provide tha least resistance.Accuracy of thermometer should be checlcad;temperature of ice and freshwater mixture is 0” C.
PROCEDURE GRADE
2 Aaaeaa texture of fish flesh
Press thumb along lataral line for theantarior two thirds of the fish. Do notpress along the tail section, as itcontains little flesh and mostly bones,and will not give a txue indiin oftexture.
0 - flesh is firm and resilient, andsprings back immedately whendW3Sed.
1 - reasonably fiml, some loss ofresiliency, thumb indentations slowly fillout.
2 - modemtely soft, thumb indentationsmay remain in flash.
3 - excessively soft flesh.instruction sheetb-snti
Pacific whiting.
11

Another objective evaluation technique,used in this study, was the torsion test. Thistest was developed by researchers at NorthCarolina State University (Kim et al. 1986).The torsion method evaluates the stress andstrain of gels formed from the flesh of the fish.The stress gives a measure of gel strength. Thestrain is related to the protein functionality ofthe gel and measures the cohesiveness. Astrain value of 1.8 is the lower limit for makinga qua& surimi product
The torsion test is useful not only in deter-mining gel strength and functionality in orderto make quality surimi, but also as a tool indetermining the quality of fillets. To use thetorsion test as a quality measurement, the re-searcher must mince the fillet and process itinto a gel.
Surimi ProductionOne potential use for Patic whiting is the
production of surimi. The texture problemprevalent in Pacific whiting can be circum-vented in surimi with the addition of proteaseinhibitors (egg white, potato extract, beefplasma protein) mixed into the surimi. Surimiis basically a mince, and so the inhibitor can bemixed more uniformly and is more effectivethan in fillets. With the addition of proteaseinhibitors, Pacific whiting can be processedinto a high-grade surimi. The color is white,and the gelling characteristics are similar tothose of pollock surimi.
During surimi production, the fish were ob-tamed from processing plants within 12 hoursof capture. Fish were then transferred in ice tothe Oregon State University Seafood Labora-tory, where processing was immediately initi-ated. Fish were subsequently filleted and thenminced to begin surimi production. The mincedflesh was washed in polyethylene tanks (95-Lcapacity) with water and ice at a ratio of onepart flesh to three parts water (w/w) and me-chanically stirred for five minutes, then dewa-tered in a Sano-Seisakusho screw press, modelSD-8 (Ikeuchi Tekkosho, Ltd., Japan). Thewashing and pressing procedure was repeatedthree times, with the final wash water contain-ing 0.33% salt (NaCl). The first pressing wascarried out rapidly to separate flesh and water.The press was operated more slowly during thesecond and third wash/press exchanges to pro-duce the lowest possible moisture content inthe flesh, approximately 75%. The dewateredflesh was refined with an Akashi strainer,remove impurities such as fat and small bits of
skin. Surimi was prepared by mixing the re-fined flesh with 4.0% sucrose, 4.0% sorbitol,and 0.3% polyphosphate in a Hobart SilentCutter, model VCM (Hobart Man~acturingCo., Troy, OH) for two minutes. Beefplasmaprotein, a proven protease inhibitor in Pacificwhiting surimi, was .added at a 1% level. Prod-uct temperatures were maintained near or be-low 10°C. Aliquots of 600 g surimi were packedinto individual plastic trays, vacuum pack-aged, and frozen at -30°C. Accurate weights offlesh were recorded throughout processing toestimate yield.
Gel Preparation and TestingPartially thawed surimi was used for the
preparation of all gels. The formulation for thegel was adjusted to 78% f 1% and 2% salt dur-ing the gel preparation stage.
All gels were blended under vacuum with aStephan Universal Chopper (model UM 5,West Germany) for six minutes aRer the addi-tion of each ingredient. Caution was taken tokeep the temperature below 10°C to minimixeprotein denaturation. The batters were packedin stainless steel tubes (1.9 cm diameter and17.5 cm long), sealed with rubber stoppers, andthen heated at 90°C for 15 minutes in a ThelcoPrecision Scientific bath Model 83. Gels weretested for strain and shear stress by the tor-sion method. Shear stress is a measure of gelstrength shown to correlate with sensoryhardness; true strain, a measure of geldeformability, is shown to correlate with sen-sory cohesiveness (Hamann and Lanier 1987).
RESUL’IUNDDISCU~~IONIn-plant Observations
An important part of our research duringthe 1991 season was to apply the methods wewere learning in the laboratory to the fish-pro-cessing plants. DES results were obtained frommore than 1500 fish evah&ed in 35 plant vis-its during the summer and fall of 1991. Table 2summarixes these results using analysis ofvariance tests (ANOVA) comparing seven differ-ent quality parameters to time. Using the sta-tistical test, we related fish and fillet texture,the number ofblood clots, and the Tonymeterreading to preprocessing storage time at a sig-ni6cance level of 95%. Discoloration of filletswas almost significant (p = .O!%). This tableill~trates the significant impact of time onauali&y a@ributes gpd restates_@e necesqi&which inch&d factors such as gill color, skin
I2
defects, and so on, was not significantwith time nor was black spotting onthe flesh. Black spotting refers tohair-like black striations which havebeen shown to be older cysts ofMyxosporidean parasites (Patashniket al. 1982). These are present in theflesh of the fish when captured anddo not increase with time or appear tobe related to other defects such astexture and discoloration. Our workhas shown that they appear in 45%of the fish that are off-loaded Al-though they present no health hax-ard, they are easy to see and are un-acceptable for aesthetic reasons.
Attribute
Fish textureGeneral appearanceBlood clotsFillet textureDiscolorationBlack spotsTorrymeter reading
n=1540
P-Value
.007*
.093
.044
.005
.055
.572
.002
*A p-value off .05 is significant at the 95% level.L
Laboratory ExperimentsThe Tonymeter proved to be a valuable
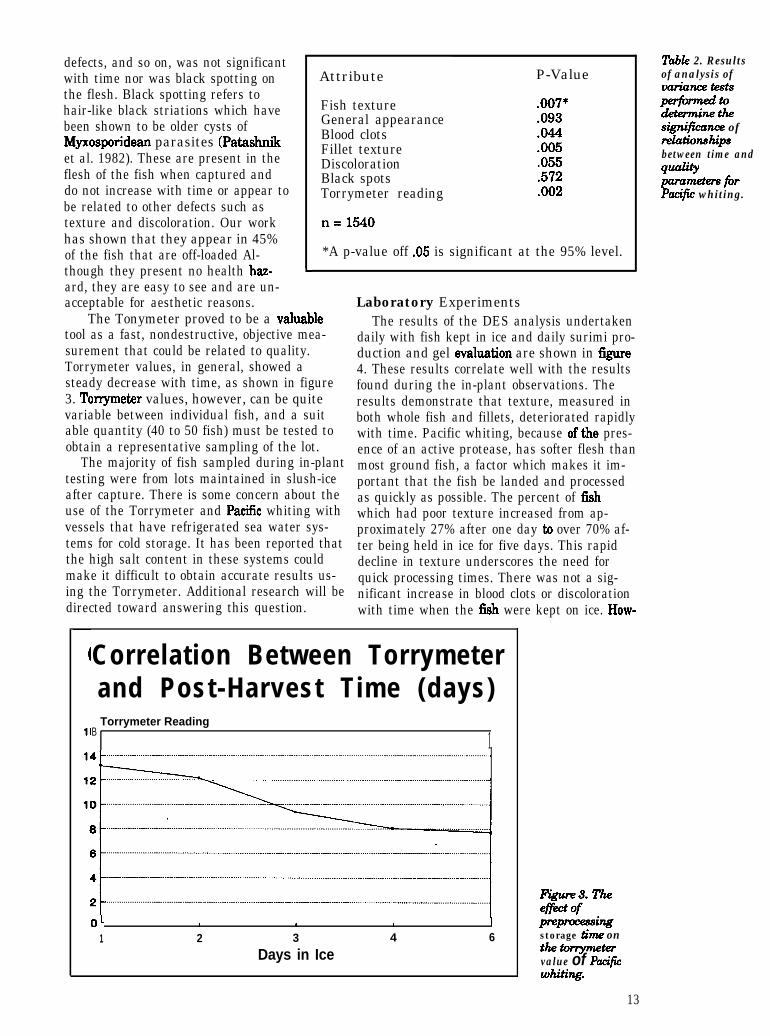
tool as a fast, nondestructive, objective mea-surement that could be related to quality.Torrymeter values, in general, showed asteady decrease with time, as shown in figure3. Tonymeter values, however, can be quitevariable between individual fish, and a suitable quantity (40 to 50 fish) must be tested toobtain a representative sampling of the lot.
The results of the DES analysis undertakendaily with fish kept in ice and daily surimi pro-duction and gel evaluation are shown in tigure4. These results correlate well with the resultsfound during the in-plant observations. Theresults demonstrate that texture, measured inboth whole fish and fillets, deteriorated rapidlywith time. Pacific whiting, because of the pres-ence of an active protease, has softer flesh thanmost ground fish, a factor which makes it im-portant that the fish be landed and processedas quickly as possible. The percent of Cshwhich had poor texture increased from ap-proximately 27% after one day to over 70% af-ter being held in ice for five days. This rapiddecline in texture underscores the need forquick processing times. There was not a sig-nificant increase in blood clots or discolorationwith time when the fish were kept on ice. How-
The majority of fish sampled during in-planttesting were from lots maintained in slush-iceafter capture. There is some concern about theuse of the Torrymeter and Pacific whiting withvessels that have refrigerated sea water sys-tems for cold storage. It has been reported thatthe high salt content in these systems couldmake it difficult to obtain accurate results us-ing the Torrymeter. Additional research will bedirected toward answering this question.
Correlation Between Torrymeterand Post-Harvest Time (days)Torrymeter Reading
B 1
011
I
2I
3Days in Ice
1 I4 6
ii)gz/”Preprocessingstorage the onthe tonymetervalue of PacifiWhiting.
Table 2. Resultsof analysis oflnuiamtests
5zzzzz%signiji4xmce ofrelationshipsbetween time andqualilypcua- firPacijic whiting.
13
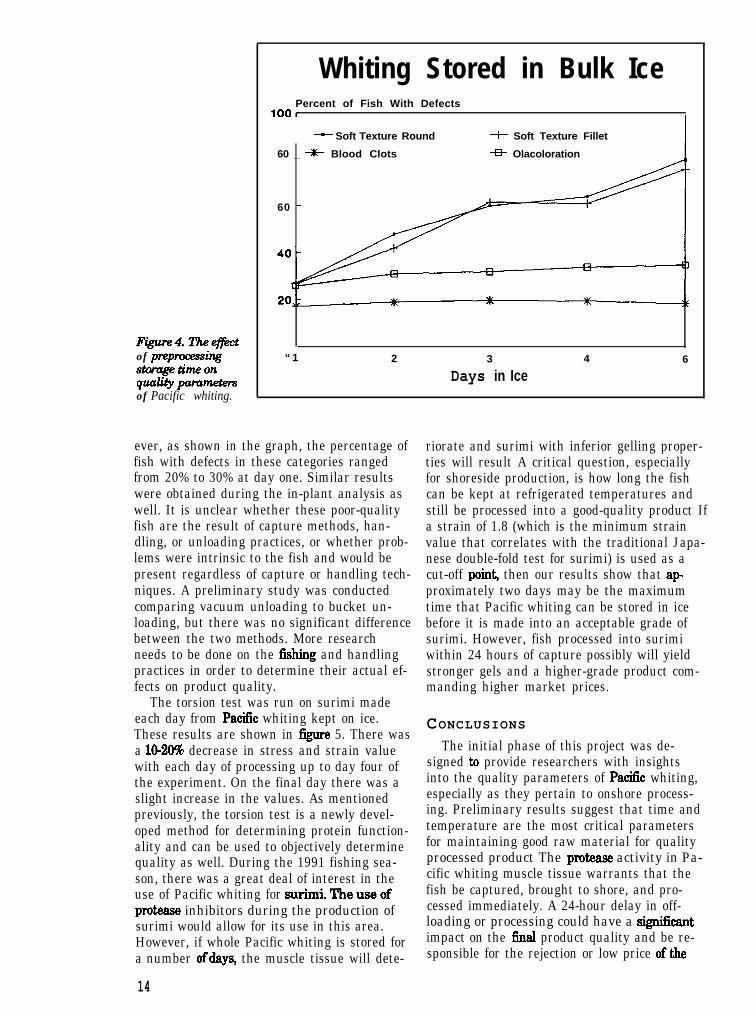
Figure4,T!heeffectof preprwessingz&rage tinaeonquality pm-of Pacific whiting.
Whiting Stored in Bulk IcePercent of Fish With Defects
- Soft Texture Round -k Soft Texture Fillet I60 _ + Blood Clots +- Olacoloration
60 -
“1 2 3 4 6
Days in Ice
ever, as shown in the graph, the percentage of riorate and surimi with inferior gelling proper-fish with defects in these categories ranged ties will result A critical question, especiallyfrom 20% to 30% at day one. Similar results for shoreside production, is how long the fishwere obtained during the in-plant analysis as can be kept at refrigerated temperatures andwell. It is unclear whether these poor-quality still be processed into a good-quality product Iffish are the result of capture methods, han- a strain of 1.8 (which is the minimum straindling, or unloading practices, or whether prob- value that correlates with the traditional Japa-lems were intrinsic to the fish and would be nese double-fold test for surimi) is used as apresent regardless of capture or handling tech- cut-off point, then our results show that apniques. A preliminary study was conducted proximately two days may be the maximumcomparing vacuum unloading to bucket un- time that Pacific whiting can be stored in iceloading, but there was no significant difference before it is made into an acceptable grade ofbetween the two methods. More research surimi. However, fish processed into surimineeds to be done on the fishing and handling within 24 hours of capture possibly will yieldpractices in order to determine their actual ef- stronger gels and a higher-grade product com-fects on product quality. manding higher market prices.
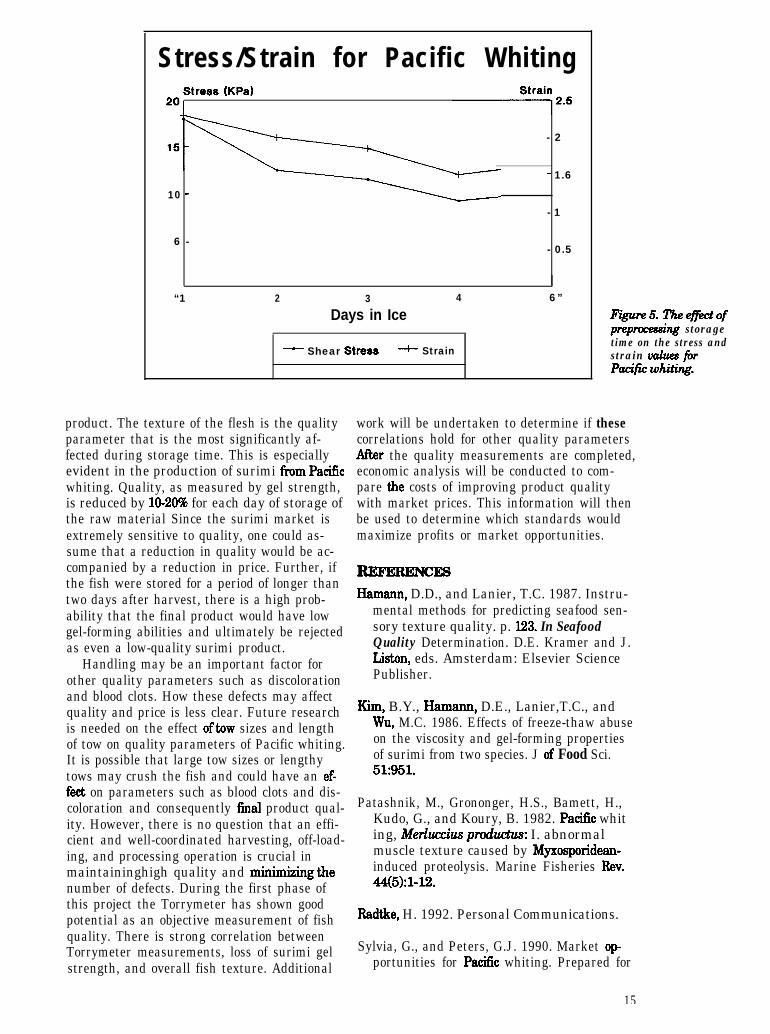
The torsion test was run on surimi madeeach day from Pacific whiting kept on ice.These results are shown in Cgure 5. There wasa 10-208 decrease in stress and strain valuewith each day of processing up to day four ofthe experiment. On the final day there was aslight increase in the values. As mentionedpreviously, the torsion test is a newly devel-oped method for determining protein function-ality and can be used to objectively determinequality as well. During the 1991 fishing sea-son, there was a great deal of interest in theuse of Pacific whiting for surimilheuseofprotease inhibitors during the production ofsurimi would allow for its use in this area.However, if whole Pacific whiting is stored fora number ofdays, the muscle tissue will dete-
CONCLUSIONSThe initial phase of this project was de-
signed to provide researchers with insightsinto the quality parameters of Paciiic whiting,especially as they pertain to onshore process-ing. Preliminary results suggest that time andtemperature are the most critical parametersfor maintaining good raw material for qualityprocessed product The protease activity in Pa-cific whiting muscle tissue warrants that thefish be captured, brought to shore, and pro-cessed immediately. A 24-hour delay in off-loading or processing could have a sign&antimpact on the final product quality and be re-sponsible for the rejection or low price of the
14
Stress/Strain for Pacific Whitingstress (~~81
201
- 2
- 1.610 -
- 1
6 - - 0.5
“1 2 3 4 6”Days in Ice
- Shear Stre88 + Strain
product. The texture of the flesh is the qualityparameter that is the most significantly af-fected during storage time. This is especiallyevident in the production of surimi from Pacificwhiting. Quality, as measured by gel strength,is reduced by 1620% for each day of storage ofthe raw material Since the surimi market isextremely sensitive to quality, one could as-sume that a reduction in quality would be ac-companied by a reduction in price. Further, ifthe fish were stored for a period of longer thantwo days after harvest, there is a high prob-ability that the final product would have lowgel-forming abilities and ultimately be rejectedas even a low-quality surimi product.
Handling may be an important factor forother quality parameters such as discolorationand blood clots. How these defects may affectquality and price is less clear. Future researchis needed on the effect oftow sizes and lengthof tow on quality parameters of Pacific whiting.It is possible that large tow sizes or lengthytows may crush the fish and could have an effeet on parameters such as blood clots and dis-coloration and consequently final product qual-ity. However, there is no question that an effi-cient and well-coordinated harvesting, off-load-ing, and processing operation is crucial inmaintaininghigh quality and minin&>henumber of defects. During the first phase ofthis project the Torrymeter has shown goodpotential as an objective measurement of fishquality. There is strong correlation betweenTorrymeter measurements, loss of surimi gelstrength, and overall fish texture. Additional
Figure5 Theejjktofprepmcessing storagetime on the stress andstrain values firPacijk w?biting.
work will be undertaken to determine if thesecorrelations hold for other quality parametersARer the quality measurements are completed,economic analysis will be conducted to com-pare the costs of improving product qualitywith market prices. This information will thenbe used to determine which standards wouldmaximize profits or market opportunities.
RmERJmcEsHamann, D.D., and Lanier, T.C. 1987. Instru-
mental methods for predicting seafood sen-sory texture quality. p. 123. In SeafoodQuality Determination. D.E. Kramer and J.Liston, eds. Amsterdam: Elsevier SciencePublisher.
Kim, B.Y., Hamann, D.E., Lanier,T.C., andWu, M.C. 1986. Effects of freeze-thaw abuseon the viscosity and gel-forming propertiesof surimi from two species. J of Food Sci.51:951.
Patashnik, M., Grononger, H.S., Bamett, H.,Kudo, G., and Koury, B. 1982. Pacif% whiting, Merluccius productus: I. abnormalmuscle texture caused by Myxosporidean-induced proteolysis. Marine Fisheries Rev.44(5):1-12.
Badtke, H. 1992. Personal Communications.
Sylvia, G., and Peters, G.J. 1990. Market opportunities for Pa&c whiting. Prepared for
15

the State of Oregon. Administered through methods guide. Prepared for Canadian In-Oregon Coastal Zone Management Associa- stitute of Fisheries Technology Technicaltion. University of Nova Scotia
Woyewoda, AD., and Shaw, S.J. 1985. Opera-tional ground&h grading and laboratory
16
WE OFVAIXI~IJS GRADES OF SURJMI~~~HANAPEJCATION OF LEAST COST FORMULATION Jae W. ParkOregon State University Seafood Laboratory, Astoria, Oregon
INTRODUCTIONLeast cost (LC) formulation is a computer-aided technique that has been used success-fully for many years in the food industry, par-ticularly in conjunction with formulated prod-ucts such as processed meats. The technique isuseful in allowing a manufacturer greater vari-ability in the properties of the raw materialswhile insuring that the quality of the finishedproduct consistently meets rigid standards.The computer selects the type and amount ofeach raw material in a formulation on the ba-sis of raw material price, properties (composi-tional and functional), and targets of qualitystandards. In initiating use of the technique,we first have to determine the relationship be-tween raw material properties and the qualityof the finished products. We do this by accu-rately analyzing the properties of raw materi-als in current formulations of a product. Sev-eral batches should be examined to set up anacceptable range for each property, thus estab-lishing a quality control “window.”
EowTO~YINsJRIIvD-DASEDSEAFOODS
With respect to a surimi-based food, wemust determine an acceptable range of valuesin color, flavor, and texture of surimi, sincesurimi forms the base protein matrix in whichare imbedded all other constituents. Becausesurimi generally has a bland odor and is white,the flavor and color are generally derived fromother ingredients. Therefore, the flavor andcolor are held to the minimum in most cases.The gel-forming ability of surimi becomes ofprime importance in the acceptance of surimiseafoods. Textural properties can be measuredby preparing a test gel from surimi, salt, andice or water and determining the properties ofshear stress (strength of gel) and shear strain(cohesiveness and rubberiness) of the gel, us-ing a torsional test. The gel properties of thebatter of the finished product can be measuredin the same way. A window of acceptance con-stituting the upper level control and lowerlevel control of each parameter for both a rawmaterial krrimi) and a finished product can be
plotted on a stress vs. strain diagram, asshown in figure 1.
While this approach ensures a tinishedproduct of the desired quality, it follows thattight specifications for the raw material(surimi) may eliminate many available lots ofsurimi from consideration asan ingredient.This can not only present a challenge to thecompany buyer trying to locate sufllcient rawmaterial for production, but could also force upthe price of that surimi which is in demand.The lower-cost surimi may not meet the speci-fication; thus, surimi which does meet thespecification becomes more expensive, and thecost of manufacturing the product goes up.Among commercially available low-to-mediumgrade surimi, certain quality parameters showthe quality of high-grade surimi.
A more ideal approach for quality controlwould entail setting specifications on surimi tobe used, but would allow for blending of otherlots outside that specification in order to meetthe target window (figure. 2). The selection ofsurimis for blending with the wide diversity ofsurimi qualities and price available will meetthe desired objective of consistent productquality at least cost only when the quality pa-rameters of all available surimis are analyzedaccurately and applied properly.
Optimum use of the LC formulation forsurimi-based seafoods will be obtained whenthe linear program is allowed to select differinglevels and types of functional ingredients inaddition to surimi, such as starch and proteinadditives. Each ingredient must be tested atvarious levels in a surimi gel under standardconditions. The slope of the resulting plot ofstress and strain values versus ingredient levelbecomes the factor, or constant, used in the LCequation to predict the effect of its addition onthe product
CONCLUSIONThe Lc foi%MMkxl L m i3~GiG&iafi &&i-
nique. It is an effective means of controllingthe quality of formulations while minimizingingredient costs. Implementing a standardizedtesting procedure for all incoming ingredientsis the first step. The various range of raw ma-
17
SHEAR
STRESS
Figure 1. Controlof finishedproductspecificationusing a singlesurimi.
SHEAR
STRESS
Figure 2. Controlof finishedproductspecificationusing a blendingtechnique
FINISHED PRODUCT
RAW SURIMI
SHEARSTRAIN
FINISHED PRODUCT
SURIM A -
SHEAR STRAIN
18

terials (including Pacific whiting) can be usedin surimi-based seafoods formulation with anadoption of the least-cost program approach.
mulations. Alaska Fisheries DevelopmentFoundation.
Park, J. 1989. Practical application of surimi-Es and other tictional ingredients to least
Lanier, T.C. and Park, J. 1990. Application ofcost linear program. The 1989 International
surimi quality measurements to least costChemical Congress of Pa&c Basin Societ-
linear programming of surimi product for-ies, Honolulu, Hawaii.
19

CRYOPR~CTION OF SURJMS
Figure 1: Factorsthat afict,directly orindirectly,muscle proteindenaturutionand consequentloss of proteinfunctionalityduringfrazenstorage.MPM
ljre C. tinier and Gmnt A MacDonaldFood Science Department, North Carolina State University
INTRODCJCTTONThe myofibrillar (muscle) proteins of most fish,being cold-blooded, are known to be more labileto denaturation than the contractile proteins ofhomeotherms commonly converted to meat forfood, including beef, pork, and poultry (Connell1961). For this reason, surimi, the refined myo-fibrillar component of fish muscle, requires theinclusion of a cryoprotective component priorto freezing to ensure long-term stability of theproteins in frozen storage. This in turn assuresgood functionalitv of the material in food
surimi under the same conditions. The formermaterials have greater stability, not only be-cause of their homeotherm origin, but also be-cause red meats and poultry are more com-monly stored in whole muscle form, in whichreactive components of the muscle are morecompartmentalized from one another. Addi-tionally in these materials, the myofibrillarproteins have not been refined from the water-soluble fraction, certain components of whichare known to have a stabilizing effect on myofi-brillar proteins during frozen storage (Jiang et
manufacture, expressed primarily as gel-form- aL 1987% c; Loomis et al. 1989). -ing potential with its manifestations of tezture Figure 1 summarizes some of the changesformation and water-binding properties. which may occur in a muscle protein system
Red meat (mammalian) and poultry muscles during freezing and frozen storage (Haard Inare commonly stored frozen without press; Shenouda 1980; Sikorski et al. 1976).cryoprotective additives and certainly suffer Muscle proteins express their functionali~less deterioration in functionality than would only when the saltsoluble proteins are fully
FREEZE-INDUCED CHANGES IN MUSCLE PROTEINS
I PROTEIN DENATURATION and/or AGGREGATION I
This article was extracted fkom a paper published under the title, “Carbohydrates as cryoprotectan~ for meats andsurimi,” Food Z’echubgy, 1991,46(3):160-16%
20

extracted (solubilixed), and cryoprotection ispossible only when intimate association of thecryoprotectant and the protein molecules oc-curs. Thus, both the expression andcryoprotection of muscle protein functionalitywill optimally occur in a minced or commi-nuted muscle system like surimi.
CRYOPRoTEcllvE ADDITIVESNoguchi (1974) surveyed a wide variety of
chemical compounds for their ability to main-tain the solubility of carp actomyosin (muscleprotein) in dilute solutions over brief periods offrozen storage. This model system was demon-strated to predict well the ability of compoundsto cryoprotect the functionality of surimi dur-ing extended frozen storage. Besides a varietyof carbohydrate compounds, including most ofthe mono- and disaccharides evaluated andseveral low molecular weight polyols, manyamino acids and carboxylic acids were alsofound to be cryoprotective.
Other workers have also reported thecryoprotective action of a number of amino ac-ids, quaternary amines, and other compoundswith regard to the stability of various proteinsand enzymes (Jiang et al. 1987a, b; Loomis etal. 1988,1989).
The nucleotides ATP, ADP, and IMP havebeen shown to exert a protective effect on fishactomyosin stored at -20°C while the nucle-otide catabolites inosine and hypoxanthine de-stabilized these proteins (Jiang et al. 1987c).This tinding may help explain why freshfish, with consequently higher concentrationsof ATP, ADP, and IMP, are more stable duringfrozen storage than less fresh fish (Dyer andPeters 1969; Fukuda et al. 1984).
Watanabe et al. (1988) demonstrated thecryoprotective ability of certain surfactants,particularly certain polyoxyethylene sorbitanesters and sucrose esters, in preventing loss ofgel-forming ability in surimi. These are com-mon additives in many Japanesecryoprotectant formulas. A cryoprotective ef-fect has even been attributed to triglycerides(fats), in that free fatty acids, which may bereleased through hydrolysis of phospholipidsand react to denature proteins, are thoughtinstead to preferentially react with triglycer-ide, thus indirectly protecting the proteins@Vessels et al. 1981).
Sucrose or sorbitol, typically alone or mixed1:l and added at 8% w/w to leached fishmuscle, serves as the primary cryoprotectantin the manufacture of surimi from Alaska pol-
lock. Polyphosphate at 0.2-0.38 is also com-monly added, ostensibly as a synergist to thecryoprotective effect of the carbohydrate addi-tives, although its effectiveness in this regardis questionable in light of recent evidence(Park et al. 1988). These carbohydrates werechosen because of their relatively low cost,good availability, and low tendency to causeMaillard browning in the bright whitekamaboko products typically enjoyed by theJapanese. However, these additives impart aconsiderably sweet taste to the surimi thatmany Western consumers have found objec-tionable for certain product applications. Thus,there has been some effort in the United Statesto select nonsweet additives with a cryoprotec-tive effect equal to that of sucrose or sorbitol
Lanier and Akahane ( 1986) discovered andpatented the use of Polydextrosee, a nonsweet,low calorie, bulking agent, for thecryoprotection of muscle proteins. They com-pared its effectiveness with that of sucrose andsorbitol and a lo-DE maltodextrin (also havingno sweetness) in maintaining the salt-sold-ity and gel-forming properties of Alaska pol-lock surimi. While the three additives main-tained similarly high levels of solubility in themyofibrillar proteins at -28°C over severalmonths compared to a control, the surimi con-taining the lo-DE maltodextrin failed t.c formstrong and cohesive gels (figure. 2). These re-sults were interpreted as indicating that the 10DE maltodextrin interfered with the gelationof the surimi myofibrillar protein, in much thesame way as occurs with pregelatinixed starchand certain gums (Lim et al. 1990; Foegedingand Ramsey 1986,1987). A more recent study(Anderson 1990) indicates the potential of us-ing higher DE starch hydrolysis products aseffective cryoprotectants with less interferencein the gelation process of the proteins.
Many other low-MW sugars and polyolsthat could be used as muscle cryoprotectantsare currently or soon to be available. Lactitoland lactulose reportedly have low sweetness,the former having also been demonstrated toeffectively cryoprotect surimi protein (Sych etal. 19904 b). Maltitol, isomalt, and hydroge-nated glucose syrups could also be consideredfor special applications (Sych et al. 199Oa). Ed-ible gums have been proposed to function aseffective cryoprotectants, but tests have failedto demonstrate their effectiveness (da Ponte etal. 1985a, b, c). The reduced functionality ofmuscle proteins in the presence of gums mayresult from their competition for water withprotein, or from interaction with proteins,
21
(a)&OLYDEXTROSE
YALTODEXTRIN l
(10 D.E.)
2 4 6
Months0
(W
StiCROSE-SORBITOL
j > , C_ONTR,CL , d ,
0 2 4 6
Months
Figure 2: Surimi: Effkcta of ao?ded ctyopmtectants on maintenance of (a) gel-firming properties and Cb)protein extmctability during j&en storage. Stress and stmin at fbilure wrtvspond to the strength andcohesiveness, respectively, of heat set gels prepared +rn surimi wntaining 2% salt.

which results in poor protein gelation. Adding exclusion (implying that the protein is thusgums in the fully hydrated form without add- protected against surface dehydration duringing excess water, and attaining concentrations freezing), the true protective effect is explainedsufficient for cryoprotection are additional thermodynamically. The addition of protectiveproblems in the practical’application of gums solutes results in a positive 6mfavorable) freeas cryoprotectants. energy change because the sugar is excluded
from the nrotein surface. The magnitude of
MECHANBM!3OFPRoTEINCRYOPROTEC~ON
The most commonly used cryoprotectants inthe food industry have been low-MW sugarsand polyols, such as sucrose and sorbitol usedin surimi manufacture. While the mechanismsof cryoprotection by such molecules are notfully understood at present, it is known thatthey are able to stabilize proteins throughtheir interaction with the surrounding water.Higher-MW carbohydrates seem to work byanother, or additional, mechanism and willtherefore be discussed separately.
Low Molecular Weight CarbohydratesSucrose and sorbitol not only act as
cryoprotectants, but are also known to stabilizeproteins to the denaturing effects of heat (Backet al. 1979; Park and Lanier 1987,1990X Simi-larly, sodium chloride addition, which wasfound to promote freeze denaturation of beef(Park et al. 1987), has been shown lo destabi-lize myofibrillar proteins to heat denaturation(Wu et al. 1985). Thus, the mechanism of heatstabilization by low-MW carbohydrates mayalso explain their cryoprotective properties.
By means of high precision densimeter mea-surements, Arakawa and TimashefF (1982)were able to show that the stabilizing solutemolecules (sugars, low-MW polyols) were ex-cluded from the surface of the protein mol-ecule, thus Upreferentially hydrating’ the pro-tein (figure 3). While this “preferential hydra-tion” of the protein has sometimes been identi-fied as the primary protective effect of solute
this unfavorable free energy shiftlis assumedto be in proportion to the surface area of theprotein, that is, the volume of the cavity occu-pied by the protein and its hydration shell.Since the protein cavity is assumed to begreater when the protein is unfolded, thismeans that the native state of the protein isthermodynamically favored in a solution ofsugar and low-MW polyol.
This explanation of the mechanism ofcryoprotection by low-M%’ sugars and polyolsis in direct contradiction to that forwarded byMatsumoto (1979), who envisioned a protectivecoating of the protein by cryoprotectant mol-ecules. Arakawa et al. (1990) noted that cer-tain compounds, such as DMSO, proline, PEG,and ethylene glycol, are known to be preferen-tially excluded from the surface of proteins atroom temperature and are equally effectivecryoprotectants. However, at temperaturesabove ambient, these compounds preferentiallyinteract with the protein surface and as a re-sult destabilize proteins at these temperatures.Crowe et al. (1990) noted that the protein de-naturants urea and guanidine hydrochlorideact by binding to the the protein surface. Theyconcluded that therefore “it does not seemlikely . . . that stabilization of proteins duringfreezing involves direct interaction with thesolute.”
The preferential exclusion of solutes fromthe protein surface has been largely attributedto the effects of the solute in increasing thesurface tension of water (Arakawa andTimashefT 1982; Carpenter and Crowe 1988;Arakawa et al. 1990). However, severalcryoprotective compounds are thought to be
Figure 3: Solute exclusionfrom the awily occupied bythe protein and itshydration sheu (shadedarea), the black dotssignijj&g solute molecules.
23
excluded by other mechanisms, such as bystearic hindrance. Glycerol, which actually de-creases the surface tension of water, is, how-ever, excluded from the protein surface by anunknown mechanism.
That many of the cryoprotectant sugars andpolyols do increase the surface tension of watermay be important in other ways to protein sta-bilization. Back et al. (1979), from careful mea-surements, noted that “hydrophobic interac-tions between pairs of hydrophobic groups arestronger in sucrose or glycerol solutions thanin pure water” and concluded that “this is themechanism by which sugars and polyols ingeneral may stabilize proteins to heat denatur-ation.” Similarly, Melander and Horvath(1977) addressed the issue of why certain saltsof the Hofmeister or lyotropic series have a sta-bilizing effect on proteins. They were able todemonstrate that such stabilization resultsfrom a strengthening of the protein intramo-lecular hydrophobic interactions in the pres-ence of these salts and concluded that “theproperty of a salt that afFects hydrophobic in-teractions is quantified by its molal surfacetension increment.”
Thus, it may be concluded that those polyolsand sugars which do increase the surface ten-sion of water may act to stabilize proteins du-ally by favoring solute exclusion from the pro-tein surface and by enhancing the strength ofintramolecular hydrophobic interactions.
Because several workers have shown thatthe addition of such sugars as sucrose and tre-halose can stabilize proteins to the denaturinginfluences of drying (Matusuda 1979,198l;Carpenter et al. 1987a, b, 1988,199O; Crowe etal. 19901, it has been tempting to ascribe toboth the cryoprotection and “dryoprotection”properties of these compounds the samemechanism. However, Crowe et al. (1990) andCarpenter et al. (1990) have demonstratedthat, in the case of preserving protein struc-ture in desiccation, it is a preferential interac-tion of solute with the protein surface that isrequired. Only certain disaccharides, amongthem sucrose, maltose, and trehalose, seem tomeet the stearic requirements such as to allowthem to, in effect, replace water molecules onthe surface of the protein and thus stabilizethe native protein structure in the virtual ab-sence of water. Many other compounds knownto be effective cryoprotectants were found to beineffective in protecting proteins from the de-naturing effects of drying.
High Molecular Weight CarbohydratesCarpenter and Crowe (1988) theorized that
certain high MW polymers, such as polyvinyl-pyrrolidone, polyethylene glycol, and dextran,are good cryoprotectants because they arestearically excluded from the protein surfaceby their size. However, an entirely differentmechanism has been postulated by other work-ers to explain the cryoprotective effects ofmany high MW polyols and glucose polymers(starch hydrolysis products). This so-called“cryostabilization” theory is based upon theability of high-MW solutes to raise the glasstransition temperature (Tg) of a solution(Levine and Slade 1988a, b).
Figure 4 illustrates the glass transition tem-perature of a simple solution. At higher con-centrations of solute, the Tg occurs at tempera-tures above freezing. Thus, the mixture coolsto form a “candy” glass directly from the liquidstate. At solute concentrations below the pointTg’, when the temperature falls below thefreezing curve, the solution will exist either asa viscous supersaturated solution in the liquidstate or more commonly as a mixture of icecrystals and supersaturated solution. Underthese conditions, the system is termed a “rub-ber,” exhibiting a high viscosity caused by thepresence of ice crystals or strong, intermolecu-lar solute interactions and entanglements. Inthe rubber state, ice crystal numbers and sizesmay increase, the various chemical deteriora-tive processes of Qure 1 continue to proceed,and thus the stability of proteins under theseconditions is poor. The rate of freezing and theconstancy of storage temperature will of courseinfluence ice crystal sizes and numbers, andlikewise the solute concentration (Pranks1985a, b). Thus, Tg may be altered by time fac-tors not shown in this two-dimensional phasediagram.
In contrast, the glassy state is a muchharder solid, with viscosities near 1014 Pa.s(Franks 1985a), in which reactions become diffusion limited as the result of immobilizationof the water within a solute structure meloar1970). This structure is formed when solute-solute interactions supersede solute-water at-tractions and occurs at the Tg for the given sol-ute and concentration. The structure is amor-phous, like that of the liquid, with no crystal-linity other than that of the enmeshed ice crys-ta l s .
Cryostabilization of proteins, then, involvesaddition of a solute to raise the Tg to a tern-perature above that of the storage tempera-ture, thereby ensuring that the system is in
24
rLIQUID
ICE
SOLUTION(rubber)
Solute Concentration
the glass state. This effectively shuts down thedeteriorative processes depicted in figure 1,including ice crystal formation, since the wateris immobilized in the glass structure. Thusthere are fundamental differences between themechanisms of “cryoprotection” by low-MWsugars and polyols and “cryostabilization” byhigh-MW polymers: cryoprotectants functionby altering the thermodynamics of the systemto favor the native state of the protein, whilecryostabilixers act to enmesh the protein in aglass wherein all deteriorative processes aregreatly slowed.
The requirement in cryostabilization for useof polymers exhibiting relatively large MWarises from their ability to form glasses athigher temperatures. This is due to their pro-pensity to entangle as well as to form hydrogenand other bonds, imparting a greater viscosityat any given concentration. Levine and Slade(1986,1988b) published tables and graphswhich indicate a generally direct relationshipbetween molecular weight (or, inversely, dex-trose equivalent, DE, for starch hydrolysisproducts) and Tg. Branching ofthe moleculewill affect the solution properties of polymers,such that a strictly direct relationship betweenMW and Tg will hold only for a homologousseries. Selection of the proper polymer thus ef-fectively narrows the temperature range be-tween Tf (on the freexing temperature curve)and Tg, in which the system exists as a lessstable rubber.
Lim and co-workers (Lim et al. 1990; Lim1989) recently attempted to demonstrate theprinciple of cryostabilization in the freezing ofleached fish muscle (surimi). In model studiesusing salt-soluble protein to represent thesurimi, they found that maltodextrin (Tg =-10%) protected the solubility of the protein ina much more temperature-dependent fashion
Figure 4: Schematic@=diagmmftKa binay system inwhich the solutecomponent does notCrySfallize.
than did sucrose. However, there was not adramatic change in the stability ofthemaltodextrin-containing system when theycompared the response to storage tempera-tures just above and below the Tg ofmaltodextrin at that concentration, as mightbe expected if a sharp glass transition tookplace in the system. Surimi also behaved simi-larly to the model system with respect to thestability of the proteins in the presence ofthese two carbohydrates.
Carboxymethylcelhdose was also tried inthese systems (Lim et al. 1990; Lim 1989), butit failed to protect the proteins and seemed tointerfere with their heat-induced gelation.Thus, in practice, there may be limitations inapplying the cryostabilization approach tomaintain muscle protein functionality in fro-zen storage.
l?RcWTICAL CONSIDERATIONSAlthough several workers have attempted to
employ cryoprotectant compounds in the freex-ing preservation of intact muscle, their effortshave not met with much success (&ivcheniaand Pennema 1988a, b, Krueger and Pennema1989). Obviously, either of the mechanistic ap-proaches outlined in this article depends onintimate association of the cryoprotectant mol-ecules and the protein, which is difIicult toachieve in other than a comminuted system.
In surimi production, sucrose and sorbitolhave been adopted as the primary cryoprotec-tive additives for several reasons: relativelylow cost, good availability, good safety record,broad legal status, good sohrbility, and berm&cial functional effects (with only one minor ex-ception, sweetness). There is currently no rea-son to suspect that cryoprotectants now usedfor pollock are not equally well suited for Pa-
cific whiting surimi. Much of the attention paidto alternative cryoprotectants for surimi hasfocused on sweetness reduction, with minoremphasis on caloric reduction. In this area ofconcern, cryostabilization by polymers such asmaltodextrins or Polydeztrose@ could be viablealternatives, and maltodeztrins are also lesscostly than sucrose and sorbitol. Dextrose isalso a cheaper alternative, but Maillard brown-ing reactions from reducing sugars may limitapplication in light or white-colored productsof fish and poultry. More serious is the detri-mental effect, discussed above, which certainhigh-MW polymers have on gelation propertiesof muscle proteins.
C ONCLUSIONS
Carbohydrates have generally been themost acceptable cryoprotectants for muscle ap-plications (that is, surimi). New carbohydratesare becoming available which may be consid-ered in order to achieve cost, sweetness, or ca-loric reductions. It is considered that all carbo-hydrates that are effective in protecting pro-teins from the denaturing effects of freezingand frozen storage act by at least one of twomechanisms: cryoprotection, in which the addi-tion of primarily 1owMW sugars and polyolsthermodynamically favors the maintenance ofthe native protein state; and cryostabilization,in which primarily high-MW polymers efFec-tively raise the glass transition temperatureand ensure a less reactive glass state in thesystem at conventional freezer temperatures.
A future direction in cryoprotection may beto combine various compounds to create“qyoprotectant cocktails,” which may be moreeffective than simple compounds alone. In thisrespect, it is interesting that the gall fly larva(Eumsta soliduginis) is known to generate in-tracellularly a mizture of carbohydrates andpolyols to allow it to survive overwintering incold climates (Wasylyk et al. 1988). Such anapproach may prove to yield synergies, as maythe exploration of interactions between carbo-hydrates and certain ions, organic acids, oramino acids.
Processors of surimi may as a result deter-mine approaches for better maintaining thefunctionality of their raw materials in both fro-zen and dry forms, thereby realizing both costsavings in usage and more consistent qualitycontrol in production.
26
REFERENCESAnderson, R.J. 1990. Personal communication.
Grain Processing Corp., Muscatine, IO.
Arakawa, T., Carpenter, J.F., Kita, Y.A andCrowe, J.H. 1990. Basis for tozicity of cer-tain cryoprotectants: A hypothesis. Cryobiol-ogy 27: 401.
Arakawa, T. and TinrasheR, S.N. 1982. Stabili-zation of protein structure by sugars.B&hem. 21: 6536.
Back, J.F., Oakenfull, D. and Smith, M.B.1979. Increased thermal stability of proteinsin the presence of sugars and polyols.Biochem. 18: 5191.
Carpenter, J.F., Crowe, J.H. and Arakawa, T.1990. Comparison of solute-induced proteinstabilization in aqueous solution and in thefrozen and dried states. J. Dairy Sci.73:3627.
Carpenter, J.F. and Crowe, J.H., 1988. Themechanism of cryoprotection of proteins bysolutes. Cryobiology 25244.
Carpenter, J.F., Martin, B., Crowe, LM. andCrowe, J.H. 1988. Long-term preservation ofdried phosphofiuctokinase by sugars andsugar/zinc miztmes. Cryobiology 25372.
Carpenter, J.F., Crowe, L.M. and Crowe, J.H.1987a. Stabilization of phosphofructokinasewith sugars duringfreezede character-ization of enhanced protection in the pres-ence of divalent cations. Biochimica etBiophysics Acta. 923: 109.
Carpenter, J.F., Martin, B., Crowe, L&L andCrowe, J.H. 1987b. Stabilization ofphospho-fructokinase during air-drying with sugarsand sugar/transition metal miztures. Cryo-biology 24~455.
Connell, J.J. 1961. The relative stabilities ofthe skeletal muscle myosins of some ani-mals. B&hem. J. 80:503.
Crowe, J.H., Carpenter, J.F., Crowe, LM. andAnchordoguy, T.J. 1990. Are freezing anddehydration similar stress vectors? A com-parison of modes of interaction of stabilizingsolutes with biomolecules. Cryobiology27219.
da Ponte, D.J.B., Eoozen, J.P. and Pihrik, W.1985a. Effects of additions on the stabihtyof frozen stored minced fillets of whiting. IVarious anionic hydrocolloids. J. Food QuaI.851.
da Ponte, D.J.B., Boozen, J.P. and Pihrik, W.1985b. Effects of additions on the stabilityof frozen stored minced fillets of whiting. IIVarious anionic and neutral hydrocohoids.J. Food QuaI. 8:175.
da Ponte, D.J.B., Herfst, J.M., Boozen, J.P. andPihiik, W. 1985c. Effects of different types ofcarrageenans and carboxymethyl celluloseon the stability of frozen stored minced fil-lets of cod. J. Food Technol. 20:587.
Dyer, W.J. and Peters, J. 1969. Factors influ-encing quahty changes during frozen stor-age and distribution of frozen products, in-cluding glazing, coating and packaging. In“Freezing and Irradiation of Fish,” ed. RKreuzer,p. 317. Fishing News (Books) Ltd.,London, U.K
Foegeding, EA and Ramsey, S.B. 1987. Bheo-logical and water holding properties ofgelled meat batters containing iota carrag-eenan, kappa carrageenan or xanthan gum.J. Food Sci. 52549.
Foegeding, E.A and Ramsey, S.R 1986. Effectof gums on low-fat meat batters. J. Food.sci. 5133.
Franks, F. 1985a. Complex aqueous systems atsubzero temperatures. In “Properties of Wa-ter in Foods,” ed. D. Simantos and J.L.M&on p. 497. Martinus Nijhoff Pub.,Dordrecht, the Netherlands.
kanks, F. 198513. Biophysics and biochemistryat low temperatures. Cambridge Univ.Press, U.K.
Fukuda, Y., Tarakita, Z. and Arai, K 1984. Ef-fect of freshness of chub mackerel on thefreeze denaturation of myo6briIIar protein.Bull. Japan. Sot. Sci. Fish. 50:845.
Haard, N.F. In press. Biochemical reactions infish muscle during frozen storage. Presentedin 1990 at “Seafood 2000.” Canadian Inst.Fish. Tech., Halifax, Nova Scotia.
Jiang, S.T., Hwang, B.O. andTsao, C.T. 1987a.Protein denaturation and changes in nucle-
otides of fish muscle during frozen storage.J. Agric. Food Chem. 3522.
Jiang, S.T., Tsao, C.Y. and Lee, T.C. 198713.Effect of free amino acids on the denatur-ation of mackerel myofibriIIar proteins invitro during frozen storage at -20%. J.Agric. Food Chem. 35:28.
Jiang, S.T., Hwang, B.O. and Tsao, C.T. 1987c.Effect of adenosine-nucleotides and theirderivatives on denaturation of myofibriIlarproteins in vitro during frozen storage at -20°C. J. Food Sci. 52:117.
Krivchenia, M. and Fennema, 0.1988a. Effectof cryoprotectants on frozen whitefish fillets.J. Food Sci. 53:999.
Krivchenia, M. and Fennema, 0.1988b. Effectof cryoprotectants on frozen burbot filletsand a comparison with whitefish fillets. J.Food Sci. 53:1004.
Krueger, D.J. and Fennema, OR 1989. Effectof chemical additives on toughening of filletsof frozen Alaska pollack (Theragmdtukogmmma). J. Food Sci. 54:llOl.
Lanier, T.C. and Akahane, T. 1986. Method ofretarding denaturation of meat products.US Patent no. 4,572,838.
Levine, H. and Slade, L. 1988a. A food polymerscience approach to the practice ofcryostabihzation technology. CommentsAgric. Food Chem. 1:315.
Levine, H. and Slade, L. 198813. Principles of“cryostabiIization” technology from struc-ture/property relationships of carbohydrate/water systems. A review. Cxyo-Lett. 9:21.
Levine, H. and Slade, L. 1986. A polymerphysico-chemical approach to the study ofcommercial starch hydrolysis products(SHPs). Carbohydr. Polym. 6:213.
Lim, M.H., Reid, D.S. and Haard, N.F. 1990.Cryostabihzers for surimi-which to choose.Presented at Inst. Food Technologists An-nual Meeting, Anaheim, CA, June 16-20.
Lim, M.H. 1989. Studies of reaction kinetics inrelation to thermal behavior of solutes infrozen systems. Ph. D. thesis. Univ. Cabfor-nia, Davis, CA
27

Loomis, S.H., Carpenter, T.J., Anchordoguy,T.J., Crowe, J.H. and Branchini, B.R. 1989.Cryoprotective capacity of end products ofanaerobic metabolism. J. Ezp. Zoo. 252:9.
Loomis, S.H., Carpenter, T.J. and Crowe, J.H.1988. Identification of strombine and tairineas cryoprot.ectants in the intertidaI bivalveMytilus edulis. Biocbem. et Biophys. Acta.943:113.
Matsumoto, J.J. 1979. Denaturation of fishmuscle proteins during frozen storage. In“Proteins at Low Temperatures,” ed. 0.Fennema, p. 206. ACS Adv. in Chem. Series.Washington, D.C.:206-224.
Matusuda, Y. 1981. Protein denaturation dur-ing freeze-drying of carp myofibrils. Bull.Japan. Sot. Sci. Fish. 47:813.
Matusuda, Y. 1979. Influence of sucrose on theprotein denaturation of Iyophihzed carpmyofibrils during storage. BuU. Japan. Sot.Sci. Fish. 45:581.
Melander, W. and Horvarth, C. 1977. Salt ef-fects on hydrophobic interactions in precipi-tation and chromatography of proteins: Aninterpretation of the lyotropic series. Arch.B&hem. Biophys. 183:200.
Noguchi, S. 1974. The control of denaturationof fish muscle proteins during frozen stor-age. Ph.D. thesis, Sophia Univ., Tokyo.
Park, J.W. and Lanier, T.C. 1990. Effects ofsalt and sucrose addition on thermal dena-turation and aggregation of water-leachedfish muscle. J. Food Biochem. 14:395.
Park, J.W., Lanier, T.C. and PiIkington, D.H.1990. Effects of Polydeztrose@ and/or phos-phates on cryostabihzation of functionalproperties of pre-rigor and post-rigor beef.Unpublished data.
Park, J.W., Lamer, T.C. and Green, D.P. 1988.Cryoprotective effects of sugar, polyols, and/or phosphates on Alaska pollack surimi.1988. J. Food Sci. 53:l
Park, J.W., and Lanier, T.C. 1987. Combinedeffects of phosphates and sugar or polyol onprotein stabilization of fish myofibriIs. J.Food Sci. 52:1509.
28
Park, J.W., Lanier,T.C., Keeton, J.T. andHamann, D.D. 1987. Use of cryoprotectantsto stabihze functional properties of prerigorsalted beef during frozen storage. J. FoodSci. 52~537.
Shenouda, S.Y. 1980. Theories of protein dena-turation during frozen storage of fish flesh.Adv. Food Res. 26:275.
Sikorski, Z., Olley, J. and Rostuch, S. 1976.Protein changes in frozen fish. Crit, Rev.Food Sci. Nutri. 8:97.
Sych, J., Lacroiz, C., Adambounou, LT. andCastaigne, F. 1990a Cryoprotective ef&ctsof lactitol, palatinit and PolydeztroseQ oncod-surimi proteins during frozen storage. J.Food Sci. 55:356.
Sych, J., Lacroiz, C., Adambounou, L.T. andCastaigne, F. 199Ob. Cryoprotective effectsof some materials on cod-surimi proteinsduring frozen storage. J. Food Sci. 55:1222.
Treloar, L. R. G. 1970. “Introduction to Poly-mer Science.” Springer-Verlag Pub., NewYork.
Wasylyk, J-M., Tice, AR and Baust, J.G.1988. Partial glass formation: A novelmechanism of insect cryoprotection. Cryobi-ology 25~451.
Watanabe, T., Kitabatake, N. and Doi, E. 1988.Protective effects of non-ionic surfactantsagainst denaturation of rabbit skeletal myo-sin by freezing and thawing. Agric. Biol.Chem. 252517.
Wessels, J.P.H., Simmonds, C.K, Seaman,P.D. and Avery, LW. J. 1981. The effect ofstorage temperature and certain chemicaland physical pretreatments on the storagelife of frozen hake mince blocks. Ann ReportNo. 35, p. 32, Fishing Industry Research In-stitute, Capetown, South Africa.
Wu, M. C., Akahane, T., Lanier, T. C. andHamann, D. D. 1985. ThermaI transitions ofactomyosin and surimi prepared from At-Iantic croaker as studied by differentiaIscanning calorimetry. J. Food Sci. 5O:lO.

Edward filbeBioresource Engineering and Food Science and Technology, Oregon State University
Cheng-Kuang HsuBioresource Engineering, Oregon State University
l)re C. tinier and Grant A MacDonald,Food Sciew Department, North Carolina State University
Michael T. MorrisseyCoastal Oregon Marine Experiment Station
Ricardo SimpsonDepartment of Food Science and Technology, Oregon State University
INTRODUCTIONSeveral studies are currently underway at Cr-egon State University to evaluate whitingproduct alternatives. We describe three ofthem: fillets, fresh surimi, and stabilizedmince. For frozen fillets, questions arise con-cerning shelflife, or storage stability, and howit changes with various conditions that mightbe controlled or optimized. A second altema-tive is fresh surimi: washed, minced fish thatis made directly into analog products withoutfreexing and therefore without a need for thecustomary 8% cryoprotectant ingredients.Whiting surimi is of particular interest be-cause it enables effective application of pro-tease inhibitors and creates a stable seafoodproduct from a fish protein that is inherentlyless stable. Stabilized mince, a third altema-tive, involves a technology that would allowminced trimmings and
ratory. Storage is currently ongoing at fourcarefully controlled temperatures: -8°C(17.6’F); -20°C (-4°F); -34°C (-29.2”F); and-50°C (-58°F). At various time intervals, twopackages (1.5 kg) were taken from each tem-perature, mixed together, and tested. Our engi-neering goal was to describe (mathematicallymodel) the quality change we might expectwith time and temperature, and so be able totrade off quality with the increased costs oflower storage temperature. We measured pro-tein denaturation, assuming it to represent themost significant quality change, associated asit is with toughening and a loss of succulenceand water-holding capacity.
The results through five months of storageappear in figures 1-3, which picture three dif-ferent means for measuring denaturation.(1) The most sensitive indication is the de-
some excess product to befrozen with cryoprotec-tads, and then later
-_Changes of Ca-ATPase activity
thawed to make surimi-based products.
FRozKNFILLETgWhiting were caught in
August and hand filletedat an Astoria plant. A “K-value” of 15% indicated thefillets to be very fresh.Within 15 hours of catch.they were frozen in 750 g(1.7 lb) packages (four to
--8C--2OC-3K-
-34c-B-
-5OC
six random fillets per bag) o! Iat the OSU Seafoods Labo- 0 50 100 150 200hY 2!50 ZcgmI.
29
Changes of SSP in whiting
0,Figure2. 0 50 100 160 200 250bY
Changes of true shear strain in whiting1.8
1.6
0.8
0.60 20 40 60 80 100 120 140 160
Figzbre3. W
crease in ATPase enzyme activity (figure 1). (2)Salt-soluble protein is a traditional measure ofdenaturation (figure 2). (3) Shear strain valuesindicating protein selling ability are deter-mined by the torsion method (figure 3) com-monly employed to measure surimi quality.The higher the torque angle of gelled cylindri-cal samples, the higher is the cohesive strengthand the lesser the degree of protein denatur-ation. Although the numbers in each of thesethree graphs don’t tell us when the product isno longer any good, we can make some generalobservations. Within one to two months at-8”C, significant denaturation and qualitylosses have occurred compared to those atlower temperatures. Within the five-month pe-riod shown, texture quality at -20°C has re-mained reasonably high, although lower tem-peratures appear to give slightly better results.30
The -50°C level holds nosign&ant advantage overthat at -34°C.
A few additional notesor questions might bemade from this and relatedwork. (1) At one point (day1201, torsion tests wererun on four different pack-ages removed from eachtemperature level. A verylarge variation was foundbetween packages 6gure41, explaining in part thescatter and nonsmoothcurves shown, for examplein figure 3.
(2) Results in both fig-ures 1 and 3 showed a sig-nificant decrease in thequality value at day 0.These values were mea-sured before and aflerfreezing, raising a questionabout how important thefreezing rate might be.These differences couldalso result from the pack-age-tipackage scatter,noted above. More work isneeded to clarify this.
(3) In one related testover a three-month period,vacuum-packaged filletswere compared with thosethat were not vacuumpackaged. No differenceswere found either in thedenaturation values or inoxidation rates.
(4) Tests on whiting several years ago indi-cated SSP values that fell rapidly at a -20%storage temperature, in contrast to the rela-tively constant value shown in figure 2. Thisraises a question as to the sign&ance of theuniformity of storage temperature used in ourtests, or of the effects of fresh quality prior tofreezing.
FRESHSURIMIThere can be a considerable marketing ad-
vantage to developing a fresh surimiproductmade from P&c whiting. The major one isthat there would be no need for the use ofcryoprotectants, such as sorbitol and sucrose,which are viewed by most consumers as un-wanted. The production of fresh surimi would

be very feasible for an on-shore processing plant,where the surimi can beshipped to an analog pro-cessor for quick production.
Our studies showed thatfresh surimi can be madewith gel strength compa-rable to that of good-qualitysurimi. Potato starch wasused as a substitute for thenormal cryoprotectants (su-crose and sorbitol) in aneffort to control moisturecontent. In a five-day study,it was evident that theshellfish analog needs to be
True shear strain at day 120
1.8- .I
I
I
.
.
:
.I
0.6 I
made within three days ofmaking the fresh surimi.After day three, the product quality suffered,especially color and odor.
Crab stick analogs were made from bothfresh and frozen surimi at Kyota~ Oregon, inSalem. Although minor problems were encoun-tered in the first run (too much starch in thefresh surimi), the overall results were promis-ing. The personnel at KYO~N responded fa-vorably to the use of Pacific whiting. A produc-tion run of fresh surimi was made in early Sep-tember 1991 with a new formulation and re-duced starch content Results were very satis-factory, with good gel-forming characteristicsand sensory properties. Several samplers saidthat the fresh surimi without the cryopro-t&ants has a more natural seafood flavor.
STABILIZED MINCEWhiting can be held only a short time in
chilled storage before it must be processed, thisis especially true for production of good qualitysurimi. We are currently evaluating a technol-ogy that would enable minced whiting to befrozen, then later thawed and washed to forma fresh surimi that could be used for analogproducts.
Whiting were caught off Newport, chilledimmediately, landed the same day, andtrucked to Astoria. Fillets had a K-value of 88,indicating a high degree of freshness, whenthey were processed and frozen approzimately24 hours a&r catch. Frozen headed and gut-ted (H&G), unstabilized mince RIM), andmince stabilized with 12% sucrose (SM) wereall stored at -20°C (-4“F) and -50°C (-58’F).The cryoprotectant and temperature levelswere selected to “bracket” conditions thatmight verify initial feasibility.
Figure4.
Some of the whiting was initiaIly made intosurimi and stored at -34°C (-29°F) for a com-parative control. At various time intervals, theH&G and mince were thawed, made intosurimi (with the usual 8% cryoprotectants),and refrozen, so we could test it against thesurimi that was already in storage. In allcases, 1% beef plasma protein was used as anenzyme inhibitor.
Figures 5 and 6 show some of the results forsix months of storage. Torsion results givingstrain at failure (figure 5) indicate that surimimade from -20°C UM was of poor quality, butwith stabilizers (SM), it was good compared tothe surimi control. UM at -50°C gave surimiwith a relatively lower strain value (about 1.8).It did not vary much with storage time, indi-cating perhaps that the major reduction wascaused by freezing without cryoprotectants.The following data were not shown in the iig-ures: SM at -50 showed no improvement overSM at -20; and H&G at -20 and -50 showedroughly the same results as UM at the sametemperatures.
Figure 6 gives stress values for the strainconditions of figure 5. These stress (strength)values are somewhat low.
These results show that whiting mince sta-bilized with 12% sucrose and stored at -20°Ccan potentially be used to make good qualitysurimi. Some significant questions remain.What kind of yields can be achieved with pilotscale production? What optimum cryopro-t&ant, level, and storage temperature can befound? What freezer configuration can producea continuous frozen product that will storewell? These questions will be addressed follow-ing the start of the 1992 whiting season.
31
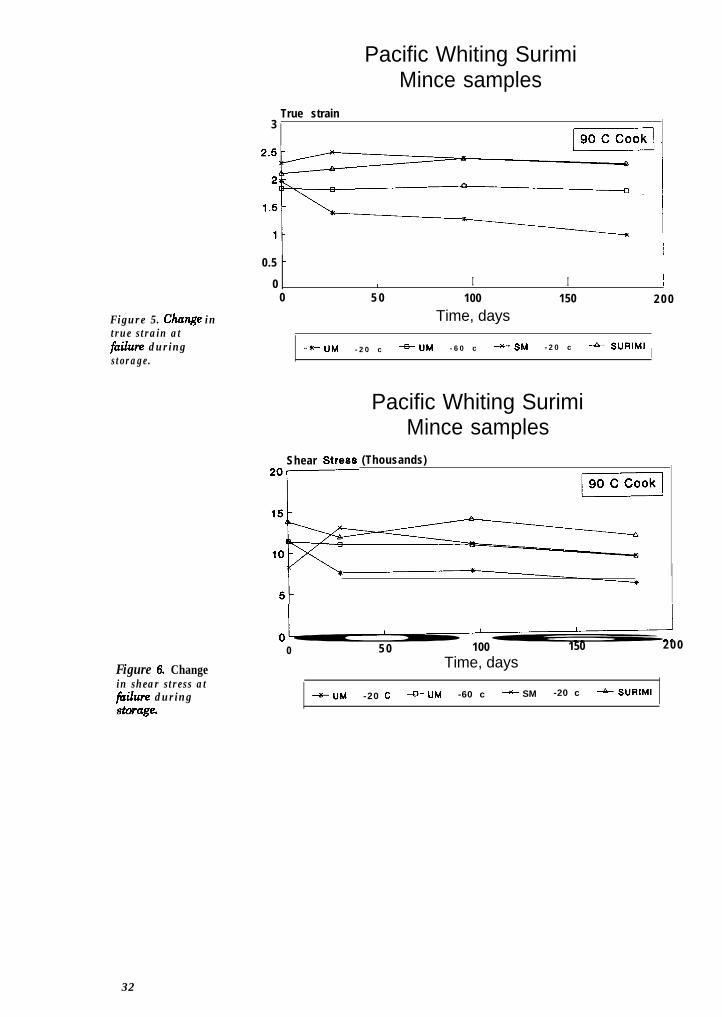
Figure 5. Claange intrue strain atfcrilure duringstorage.
Figure 6. Changein shear stress atf&lure duringStorage
32
Pacific Whiting SurimiMince samples
True strain3
1
0.5 -II 10 I I
0 5 0 100 150 2 0 0Time, days
I-UM - 2 0 c -UM - 6 0 c -K-M - 2 0 c - SURIMI !
Pacific Whiting SurimiMince samples
Shear StraSS*or
(Thousands)
0 5 0 100 150 2 0 0Time, days
-uh4 -20 c -UM -60 c * SM -20 c - SURIMI
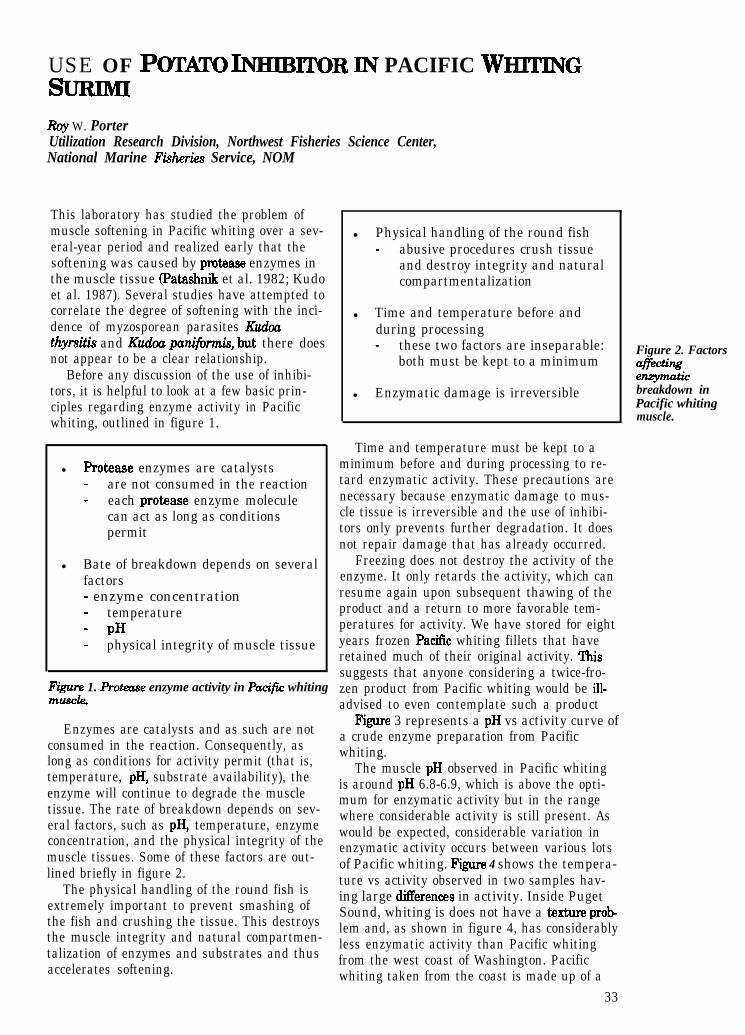
USE OF Po’IXt’O INEIIESTI'OR IN PACIFIC WHWINGSIJRJMI
Rqy W. PorterUtilization Research Division, Northwest Fisheries Science Center,National Marine Fish.eries Service, NOM
This laboratory has studied the problem ofmuscle softening in Pacific whiting over a sev-eral-year period and realized early that thesoftening was caused by protease enzymes inthe muscle tissue (Patashnik et al. 1982; Kudoet al. 1987). Several studies have attempted tocorrelate the degree of softening with the inci-dence of myzosporean parasites Ku&athyrsitk and Ku&a panifirmis, but there doesnot appear to be a clear relationship.
Before any discussion of the use of inhibi-tors, it is helpful to look at a few basic prin-ciples regarding enzyme activity in Pacificwhiting, outlined in figure 1.
l Protease enzymes are catalysts- are not consumed in the reaction- each protease enzyme molecule
can act as long as conditionspermit
l Bate of breakdown depends on severalfactors- enzyme concentration- temperature- PH- physical integrity of muscle tissue
Figure 1. Protease enzyme activity in Pacify whitingTMSCk
Enzymes are catalysts and as such are notconsumed in the reaction. Consequently, aslong as conditions for activity permit (that is,temperature, pH, substrate availability), theenzyme will continue to degrade the muscletissue. The rate of breakdown depends on sev-eral factors, such as pH, temperature, enzymeconcentration, and the physical integrity of themuscle tissues. Some of these factors are out-lined briefly in figure 2.
The physical handling of the round fish isextremely important to prevent smashing ofthe fish and crushing the tissue. This destroysthe muscle integrity and natural compartmen-talization of enzymes and substrates and thusaccelerates softening.
l Physical handling of the round fish- abusive procedures crush tissue
and destroy integrity and naturalcompartmentalization
l Time and temperature before andduring processing- these two factors are inseparable:
both must be kept to a minimum
l Enzymatic damage is irreversible
Time and temperature must be kept to aminimum before and during processing to re-tard enzymatic activity. These precautions arenecessary because enzymatic damage to mus-cle tissue is irreversible and the use of inhibi-tors only prevents further degradation. It doesnot repair damage that has already occurred.
Freezing does not destroy the activity of theenzyme. It only retards the activity, which canresume again upon subsequent thawing of theproduct and a return to more favorable tem-peratures for activity. We have stored for eightyears frozen Pacific whiting fillets that haveretained much of their original activity. Thissuggests that anyone considering a twice-fro-zen product from Pacific whiting would be ill-advised to even contemplate such a product
F’igure 3 represents a pH vs activity curve ofa crude enzyme preparation from Pacificwhiting.
The muscle pH observed in Pacific whitingis around pH 6.8-6.9, which is above the opti-mum for enzymatic activity but in the rangewhere considerable activity is still present. Aswould be expected, considerable variation inenzymatic activity occurs between various lotsof Pacific whiting. Figure 4 shows the tempera-ture vs activity observed in two samples hav-ing large differences in activity. Inside PugetSound, whiting is does not have a texture problem and, as shown in figure 4, has considerablyless enzymatic activity than Pacific whitingfrom the west coast of Washington. Pacificwhiting taken from the coast is made up of a
33
Figure 2. Factorsal%%7enxymuticbreakdown inPacific whitingmuscle.
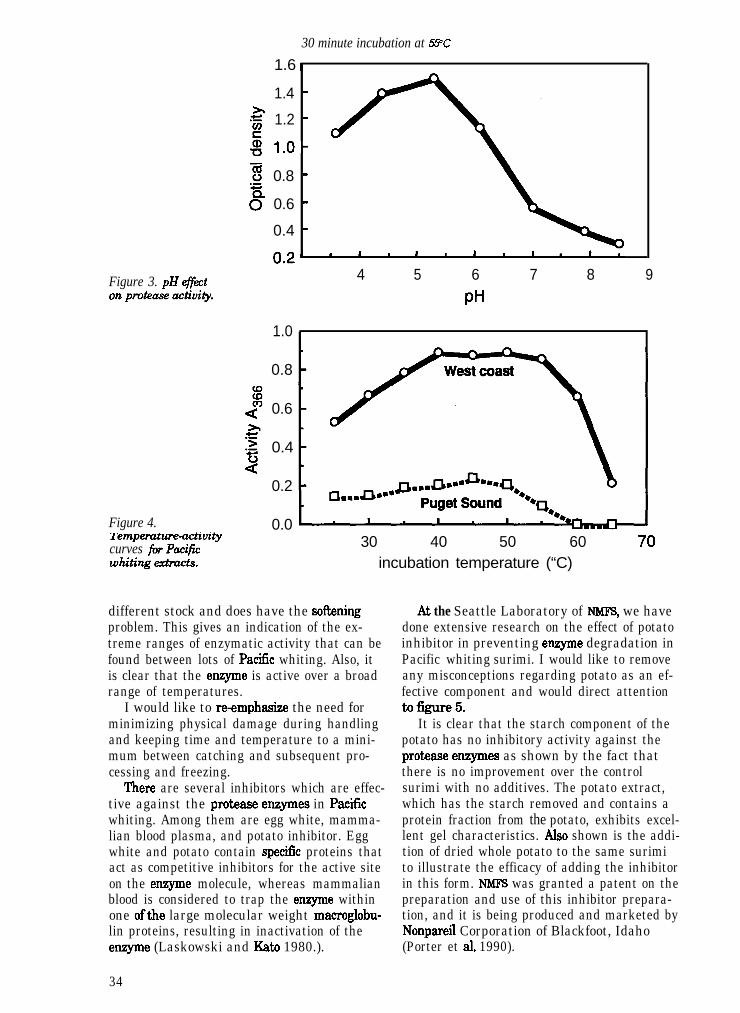
30 minute incubation at 55°C
1.6 I
1.4 -
g 1.2 -
g l.O-
3 0.8 -
g 0.6 -
0.4 -
Figure 3. pH e/&ton protease activily.
Figure 4. . . . .1k?mpemtluwxttvttycurves fir Pacificwhitingexhcts.
1.0
0.8
0.6
0.4
0.2
0.0
4 5 6 7 8 9
PH
30 40 50 60incubation temperature (“C)
different stock and does have the softeningproblem. This gives an indication of the ex-treme ranges of enzymatic activity that can befound between lots of Patic whiting. Also, itis clear that the enzyme is active over a broadrange of temperatures.
I would like to re-emphasixe the need forminimizing physical damage during handlingand keeping time and temperature to a mini-mum between catching and subsequent pro-cessing and freezing.
There are several inhibitors which are effec-tive against the protease enzymes in Paticwhiting. Among them are egg white, mamma-lian blood plasma, and potato inhibitor. Eggwhite and potato contain specific proteins thatact as competitive inhibitors for the active siteon the enzyme molecule, whereas mammalianblood is considered to trap the enzyme withinone ofthe large molecular weight macroglobu-lin proteins, resulting in inactivation of theenzyme (Laskowski and Kate 1980.).
34
At the Seattle Laboratory of NMFs, we havedone extensive research on the effect of potatoinhibitor in preventing enzyme degradation inPacific whiting surimi. I would like to removeany misconceptions regarding potato as an ef-fective component and would direct attentiontof5gure5.
It is clear that the starch component of thepotato has no inhibitory activity against theprotease enzymes as shown by the fact thatthere is no improvement over the controlsurimi with no additives. The potato extract,which has the starch removed and contains aprotein fraction from the potato, exhibits excel-lent gel characteristics. Also shown is the addi-tion of dried whole potato to the same surimito illustrate the efficacy of adding the inhibitorin this form. NMFS was granted a patent on thepreparation and use of this inhibitor prepara-tion, and it is being produced and marketed byNonpareil Corporation of Blackfoot, Idaho(Porter et aL 1990).
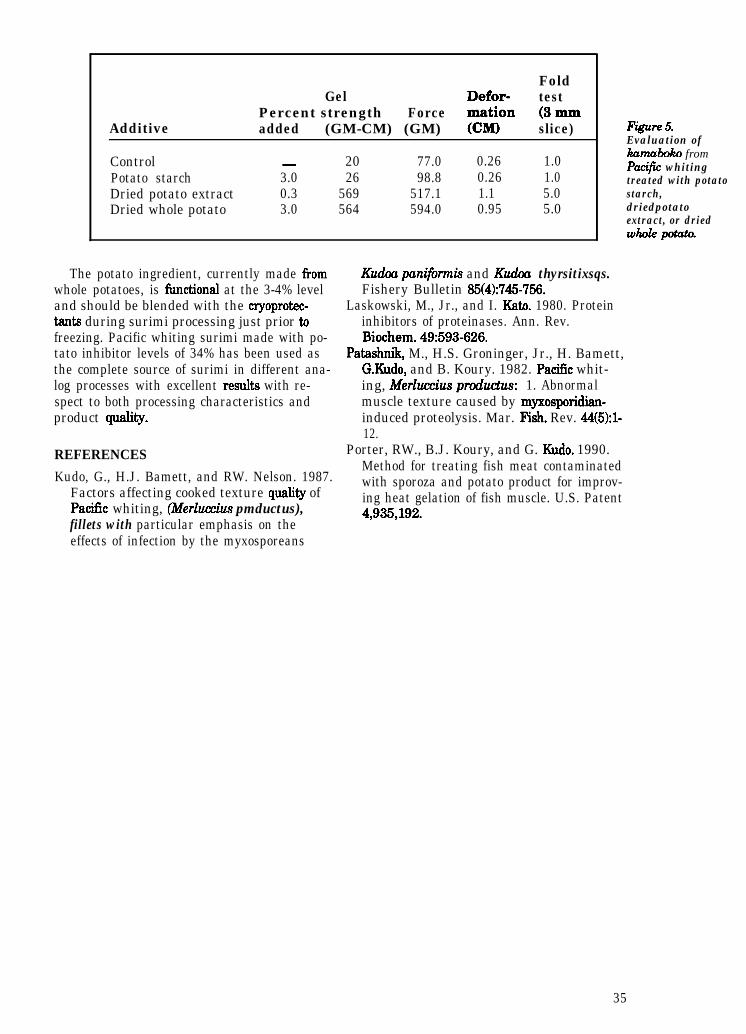
FoldGel Defor- test
Percent strength ForceAdditive added (GM-CM) (GM) r2 (3-slice)
Control - 20 77.0 0.26 1.0Potato starch 3.0 26 98.8 0.26 1.0Dried potato extract 0.3 569 517.1 1.1 5.0Dried whole potato 3.0 564 594.0 0.95 5.0
The potato ingredient, currently made fromwhole potatoes, is fimctional at the 3-4% leveland should be blended with the cryoprotec-tents during surimi processing just prior tofreezing. Pacific whiting surimi made with po-tato inhibitor levels of 34% has been used asthe complete source of surimi in different ana-log processes with excellent results with re-spect to both processing characteristics andproduct quahty.
REFERENCESKudo, G., H.J. Bamett, and RW. Nelson. 1987.
Factors affecting cooked texture quality ofPacific whiting, (Merluccius pmductus),fillets with particular emphasis on theeffects of infection by the myxosporeans
Kudw panifinnk and Kud.oa thyrsitixsqs.Fishery Bulletin 85(4):745-756.
Laskowski, M., Jr., and I. Kate. 1980. Proteininhibitors of proteinases. Ann. Rev.B&hem. 49:593-626.
Pat&n&, M., H.S. Groninger, Jr., H. Bamett,GKudo, and B. Koury. 1982. Pacific whit-ing, Merluccius productus: 1. Abnormalmuscle texture caused by myxosporidian-induced proteolysis. Mar. Fish. Rev. 44(5):1-12.
Porter, RW., B.J. Koury, and G. &do. 1990.Method for treating fish meat contaminatedwith sporoza and potato product for improv-ing heat gelation of fish muscle. U.S. Patent4,935,192.
F%gwt? 5.Evaluation ofkamaboko fromPacify whitingtreated with potatostarch,driedpotatoextract, or driedwhole potata
35
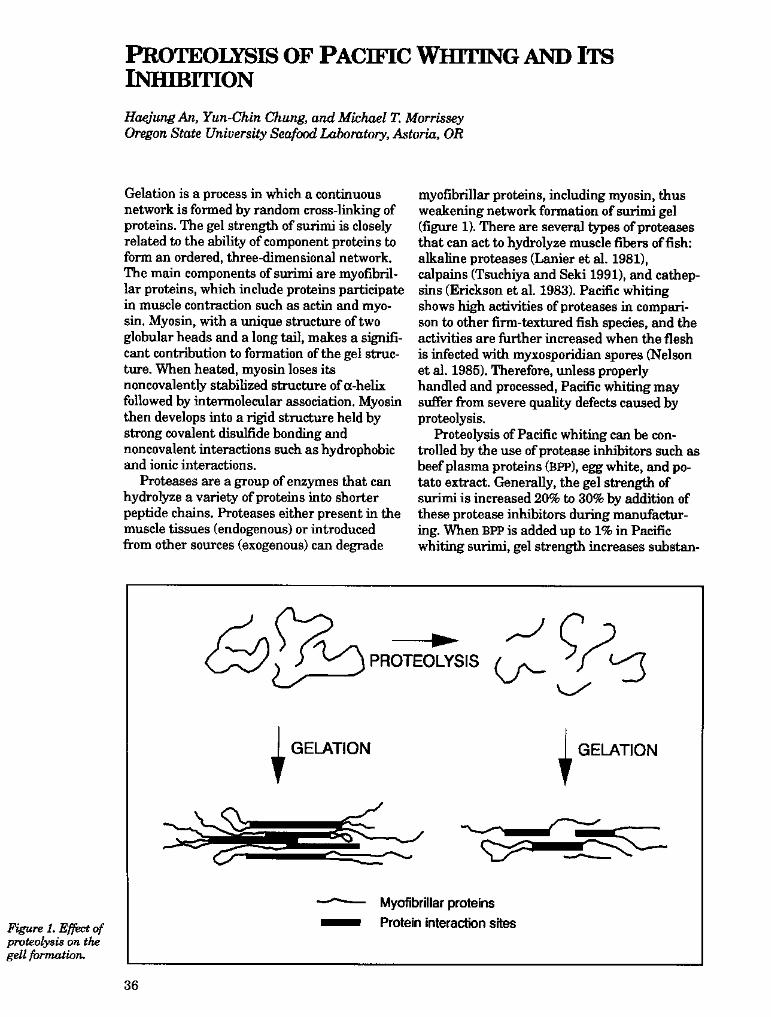
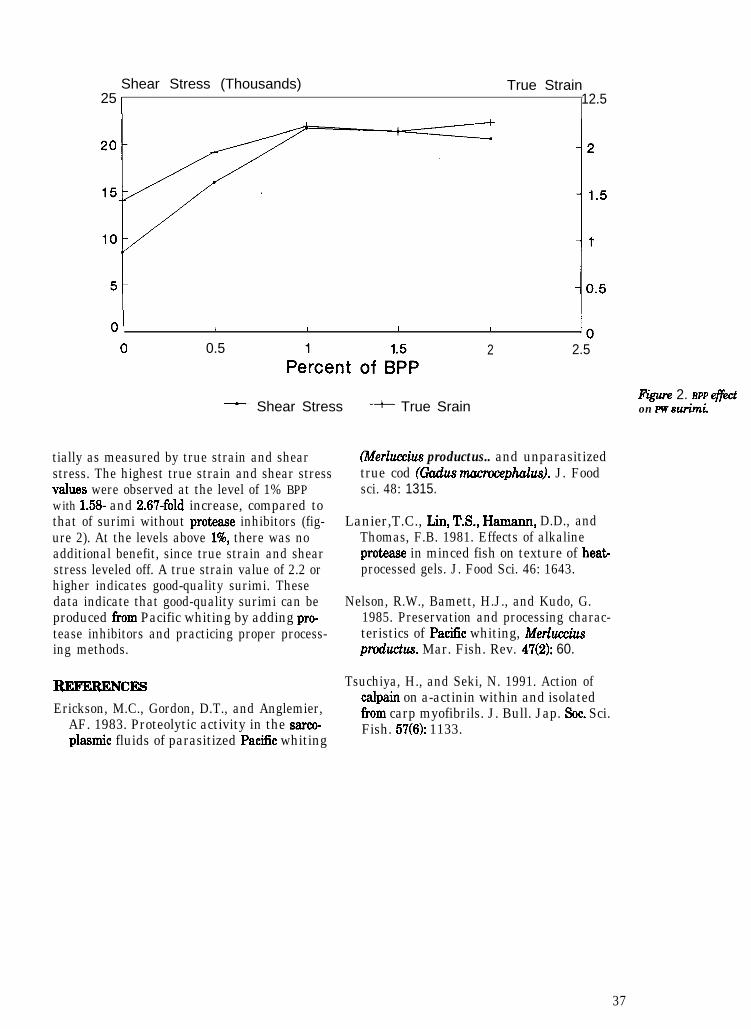
Shear Stress (Thousands) True Strain25 1 12.5
01 I I 1 I
0 0.5 2 2.5
-- Shear Stress -I- True SrainFigum 2. BPP effecton pw szuimi.
tially as measured by true strain and shearstress. The highest true strain and shear stressvalues were observed at the level of 1% BPPwith 1.5% and 2.67-fold increase, compared tothat of surimi without protease inhibitors (fig-ure 2). At the levels above l%, there was noadditional benefit, since true strain and shearstress leveled off. A true strain value of 2.2 orhigher indicates good-quality surimi. Thesedata indicate that good-quality surimi can beproduced from Pacific whiting by adding pro-tease inhibitors and practicing proper process-ing methods.
REFERENCESErickson, M.C., Gordon, D.T., and Anglemier,
AF. 1983. Proteolytic activity in the sarco-plasmic fluids of parasitized Paciiic whiting
(Merlzurius productus.. and unparasitizedtrue cod (Gadus macrocephalus). J. Foodsci. 48: 1315.
Lanier,T.C., Lin,T.S., Hamann, D.D., andThomas, F.B. 1981. Effects of alkalineprotease in minced fish on texture of heat-processed gels. J. Food Sci. 46: 1643.
Nelson, R.W., Bamett, H.J., and Kudo, G.1985. Preservation and processing charac-teristics of Pa&c whiting, Merhxiusproductus. Mar. Fish. Rev. 47(2): 60.
Tsuchiya, H., and Seki, N. 1991. Action ofcalpain on a-actinin within and isolatedfrom carp myofibrils. J. Bull. Jap. Sot. Sci.Fish. 57(6): 1133.
37

PANELDISCUSSIONOFSEAF~~D TECHNOLOGY
Session leader: David CrawfinE. Panel members: Roy Porter, Ha&g An, Larry Meyer (Ameri-can Meat Prvtein Company) Jae Park, Edward Kblbe, and Z)ve Lmier.
All questions were held until the panel Iaudience discussion period.
B: Michael Morrissey, from the audience)Could Larry Meyer, from the American MeatProtein Company, clarify the the FDA’s currentposition on the UGRASm (generally recognized assafe) status of the beef plasma product thathas been found an effective protease inhibitorin OSU Seafood Laboratory’s experiments andhas been used by the Japanese for at least fiveyears?
AZ (Larry Meyer) A competitor of ours in-formed the FDA of the American Meat ProteinCompany’s use of beef plasma, asking whetherthis use was permitted. The FDA respondedthat the product was not defined as either afood or a food additive, nor had it ever beenaccorded GRAS status by the agency. Since thattime, the American Meat Protein Companyhas sought reconsideration of the matter andthe FDA has agreed to rescind its previousdetermination, accepting the use of the plasmafor this purpose. The FDA will be informingregional offices soon that its prior letter on thesubject should be disregarded.’
Q What are the current labelling require-ments for the plasma product?
A: (Meyer) !l%e labelling requirements dependon whether the product is intended for domes-tic consumption or international sale. Thisproduct has been used in a hydrolyzed form inmeat products and labelled as “flavoring.” InMarch 1991 the USDA changed its regulationscovering flavorings. Now it appears that if theproduct is to be used in surimi seafoods fordomestic consumption, it must be labelled“blood plasma protein” unless a hydrolized
‘On April 23,1991, the FDA issued a letter stating that it“[does] not wish to contest . . . at this time” the claim thatbeef plasma protein is a safe ingredient. This statementessentially gives the green light for use of beef plasmaprotein (it must be labelled) as an ingredient in domesticsurimi. It should be noted that the FDA is leaving thedoor open for decision making in the future.
38
formulation of the product is used, in whichcase it may be labelled “flavoring.” For interna-tional trade purposes, it may be labelled“flavoring.”
Q Is there any advantage, in terms of shelflife, to the use of beef plasma vs. potato concen-trate?
A: Morrissey reported that the Astoria SeafoodLaboratory plans to study this issue. So far,over the six-month period the lab has heldsurimi containing the beef plasma, it hasproven effective. Roy Porter further stat.44 thatboth products have proven effective in NMFSlaboratory tests for 10,12, and even 18months. An audience member asked if gelstrength would decrease over time, and TyreLanier answered that there was no reason tobelieve so.
Q Could the panel clarify the meaning of theterm GRAS (generally recognized as safe)?
A: (Meyer) Most substances are consideredGRAS until questions are brought up about theiruse. Such substances can be used while theapproval process for their use is going on. Heclaimed that it is currently legal to use beefplasma as long as the labelling requirementsfor domestic and international use are met.
Q: (Jae Park;from the audience) Is the driedpotato extract used in inhibiting proteasecommercially available?
AZ An audience member responded that hiscompany had the patent to use this product,and it is currently available at $.95&r. FOE3Idaho. The product is still being developed.


Quality Assurance

QUALITYASS~RANCEPROGANISWHITING
FORPACIFIC
Gilbert SylviaCoastal Oregon Marine Experiment Station
Lisa GainesDepcirtment of Agriculture and Resource Economics, Oregon State University
INTRODUCTIONImproving and controlling product quality ispossibly the greatest single challenge confront-ing the Paciiic whiting (Merlucciusproductus)industry. The offshore stock of Pacific whitingis characterized by a complex set of productquality problems, including a relatively soft.and delicate flesh, a high fat content, an off-white color, and varying levels of myxosporideaparasites and protease enzymes that degredateprotein. These problems can result in a mar-keted product which is bruised, mushy, andrancid-and a product that can literally meltaway during the cooking process.
Making decisions to control these problemsis complicated by many factors. First, there iswide variation in the “intrinsicnl product char-acteristics of Pacific whiting, including varia-tion in the level of protease enzymes andmyxosporidea parasites. Although the dynam-ics of these characteristics are not well under-stood, they appear related to variation in bio-logical, geographical, and environmental condi-tions? Second, the strategies used to addressthese problems will depend on the choice ofproduct forms and market strategies. For prod-ucts that undergo minimal processing and thatare targeted for relatively “low-value” markets(for example, the retail domestic frozen headedand gutted [H&G] market) there may be lessconcern about product quality beyond reachingsome minimum level of wholesomeness andproduct workmanship. For moderately pro-cessed products such as individual fillets andfillet blocks, there is greater concern aboutproduct quality, not only because market pricefor fillets is more dependent on the level of
1Znkinsic refers t.~ the preharvest characteristics of theproduct. See Love (1988) for a detailed examination ofintrinsic variation in seafood.
Tar a review of problems affecting the Pa&c whitingfishery, including variation in product characteristics,see the special issue of Marine Fisheries Review1985:47(2), devoted entirely to issues in the Pacificwhiting fishery.
product characteristics, but because there is asignificantly greater degree of product han-dling, which increases quality control problems(for example, more exposure of surface areasand disruption of cellular walls). For morehighly homogenized processed products, suchas frozen minced blocks and surimi, quahty isalso important, but to some extent can be con-trolled by the addition of various additives tothe minced product that can inhibit the pro-tease enzymes or reduce rancidity and increaseshelf life.
Research by seafood technologists has dem-onstrated that the most important way to re-duce the product quality problems of Pacificwhiting products is to control time, tempera-ture, and pressure parameters during allstages in the production, distribution, and foodpreparation processes (Nelson et al. 1985). In-dividual tlrms or industry sectors which fail toadequately control these quality parameterscan not only reduce their own benefits (in theform of lower prices, fewer sales, and poorerproduct reputation), but also the benefits ofother whiting industry firms. Therefore, theactivities of all industry sectors, from fisher-men to consumers, need to be examined for therole they play in assuring some minimal levelof predictable and acceptable product quality.The key issue for individual firms is decidingon the appropriate mechanisms to coordinatethe activities of producers, processors, distribu-tors, and government agencies in order to con-trol product quality and maximixe industrybenefits and market opportunities.
The following paper concerns the marketingmanagement concept known as “quality assur-ance” and its potential application for control-ling the quality of Pacific whiting. In the firstsection of the paper, we discuss the concept ofquality assurance and its use in productionand marketing management. In the next sec-tion, we review issues that would be importantin developing quality assurance programs forPacific whiting. In the third and final section,we discuss specific strategies that individual
41

sectors of the industry could adopt as part of acomprehensive quality assurance program.
Qum ASSURANCE, No?’ QumcoNrRoL
The U.S. seafood industry continues to beplagued by recurring concerns related to sea-food safety and the need for development ofmandatory seafood inspection programs. Cur-rently, the Food and Drug Administration(FDA) has taken the lead in developing andtesting a prototype quality control program us-ing the concept known as Hazard AnalysisCritical Control Points (HACCP).3 This programis designed to ensure an adequate level of sea-food safety by setting safety standards andrandomly inspecting “critical points” along theproduction and distribution chain wherehealth-related problems have the highest prob-ability of occurring. A major focus of the pro-gram is controlling microbiological contamina-tion of seafood.
Most quality issues for Pacific whiting, how-ever, are not related to seafood safety, butrather are related to sensory characteristicssuch as taste, texture, and appearance, that is,factors which affect consumer enjoyment andmarket demand. Intrinsic product qualitycharacteristics such as proximal composition(for example, moisture, lipids, and protein),protease levels, and myxosporidea parasitescan directly and indirectly affect sensory char-acteristics, shelf life, and the ability of theproduct to withstand the rigors of seafoodprocessing.
While a ILUCP type of program could be ex-panded to control product quality beyond mi-crobiological contamination, there are manytypes of programs that could be applied toward“managing’ Pacific whiting quality. Althoughmost of these programs have been developedby scientists and engineers in Europe andNorth America, they have been most compre-hensively implemented by the Japanese forimproving product quality of a wide range ofconsumer and industry products. These pro-grams are represented by an array of acro-nyms, including SQC (Statistical Quality Con-trol), TQM Scrotal Quality Management), QFD
Y&e Lee and Hilderbrand (1992) for a discussion ofHACCP programs and application to Pacific Northwestfisheries.
(Quality Function Deployment), CIP (Contiu-ous Improvement Process), and CB (Competi-tive Benchmarking).’ Regardless of their crite-ria or disciplinary focus (for example, engineer-ing versus market versus management orien-tation), all of these techniques are based onstatistically verifiable standards designed toreduce and control variation in final productquality.
Applying quality control concepts forseafoods in general, and Pacific whiting in par-ticular, may be a more dif&ult problem thanapplying them to other food products. This isbecause, with the exception of aquaculturalproducts, seafoods are “manufactured” fromwild organisms that display a wide range ofboth “good” and “bad” intrinsic product charac-teristics. In addition, seafood tissue andmuscle fibers are relatively more delicate thanthose in “terrestrial” animal products; “good”quality characteristics that enhance sensoryenjoyment can be easily lost during the produc-tion, processing, and distribution process. Theeffects of ‘bad” product characteristics (such asprotease enzymes), however, must be mini-mixed or eliminated entirely. Control overquality characteristics, therefore, cannot beisolated at any one location or at any one time;rather it must be exercised at all “critical”points from ocean to plate. Comprehensivequality control programs designed to ensurequality seafood products at the point of con-sumption are known as “quality assurance sea-food programs” (Gorga and Ronsivalli 1988).
The main objectives of quality assuranceprograms are sometimes perceived as intendedto meet minimum government standards forhygiene and health. In other cases they may beperceived as designed to provide products thatimprove consumer satisfaction and confidence.Truly effective quality assurance programs,however, are designed with another goal-thatof improving long-term benefits to the seafoodindustry in the form of higher profits, rev-enues, or greater shares in animal protein andseafood markets. ERective programs are notdesigned in isolation by food technologists butas part of an integrated system that includesproduction managers and marketing specialists.
Designing the most effective quality assur-ance program requires a careful analysis of the
‘A description of these programs is beyond the scope ofthis work; however, see the October 15,199l issue ofBllsiness Week magazine for a concise review of qualitycontrol methods, especially the overview article by Portand Carey.
42

potential long-run costs and benefits of alter-native programs. It requires vertically relatedindustry sectors to estimate how such pro-grams would affect production and processingcosts and the demand for quality-assured prod-ucts. It requires marketing specialists to deter-mine how quality assurance programs could beeffectively used in advertising aimed at im-proving consumer demand and consumer con&dence. It requires an accurate estimation of thecost effectiveness of alternative warranty pro-grams that would guarantee product quality.
Quality assurance also involves risk man-agement. The variation in product qualitycharacteristics must be unambiguously articu-lated, since unknown risks can lead to distrustand skepticism, especially to downstream us-ers (for example, institutions, retailers, andfinal consumers). Therefore, a quality assur-ance program must use appropriate analyticaltools, be statistically sound, and be able toclearly communicate its findings &Iartin1988). Strategic communication about riskswhich are equal to, or smaller than, risks asso-ciated with competitive products can help im-prove sales and expand market opportunities.
Developing a quality assurance programthat is in the best interests of the industry,however, does not necessarily imply one grandindustry or government scheme. Rather, it re-quires that each firm in the production anddistribution process understand the long-runrelationship between product quality and mar-ket price and then use this information to de-velop contractual arrangements, warranties,and price incentives consistent with controllingproduct quality and improving industrybenefits.
FACTORS AFFECTING QUALITYASSURANCE PROGRAMS FGR PACIFICWHITING
Three important considerations that can af-fect the design and effectiveness of a qualityassurance program are the name, label, andlogo selected to represent the product.Merluccius productus is harvested from onlyone geographic region in the world (that is, thePacific Northwest). For most product forms,Merluccius productus is marketed under itslegal common name, Pacific whiting. Before1980 the product was marketed under its com-mon name, Pa.@& hake, but the name was le-gally changed in order to overcome theproduct’s poor reputation in domestic mar-
kets.” Note, however, that this name changewas not accompanied by improvements inproduct quality, and the market reputationwhich had characterized Pacific hake nowcharacterizes Pacific whiting.
The other term in the name for Pacific whiting, that is, Pacific, refers to the geographicallocation. Labelling by geographical location ornational origin is a feature of most of the hakelwhitings that compete with Pacific whiting formarket share, for example, Argentine hake(Merluccius hubbsi), Chilean hake (Merlucciusgayi), and Peruvian hake (Merl u&us gayiperanus). However, it should be noted that notall of the products processed from Pacific whiting are sold using the common name. For ex-ample, H8zG Pacific whiting is sold retail un-der many brand names, usually with one ortwo brands representing each west coast H&Gprocessor! Most products, however, especiallyat the wholesale level, will be associated withthe common name, Pacific whiting. Using geo-graphical identification as part of the name orlabel may be advantageous, especially if theregional name connotes some positive charac-teristic; however, regional identification alsohas disadvantages. Firms that do not adhere toquality standards not only reduce their ownproduct quality and market opportunities, butalso the opportunities of other regional firmstargeting or processing the species. For Pacificwhiting the name is especially problematicsince the identity is already associated withpoor product quality.
Individual firms planning to improve andcontrol Pacific whiting quality must considerthe potential costs and benefits of firm leveland industry-wide strategies. For example,could individual firms which fail to improveproduct quality limit the potential rewards tofirms which make major efforts to control prod-uct quality? Should new labels and logos bedeveloped for firms which voluntarily agree tomeet certain quality standards? Can a givenstate or region successfully market Pacificwhiting products using its own regional identi-fication? All of these questions need to be ad-dressed before individual firms can decide on
WI hakes (iUerZuccius spp.) are known as whiting in theUnited States but retain the common name I&e in allother national and international markets.
The potential advantages of multiple brands may beoffset by certain disadvantages. See Sylvia and Peters(1991) for a complete discussion.
43

the type of product quality assurance programsto develop.
Another important issue for developingquality assurance standards for Pacific whitingis related to market destination. Many of theintermediate and final products processed fromPacific whiting (including fillet blocks, mincedblocks, individual fillets, breaded fillets,surimi, surimi-based seafoods, and meal) willbe sold and distributed in global markets. Asan example, a portion of the Pacific whitingwhich had been delivered to Polish motherships during the jointventure era of the fish-ery were processed into frozen blocks, shippedto plants in northern Germany for secondaryprocessing into value-added products (for ex-ample, breaded portions), and then sold retailin northern and southern Europe.
The increase in trade of hake/whiting prod-ucts also coincides with the establishment ofeconomic trade zones. Examples include theconsolidation of the European Economic Com-munity (the world’s largest market for hake/whiting products), the North America FreeTrade Agreement, and the proposed consolida-tion of Argentina, Brazil, Paraguay, and Uru-guay into a single economic community. Asthese agreements become finalized, economiccommunities will put into effect internationalproduct quality standardotandards devel-oped to protect the welfare of regional consum-ers and reduce the cost of business transac-tions (and in some cases protect regional in-dustries from outside competition). Quality as-surance programs will need to be designed in amanner consistent with these evolving intema-tional standards. This does not imply, how-ever, that all quality characteristics for allproduct forms must be uniform. Bather, it sug-gests that quality assurance programs will im-prove market and trade opportunities if theyare compatible with these standards.
STRATEGIES FOR PACIFIC WHITINGQU~ASS~RANCE~?ROGRAMS
Given the product quality and market is-sues summarized above, the following strate-gies could be developed as part of a comprehen-sive quality assurance program for Pacificwhiting.
(1) The National Marine Fisheries Serviceshould evaluate how its regulatory strategiesaffect the variation in product quality charac-teristics of Pacitic whiting. Research by seafoodtechnologists and fisheries biologists has dem-onstrated that characteristics such as product
size and rates of parasitic infestation may varyseasonally, annually, and by geographic loca-tion (Dom 1990, Zabata and Whitaker 1985).Regulating where, when, and how the fish arecaptured can influence the spatial and tempo-ral distribution of these quality characteristics.Even more important, the strategies used tocontrol the fishery, and the industry risks asso-ciated with policy uncertainties, can constrainthe level of investment necessary to profitablycontrol product quality and improve marketingopportunities. These management strategiesshould be carefully evaluated to determinehow they affect national, regional, and indus-try benefits.
(2) Fishermen should be encouraged to cap-ture and handle Pacific whiting using methodswhich optimally control product quality prob-lems. For example, fishermen may need to ad-just the design of trawl nets and cod ends andreduce the duration of tows in order to mini-mize problems related to the relatively softflesh of Pacific whiting and the presence of pro-tease enzymes. Fishermen may also need todesign on-board handling and cooling systemsthat ensure product quality and which meetnational and international standards for hy-giene and sanitation.
(3) Hake processors must develop controlmeasures to ensure that the product that en-ters and exits their plant has a relatively highlevel of quality. This means developing con-tractual arrangements that reward fishermenwho land quality product. It also means devel-oping methods to off-load, process, inspect,package, and inventory products in a mannerthat ensures relatively high quality. Methodsmust be developed to minimize bruising of thesot% flesh of Pacific whiting, detect parasites,and maintain near freezing temperatures untilthe product is frozen. Freezing units must beefficient and capable of lowering product tem-peratures at optimal rates. Processors mustdevelop statistically verifiable performancestandards consistent with assuring productquality while cost effectively minim%ng varia-tion in quality characteristics.
WAsa minimum but necessary require-ment, processors must develop productionpractices that conform to national and intema-tional standards ensuring product safety andwholesomeness. In the United States thesestandards will need to be consistent with theregulations being developed by the FDA. In Eu-rope they will need to conform to the FAO'SCODEX standards and the standards being de-veloped by the Council of European Communi-
44
ties (1991). However, these guidelines andregulations provide only minimum standardsdesigned to ensure that seafood products aresafe and wholesome when they enter domesticor international markets. They do not ensurethat the product will have maintained someminimum level of quality by the time itreaches the consumer. Providing this level ofquality is a responsibility shared by the entireindustry, from fisherman to retailer. It re-quires the development of product qualitystandards at every point of distribution and aconcern by every firm and public agency thatthe product have a high level of quality when it
’ is consumed.’(5) Primary and secondary processors, dis-
tributors, and wholesalers must not only de-velop their own quality assurance programs,but must provide information to instruct insti-tutional, food service, or retail sector buyers inproperly storing, displaying, or preparing Pa-cific whiting in a manner which ensures qual-ity products for consumers. In most cases thismeans minimizing product quality problemsrelated to rancidity or softening of the flesh.Ensuring adequate shelf life to final users andconsumers is especially important, given theshelf life problems of Pacific whiting comparedto other ground&h products! In addition, re-tailers must provide adequate information toconsumers on proper storage and food prepara-tion and cooking techniques. All industrygroups should work cooperatively to provideobjective information regarding quality issuesof Pacific whiting. Information about qualityassurance programs and product warrantiesshould be used to bolster the confidence of finalusers and to improve market opportunities.
C ONCLUSION
Given the intrinsic characteristics of Pacificwhiting and their potential for affecting prod-uct quality during all phases of production, dis-tribution, and food preparation, quality assur-ance programs could be of significant value forcontrolling product quality and improving mar-
ket opportunities. However, while there maybe significant benefits to developing qualityassurance programs, there may also be signiii-cant costs. Individual firms must develop spe-cific strategies and determine the level of re-sponsibility that will be addressed at the firmlevel and the industry level. For example, willit be in the industry’s interests to develop gen-eral guidelines or enforceable but voluntarystandards? How should the industry handleproduct quality issues given the diversity ofproduct forms which are processed from Pacificwhiting? Do new labels and logos need to bedeveloped? What kind of fisheries regulatorystructure is most compatible with assuringproduct quality?
Addressing these issues is a difEcult butnecessary task. Programs developed for con-trolling product quality of Pacific whiting, how-ever, could provide new insights and opportu-nities for other fisheries. The industry shouldlook at assuring the quality of Pacific whitingas not only a worthy challenge, but, if their ef-forts are successful, a model for developing pro-grams for other Pacific Northwest seafoods.
REFERENCESBeaudoin, R.M. 1992. Personal communica-
tion. Director of Marketing, Maine Department of Marine Resources, Augusta.
Council of the European Communities. 1991.Council directive of 22 July 1991(91/493/EEC) laying down the health conditions forthe production and the placing on themarket of fishery products. G&&l Journalof the European Communities 34:15-84.
Dom, M.D. 1990. Spatial and temporal vari-ability of the catch of Pacific hake in theUnited States management zone. NationalMarine Fisheries Service, Seattle, Washing-ton.
Gorga, C., and L.J. Ronsivalli. 1988. Qualityassurance of seafood. New York: VanNostrand Reinhold.
‘Note that Iceland is now proposing to sponsor courses inTotal Quality Management (TQM) for integrating thenorthern European &&kg industry into a “modemtechnological society” and to meet and exceed evolvingEEC seafood standards (UETP-INTERCOM 1992).
*As one example, the state of Maine has instituted itsown seafood quality assurance program for groundlbhwhich incorporates expiration dates for all freshgmund!kh products (Robert Beaudoin, personal
I &nmunica~ion).
Lee, J.S., and KS. Hilderbrand. 1992. Hazardanalysis and critical control point applica-tions to the seafood industry. Oregon SeaGrant Publication ORESU-H-92-001,Corvallis, OR.
Martin, R 1988. Contaminants in relation tothe quality of seafoods, Food Technology,December:104-108.
45

Love, M. 1988. The food fishes: their intrinsicvariation and practical implications. Ion-don: Farrand Press.
Nelson, R.W., H.J. Bamett, and G. Kudo. 1985.Preservation and processing characteristicsof Pacific whiting, Merluccius productus.Marine Fisheries Review 47(2):61-74.
Port, O., and J. Carey. 1991. Questing for thebest. Business Week, October 25:8-16.
Sylvia, G., and G. Peters. 1991. Market oppor-tunities for Pacific whiting. Oregon Coastal
Zone Management Association, Newport,Oregon.
UE’IP-INTERCOM. 1992. A draft proposaI fortraining courses in qua& management forcontrollers and managers in the fishingindustry. A draft proposal from the Icelan-dic regional UETP, INTERCOM, Reykjavik.
Zabata, Z., and D.J. Whitaker. 1985. Parasitesas a limiting factor in exploitation of Pacificwhiting, Merluccius productus. MarineFisheries Review 47(2):55-59.
46

HLizARDAN..YSIsAND CRITICAL CONTROL
POlNTSFORhtGENTlNE HAKE (illimLuccnrsHUBBSI) PROCESSING PLANTSEnrique BertulloInstitute of Fisheries Research, University of Uruguay
QUALITY ASSURANCE FOR SEAFOODSFor a number of reasons, it has not been easyto supply seafood products that are of adequatesafety and consistent quality. (1) Too often, werely only on end-product sampling and inspec-tion. (2) Regulations are sometimes confusingor contradictory. (3) We often fail to link exist-ing basic knowledge with sound operationalmeasures at the production level. In addition,producers face the economic and managerialdilemma of trying to offer quality products inan increasingly competitive market at moder-ate cost. During the last few years, however,interest in seafood quality assurance has ex-panded into many new areas-the industryitself, government agencies, and consumers. Asa result of this growing interest, it is time toredefine our directions and modify proceduresin the industry.
The fish industry in many countries (for ex-ample, the European Community [EC], Japan,Mexico, and Uruguay) has initiated a newpolicy aimed at producing quality fish productsby following quality assurance concepts. Thisinnovation will at&& the export of fish in de-veloping countries and will regulate the fishimports of developed countries. Certainly, thewholesale and retail seafood market of everycountry will benefit
Quality assurance is not another inspectionsystem; rather, it is a way of producing qualityproducts, and it allows the industry to offerbetter and safer products while simultaneouslyimproving the economy. Quality assurance is apreventive function that involves planning, or-gan&zing, and controlling operations to ensurethat seafood products consistently meet re-quirements. It is an integral part of every man-agement function. The implementation of qual-ity assurance requires that producers establishsystematic procedures for all activities neces-sary to guarantee the quality of raw fish andshellfish, in-process material, ingredients, ad-ditives, and finished seafood products. It alsorequires that harvesting, on-board handling,processing, grading, packaging, labelling, stor-
age, transport, and marketing comply withgovernmental regulatory requirements andindustry and customer specifications. For theU.S. National Marine Fisheries Service @Ml%19901, quality control is the establishment andmaintenance of an optimum process and prod-uct through systematic and coordinated efforts,and quality assurance is the sum of all thoseactivities in which one engages to ensure thatthe information and data generated are correctand reliable.
HAzARDANALYSIsANDcRITIcALCONTROL POINTS
Hazard analysis and critical control points(HACCP) is a specific, nontraditional,inspectional approach to controlling biological,chemical, microbiological, physical, and eco-nomic hazards in seafood (NMFS 1990). In 1977,J. Lee was the first to publish an account ofhow the technique could be employed for fish-ery products to decrease risk to consumers(Lee and Hilderbrand 1992).
Lee formulated an operational flow chartthat listed each step of processing for a specificseafood commodity. To do this, he had to definethe degree of hazard associated with a specificseafood product and with the intended use ofthe product Designing an operational flowchart comprising each step of a seafood manu-facturing process involves defining the hazardsassociated with each step and assessing theirrelative importance. It is necessary to identifythe critical control point of the process and de-termine which preventive measures can beused to reduce tbe hazard to acceptable levels.It is also essential to monitor the procedures,either by observation or measurement, to de-termine when a hazard is under control. Care-ful records of the monitoring must be kept.
HACCP FOR HARE AND MARI(ETINGOPPGRTUNITYRS
Hake is processed in different locations. In-dustries involved in exporting frozen hake to
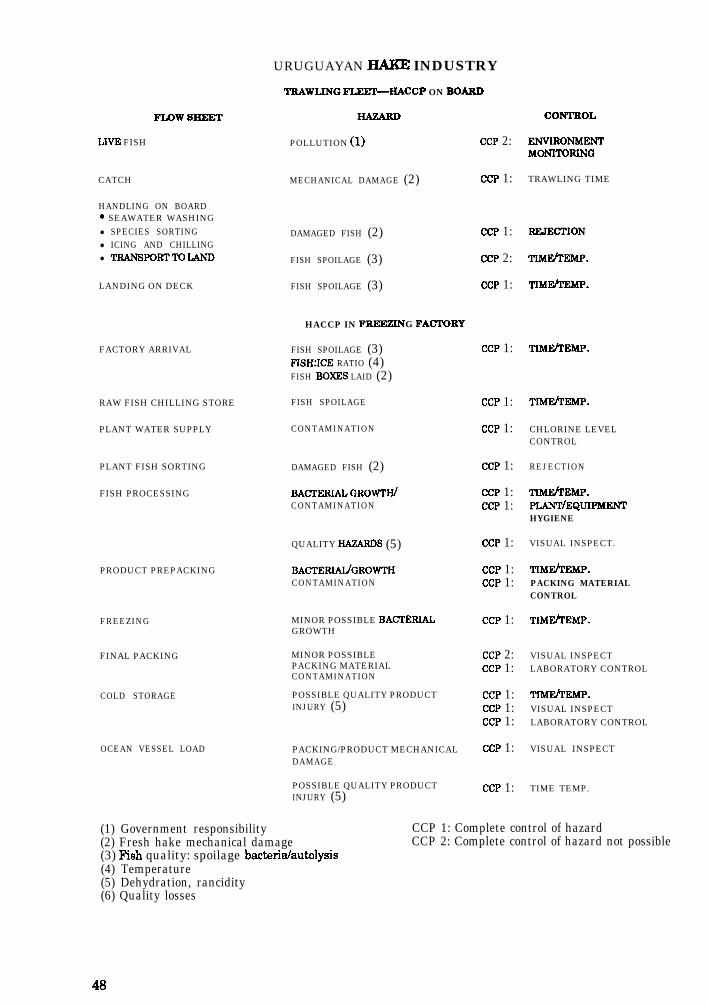
URUGUAYAN HAKJZ INDUSTRY
TRAWIJNG FLEET-HACCP ON BOARD
CONTBOL
CCP 2: ENvIRoNMENTMONI’ICRING
CCP 1: TRAWLING TIME
FLOW SHEET
LIVE FISH
CATCH
HANDLING ON BOARD’ SEAWATER WASHINGl SPECIES SORTINGl ICING AND CHILLINGl TRANSPORTTC LAND
LANDING ON DECK
POLLUTION (1)
MECHANICAL DAMAGE (2)
DAMAGED FISH (2)
FISH SPOILAGE (3)
FISH SPOILAGE (3)
CCP 1: RRJECl’ION
CCP 2: TrMJ%rwMP.
CCP 1: TIMEhEMP.
FACTORY ARRIVAL
HACCP IN FBEEZING FACIQRY
FISH SPOILAGE (3)FISH:ICE RATIO (4)FISH BOXES LAID (2)
RAW FISH CHILLING STORE FISH SPOILAGE
PLANT WATER SUPPLY CONTAMINATION
CCP 1: TIMEhEMP.
CCP 1: TIMEhEMP.
PLANT FISH SORTING
FISH PROCESSING
CCP 1: CHLORINE LEVELCONTROL
DAMAGED FISH (2)
BACTERIALGROWTH/CONTAMINATION
CCP 1: REJECTION
CCP 1:CCP 1:
TIMEhEMP.PLANT/EQUIPMENTHYGIENE
QUALITY HAEARDS (5)
BACTERIdGROWTHCONTAMINATION
CCP 1: VISUAL INSPECT.
CCP 1:CCP 1:
TIMEhEMP.PACKING MATERIALCONTROL
PRODUCT PREPACKING
MINOR POSSIBLE BACI’FRIALGROWTH
MINOR POSSIBLEPACKING MATERIALCONTAMINATION
POSSIBLE QUALITY PRODUCTINJURY (5)
CCP 1: TIMEhEMP.FREEZING
FINAL PACKING
COLD STORAGE
CCP 2: VISUAL INSPECTCCP 1: LABORATORY CONTROL
CCP 1: TIMEhEMP.CCP 1: VISUAL INSPECTCCP 1: LABORATORY CONTROL
PACKING/PRODUCT MECHANICALDAMAGE
POSSIBLE QUALITY PRODUCTINJURY (5)
CCP 1: VISUAL INSPECTOCEAN VESSEL LOAD
CCP 1: TIME TEMP.
CCP 1: Complete control of hazardCCP 2: Complete control of hazard not possible
(1) Government responsibility(2) Fresh hake mechanical damage(3) Fish quality: spoilage bacteria/autolysis(4) Temperature(5) Dehydration, rancidity(6) Quality losses
48
developed countries need to implement HACCPcriteria to achieve a final product of high qual-ity, to ensure its fitness for human consump-tion, and to reassure consumers. The Euro-pean countries (EC, Iceland, Finland, Norway,and Sweden) have adopted the ISO (Intema-tional Organization for Standardization) stan-dards on quality management and quality as-surance for the fish industry. Starting January1,1993, the EC official veterinary inspectionwill consist mainly of identifying critical pointsin the fishery plants of Third World countrieson the bases of record keeping and of the pro-cesses used for manufacturing, monitoring,and sampling (in an approved laboratory). TheU.S. Food and Drug Administration has pro-posed, with NMFS, a voluntary HACCP programthat will be mandatory for imports from ThirdWorld countries starting January 1,1995.
In Uruguay the HACCP program for the fro-zen Argentine hake (Merluccius hubbsi) exportindustry will be mandatory to ensure thathake processing plants meet with intema-tional sanitary and quality requirements.Compliance will be monitored by the NationalFisheries Institute of Uruguay Ministry of Ag-riculture and Fisheries). In 1991 private indus-try in Uruguay exported more than U.S. $60million and 45,69C1 metric tons of frozen hakeproducts (fishblocks, fillets, breaded, loins, andheaded and gutted) to developed countries. Ad-hering to the HACCP program will improvemarketing opportunities and prices for the pro-ducer. Begulatory agencies in the importingcountries will spend less money on regulatoryactivities at ports of entry, and consumers willpurchase the quality-controlled seafood prod-ucts with more confidence.
‘I’he table on the opposite page shows theHACCP program for frozen hake plants inUruguay.
WORKS INSULTEDNMFS. 1990. HACCP regulatory model.
Imported products. Model seafood surveil-lance project National Seafood InspectionLaboratory. Pascagoula, MS.
Lee, J.S., and Hilderbrand, KS., Jr. Hazardanalysis and critical control point applica-tions to the seafood industry. 1992.2nd ed.Oregon Sea Grant, Corvallis, OK
Lupin, H.M. 1991. FAOI'DANIDA expert consulta-tion on quality assurance in the fish indus-try. Denmark.
DiscussionB: What refrigeration system is used for SouthAtlantic hake by Uruguayan fishermen?
A: (Bertullo) Ice and the plastic boxes picturedon the slides shown are the only systemcurrently used; we have not yet invested in xswsystems.
Q: Is South Atlantic hake the same as Pacificwhiting?
A: (Bertullo) Although related to Pacificwhiting, our hake has tirmer flesh and fewerparasites.
49

EUROPEAN Qu.REQulREMmS FORHAKEJoachim WernerWerner Consult S.R.L., Assistance Fishing Argentina
Some years ago we had different qualityrequirements in the European Community(EC), the Iberian Peninsula, and the EasternEuropean Countries. Now, with the integra-tion of the Iberian countries into the EC andthe dissolution of the Warsaw Pact, theinfluence of the EC is overwhelming. I thinkthat the EC will establish its own standardsfor quality and that countries in a goodeconomic position will adopt the EC system,or buy “European Standard,” while poorercountries will have to buy substandardproducts or products from plants not ap-proved by the EC. Consumption habits inEurope vary.
In the EC we principally find two differ-ent ethnic and religious groups: the northernpart (Great Britain, Denmark, Germany, andThe Netherlands), which is Germanic andmostly Protestant, and the southern part(France, Italy, Spain, and Portugal), which ispredominantly Eomanic and Catholic. Notonly are race and religion important (forexample, the Catholics eat by far more fish inEaster season than do Protestants). Thereare countries which have a sentimentalrelationship with the sea, like Spain andPortugal. In the Iberian Peninsula you canfind a great variety of fish in the market andthe highest consumption per capita (Spain 35kg) in Europe. Homemakers in Spain stillhave more time to prepare sophisticateddishes, the family generally eats together inthe evening (because of the climate), and the
percentage of working women is lower thanin the northern EC countries. Furthermore,Spain has more tourists per year than anyother European country, even more than ithas inhabitants. Many tourists return to thenorth asking for some exotic fish productslike cuttlefish, squid rings, or even whiting.
In Spain whiting (hake) is the mostimportant fish, the species to which theSpaniards compare all other white fish.Spain is the most interesting in its use ofhake. It is the only country where the con-sumer enters a fish restaurant asking forwhiting. Besides the normal fillet, the Span-ish consumer looks especially for big size
50
H&G (headed and gutted). That’s why SouthAmerican producers separate the big piecesto gut and bleed thoroughly on board even ifthey bring all the rest of the catch to portungutted. It is very important to gut the fishto impede the passage of the nematodes intothe edible part of the fish.
In the South Atlantic nearly all big fisheshave nematodes (of the Anisakis type) in theabdominal cavity, especially near the liverand the stomach. The presence in the muscleis very rare if you gut it on board. If you donot do this, the parasites attack first thebelly flap. Very often these big fish arefemale. This allows you to the separate theroe. In the case of hand filleting the whiting,you should cut the fish first on the upper partand then cut with care the lower part toharvest the roe. Each sack should weigh atleast 1 ll2 or 2 oz to obtain a good price. Thenormal packing is lWP in 2-kg packages, andon a lower price level there is a market forbroken sacks in blocks.
In Spain they defrost this product, put itin salt for some hours to dewater it, and thencold-smoke it (27-29°C). The resulting prod-uct is cut in slices and eaten like a snack.Spain is the only country that buys cocochas,which is the part underneath the jaw. Thecheek is appreciated as the tastiest part ofthe fish. Because the H&G and the filletshave to compete in the fresh fish market, themerchandise should not have any odor andshould be as white as possible.
In other European countries the best-knownfish is cod, and the consumer compares every-thing with this species. In the northern part ofEurope the percentage of working women ishigher than in the south, reaching 50% insome countries. Here you can find the samesituation as in the United States, which meansthat the housewife prefers convenience foodsbecause she does not want to use her precioustime to clean and scale fish. Because of pres-sure from trade unions, the shops usually closeat 6 or 6.30 in the a&moon. Thus, buyershave only one or two hours to make their pur-chases. That is why the quality-minded cookchooses well-known brands.


started asking for a cholerae-free certificateissued by the Argentine authorities eventhough Argentina isn’t under this obligationby law.
We know that cholera bacteriae are verysensitive to chlorine. That’s why in the fishprocessing plant higher dosages should be usedin your wash water (10-15 ppm), even thoughit may accelerate rancidity and shorten theshelf life of the product.
EsTABIJ~HINGQu~STAND~SYou can see that there are several aspects to
establishing quality standards:
1. public health aspect-protection of theconsumer through inspection and control offish products by food inspection authorities
2. the way fish are presented to the public3. the competition among food companies, who
offer guaranteed quality to gain a biggershare of the market
We know that the acceptability of fish isclearly related to price. Products can be re-placed only by offering a better quality or alower price.
Fish compete directly with red meat andpork, poultry and eggs, all products subsidizedby the EC . That means that you can’t raise fishprices while the prices of competing productsare stable. Last year, at least until October,prices went up steadily, and when the produc-ers of fish products tried to pass the increasedprices on to the consumer, they noticed astrong resistance. The result was actually adecrease in business, for example, in Germanya decrease of around 20%. Some companies re-read their purchase conditions in order to passclaims back to the fish block producers, tryingto bring down their high-value stocks a&er theprices went down again.
A good tool with which to pass claims is thecondition of low plate counts, difficult to com-ply with in merchandise frozen on land. Theeasiest way to avoid those claims is to raise thechlorine level in the wash water with the con-sequence that the product, because of fat oxi-dation, has a shorter shelf life. If the qualitydepartment of a processing plant aims to findfailures in order to reduce the price retroac-tively, it will find some pinbones or bloodspotsit would not otherwise have mentioned.
In January 1993 the whole EC will functionas a national market. there won’t be controls atthe national borders. Until now the nationalfish inspectors issued a certificate confirming
52
that the merchandise was produced under hy-gienic conditions. From 1993 on, every plant orfactory ship that is in condition to producegood merchandise will get an official numberand will be obligated to supervise production(this translates to self-monitoring by the fishindustry). All products must have an officialnumber to identify it in case of claims. The in-tention is to install an EC procedure for foodinspection in Third World countries in thesame way as it is planned for the EC , wherecompetent authorities (that is, the central au-thorities of the member states) will carry outchecks and inspections to ensure that the pro-ducers comply with the regulations. Each es-tablishment must have responsible personswho carry out their own checks, especially atcritical points, taking samples and keeping awritten record.
Inside the EC , each member state will notifythe commission of its list of approved establish-ments, and the commission will assign an offi-cial number. Commission experts-in coopera-tion with the national authorities-may make-on-the-spot checks to ensure the uniform appli-cation of this directive.
For imports from ‘I’hird World countries, thedirective foresees inspections carried out bycommission experts to verify the conditions un-der which fishery products have been producedand stored.
Article 10 of the Council Directive 9l/493states that the provisions applied to imports offishery products from Third World countriesshall be at least equivalent to those of commu-nity products. This means that the EC urgesthe Third World countries to apply the samecontrol system as the EC, t0 me a very reason-able viewpoint.
I’d like to explain a little the above men-tioned directive. In chapter V (Health Controland Monitoring of Production Conditions) wefind the following under special checks: or-ganoleptic checks, carried out by the compe-tent authority at the time of landing and afterthe first sale of fishery products. The organo-leptic assessment of fish is the oldest qualitycontrol. Most quality control methods use theorganoleptic control as a basis for verifying re-sults. On the other hand, although each con-sumer has his or her own taste, when qua&&dpersons give their opinion they represent thou-sands or even millions of consumers. This tastepanel decides what the consumer has to like!We know that taste varies from region to re-gion. For example, a German can’t understandwhy a Spaniard prefers to eat hake, a fish hefinds soft and insipid. It is true that hake is

highly perishable and fishing trips are some- limits, not only for plate count but also for col-times too long to guarantee a good product. On iforms, E. co& and staphylococci. It is normalthe other hand, codfish, which Germans like, for the producer of fish blocks or shatterpackhas a far firmer texture, thanks to the high blocks to try to build up a special relationshipdensity of cell walls, which stop the bacterial with a group of buyers, offering a high-qualityspoilage for a while. Even for experienced per- product able to satisfy the requirements of ev-sons it is very diflicult to judge the total qual- ery potential buyer in this group. On the otherity of fish (in this case hake), especially ifit re- hand, eccentric buyers should pay for theirfers to a defrosted fillet. Fresh fillets are easier special wishes.to classify by a trained taste panel, but the pro- Normal requirements without any tolerancecess is quite expensive and there are always for hake blocks (16.5 lbs) are as follows:some members indisposed.
For fresh fillets-and, if you know the his- 1. weight at least 16.5 lbs (7.484 kg)tory of the merchandise, for frozen fillets too- 2. not more than 1 mm deviation of the mea-itks qoi&i~~~ti M.zzw&&%SbS SurSTf&!&(~~x21~~~31TzA),&xL&&A~(as laid down in the directive) by measuring square edges and comersthe quantity of total volatile basic nitrogen. 3. not more than one pinbone or bone (likeWith this test it is easier to find out “missing spinal chip) per kgfreshness” than different levels of freshness. If 4. not more than one ice or air pocket per blockyou have to judge hake fillets, you can hardly 5. no packaging material imbedded in the blockfind sensorial difference under 2ll22 mg % 6. TVB-N under 25 mg 8TVB-N. 7. absolutely no rancidity, bitterness,
I define merchandise under 25 mg % as good staleness, off-flavors, or off-odorsand merchandise up to 30 mg % as acceptable. 8. no chemical ingredients, such as sodiumEven untrained consumers are able to detect polyphosphatesoff-odors in fillets with higher ‘IVES-N levelsthan 30 mg 8. With more than 50 mg %, the There is some tolerance in the matter offillet is spoiled and smells like a stinky onion. blood spots, bruised fillets, black membrane,But by measuring the total bases you can cover skin, scales, water content, drip, and saltonly one aspect of the quality. content.
The first impression, which means not only I have some further suggestions:the color but also the total appearance, includ-ing the texture, is very important. It can hap- 1. No metal clip should be used to close thepen that the fillet is very sofi and has gaping master carton.problems, but nevertheless is fresh and tasty. 2. The label should be big enough to identifyThis is the case with big fillets (possibly after the merchandise, even at a distance of 6-8 mspawning) caught in summer in relatively (that means 5 or 6 pallets high). For thiswarm water. On the other hand you can find purpose the label should be on the side offirm fillets with an undefinable, “fatty” off- the carton and not on the top, showing aodor, even with low TVB-N levels, when the combination of easily understandable lettersaliment&ion of hake consists mainly of an- or numbers.chovy. In this case it is necessary to trim the 3. Bed labels should be used for pinbones infillet excessively and wash it much more than merchandise and green labels for bonelessnormal. Contrary to the principle “first in f?rst fillets, symbolizing that these fillets can beout,” fish like this should be used in the pro- eaten without any danger.cessing plant because it will develop a rancid 4. If you sell fish blocks, insist on two or threeflavor easily. Obviously, there are a lot of blocks per master carton. When you use acomplementary data that detlne quality be- four-block master carton, it is too easy tosides the official regulation or even besides the staple the cartons with the blocks in a _quality specification of the buyer (in this case vertical way which separates the liner fromthe processing plant). the block. When merchandise is sent by
Beferringto microbiological analyses, the container, each carton is handled at leastcommission will propose its measures by Octo- three times (and up to seven times if a bulkber 1,1992. Usually the national inspections reefer is used for transportation). Theapply a limit for plate count of 500,000/g for stevedores usually enjoy throwing cartons,good merchandise, admitting up to 1 million/g. causing fissures of the block, a seriousNevertheless many companies have their own handicap in the case of minced blocks.
53
5. If you sell defatted blocks, you have to definevery accurately what the purchase managermeans when he or she asks for semidefattedfillets. If you cut the fat (for example, with aTrio, Jensen, or a Baader machine), youcould leave three lines. That means the verydeep middle line and the two side lines,which are like waves parallel to the edge. Ifyou remove more fat, you cut the outer linesand the fat will appear in spots. If you cutmore deeply into the fillet, these spots willdisappear, leaving only the middle line,which is nearly impossible to remove. Thefat content usually fluctuates between 1.5and 2%. A semidefatted fillet should bringthe fat content under l.O%, and a one-linedefatted fillet should be below 0.5% fatcontent.
6. Because of its fat layer, hake should betreated like a fat fish. This means youshould cover the interleaved fillets byglazing them. You should not use oxidationenhancers like salt or water-containingmetals (especially copper or iron), but usepermitted drugs, like sodium erythrobate, tostop the oxidation . Hake has a far shortershelf life than cod or other species with alow fat content
7. The block should always be packed with thefat layer inside, but that means that therewill be two fat layers together in the middleof the block. To avoid this problem, you can“buffer” these layers with some defattedfillets. Minced hake has a lower fat contentthan normal fillets. For example, if you have1.6% fat in the fillet, you can get down to1.1% using only the V-cuts. But when youcut the part containing the pinbones a bitgenerously you can easily reach 1.3%. Thereason is that near the neck you have abetter relationship of relatively meagertissue to fat layer than near the tail, whereit is nearly half and half.
8. To minimize the penetration of vapor,always pack the blocks with an additionalPE-bag.
9. In the case of fillets IQF, apply an additional(to the net weight) glazing of 3-5%. ColoredPE helps to identify leftover pieces of PEfilm. A blue-colored film emphasizes the
white color of the fish. Quick-frozen (or evenplate-frozen) fillets always have a whiterappearance than slowly frozen fillets, whichhave mostly a reddish color with even ahyaline impression.
10. Very often the producer mixes mastercartons with plate and blast-frozen inter-leaved fillets, causing a real problem for thestevedores, because the cartons containingthe blast-frozen fillets are usually 1 or 2 cmhigher. Interleaved fillets should be wellcovered with PE with not more than two orthree fillets per layer (depending on thesize). The fillets should not touch each other,even after being frozen and pressed togetherin a plate freezer. Even here you shouldinvest in an additional PE-bag. The expertsof the joint FAO/WHO Food &m-lardsProgramme and Codex AlimentariusCommission deliberated more than tenyears before publishing their standards.Nevertheless, each company has a lot ofindividual quality requirements that do notfit in any standard.
woREScoNsULTEDBundesgesetzblatt Jahrgang. 1991. Teil 1,
page 1966. Verordnung ueber dasInverkehrbringen bestimmter Lebensmittelaus Peru vom 2. Oktober 1991.
Der Spiegel. 1992. Nr. 12., pp. 282-285.FAO. Introducciones al Codex Alimentarius.
FAO, Rome.FAO. 198 1. GCP/INT/345&lOR Register of
import regulations for fish and fisheryproducts. FAO, Rome.
FAO. 1982. Fisheries Report No. 271. Fisheryproducts and the consumer in developingcountries FAO, Rome.
FAO. 1989. FAO Fisheries Circular No.825.Food safety regulations applied to fish bymajor importing countries. FAO, Rome.
Feldmeier, H.S. Mravak, U.Bienzle. 1991.Clinical aspects of human anisakid infec-tions. VetMed H& 1: 58-68.
0fFicia.l Journal of the European Communities.1991. L 268,24. September 1991,34:15-34
54

Discussion allow them three years to meet the newstandards.
Q (Steven Freese, from the audience) Whenwill the new European Community (EC)standards will go into effect?
A: (Werner) In January 1993.
Steven Freese added that the US governmenthas a commission to develop a memorandum ofunderstanding regarding these standards.
Q: Will the U.S. and less developed countries(LM=) be held to the same standards?
&: Aren’t these standards so dif&ult to meetthat the EC will have leeway to reject any blockit doesn’t want in an effort to bring down theprice?
A: (Werner) This is a definite possibility; priceor other factors may cause blocks to be rejectedwhen they wouldn’t otherwise be. For example,it is very dithcult to meet the dual require-ments of low bacterial counts and low chlorinelevels in the fish, since chlorine is primarilyused to keep bacteria down.
A: (Werner) In theory ms have until June 1,1992 to apply for an exception, which would
55

THEIMIWRTANCEOFQU~ASSURANCEFORTHEINTRODUCTIONOFPAClFICHAKElNTOTRADITIONAL~OZENslWFOODMARKETSJim DanielsRichardson International Corporation, Seattle, Washington
Summarized by Ann L. ShriverInternational Institute of Fisheries Economics and Trade
I would like to emphasize the importance ofquality assurance in introducing Pacific whiting into new markets. Shelf life and qualityissues make whiting a second- or third-levelchoice of buyers. Potential markets for thisproduct include retail outlets, food service, andsecondary processors, hut each of these mar-kets has specialized quality requirements thatwill play a role in the successful introduction ofnew products and species such as Pacificwhiting.
Quality assurance involves the followingfunctions:
1. preserving intrinsic quality2. workmanship3. meeting market and customer specifications
The most important function of quality as-surance is the preservation of safety andwholesomeness. Unfortunately, Pacific whitingand whitings in general have gained a reputa-tion for poor quality and short shelf life in theU.S. market. Overcoming this bias may re-quire an extraordinary effort Beyond main-taining product quality at its highest possible.level, there are some additional considerationsthat will play a role in the successful marketing of whiting. Workmanship is important be-cause, while it affects aesthetics more thansafety, it will determine whether the product isable to meet a customer’s speci& needs. Work-manship is composed of the skill and accuracyused in the primary processing steps: filleting,boning, and skinning. It will enable the prod-uct to fit into particular weight, grading, size,packaging, and labelling niches.
Four primary market outlets exist today forseafood. Although once distinct, the divisionsbetween these areas are now becoming some-what blurred; however, for our purposes thesemarkets are retail, food service, and secondaryprocessors.
The retail market covers grocery stores aswell as seafood specialty stores, including56
single outlets, chains, and distributors. Appro-priate product forms are those which can besold either in self service or the fresh case; forthe former, fish is trayed and over-wrapped andfor the latter, thawed for the display. Theseproduct forms include fillets, whole, headedand gutted, steaks, and prepared foods. Qual-ity-assurance concerns for this market focus onboth intrinsic quality and workmanship, sincevisual aspects are important when the productis displayed. Specifications are more flexiblethan in other outlets. In this market, we acceptseasonality and perhaps even expect it. Thedemand for U.S. Department of Commerce in-spection is increasing, and we must pay atten-tion to new requirements for nutritional label-ling. In this market, prepared items are of in-creasing interest, and sauces, breading, andother treatments can be used to cover flawsin appearance.
The food service market includes cafeterias,restaurants, and institutions. This was asteady market throughout the 1980s and hasremained strong through the last several yearsas well. The needs of working couples drivesthis increasing trend towards eating out, eat-ing school lunches, using cafeterias, and so on.Product forms demanded include fillets, shat-ter packs, and prepared items (such as breadedportions). Intrinsic quality is less importanthere than in the retail market; there is abroader range of tolerance for second or thirdlevels of quality. Portion control is relativelymore important, since it determines profits,and workmanship will determine how well thisis accomplished; weight grades of plus or mi-nus a half ounce are not uncommon. Cookinginstructions are often based on cost-controlprinciples. In some areas, such as schoollunches, nutritional information is very impor-tant. Additional considerations in this marketare the need for packaging flexibility, the easeof preparation, and dealing with the seasonal-ity of supply.
Secondary processing markets includebreaders, entree preparations, and other con-verters (such as soup and chowder manufac-turers). Product forms of most interest here arefillets, blocks, and surimi. This market has themost demanding product requirements. Allquality-assurance factors, including intrinsicquality, workmanship, and contractual specifi-cations, are crucial, since manufacturing sys-tems can tolerate only a small degree of varia-tion in the input product to be efficient. De-tailed specifications often include bacteriologi-cal tolerances and even pesticide or mercurylevels. An additional consideration is the desirefor a year-round supply to reduce purchasingcosts, including costs associated with switchinglabels to meet federal requirements when al-ternative species are used. Shelf life issues be-come very important in this market, where ashelf life in excess of 12 months is oRenrequired.
Although this presentation has onlyscratched the surface of potential market opportunities, I hope I have shown that over andabove the classic quality-assurance concerns,the quality-assurance function may be re-quired to tailor processing or other aspects of aprocessor’s operations to specific market needs.For processors investigating a potential mar-ket, I advocate an approach which includes thefollowing steps:
1. Identify potential markets, customers, andproducts.
2. Determine customer quality requirementsand product specifications.
3. Match these requirements to your process-ing capabilities.
4. Match the customer requirements andyour processing capabilities to speciescharacteristics.
Once this has been done, you should under-take test marketing and sampling and feed theresults back into step number 1. Too often,this process is reversed. Following these stepsin this order may take longer and cost more,but will result in markets for Pacific whitingthat are stable and longer-lasting.
Disclcssion
&: (Gil Sylvia, from the audience) Does thetechnology exist to use extruders on fresh fish,and if so, what could the impact be on whiting?
A (Daniels) Currently the technology isunderdeveloped but there are opportunities inthat area, for example in the marketing nicheof making fish sticks in shapes attractive tochildren. Using fresh mince instead of frozenblock for this might cut out a middle step andlower costs. However, the use of fresh productwould entail much closer matching of opportu-nities between primary and secondary proces-sors because of the shorter time horizonrequired.
Q: (Sylvia) Can we really take advantage ofseasonality in the way you pointed out in yourtalk, by giving the product a closer associationwith the fresh fish market? Hasn’t much ofour effort been toward reducing the seasonalityimposed on the industry by the way fisheriesoperate?
A: (Daniels) Seasonal&y may be somethingonly the fresh market can really play to itsadvantage by associating certain products withcertain seasons of the year and playing on thefreshness aspect. In the frozen market we needto increase shelf life in order to assure higherquality.
QZ (Barry Fisher, from the audience) Canwhiting really be a product going directly intogrocery stores, given their emphasis on rev-enue generated per square foot and cash flow?
A: (Daniels) The costs of developing andintroducing a new processed product are sohigh (my-com an estimates $7 million) that aP ybetter bet for whiting might be to try toposition it for the fresh counter within thegrocery store.
QZ What about the problem of consumerunfamiliarity with seafood; should we attemptto counter this by developing and distributingsimple, easy recipes at the seafood counter?
AZ (Daniels) Yes, this is a potentially usefulstrategy. Also remember that the easy-to-fix,processed product appeals to the consumerwho is unfamiliar with fish and intimidated bythe prospect of cooking it.
57
PANEL DISWSSION ON QUALITYASSURANCESession leader: Kenneth Hilderbmnd. Panel Members: Gilbert Sylvia, David Jinchs, EnriqueBertullq Jaachim Werner, Jim Daniels
Q: (Session leader) What are the most impor-tant elements of quality assurance or qualitycontrol for Pacific whiting?
A: Each panel member responded to thisquestion. David Jincks emphasized the needfor fishermen to keep the product as cold aspossible up to the processing phase, and forprocessors to follow up by doing their part tokeep temperatures down so as not to waste thefishermen’s efforts. Jim Daniels highlightedthe related problems of rancidity and whiting%high fat content, to enable whiting to competewith cod, pollock,or other hakes that havelower fat contents and longer shelf life.Enrique Bertullo responded that the problemof competition with cod is resolved throughprice. Joachim Werner discussed handlingproblems that can be resolved with a bit ofspecial care. For example, some frozen blocksold to Germany had been packaged with thefat side out, increasing the danger of oxidationof the fat and leading to rancidity. Had thesimple measure been taken of packing theblock with the fat side of the fish inward, thisproblem could have been reduced. Only two orthree boxes should be packed per carton. Metalclips should not be used. On the other hand,extra polyethylene packing should alwaysbe used.
Gil Sylvia responded that management a&&sthe quality of a product. The fact that thePacific whiting fishery is currently a “pulse”fishery, with all of the product being caught ina very short period of time, makes it risky forthe industry to invest in the capital equipmentneeded for optimally controlling productquality. The current management schemeallows fishing early in the season, whenintrinsic product quality may be relatively low(postspawning condition results in highmoisture and low fat ratios). For surimi, asprices rise, higher-priced fish will becomerelatively more attractive as ingredients.However, as supplies build, prices begin todecrease. Therefore, it may be wisest todevelop a whole portfolio of product forms thatallows the producer to switch between pro-
cessed products as prices fluctuate. Contractsare another important factor; they should bewritten so that improved handling is reflectedby a better price. Finally, there is the need foradditional research, especially on the variabil-ity of product attributes. The entire industryneeds to have a philosophy of improvingquality, to improve the reputation of this fish.
Werner emphasized that when one sellermakes an inferior product, the whole industrysuffers. Sylvia observed that it is interestingthat hakes on the whole are identified bygeographical location, so that the problembecomes one of inferior fish being associatedwith an entire region. Ken Hilde~randsummed up by remarking that a bottom-upapproach was needed in the industry; you can’tproduce a superior product with poorly trained,temporary labor. Quality control people shouldbe management, not production people.
Q (Session leader) What is the effect ofseasonal closures on a company like Mrs.Paul’s? How much of the year must a productbe available for it to be feasible to use in aprocessed product?
A: (Daniels) It is not as much a question of thelength of the availability as it is of the volumeavailable. That being said, a six-month avail-ability might be adequate and a two-monthavailability probably would not be.
Q: (Session leader) What treatments areavailable to solve oxidation problems?
A: (Daniels) My company has used a watersoluble treatment that had to be droppedbecause it colored the fish. They switched tosodium erythrobate, but this is dif&ult todistribute in a frozen block unless it is minced.My company is currently receiving Polishwhiting products and has been surprised at thegood quality of the seven-month-old product.
Q (Session leader) What is the market formince, and would it help to develop a stabilizerthat could be used in mince?
58

A: (Daniels) The consumer says that mince is A: Daniels observed that this hasn’t provenas good as fillets; and yes, a stabilizer would feasible because a several-month inventory ofmake the product more usable. Using sugars, stocks is needed. Sylvia suggested that con-Mrs. Paul’s has been able to reduce formalde- tract arrangements could be adjusted tohyde formation, too; there may be other implement such a system for whiting andoptions as well. reduce the need for long shelf life.
Qz (Gil Sylvia, from the panel) Has Mrs. Paul’sexperimented with management methods suchas ujust in time” delivery?
59
PANELDISCUSSIONON THE C~~PEIRMXVEEFFORTS OF FIsHERlMENANDPR~ssOmTOIMPROVE PRODUCT Quarry OF PACIFIC wHl!J?lNGSession leader: Bob Jacobsen (OSU Sea Grant Extension). Panel members: Terry Rosaaen(Castle Rock Seafood), Kurt Cochran (commercial fiherman), David Jincks (~mmen5-d fisher-man), Tom Libby (Point Adams Packing Company), Jerry Bates &ztic Alaska Fisheries Com-pany), and Barry Fisher (commercial fisherman).
No formal presentations were made by thispanel. Members responded to a set of ques-tions from the session leader and from thefloor.
Q: (Session leader) How can fishermen andprocessors cooperate in assuring consistentquality in Pacific whiting products?
A: The responses of the panelists can becollectively summarized as follows. Some ofthe most important issues related to main-taining the highest quality in this productrevolve around communication and coordina-tion between fishermen and processors. Themore that fishermen understand what willhappen to their fish on shore, and how it isturned into the final product, the better theywill handle the fish at sea. Handling is moreimportant with this product than with anyother; processors need to take a stand andrefuse product from fishermen that ishandled improperly. It is necessary to matchcatching activity with freezing activity sothat fishermen can turn over their landingsevery day. Even those who own both catchingand processing facilities find this challeng-ing, and it is even more difficult when owner-ship is separate. Radio communicationbetween fishermen and processors is impor-tant to ensure that facilities are available atthe dock for immediate unloading of catch.Processors need to be ready to process andfreeze catch within a few hours of landing.There are also a number of catching andhandling procedures which need to be fol-lowed on board with Pacific whiting to ensurethat the flesh does not begin to soften. Theyinclude using champagne ice or refrigeratedseawater systems, constant monitoring ofstorage times and temperatures, shorteningthe length of tows so that the amount of fishin the cod end when emptied is less, reducingfish, and using cod ends with zippers in the
60
bottom rather than dumping fish on board. Astorage time of 12 to 16 hours is acceptable;anything longer than 16 hours on boardresults in softening of the fish. On the plantside, careful handling will include usingpumps rather than manually offloading, andfreezing as quickly as possible. The headedand gutted form can take the most abuse.
Barry Fisher turned away from technicalissues to address institutional concerns. Hepointed out that the Oregon Department ofAgriculture, at the urging of the fishingindustry, has done a good marketing job,making use of the Coastal Oregon MarineExperiment Station (COMES ) and its econo-mist to gather and analyze market data.Grants and low-interest loan programs havealso been provided. Fisher introduced theconcept of a fishermen’s association forPacific whiting, which would have certainvoluntary standards. Everyone interestedshould be involved in the planning, needs ofan economic, technical, and political naturecould be identified, and the potential mem-bers would have to agree on a frameworkthey could all live with. The Oregon whitingindustry is fortunate that the Astoria SeafoodLab began to work on whiting characteristicswhen it did. Fishermen could organize tohave input into this process. Such a group orinstitute could coordinate the efforts ofvarious government groups. Alaska had ahard time with the Alaska Fisheries Develop-ment Foundation and the Alaska SeafoodMarketing Institute until industry beganworking together. With all of its problems,whiting needs an organized industry. Theprimary issue is voluntary standards withsome kind of quality label, to establish somekind of discipline in the market. Fisher askedfor responses to this concept from the otherpanel members and the audience.Terry Rosaaen responded that such anorganization is a good idea; the industry
needs a lobbying group given the currentactivities of the Pacific Fishery ManagementCouncil. He pointed out, however, that eventhough he owned both boats and processingfacilities, it was a big challenge to get themto work together. How can we get such acontentious industry to work together? Itwould require a great deal of cooperation, forexample, in determining which quality of fishcan be used in which product form. KurtCochran agreed with the need for an industrystandard, but wondered how it would bepoliced. The industry should not limit itselfto aiming for a lower-quality product such asthat required by surimi. David Jincks com-mented that this is the year to set standards;the industry needs them but he wasn’t surehow they could be set. Tom Libby also agreedto the need for standards from the moment ofcatch through all processing levels. If themarket comes to perceive whiting as a low-quality product, the Oregon fisherman andprocessor will be in serious trouble. Much ofthe data needed to establish the parametersare probably available from the Astorialaboratory; they would include temperatureranges, acceptable tow lengths, mesh size,and cod end sixes among other things.Processors will have to take a firm stand toensure that the quality standards are met.Jerry Bates pointed out that although theidea for standards is a good one, the marketreally establishes standards, through pricing.The market will push you right out of busi-ness if you don’t comply, and each markethas its own standards.
Fisher responded that what he had in mindwere voluntary standards, developed from,by, and for industry. How are we going to getinto EC markets, he inquired? Answering hisown question, he replied: only with a set ofunified and very strict standards. He claimednever to have gotten a dime for delivering“premium” fish, and that the factory trawlerfleet had no internal standards and delivereda lower-quality product; no price premiumcurrently exists based on quality. The codshortage won’t last forever, he emphasized,and we live in a very competitive world.
A suggestion came from the floor that a stateagency could establish a quality seal ofapproval with some set of standards attachedto it. Another individual pointed out that therapid change in the industry argues fordenied the possibility of shoreside production
of surimi a very few years ago and now it iscommonplace. Discussion continued aroundthe concept that if a certain quality of prod-uct wasn’t good enough for one product form,it could be used for other forms. Some feltthat minimum standards should be set andothers felt there should be a range of differ-ent qualities, perhaps grades. It was pro-posed that a set of standards be drafted withinput from the group, and assistance fromboth COMES and the Astoria Seafood Lab.Suggestions for the standards included thatthey begin as guidelines, be profit driven,establish a range of different qualities, takeadvantage of price and quality marketinformation being developed from the whit-ing study done by Gil Sylvia, and use datafrom processing firms which use time andtemperature monitors on the boats deliveringto them.
The discussion turned to the issue of whoshould be in charge of developing and enforc-ing the standards. Dalton Hobbs, from theOregon Department of Agriculture, offered tohelp. Bob Jacobsen nominated Gil Sylvia togather the information needed and functionas coordinator for this effort, suggesting thatanyone who wanted to be involved “sign upwith Gil.”
With this, the group returned to a technicalissue: the problem of inadequate ice supplies.Ken Hilderbrand asked why processors couldnot simply provide ice to fishermen whosupply them, directly from the plant. It waspointed out that the quantities needed areenormous and that first priority was usuallygiven to the shrimp boats. Some fishermenhad switched over to RSW systems because ofthe irregularity of the ice supply. Thisprovides yet another area where cooperationand coordination between fishermen andprocessors would be to their mutual benefit,particularly with this species and its specialhandling requirements.
At the end of the session, the followingquestion was put to the audience: would it beworthwhile to hold another such conferencenext year? The response was positive, withthe suggestion that the next conference focusmore on fish buyers. It was also suggestedthat a quarterly newsletter on whiting wouldbe useful, and Mike Morrissey agreed thatthis would be an appropriate task for the
61


Marketing

Ron JensenArcti c Alask a Fisheries Corporation
In this paper, I would like to get away fromacademia and talk about the real experience ofproducing and marketing surimi.
Arctic Alaska Fisheries has pioneered theproduction of surimi. We were the first to pro-duce pollock surimi aboard a U.S. vessel (in1986 on the U.S. Enterprise, a surimi factorytrawler). And this year, we will be the first tooperate a hake surimi shore plant, here inNewport.
Producing surimi in the past has not beeneasy for us. We made our mistakes and paidfor them dearly. On our first surimi factorytrawler, we thought we knew surimi enough todo it the “American Way”; we didn’t listen toour Japanese partners or their technicians. Wewere wrong.
Through our mistakes, we have learned alesson and have gained experience. As far asPacific whiting utilization goes, we have stud-ied this potential for a few years now.
We have watched with keen interest, andassisted whenever we could, as dedicated sci-entists such as Boy Porter have painstakinglylabored to develop methods of inhibiting thetroublesome enzyme. We have devoured theseries of informative reports prepared by theOregon Coastal Zone Management Associa-tion. In addition, we have worked with localprocessors and fishermen to learn the impor-tant fundamentals of quality handling of thisfragile species of fish. The dedicated work ofthese people and countless others (such as KenHilderbrand) has resulted in an informationpool from which we have drawn to make thevery difEcult decision to help pioneer the shoreplant surimi business in Oregon.
The people of the Arctic Alaska FisheriesCorporation are proud to be working with localcontractors, fishermen, and processors in pio-neering the domestic utilization of Pacific whiting on a scale only dreamed of as recently aslast year.
We are installing a surimi factory whichprocesses 350 metric tons MT) of round fishper day under a joint venture agreement withJerry and Sheryl Bates of the Depoe Bay FishCompany. We expect to process in excess of40,000 MT of round fish this year.
We are building a state-of-the-art, 320~MT-rated (incoming raw material) Atlas fish mealplant adjacent to the International terminalarea on the bay front in Newport This plantwill provide a critically needed disposal site forlocal processors and will ensure 100% use ofthe raw product in Newport The plant is cur-rently under construction and is scheduled forcompletion on April 15.
We are working closely with the Oregon De-partment of Environmental Quality and theOregon Department of Fish and Wildlife inmonitoring both the water quality and the ani-mal life forms in the estuary. We hope theseongoing studies will help promote continuedpositive interaction between industry and thehabitat caretakers as we together continue topromote ecologically and economically soundmethods of processing fish.
We also look forward to further work withscientists and private industry who continue todevelop more advanced forms of the enzymeinhibitor that will be acceptable to all markets.
To discuss surimi business, we must firstdiscuss pollock surimi, since it has been andstill is a dominant force in the market.
Until the 195Os, surimi was an exclusivelyJapanese-produced, Japanese-marketed prod-uct Through the Magnuson Act, the first U.S.production of pollock surimi took place in 1986on the U.S. Enterprise. Since then, U.S. pro-duction of surimi in the Bering Sea has grownto 140,000 MT yearly.
Until U.S. production became dominant inthe past few years, the surimi market in Japanwas very oligopolistic, controlled by a fewJapanese fishing companies. From 1939 to1990, because of the unknown and unprovenquality of U.S.-produced surimiandthebreakup of traditional Japanese distributionchannels by the new U.S. producers, the mar-ket became confused and prices plummeted.
The drastic increase of surimi prices in thelast six to nine months is most likely tempo-rary, caused by a reduction of surimi produc-tion in the Bering Sea and Donut Hole lastyear. However, extremely high prices are dis-couraging the demand for pollock surimi andencouraging substitute production from less
65
expensive fish species, such as Pacific hake,southern blue whiting, and sea bream.
The reason pollock surimi was preferred inthe past was the high gel-forming capacity ofthe meat and its relatively high whitenessvalue. Pacific whiting, used as a substitute forpollock surimi, is usually blended with pollocksurimi by kamaboko makers to strengthen thegel-forming capacity. Pacific whiting surimihas a very favorable white color and thus is avery attractive alternative to pollock surimi ifpriced reasonably. However, as pollock surimiin Russia increases, and as other substitutesurimi production occurs in Argentina and In-donesia, it faces increasing competition
We estimate the world supply of surimi ingeneral in 1991 to be approximately 390,000MT, of which Japan produces about 200,000MT and the U.S. 120,000 MT. In 1992, thisnumber could be as much as 480,000 MT, anincrease of 26%. Of course the productioncould change in the latter part of the year, butthe estimated increase of surimi mainly comesfrom countries such as Thailand, Argentina,Chile, and Indonesia that produce sea breamor southern blue whiting surimi. Russia alsowill double its pollock surimi productionthrough joint venture this year.
Demand for surimi totals about 460,000 MTworldwide, of which Japan consumes approxi-mately 808, or 380,000 MT. The Japanese de-mand is said to be on a slight decline becauseof a general change in consumer taste. De-mand in Korea, which consumes about 50,000MT yearly, and Europe, 5,000 MT, is on theincrease. However, these markets are stillyoung and small compared to the Japanesemarket.
Considering that the world demand is rela-tively stable at 460,000 MT, surimi supply caneasily be at surplus condition this year ifweinclude all the surimi made out of various spe-cies. Therefore it is certain that Pacific whitingsurimi must meet the challenges from the restof the world.
Between 1980 and 1990, the price of top-grade pollock surimi in Japan was relatively
stable, ranging anywhere from Y400 to X520wholesale. This converts to roughly U.S. $1.00to US .$1.40 FOB Alaska price at&r freight,cold storage, and other expenses. So you cansee how unusual the last year’s radical priceincrease was.
Potential producers of Pacific whitingsurimi should be aware of the historical surimiprice levels and be ready to compete withworldwide surimi production in a costA&ientmanner. The important task we have as pro-ducers of pollock and hake surimi is to try tomaintain reasonable price levels for the longerhealth of the industry and to avoid this boomand bust nature of pricing strategy.
We also discourage gambling all the produc-tion capacity on surimi. Rather, we highly ad-vise diversification into other products, suchas fillets and blocks, to balance the impact ofanticipated market fluctuation.
The quality of surimi plays a very impor-tant role in making the surimi business a suc-cess. Kamaboko producers must trust the suppliers to give them a consistent quality andsupply of material to produce the analog prod-ucts for consumers. %$ualil$ includes themarket acceptance of the surimi that a par-ticular company or vessel produces. There isno perfect surimi; the processors prefer a vari-ety of different characteristics of surimi withinthe same quality parameters. In the sameway, there’s no perfect steak that pleases ev-erybody. Some like T-bones, some like rib eyes.Market acceptance also takes time. When wefirst began producing surimi in the UnitedStates, the Japanese markets didn’t trust thequality of surimi that the Americans producedIn the past five years, we have developed loyalcustomers who prefer the products off our vessels. The general taste of Japanese consumersalso changes. We now produce specializedsurimi, with all sorbitol or all salt surimi forgourmet markets.
In summary, it is the balanced combinationof accepted quality, supply and demand, andright pricing that creates success for surimiproducers.
66

Joseph 2alk.eNichirei Corporation ofAmerica
Global markets for the production of surimi-based products grew to over 2.3 billion poundsin 1990. Long dominated by the Japanese andKorean markets, surimi-based products arestarting to f&rd acceptability as a proteinsource in many global societies.
Table 1 ilhmtrates the best estimates of theglobal production of surimi-based products. Ja-pan is the obvious leader in this production,representing 85% of the total, or approximately
total production, 53,500 MT, or 117.9 millionpounds, were consumed domestically; the bal-ance was exported to the countries shown intable 2.
Japanese exports of crab-style surimiseafoods to the U.S. reached their zenith in1985, t&albng l29,OOO MT. By 1991, the an-nual exports decreased to slightly over 10,000MT, representing a decrease of 93%. Apprecia-tion of the yen, Korean production, and expan-
Annual Estimatetil990
country Metric Tons
Japan 915,000
Korea 103,800
U.S. 50,000
Europe 4,000
Russia 4,000
Thailand 2,000
China 1,000
Totals 1,079,800
Pounds
2,013,000,000
228360,000
110,000,000
8,800,000
8,800,OOO
4,400,OOo
2,200,ooo
2,375,560,000
Source: Nichirei Best Estimates
Table l.Globalp?-odu&m of surimiPd-
2.0 billion pounds. Surimi-based products are astaple of the Japanese consumer. A wide vari-ety of tXish, including salmon, is used insurimi production. Kanikama products, whichtypify the style of products consumed in theU.S. and European markets, account for ap-proximately 20% of the total surimi-basedproducts processed in Japan. In 1990 Japanprocessed approximately 70,000 metric tons(MT) of kanikama, or 154.0 million pounds ofcrab-style surimi seafood products. Prom the
food contributed to the steep decline.sion of the nroduction of U.S.-based surimi sea-
Korea’s domestic consumption of all surimi-based products has almost tripled since 1985.In 1985 the consumption was 25,000 MT; in1991 it had risen to 72,000 MT.
The actual estimated 1991 production ofsurimi-based products was 50% of their totalcapacity. The artificially supported prices ofraw material resulted in plants operating at60% of capacity in the latter half of 1991. Be-
67

Figure 1. Rbeansurimi seafbcds.
Table 2. Japanese exportsof crab-style surimiS&+OdS. &nmaI Estimates-1990)
country Metric Tons Pounds (000omitted)
Australia 1,680 3,696.0
Canada 453 1,007.6
Europe 9,215 20,275.O
U.S. 4,060 10,120.o
Others 1,300 2,860.O
Totals 16,713 36,770.O
Source: Japan Frozen Food Inspection Services
KOREAN SURIMI SEAFOODS8 0
7 0
6 0
5 0
40
3 0
2 0
10
01985 1986 1987 1988 1989 1990 1991 1992
mCCb4. BUS.-&EUR. mOTH
cause of the high prices of raw material, tradi-tional ham and sausage users of raw surimi
the country there are over 1,000 small process-ing companies producing the traditional fried
have switched to turkey meat as an a&ma- kamaboko products.tive. The expected use of raw-material surimi Figure 1 iIIustrates the growth of all surimi-in 1992 will decrease to 40,000 MT. based products in Korea and exports to the
There are currently 16 major surimi seafood U.S., Europe, and other countries.processing companies in Korea. Throughout
68

Estimates in Thousands
1990 1991
country MT LBS MT LBS
France 8,000 17,600.O 4,000 8,800.O
Italy 2,000 4,400.o 2,000 4,400.o
Spain 4,500 9,900.o 4,500 9,900.o
U.K 4,000 8,800.O 4,000 8,800.O
Others 2,500 5,500.o 2,000 4,400.o
Totals 21,000 46,200.O 6,500 36,300.O
Source: Nichirei’s European office
Europe has replaced the U.S. market as the Fmnce
Table 3. Ewopean annualsurimi seajbodwnsumption
dominant recipient of surimi seafoods pro-cessed in Korea, with exports increasing morethen tenfold in the last eight years. Europe willcontinue to dominate Korean exports. Demandby the EC countries for surimi products, strongmarkets, currency strength, and an absence ofan infrastructure in EC counties for processingsurimi seafood will continue to make European attractive export customer.
Surimi seafood consumption in Europe is acombination of imports and an infant domesticprocessing industry. Table 3 is an approxima-tion of European consumption of surimiseafoods.
Information on surimi consumption in Eastern Europe is not available at this time. How-ever, we are aware of sales being made tocountries in this region. Moreover, within thenew Russian republics, surimi seafoods arenow being processed at plants in four locations,operating a total of five processing lines.
At present, six surimi processing lines areoperating in EC countries: U.K-one, France-four, and Italy--one. The total estimatedproduction for 1991 was 4,000 MT, or8,800,OOO lb.
My company, Nichirei Corporation of Tokyo,has established a new joint venture withAngulas Agu&ga, S.A of Spain, to createangulas de surimi. The product resembles thesize, shape, texture, and flavor of wild angulas(baby eels).
The following is a brief profile of the ECcountries.
l The market expanded in 1988 because theuse of additives was permitted by thefederal government.
l Domestic production is sold primarilyrefrigerated because the domestic producerscannot compete with Korean frozen imports.
l The retail market is larger than the foodservice market. The most popular style issticks (sold in 250-g packs).
l Consumption volume declined dramaticallyin 1991 because of unusually high prices.
Italyl The market is largely undeveloped because
of federal restrictions on food additives.l Domestic production started in 1991 as a
joint venture with a Korean company.
Spainl Spain is one of the more mature surimi
markets. Sales started approximately eightyears ago.
l The market is segmented into the high-price,high-quality product of Japan, and the low-price product of Korea.
l Retail is the primary market for surimi.
u. Kl Surimi sales started ten years ago.l The food service market is the most mature
of the EC countries.l Volume is stable at 4,000-5,000 MT
annually.
69
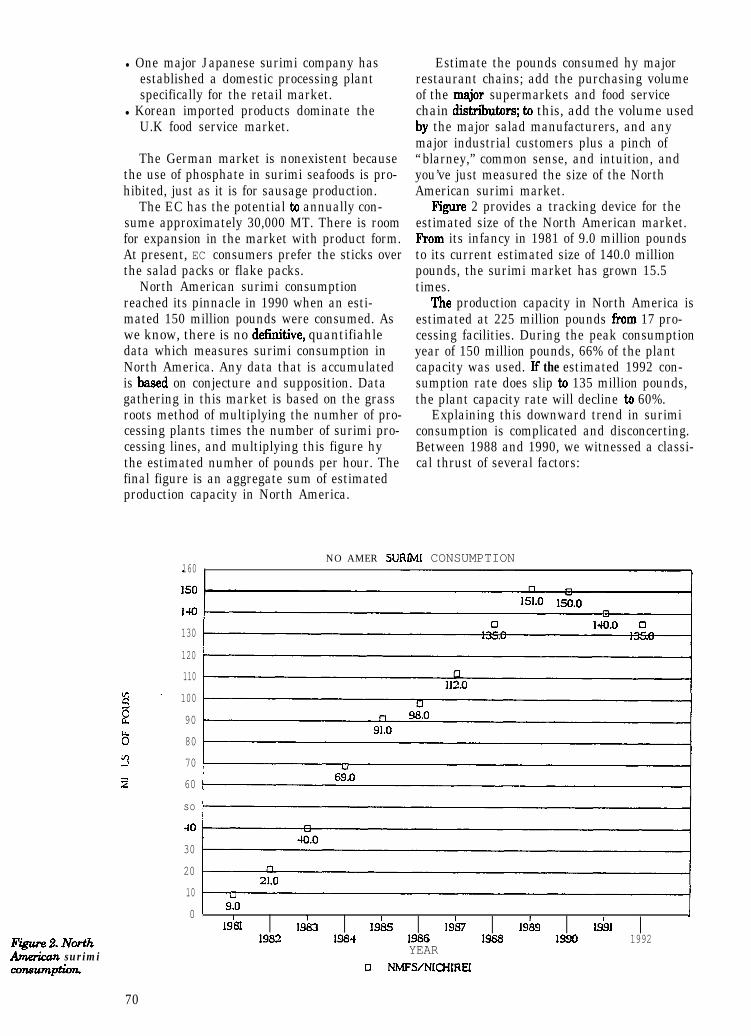
l One major Japanese surimi company hasestablished a domestic processing plantspecifically for the retail market.
l Korean imported products dominate theU.K food service market.
The German market is nonexistent becausethe use of phosphate in surimi seafoods is pro-hibited, just as it is for sausage production.
The EC has the potential to annually con-sume approximately 30,000 MT. There is roomfor expansion in the market with product form.At present, EC consumers prefer the sticks overthe salad packs or flake packs.
North American surimi consumptionreached its pinnacle in 1990 when an esti-mated 150 million pounds were consumed. Aswe know, there is no def?nitive, quantifiahledata which measures surimi consumption inNorth America. Any data that is accumulatedis hased on conjecture and supposition. Datagathering in this market is based on the grassroots method of multiplying the numher of pro-cessing plants times the number of surimi pro-cessing lines, and multiplying this figure hythe estimated numher of pounds per hour. Thefinal figure is an aggregate sum of estimatedproduction capacity in North America.
Estimate the pounds consumed hy majorrestaurant chains; add the purchasing volumeof the major supermarkets and food servicechain distributors; to this, add the volume usedby the major salad manufacturers, and anymajor industrial customers plus a pinch of“blarney,” common sense, and intuition, andyou’ve just measured the size of the NorthAmerican surimi market.
Figure 2 provides a tracking device for theestimated size of the North American market.From its infancy in 1981 of 9.0 million poundsto its current estimated size of 140.0 millionpounds, the surimi market has grown 15.5times.
The production capacity in North America isestimated at 225 million pounds from 17 pro-cessing facilities. During the peak consumptionyear of 150 million pounds, 66% of the plantcapacity was used. If the estimated 1992 con-sumption rate does slip to 135 million pounds,the plant capacity rate will decline to 60%.
Explaining this downward trend in surimiconsumption is complicated and disconcerting.Between 1988 and 1990, we witnessed a classi-cal thrust of several factors:
NO AMER SURIMI CONSUMPTION160
140
130
120110
100
i? 90
0" 80
Y 70=L 60
so
10
30
20
10
0
Figunz2.NorthA&rican surimiwnsumption.
1 9.0I I I I I I
I1981 1983 198s 1987 1989 1991
1983 1981 1986 1988 1990 1992YEAR
0 NhJFS/NICHIREI
70

market assessments that supported theadditional major capital expenditures innew processing equipment,new processing companies coming on line,anda frenzied expansion of line capacity.
All this took place in response to the predic-tion that surimi consumption would reach alevel in excess of 175 million pounds.
Market activities supported these manage-ment decisions:
Major restaurant chains offered a variety ofsurimi products.Salad manufacturers expanded theirdistribution patterns to satisfy consumerdemand for light foods. Surimi seafoodsbecame a key ingredient in saladcombinations.Supermarket chains expanded their mer-chandising of surimi products to multiplelocations in the stores: deli, seafood counters(both service and self service), salad bars,and frozen food cases. Supermarket opera-tors found a new major profit contributor insurimi to offset the decline they wereexperiencing in other seafood items. Last,surimi afforded the supermarket operatorsa profitable promotional vehicle at $1.99a pound.
The surimi seafood processors actively sup-ported this demand through formulation ma-nipulation to satisfy the requests for lower-priced products. As long as the raw materialcosts of pollock surimi remained low, thisstrategy was not only feasible, but profitable.
Surimi seafood consumption of 175 millionpounds was a sight worth setting.
We all know what occurred in the winter of1990. Paw material prices started to acceler-ate, and processors were faced with the inevi-table fact-the price of finished goods wouldhave to increase. The reality of the situationbecame apparent, not at first, but shortly afterthe beginning of 1991: the underpinnings ofthe structure of the surimi seafood industrywere weak.
Cvercapitalixation became the nemesis forthe industry: too many processors were chas-ing a market whose growth curve was matur-ing. Price rather than quality concerns tookpriority in the buying decision.
Because surimi seafood is one of a numberof ingredients in most preparations, discerningquality features are often masked by other in-gredients.
No one surimi seafood processor enjoys aposition of leadership from which to direct themarket or provide a stabilixing influence.
The symptoms of a declining, mature mar-ket heated up:
Buyers began to perceive surimi seafood as acommodity.Companies tried to grab the market sharethrough price reductions.Consumption stagnated or declined.The food service industry suffered menuburn out.Surimi seafood was no longer “new.”The introduction of any new product wasmet with limited success.
Surimi seafood will have to take on a newdimension. For it to remain a viable productcategory, everyone even remotely connectedwith this industry will have to start with repo-sitioning the product
The stigma of Ymitation” must be erased. Inhindsight, initially positioning surimi as a“crab substitute” was an error in judgementthat we are still living with. The five- to six-year battle with the FDA must be resolved,and “imitation” must be dropped from the de-scriptive nomenclature.
New market niches are being untapped bymany of us and must be pursued. This will re-quire new product forms and uses. We mustretain the confidence of the current heavy con-sumer and encourage the casual user to con-sume more. There are many nonbelievers inthe market. They are not convinced that engi-neered foods have a place in their diet; continu-ous exposure and trial usage will convert someof this group.
Surimi seafood as an ingredient in manyproducts is viable. In my view this is the nextimportant direction for surimi.
My concern for the future of surimi seafoodsis the adulteration of the seafood formulas toachieve a viable, profitable product matrix. Reducing the percentage of raw material surimiin a product in order to compete in the marketis tantamount to ordering our own destruction.
We must establish identification standardsfor surimi seafoods to provide a buyer’s guide.At present, the quality of surimi seafood is leftto the subjectivity and discretion of the buyers.
Pacific whiting, as an ingredient in surimiseafood, is not a problem. As matter of fact, thePacific whiting we used in test runs producedan excellent product Using this species as ablend with other species is not a problem in themarket. Keep in mind that in the early days of
71

surimi processing, turbot was blended withAlaskan pollock. If my memory serves me cor-rectly, Gulf croaker was one of the first finfishto be considered for surimi.
However, until we resolve the issue of theenzyme inhibitor, we cannot proceed furtherwith whiting surimi. Once a definitive ruling ismade and agreed upon by the government, wecan move forward.
I am confident the surimi seafood industrywill evolve to the next plateau. The “surimishock of 1991” has made us realize that theelements of survival are quality, product at-tributes, and product benefits. We live in aworld of food that offers instant, substitutablegratification. No one product is insulated fromthis fact All of us who are involved in thesurimi industry, whether through ingredients,packaging, boat ownership, fishing, processing,or marketing, must continually do our part toensure that when the chefs, menu develop-ment personnel for restaurant chains, super-market merchandisers, or consumers think ofprotein, surimi comes immediately to mind.
Discussion
Q. (Susan Hanna, OSU Department of Agri-culture and Resource Economics) What is yourcompany, and the industry in general, doingabout the problem of the high levels of sodiumin surimi products? Is this level of sodiumnecessary? Are there any alternatives?
A. Zalke responded that Nichirei is planning tointroduce products with 42% less sodium. Thecompany does think that this is important toconsumers. Jae Park also remarked that it’s animportant issue, and Tyre Lanier expressedthe hope that with new developments in hisresearch, they may be able to reduce sodiumlevels another 25% or so from there.
Q. What about quality standards? Are theyneeded?
A. (Zalke) Absolutely. I would make a plea forthe development of these standards, whichbuyers in the marketplace are asking for. Upto now, brands have not been an importantway of identifying product because of the manysmall suppliers. As the competitiveness of theindustry heats up, smaller firms will be drivenout of the business, which will consolidatedown to fewer, larger suppliers. As this hap-pens, brand association will become moreimportant
Tyre Lanier followed up with the commentthat the problem is not the lack of standardsbut the lack of brands. Zalke replied that theyare hoping for stability in the raw materials sothat they can make quality more importantthan price in determining which raw materialsto buy.
Q. (Gil Sylvia) When banana suppliers at-tempted to standardize the product to improvethe overall quality of bananas delivered to con-sumers, they lost a lot of the variety availablein the product How can we standardizewithout losing variety in surimi seafoods?
k (Zalkel There are two ways surimi has goneto the market: through retail brands in suchproducts as “Sea Legs,” and through seafoodmenu items in restaurants. Bestaurants beganby putting the product into their menus usingmany different formulations; this causes a vastproliferation of surimi types and formulas.This situation made restaurant surimi usersoverly concerned with price and not concernedenough with quality. Gil Sylvia commentedthat good chefs could train consumers to usesurimi, which would improve demand at thesupermarket. Zalke replied that Nichirei hasbeen working with some home economists andchefs, but to date there has been no industry-wide effort. He had worked with the surimicommittee of the National Fisheries Institute@VI), but it has a very small budget, whichthey have used mostly to work with newspaperfood editors. Barry Fisher recommendedworking with the Chefs de Cuisine group ofOregon, which is committed to pushingunderutilized species.
72
TEE SITCIA~ON OF GLOBAL SURIMI, WITH SPECIALEMPHASISONTHE J~~sER~ARKETIchiro K&oINFOFISH, Kualu Lumpur, Malaysia
THE GLOW SUPPLY SITUATION current operations in Japan are not as efficientAccording to industry estimates, the current as those in the U.S. Thus, a further reductionworld surimi production (1991) is 390,000 met in the number of production facilities will beric tons (MT), down by 130,000 MT from the expected in the foreseeable future in Japan.1988 peak of 520,000 MT (table 1).
1985 1986 1987 1988 1989 1990 1991
Japan vesselplantsubtotal
U.S. vesselplantsubtotal
Rep Korea vesselRussia vesselArgentina vesselThailand plantTotal (vessel + plant)
240180420
__0
20_
10450
240170410
020
20460
220 240 150 80 30170 160 150 140 140390 400 300 220 170
30 80 150 11020 30 30 40 5020 60 110 190 16030 30 30 20 10
- - - 1010 10 10
20 30 20 20 30460 520 470 460 390
*Table 1 is based on industry estimates.
from 93% (420,000 MT) in 1985 to 43%(170,000 MT) in 1991. Meanwhile, the U.S. hasrapidly increased its share to 40% (160,000MT) in 1991. In addition, the number of pro-ducing countries has expanded to six in 199 1.
Japan has significantly reduced its share When looking into the supply demand bal-ante in the three major players of surimi in theworld-Japan, the U.S., and the Republic ofKorea-we see the following facts. Japan islargely dependent on imports (81% in 1991)and hence is the largest net importer. On theother hand, most U.S. production is exported(78% in 1991). This makes the U.S. the largestsupplier of surimi. As in Japan, the end prod-uct manufacturers in Korea are largely depen-dent on U.S. surimi supply (77% in 1991).
The major portion of Japan’s productionused to be made on board (57% in 1985); how-ever, onshore plants dominate current produc-tion (82% in 1991). In contrast, U.S. productionis mainly made on board (69% in 1991). Thai-land is the third largest surimi producer. Thaisurimi production from itoyori, or thread&rbream Wemipterus spp.), is entirely made on-shore, while others’ production is all made onboard.
During the 1987-91 period, the number ofU.S. vessels and plants increased from 3 to 24and from 3 to 7, respectively. Meanwhile, thenumber of Japanese vessels and plants hascome down from a high of 41 in 1988 to 31 in1991 and from a high of 40 in 1985 to 36 in1991, respectively, as production volume camedown. By comparison, it is quite obvious that
THEJAPANESEMARKEFTable 2 shows the origins of surimi coming
to Japan. The total supply has greatly dimin-ished, from the 1988 peak of 447,000 MT to324,000 MT in 1991. This is a 28% decrease inthree years. Pollock surimi is mainly from U.S.vessels and plants (60,000 MT and 22,000 MT,respectively, in 19911, whereas Japanese joint-venture operations with other countries havealmost terminated (only 1,000 MT from a jointventure with Russia in 1991). Furthermore,
Table 1: GlobalSzuimiP?dution(lom rn)..*
73

JanuaryFebruaryMarchAprilMayJuneJulyAugustSeptemberOctoberNovemberDecember
1990 1991 1992Shore Sea Shore Sea Shore Sea
processed processed processed processed processed processed1.8 3.5 2.1 3.6 4.1 4.51.8 3.5 2.1 3.6 4.1 4.51.7 3.3 2.1 3.6 3.9 4.31.8 3.2 2.1 3.7 3.9 4.31.8 3.2 2.1 3.6 _1.9 3.3 2.1 3.6 -1.9 3.3 3.8 4.1 _ _1.9 3.3 3.8 4.12.1 3.6 3.9 4.32.2 3.8 3.9 4.32.2 3.9 4.0 4.32.2 3.8 4.1 4.5
Note: Price figures on the table indicate the high side of price range.
Source: INFOFISH Trade News, 1990-92
Table 3: Japan: Prices of Ahka pollock surimi of domestic origin at Tokyo whdsale market (U.S. $/kg).
Surimi supply from warmwater species suchas itoyori, or thread&r bream, is also growing.The major supplier of this surimi is Thailand,at 28,000 MT in 1991. Surimi from other spe-cies, which are not identified in the table butwhich are not necessarily insign&ant, is alsogrowing markedly, from 10,000 MT in 1986 to43,000 hFP in 1991.
To sum up, the following trends in surimisupply for Japan can be safely identified:
1. Total supply is declining.2. Pollock surimi supply is declining.3. Other surimi supplies are rising.4. Currently, species with good potential
are southern blue whiting, Pacificwhiting, and threadfin bream.
PRICE TBENDTable 3 shows a steadily rising trend in
surimi price. Prices have increased from U.S.$18&g for shore surimi and U.S. $3.5/kg forsea surimi in January 1990 to U.S. $4.1 andU.S. 84.5, respectively, in January 1992. Thesefigures represent increases of 128% and 298,respectively, in just two years. In addition, thefollowing points can be made with respect toprices:
1. Sea surimi costs more than shore surimibecause of quality, but the price differencehas been reduced signi&antly. In March1992, it was only 10%.
2. Prices are seasonal. That is, toward the endof the year, prices tend to go up.
3. The price of pollock surimi still innuencesthe price of surimi from other speciesbecause of its large volwne and excellentquality. The price of itoyori surimi is lowerthan that of pollock, and the price of surimifrom other white-meat fish, such as hokiand Pacific whiting, is presumed to beslightly lower. The only exception, whichhas emerged recently, is southern bluewhiting surimi. Because this surimi iswhite, elastic, and tastes better thanpollock, it fetches the highest price.
4. Manufacturers still prefer domestic surimiof higher grade to imported surimi, such asU.S. surimi, because the quality of importedsurimi is not consistent The representativeof the manufacturers’ association says thatthere are few instances in which the qualityof shipped products is equal to that of thesamples provided.
Wholesale prices of surimi-based productsare also rising, reflecting a hike in surimi priceand other production costs. For instance,wholesale prices were up by 10% between 1989and 1990 and 7% between 1990 and 1991when compared to February prices, which areusually the lowest prices of the year (table 4).
The hike in retail prices for the past yearwas more signifiant. Retail prices of tradi-tional surimi products, such as kamaboko
75
Table 4: Japan.-Whoksakpricesof knedproducts at six
!ZEXZLs*mwkefs wkg;).
with only 16 employees. There are a number of1989 1990 1991 giant companies; the rest are small-scale op-
erators. The price hike of last year has hit theJanuary 417 427 476 industry at this end especially hard. An esti-February 401 440 472 mated 50 small-scale companies, or double theMarch 403 442 481 number in the 1990, went out of businessApril 416 442 488 in 1991.May 422 444 507June 422 450 524 PACIFICWHITINGPERSPECTlVEJuly 414 450 522August 420 460 520
Although Alaska pollock is still a major
September 410 464 521source for surimi, other coldwater white-meat
October 411 456 526fish, such as hoki, southern blue whiting, and
November 497 457 518Pacific whiting, have been claiming more and
I
December 551 618 682
I
more of the Japanese market. The 1991 figureswere 6% for Pacific whiting, 4% for southern
Source: Fisheries Products MarketingStatistics, Ministry of Agriculture,Forestry and Fisheries
blue whiting, and 3% for hoki.The use of Pacific whiting surimi is not
specified by the manufacturer, although it canbe assumed that the high grade goes to theproduction of high-grade kamaboko whereas
(boiled fish paste), chikuwa (tube-shaped fishthe low grade goes to products at the other
past& and samumaage (fried fish paste), wereend, such as chikuwa, satsumaage, and
raised three times in succession, in August andhampen (floating-type boiled fish paste). The
November 1991, and January 1992. Last year,different grades ofk&ama, or crab leg aa-
retail prices of some products were up by 50%log, are made from various grades of surimi;
over the same period in 1990. Major manufac-thus, high-grade surimi is used in high-priced
turers are worried about the likely impact of aproducts and low-grade surimi in low-pricedpr~u~s.
rapid hike in prices on consumption, sayingBecause of the price rise, consumers may
Manufacturers usually prefer white-meatsurimi to nonwhite meat since the former can
move away from surimi products. Conse-quently,
be processed into various end productssurimi products may shift their posi- whereas nonwhite surimi has limited use be-
tion from necessary to luxury items.” Cur-rently in Japan, there are said to be 3,100
cause of its color and smell. Thus, the price of
manufacturers processing consumer productswhite-meat surimi is usually higher than that
worth Y 500 billion, or U.S. $3.8 billion. How-of nonwhite. Surimi from Pacific whiting is ob
ever, the average size of the factory is small,viously white; thus, it can sell well at pricesclose to those of Alaska pollock. To sum up, we
Table 5. Japan.-Main fib speciesused forsurimi Marketp?KUlU&On
Species Commentrank
::
AB
BBB
zi
Alaska pollockPolar cod
Yellow croakerPacific whiting
HokiWhite croakerMerluccius spp.
Threadfin breamChilean mackerel (scad)
Commonly used for all surimi-based productsBest whiteness; it can produce high-qualitysurimi-based product.Excellent gel strengthStarted to produce in 1988; surimi has good gelstrength.Good whiteness and gel strengthGood gel strength and whitenessGood whiteness; quality similar to hoki andpollock.No black membrane and tissueGood taste, white-grey meat color
Note: A = excellent; B = good; C = fair
76
can say that there is good potential for Pacificwhiting surimi exports to Japan, provided that(1) there are ample resources to ensure steadysupply, (2) production cost, and hence price, islow enough, and (3) the quality of the surimi isas good as that of Alaska pollock surimi or atleast close to it (table 5).
FACTORS TO BE MONITOREDAlthough domestic demand is stagnant be-
cause of declining domestic production, moreimports of nonpollock surimi, including Pacificwhiting, can be expected in this decade. How-ever, the following factors need to be closelymonitored when we develop a plan for a newspecies like Pacific whiting.
1. Domestic consumption of the end prod-uct, which is currently stagnant, maydecline further, for the following reasons:
a.
b.
C.
d.
Prices are high compared to those forother seafood or nonseafood products.In particular, a rapid price hike mayscare consumers away from surimiproducts, as actually happened in1991 when end-product manufactur-ers collectively raised the retail priceof their products substantially twicein one year and again once in 1992.Consumers may become a little tiredof eating products that have similarlooks and similar tastes. They maywant more variety. Although manu-facturers are trying hard to inventnew products, like kanikama, theyhave not yet developed a product thatrivals kanikama in its enormouspopularity.Today’s consumers are becomingmore and more health oriented. Theend product from surimi containsvarious additives that may not beconsidered good for health. In addi-tion, consumers may be developingan orientation toward natural foods,which they prefer to artificial orprocessed foods.As long as end products likekanikama are analogs, they willnever win over the seafoods theyimitate. In short, there is a growthlimit to analog consumption. This isespecially so when the price differ-ence is less and consumers’ dispos-able income is growing. The technol-ogy of processing surimi into
kanikama has progressed to theextent that, according to the indus-try, the latest high-grade product isalmost like the one it imitates interms of looks, texture, flavor, andtaste. Hence, it is easy for ordinaryconsumers to mistake the analog forthe real thing. However, even thoughthe species imitated by surimi ana-logs are getting scarcer, the imitationproduct will seldom gain a respect-able position in the future.
2. The production cost of the end producthas already become prohibitively high inJapan so that a number of Japanesemanufacturers are already operatingoverseas as part of joint ventures. Thus,demand for surimi in Japan will furtherfall. This trend will continue as morecountries begin processing an end prod-uct. However, other countries with agrowing demand for surimi, such as theRepublic of Korea, Thailand, Singapore,and Malaysia, can be the next marketsfor U.S. surimi.
The Republic of Korea. Korea is thenext largest buyer of U.S. surimi with agood potential. Although Korea itself istrying to ensure a constant surimisupply, domestic production is likely to bestagnant, according to industry sources.A number of manufacturers, anticipatinga good European market, are in fullswing in their kanikama production.Thus, a scarcity of surimi is anticipated.
Thailand. At the moment, Thailandis known to be an exporter of surimimade from warmwater species, withinsignificant amounts of surimi imports.However, we anticipate that in thisdecade Thailand, in joint ventures withJapanese and Korean firms, will increaseproduction of surimi-based products,targeted for Japan, Europe, and so on.Furthermore, itoyori resources reportedlyare quickly dwindling. In light of thesetwo projections, the surimi industryshould not be surprised to receive asubstantial number of orders fromThailand in a few years.
Other countries. At the moment,Singapore and Malaysia, in addition toThailand, are considered good overseasproduction bases by the Japanese andKorean surimi industry. In fact for thepast few years several plants have
77
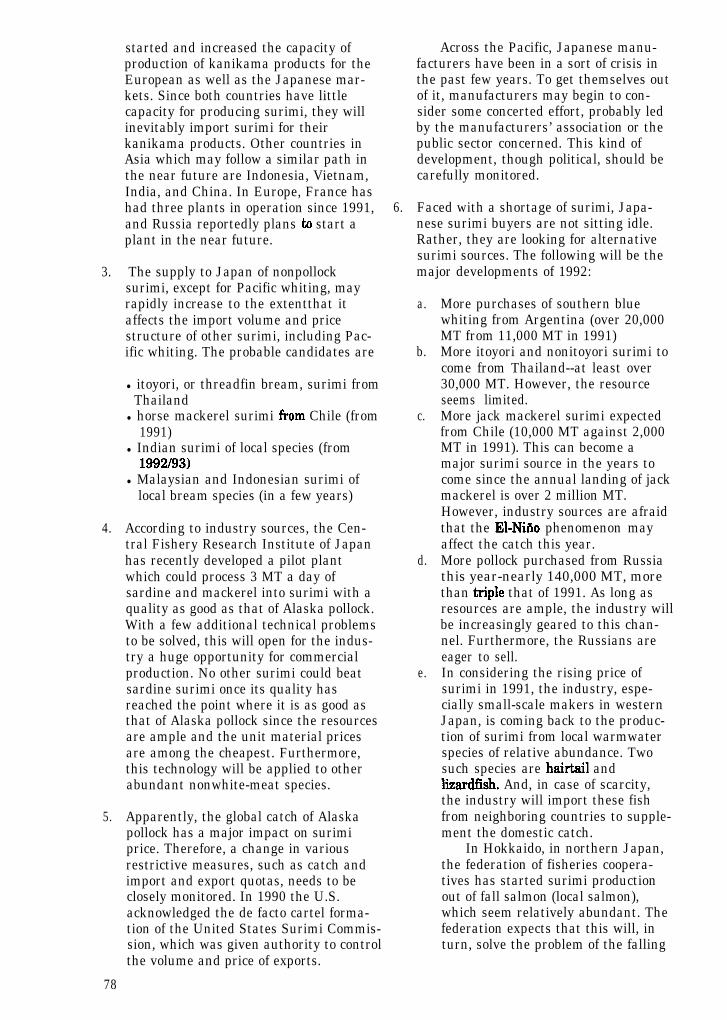
started and increased the capacity ofproduction of kanikama products for theEuropean as well as the Japanese mar-kets. Since both countries have littlecapacity for producing surimi, they willinevitably import surimi for theirkanikama products. Other countries inAsia which may follow a similar path inthe near future are Indonesia, Vietnam,India, and China. In Europe, France hashad three plants in operation since 1991,and Russia reportedly plans to start aplant in the near future.
3. The supply to Japan of nonpollocksurimi, except for Pacific whiting, mayrapidly increase to the extentthat itaffects the import volume and pricestructure of other surimi, including Pac-ific whiting. The probable candidates are
l itoyori, or threadfin bream, surimi fromThailand
l horse mackerel surimi from Chile (from1991)
l Indian surimi of local species (from1992/93)
l Malaysian and Indonesian surimi oflocal bream species (in a few years)
4. According to industry sources, the Cen-tral Fishery Research Institute of Japanhas recently developed a pilot plantwhich could process 3 MT a day ofsardine and mackerel into surimi with aquality as good as that of Alaska pollock.With a few additional technical problemsto be solved, this will open for the indus-try a huge opportunity for commercialproduction. No other surimi could beatsardine surimi once its quality hasreached the point where it is as good asthat of Alaska pollock since the resourcesare ample and the unit material pricesare among the cheapest. Furthermore,this technology will be applied to otherabundant nonwhite-meat species.
5. Apparently, the global catch of Alaskapollock has a major impact on surimiprice. Therefore, a change in variousrestrictive measures, such as catch andimport and export quotas, needs to beclosely monitored. In 1990 the U.S.acknowledged the de facto cartel forma-tion of the United States Surimi Commis-sion, which was given authority to controlthe volume and price of exports.
78
Across the Pacific, Japanese manu-facturers have been in a sort of crisis inthe past few years. To get themselves outof it, manufacturers may begin to con-sider some concerted effort, probably ledby the manufacturers’ association or thepublic sector concerned. This kind ofdevelopment, though political, should becarefully monitored.
6. Faced with a shortage of surimi, Japa-nese surimi buyers are not sitting idle.Rather, they are looking for alternativesurimi sources. The following will be themajor developments of 1992:
a. More purchases of southern bluewhiting from Argentina (over 20,000MT from 11,000 MT in 1991)
b. More itoyori and nonitoyori surimi tocome from Thailand--at least over30,000 MT. However, the resourceseems limited.
c. More jack mackerel surimi expectedfrom Chile (10,000 MT against 2,000MT in 1991). This can become amajor surimi source in the years tocome since the annual landing of jackmackerel is over 2 million MT.However, industry sources are afraidthat the El-Niiio phenomenon mayaffect the catch this year.
d. More pollock purchased from Russiathis year-nearly 140,000 MT, morethan triple that of 1991. As long asresources are ample, the industry willbe increasingly geared to this chan-nel. Furthermore, the Russians areeager to sell.
e. In considering the rising price ofsurimi in 1991, the industry, espe-cially small-scale makers in westernJapan, is coming back to the produc-tion of surimi from local warmwaterspecies of relative abundance. Twosuch species are hairtail andlixardfish. And, in case of scarcity,the industry will import these fishfrom neighboring countries to supple-ment the domestic catch.
In Hokkaido, in northern Japan,the federation of fisheries coopera-tives has started surimi productionout of fall salmon (local salmon),which seem relatively abundant. Thefederation expects that this will, inturn, solve the problem of the falling

7.
price of salmon. Reportedly, thesurimi has a slight salmon flavor, soit may sell well, even ifit is pricedhigher than pollock. The federationhas processed over 10,000 MT of fishinto surimi, and major fisheriescompanies have also joined theproduction in 1991. Thus, the indus-try estimates that l0,000-15,000 MTof salmon surimi was producedin 1991.
Last, when we market Pacific whiting, weneed to seriously consider two factors:
Whether Pacific whiting should go tosurimi-processing or not depends onthe market prices of frozen fillet,block, or other forms. For instance,when the price of fillets are high, rawmaterial should go to filleting, not tosurimi processing.Supplying to a number of U.S.manufacturers is always a goodalternative to exporting. In anticipat-ing the increasing production capac-ity of surimi-based products in theU.S., we need to study this fact, aswell as export markets.
woRKscoNsuLTEDde Franssu, Luc. The World Surimi Industry
Prospects for Europe, GLOBEFISH I&-search Programme, Volume 18, January1992, FAO, Borne, Italy.
Freese, S., Personal correspondence, April1992, National Marine Fisheries Service,Seattle, U.S.
Eano, Ichiro. Tropical Surimi, pp. 21-25,INFOFISH International l/92, January1992, INFOFISH, Kuala Lumpur, Malaysia.
Sakiura, M. World Marketing Trends inSurimi and Surimi Based Products, pp.1417, Proceedings of the Seminar on Advancesin Fishery Post-Harvest Technology inSoutheast Asia, 199 1, Marine FisheriesResearch Department, Southeast AsianFisheries Development Center, Singapore.
Suisan Eeizai Shimbun or Fishery EconomicNews (in Japanese) 1991-92, Tokyo, Japan.
Suisan Times or Fisheries Times (in Japanese)1991-92, Tokyo, Japan.
79

Dalton HobbsOregon Department of Agriculture
Because of the rapid development of theAmericanized Pacific whiting fishery along thecoasts of California, Oregon, and Washington,a unique set of promotional opportunities aswell as challenges has been served up to thefishermen and processors of whiting in thesestates. During the joint venture period of thewest coast whiting fishery, U.S. fishermenwere more often involved with the productionand negotiation of price, leaving the details ofmarketing the whiting products to their off-shore partners. I would like to explore what wefeel are the significant opportunities for fisher-men and processors, how they may be chal-lenged, and what strategies they can use to de-velop export and domestic markets for whiting.
There are currently three major markets forPacific whiting: (1) Japan, which imports alarge percentage of Pacific whiting surimiproducts, (2) the EC, which is essentially a filletand to a lesser extent a headed-and-gutted(H&G) market, and (3) the United States,which is characterized as a mature H&G mar-ket, with growing opportunities for new prod-uct categories.
An important marketing strategy for devel-oping and expanding these markets is partici-pation at major trade shows. These shows pro-vide efficient access to key buyers, wholesalers,distributors, and processors in targeted marketareas. However, participation in trade showscan be very expensive and requires graphic ex-pertise. Too often, past generic or governmen-tal efforts have been lackluster when comparedto the displays of competing products. For Pa-cific whiting marketers, it is critical to mount aworld-class effort at trade shows. To do lesswill result in less than hoped for results.
Another important tool for reaching import-ers and buyers of whiting in offshore marketsis trade missions to targeted industries. In thelast 12 months the Oregon Department of Ag-riculture has mounted three such missions toJapan alone. The purpose of these missions isto introduce suppliers and their products toprospective buyers. The missions have provento be effective in attracting new buyers anddispelling misconceptions in the marketplace.
80
Last November (1991) an eight-membermission was in the seafood processing area ofIshinomaki, talking to surimi manufacturersand processors. These were very experiencedJapanese seafood product managers, with avery high level of sophistication and knowledgeabout fish.
Midway through the presentation, theybrought out for the group’s examination twowhole-frozen whiting that had been eviscer-ated. The viscera were beside the fish with evi-dence of a liver nematode. The Japanese pro-cessors told us they had heard of the parasiteproblem with Pacific whiting and asked if theliver worm was an example. The technicalmembers of the Oregon mission relayed thatwhile visually disturbing, the live worm wasnot the problem. There then ensued a longtechnical discussion of the “real” Pacific whit-ing parasite problem. This example points outthe importance of face-to-face information ex-change. Although expensive, technical market-ing meetings of this kind are absolutely criticalto any long-term market development programfor Pacific whiting.
Certain product forms of Pacific whitingmay lend themselves to in-store promotions.The efficacy of this tool, however, will dependgreatly on the relative value of the Pacificwhiting product to be promoted. It is unlikelythat a lower-value H&G product will be able tosustain in-store promotion. Promotion of thiskind of product will most likely be consigned toprograms funded by the government or bytrade associations. However, higher-valuebranded products, such as Pa&c whitingsurimi analogs, may have enough selling mar-gin to support in-store promotion. These pro-motions could include such tools as point-of-sale materials, recipe cards, product demos orjoint promotional programs with compatibleproduct categories. All of these marketing ef-forts should be supported by trade-press andvernacular press publicity and editorial sup-port. Food editors should be targeted to con-tinue to raise the market profile and consumerawareness of the range of whiting products.Media efforts should be coordinated with in-

store or trade-show promotions to maximizetheir benefits.
A major constraint is tlnding a focused,single-purpose entity to carry forward thesemarketing strategies. In the last year, for in-stance, we have seen the demise of the Na-tional Seafood Promotion Council. More thanany indicator this has demonstrated the trendtowards national seafood promotion generally.
On regional or state levels, however, thingsare looking up. The Alaska Seafood MarketingInstitute has secured more than $8 million inUSDA marketing dollars to promote salmon inJapan, France, and the U.K. California has anew, industry-supported seafood council. Or-egon has attracted federal dollars for seafoodpromotional work in the EC and Japan but themoney must be spent on a variety of speciesand is not focused solely on whiting. In thesame way, the Oregon Trawl Commission doessome promotion of whiting, but it must alsopromote the other variety of products the trawlfleet harvests. A more focused approach to de-veloping markets for Pacific whiting should beexplored by fishermen and processors workingin concert
I want to make a few comments on brandedidentities and quality and grade standards forPacific whiting products. When discussingthese subjects, it is instructive to analyxe oneof the most successful examples of an inte-grated inspection, quality control, and brand-ing program for seafood-the Norwegianfarmed salmon.
The Norway example is a model for how todo it right. Because Norway is a small, homog-enous country with a rich socialist tradition ofworking together towards a common goal, theNorwegian salmon farmers were in an excel-
lent position to implement such a program.They instituted strict, government-controlled,quality guidelines that insured that only thefinest product they produced was shipped tomarket. They carried this program forwardwith serial lot controls, pack dates, size andproduct form, and processor establishmentnumbers on wholesale packaging. Gill tagswere placed on each fish, and point-of-sale ma-terials supported the product with the con-sumer. At the peak of their promotional efforts,as much as $25 million a year was spent byNorwegian salmon producers to maintain ex-isting markets and develop new ones. Farmersdispatched technical representatives to work inthe major wholesale markets throughout Eu-rope and Japan to answer questions of buyersand report back to the producers with qualitycontrol information.
It was a well-thought-out program that pro-pelled the Norwegian salmon industry tonearly 150,990 metric tons of production dur-ing their peak year of 1990. Since that timeNorway has fallen on hard times with morethan one-third of its product declaring bank-ruptcy in 1991. Other, larger market forces-such as increased harvest of wild salmon inAlaska and increased farm-raised fish fromChile-caused a collapse of the world salmonmarket and brought down with it the highlycapitalized salmon farms of Norway.
The important lesson is that even with awell-thought-out and well-executed productstandards program, linked perfectly with anaggressive promotional and merchandisingprogram, the vagaries of international seafoodmarkets can still wreak havoc. The producersof Pacific whiting can, however, profit from thelesson of Norway when developing standardsfor product inspection and branding.
81
PRODUCT CHARA-CS AND MARKETD- FOR PACIFIC WHITINGGilbert SylviaCoastal Oregon Marine Experiment Station
Gregory PetersDepartment of Bioresource Engineering, Oregon State University
INTRODUCTIONIndustry, state government, and fisheries man-agement agencies must develop fisheries-re-lated strategies that are in their individualand collective interests. For Pacific whiting(Pacific hake, Merluccius productus), this is aconsiderable challenge because of the difficultyin controlling product quality characteristics-characteristics which affect product marketdemand. Industry and government, therefore,must determine how their behavior affects cer-tain product characteristics, while also evalu-ating how product characteristics influenceproduction and management decisions.
For example, fisheries management agen-cies must decide how their regulations ulti-mately affect intrinsic (preharvest product)characteristics and extrinsic product character-istics (characteristics affected by harvest andpostharvest activities). In turn, fishermenmust negotiate contracts with processors anddevelop cost-effective harvesting and handlingpractices consistent with these contractual ar-rangements. Processors must select a portfolioof product forms and develop production strat-egies consistent with controlling risks and re-ducing variation in product quality. First re-ceivers must negotiate product quality warran-ties with processors and then develop sales andinventory strategies consistent with productquality limitations. State agencies must deter-mine the degree of industry support, includingpromotion and market development. And theindustry must collectively determine the de-gree to which it will assure product quality.
Industry and government agencies need dif-ferent types of information to make these deci-sions. The degree to which each industry sectorcould affect and control product characteristicsneeds to be understood. This informationwould be provided by fisheries biologists, foodtechnologists, and food engineers. Informationis also needed to help evaluate the degree towhich individual firms and agencies shouldcontrol product quality. This requires analysis
by economists, marketing specialists, businessmanagers, and policymakers.
!I’his second type of information can be bro-ken down into two categories: (1) informationshowing the relationship between productquality and production and management costs,and (2) market information showing the rela-tionship between product quality and marketdemand. Biological, technical, and economicinformation can then be combined within pro-duction and policy models to help industry andgovernment agencies make decisions aboutcontrolling product characteristics. These mod-els may range from simple spreadsheets torelatively complex bioeconomic policy models.
In this paper we summarixe the results of asurvey we undertook (Sylvia and Peters 1991)that was designed to provide one of the types ofinformation needed for making decisions aboutcontrolling product quality of Pacific whiting-the relationship between product characteris-tics and market demand. In the first section wereview issues related to market demand andproduct characteristics. In the second sectionwe summarize some of the results from themarket survey. We conclude with a briefdis-cussion of how industry and government sec-tors could use this information to optimallycontrol product characteristics.
ISSuESAFFRCTINGDRMANDMIRPACIFICWHITING
Many supply and demand factors have af-fected the development of markets for Pacificwhiting. These factors are (1) the supply of andprices for competitive whiting products andgroundfish species such as Atlantic cod @a&snwrhua) and Alaskan pollock (Theragmch&ogramma), (2) growth in world populationand national incomes, (3) improvement in sea-food technologies, and (4) political and institu-tional changes.
The development of many whiting fisherieshas occurred only during the last decade in re-sponse to rising prices for cod and cod substi-
82

tutes. These price incentives have motivatedwhiting industries to adopt improved seafoodtechnologies to cost effectively improve andstandardize product quality characteristics. Asa result, global whiting production has in-creased from 2.2 million metric tons WI!) in1982 to over 3 million MT in 1988 (Natural Re-sources Consultants 1990).
Individually, and as a group, whiting spe-cies (Merluccidae, Merluccius spp.) demon-strate wide variation in biological, geographi-cal, and product quality characteristics. Thewide range in characteristics is reflected by therange in prices received for different whitingstocks. For example, Antarctic queen(Merhxius austmlis), which is larger, firmer,and whiter than most other whitings, has beensold in Spain as a fresh, whole, unprocessedproduct for wholesale prices exceeding U.S.$10.00 per kg (L. Gaines, personal communica-tion). In contrast, Peruvian stocks of Chileanwhiting (Merluccius gayi peranus), which havefewer desired characteristics, including softflesh, small size, and an off-white color, maysell as a frozen headed and gutted (H&G) prod-uct in Europe and the United States for aslittle as U.S. $0.55 per kg. Most whiting spe-cies, however, fall between these two extremes.The differences in product characteristics isone reason that the whitings are processed intoa wide variety of product forms, includingwhole product, H&G, individual alets, and fro-zen fillet and minced blocks (which may be fur-ther processed into breaded sticks or portions).Some whiting may also be processed intosurimi (washed minced products).
While various factors have influenced differ-ential development of whiting fisheries, one ofthe primary factors has been intrinsic productcharacteristics. Whiting display great inter-and intravariation in product characteristics-characteristics which may be valued to differ-ent degrees by different markets. These char-acteristics include, but are not limited to, suchattributes as product size, texture, lipid compo-sition, parasite infestations, and levels of pro-tease enzymes (that is, enzymes which breakdown protein). For example, for most productforms, whiting between 1.5 and 3.0 pounds aremore highly valued on a per unit weight basisthan whiting which are smaller. This differen-tial demand is due to size-dependent texturecharacteristics, size-related processing yields,and consumer portion control.
One especially important intrinsic productcharacteristic is product texture. Many stocksnf whitinw hnvn R relnt,ivdv snfk tExlmrs that,
decreases their value relative to groundfish,which have a firmer texture. Not only does softtexture reduce consumer enjoyment, but whit-ing with sot% texture bruises more easily. Thisproblem has compelled fishermen and proces-sors to adopt techniques that reduce bruising,such as redesigning cod ends, reducing tows,and using wet pumps for off-loading.
In addition to shifts in market demand andimprovements in seafood technology, theglobalization of whiting markets has providedopportunities to fully exploit whiting across awide variety of product forms. Today, proces-sors have the option of either specializing in asingle product form or diversifying risks andprocessing a wider variety of products. A portcfolio of product forms allows processors to takeadvantage of changes in market conditions foralternative products or to match markets andproduct forms with inter- and intraseasonalvariation in intrinsic product characteristicssuch as product size, lipid composition, andtexture. This allows processors to comparemarket dynamics with information on supplyavailability and intrinsic product characteris-tics. Given their access to capital and theiraversion to various risks, processors can thendetermine the optimal mix of capital equipment for producing a range of product forms.
Although information on individual firm be-havior is generally not available, aggregate in-formation shows that individual whiting stocksare used proportionately more for certain typesof product forms. In general those species orstocks with excellent quality characteristics(for example, larger than two pounds; white-colored flesh; firm, flaky texture; relativelysmall fat layer; and few parasites) commandnot only the highest prices but tend to be usedmore as a fresh whole or fillet product forwhite tablecloth restaurants (especially in Eu-rope), or for retail as a relatively expensive andspecialized product For species which havegood quality characteristics, such as the Capehake, (Merluccius capensis, Merlucciuspamabz4s), the products may be used in awide variety of product forms, from fresh,whole product and fresh fillets to frozen filetblocks. Moderate to lower-quality whitings,such as Argentine whiting and North Pacificwhiting, are used for production of “commodityitems,” such as frozen blocks H&G or frozenfillet or minced blocks destined for further pro-cessing into battered and breaded productssold to food service, institutional, and retailsectors in Europe and the United States. In-creasimzlv. however. imnrovements in food
83
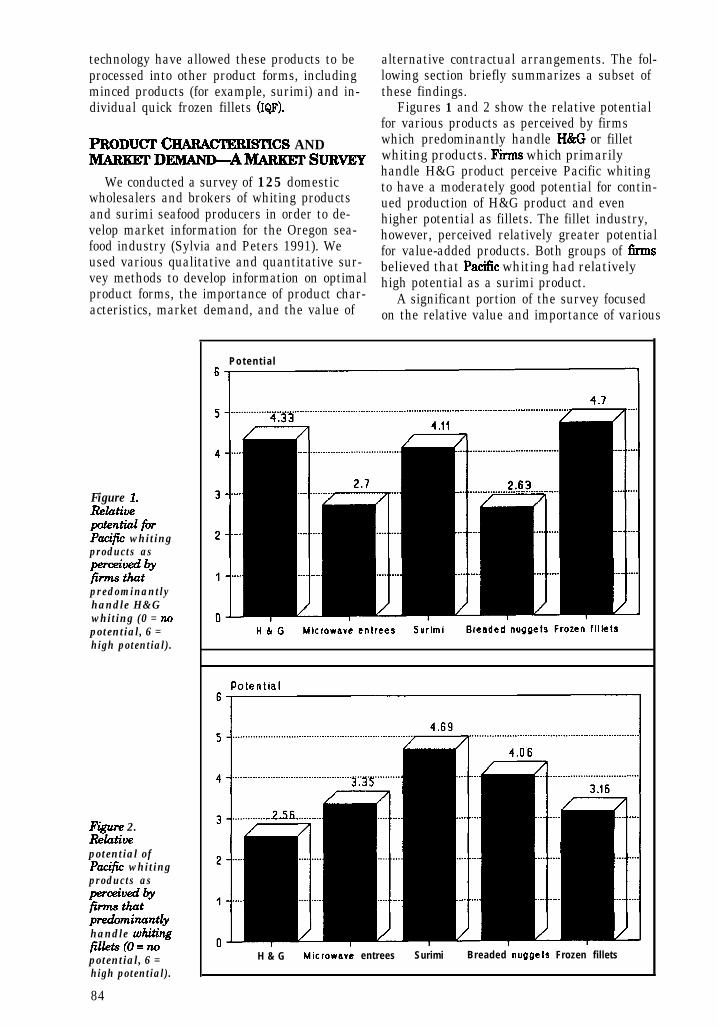
technology have allowed these products to beprocessed into other product forms, includingminced products (for example, surimi) and in-dividual quick frozen fillets (IQF).
l?RODUCl’ CHARA-CS AND-DEMAND-AMARI(GTSURVEY
We conducted a survey of 125 domesticwholesalers and brokers of whiting productsand surimi seafood producers in order to de-velop market information for the Oregon sea-food industry (Sylvia and Peters 1991). Weused various qualitative and quantitative sur-vey methods to develop information on optimalproduct forms, the importance of product char-acteristics, market demand, and the value of
alternative contractual arrangements. The fol-lowing section briefly summarizes a subset ofthese findings.
Figures 1 and 2 show the relative potentialfor various products as perceived by firmswhich predominantly handle H&G or filletwhiting products. Pirms which primarilyhandle H&G product perceive Pacific whitingto have a moderately good potential for contin-ued production of H&G product and evenhigher potential as fillets. The fillet industry,however, perceived relatively greater potentialfor value-added products. Both groups of Crmsbelieved that Patic whiting had relativelyhigh potential as a surimi product.
A significant portion of the survey focusedon the relative value and importance of various
Figure 1.Rf?lutivepotentiul jbrPacifm whitingproducts as
gZZEYypredominantlyhandle H&Gwhiting (0 = ?wpotential, 6 =high potential).
Fig-m 2.Relbtivepotential ofPacify whitingproducts as
$@z-zztbpredorninuntlyhandle whiting@lets(O=nopotential, 6 =high potential).
84
Poten t ia l
H & G Microwsve entrees Surimi Breaded nuggets Frozen fillets
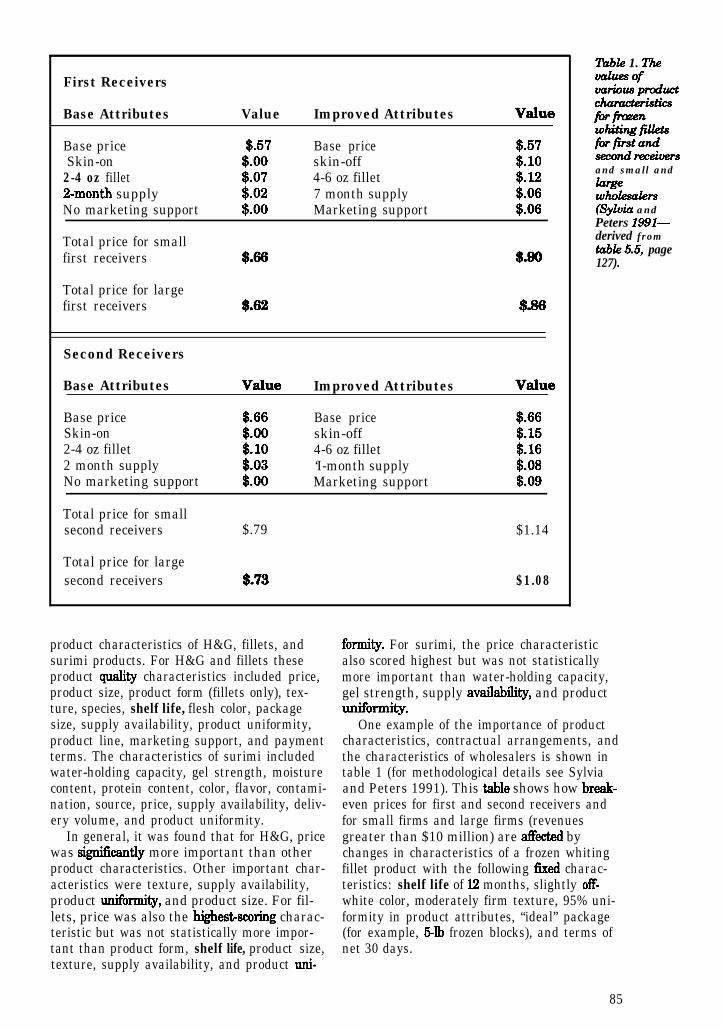
First Receivers
Base Attributes Value Improved Attributes Value
Base priceSkin-on2-4 oz fillet2-month supplyNo marketing support
Total price for smallfirst receivers
$57$.OO$.07$.02$.OO
$066
Base priceskin-off4-6 oz fillet7 month supplyMarketing support
$.57$.lO
:z$:06
$086
Total price for largefirst receivers $62 $86
Second Receivers
Base Attributes Value Improved Attributes Value
Base priceSkin-on2-4 oz fillet2 month supplyNo marketing support
$.66$90$.lO$.03$.OO
Base priceskin-off4-6 oz fillet‘I-month supplyMarketing support
$.66$.15$.16$.08$.09
Total price for smallsecond receivers $.79 $1.14
Total price for largesecond receivers $.73 $1.08
product characteristics of H&G, fillets, andsurimi products. For H&G and fillets theseproduct qnality characteristics included price,product size, product form (fillets only), tex-ture, species, shelf life, flesh color, packagesize, supply availability, product uniformity,product line, marketing support, and paymentterms. The characteristics of surimi includedwater-holding capacity, gel strength, moisturecontent, protein content, color, flavor, contami-nation, source, price, supply availability, deliv-ery volume, and product uniformity.
In general, it was found that for H&G, pricewas signiscantly more important than otherproduct characteristics. Other important char-acteristics were texture, supply availability,product uniformity, and product size. For fil-lets, price was also the highestrscoring charac-teristic but was not statistically more impor-tant than product form, shelf life, product size,texture, supply availability, and product nni-
Table 1. The&oftnwiouspduct-tics*fmzenWhitingjilL&tiFrSta&seco?ul&versand small andbeWhOlkd43-s(Sylviu andPeters 1991-derived fromtubk 5.5, page127).
form&y. For surimi, the price characteristicalso scored highest but was not statisticallymore important than water-holding capacity,gel strength, supply availability, and productUllifOtity.
One example of the importance of productcharacteristics, contractual arrangements, andthe characteristics of wholesalers is shown intable 1 (for methodological details see Sylviaand Peters 1991). This table shows how break-even prices for first and second receivers andfor small firms and large firms (revenuesgreater than $10 million) are a&cted bychanges in characteristics of a frozen whitingfillet product with the following f&d charac-teristics: shelf life of I2 months, slightly off-white color, moderately firm texture, 95% uni-formity in product attributes, “ideal” package(for example, 5lh frozen blocks), and terms ofnet 30 days.
85
Supplying a 4-6-02, skin-off fillet, sevenmonths a year, accompanied by marketingsupport, increases market price by $.24 overthe basic product. Large first receivers offer$.04 less than small first receivers in exchangefor larger purchase volumes. Second receiversoffer approximately 26% more at break-evenprices than first receivers and not only pay ahigher base price but offer a higher absolutepremium for improved attributes.
The information presented in table 1 is use-ful for developing long-run management andmarketing strategies. The information allowsprocessing firms to compare the costs and ben-efits of providing various sets of product at-tributes. Note, however, that some of thesecharacteristics (for example, fillet size and sup-ply availability) would be controlled by notonly the industry, but regulatory fisheriesagencies. Note also that improvements in prod-uct characters provide greater absolute andrelative value to second receivers, a result con-sistent with other survey findings, whichshowed that the further downstream thebuyer, the more important product qualitycharacteristics become. These findings raiseinteresting issues related to managing productquality, developing sales strategies, and in-creasing the profits of industry.
C O N C L U S I O N
Not all hake or whiting are created equal ortreated equally. As a result, market prices willshow signi&ant variation as a function ofproduct characteristics. Product characteristicsalso affect industry’s choice of product forms,level of capital investment, selection of qualitycontrol programs, nature of contractual ar-
rangements, and marketing and promotionalstrategies. The Pacific whiting industry mustdecide to what extent product quality cm becontrolled (by fishermen, processors, distribu-tors, consumers, regulatory agencies) and thendetermine how much it should be controlled
The type of information presented in thispaper can help the industry address this issueby showing the relationship between productcharacteristics and market demand. !I’his infor-mation can then be combined with cost data,biological information, and information on foodtechnology and food engineering to explore is-sues ranging from developing profit-driven,quality assurance standards to determininghow fisheries regulatory policy affects marketopportunities and the benefits of regional andnational fisheries. Integrating market informa-tion with other elements is one important steptoward improving our understanding andmanagement of the Pacific whiting fishery.
REFERENCESGaines, L. 1991. Observed prices in the Madrid
wholesale seafood market. Personal commu-nication. Con&is, OR.
Natural Resources Consultants. 1990. Areview and analysis of global hake andwhiting resources, harvests, products, andmarkets. Oregon Coastal Zone ManagementAssociation, Newport, OR
Sylvia, G. and G. Peters. 1991. Market oppor-tunities for Pacific whiting. Oregon CoastalZone Management Association, Newport,OR
86
PANEL DISCUSSIONON -GOFPACIFICWHITINGSession leader: Ann ShFiVeF. Panel members: Joseph Zalke, Ichiro Kane, Dalton Hobbs, GilbertSylviu
Q: (Session leader) Please describe what theU.S. and global surimi seafood market willlook like five years from now.
A: Each panel member responded separately tothis question. Joseph Zalke responded thatsurimi is more of an ingredient in foods than acommodity in and of itself. As a commodity,surimi-based seafood has reached a peak, butthere is potential for expansion in nichemarkets. For example, Mexican food is growingin popularity. There is potential for the use ofsurimi-based products in that area. Gil Sylviaadded that more species would be used world-wide, reductions would be made in salt andsugar additives to answer consumer reserva-tions about the healthfulness of surimi, and alarger variety of products and ingredientswould be developed. Dalton Hobbs commentedthat additional segmentation of the marketwould probably occur, focusing on, for example,the institutional food sector and take-out anddeli type of outlets. The new variety in prod-ucts will support the development of thesemarket segments. Ichiro Kano warned thatsurimi markets will grow at a very slow pacewith some ups and downs; probably no marketbreakthrough will be experienced.
8: What are the current labelling require-ments for surimi-based products?
A: Chuck Herrick, another audience member,answered that you are permitted to use theterm surimi which must be followed in paren-theses by the ingredients of the surimi, or youmay simply list the ingredients of the surimi.Jae Park followed up from the audience toclarify that the use of the term surimi by itselfis not permitted; you must list the ingredients,including the species of fish used. Zalke addedthat the National Fisheries Institute @WI) isworking with the U.S. Food and Drug Admin-istration to get the nomenclature approved sothat surimi can be used by itself. He stressedthat it was important to get rid of the concept
of surimi as “imitation” food and to have itaccepted in its own right Park pointed outthat the U.S. is the only country where surimiis stigmatized this way. Another audiencemember mentioned that if you blend differentspecies, you must give the percentage of eachspecies used. Gil Sylvia asked why you couldn’tjust list several options, as is done in labellingfrozen packages of fish sticks or breadedportions.
Q: (Session leader) Where is the promotiondollar best spent? msays that its constituentsdo not support generic promotion if they haveto pay for it. Is this smart?
A: Each panel member responded separately tothis question. Zalke responded that the ques-tion is very complex and difficult to rationalize.NFIresembles a political organization repre-senting many diverse factions, includingregional interests, importers, domestic marketproducers, and shrimp, halibut, salmon andother species, among others. The “seafood”producer does not produce a homogeneousproduct as, for example, the poultry industrydoes. How do you get salmon producers toagree to support the surimi committee? Thisexplains the limited budgets and willingness tocontribute to promotional campaigns. Thereare also personal and business egos whichwant the market to be more brand oriented, sothat is where the advertising dollar goes. Fromhis perspective, however, it would be good tocontinue a generic “eat seafood” campaign.
Gil Sylvia added that sometimes the currentaverage level of seafood consumption-15pounds per person per year-is viewed as anupper bound. The seafood industry worriesthat one segment’s gain would be another’sloss. In fact what must be done is that the 15-pound limit must be pushed up as a whole,enlarging the pie so that all different kinds ofseafood producers will have a larger share. Theconsumer needs to be educated that seafood is
87
healthy, easy to prepare, and tastes good; thisalso argues for more generic advertising.
Dalton Hobbs gave the Oregon perspective,mentioning that this state has a tradition ofgeneric promotion. The same problem existsbetween, for example, advertising for cheeseand milk as does between shrimp and flatfish.He agreed with Sylvia that the fundamentalproblem is that we do not consume enoughseafood. This was seconded by Kano, whopointed out that compared to seafood consump-tion in Asian countries, 15 pounds is not much.Promotion should be used to counter this limit.
From the audience, Joe Easley of the OtterTrawl Commission revealed the results ofsome polls the commission has undertaken inthis state. The polls revealed much ignoranceon the part of the public. Most of the informa-tion the consumer gets about seafood comesfrom the server behind the seafood counter,and these people are sometimes woefullyignorant. Training and educating handlers ofseafood so that they in turn can educate thepublic should be a priority. Safeway hasstarted a training program using a videotapeout of a manual developed by Easley’s organi-zation; if you can’t get to the level of themarket chain which is selling to the finalconsumer, then your advertising is worthless.
&: (Session leader) Does fresh surimi havemarket potential?
A: Park replied that the Japanese used surimiin that form until the 196Os, when they beganto add sugars as preservatives to extendsurimi’s shelf life and began to be able toextend frozen storage times as well. For Pacificwhiting, the fresh form is a good idea; it canenhance quality and reduce the need foradditives. Having fewer additives would makeit easier to improve the percentage of proteinin the final product.
Zalke demurred, emphasixing that the eco-nomics of a fresh product as an input to beused in large quantities would have to bestudied. Sylvia mentioned that they hadaddressed this issue in their marketing survey.From the surimi industry’s perspective, havinga limited supply is a problem, and shrinkage isa problem. He asked a question of his own: Ismarket research on fresh surimi needed?
One audience member argued that concernover additives such as salt and sugar is not amajor issue to 90% of consumers. !I’his wouldindicate that the interest in a fresh surimiproduct would be very limited. Another pointedout that given the level of processing done tosurimi products, froxen or not, they couldnever be labelled “fresh,” and therefore anymarketing advantage would be lost. Theincreased cost of using a nonfroxen surimiproduct would not be justified in an increasedprice in the final product.
88

Biology and Management


Mark E. WilkinsNatimal Marine Fisheries Service, Seattle, WA
INTRODUCTIONPacific whiting, Merhxius productus, is cur-rently the most abundant commercially har-vested groundfish off the Pacific coast of Cali-fornia, Oregon, and Washington. It is a codlikespecies found over the continental shelf andslope from southern Baja California in Mexicoto the Queen Charlotte Islands in Canada. Theexploitation of the coastal stock of Pacific whit-ing was developed by foreign fishing fleets be-ginning in the mid-1960s. Through joint ven-tures with foreign processors and recent im-provements in processing technology and inno-vative products, the U.S. industry is increasingits domestic exploitation of this species. Thisreview will discuss the basic characteristics ofthe biology, life history, distribution, and abun-dance trends of Pacific whiting. Biological con-straints on the development and stability ofthe fishery will also be discussed. Other re-views of the biology of Pacific whiting havebeen reported by StaufTer (19851, Bailey et al.(19821, and Francis (1983).
BIOLOGY AND LIFE mn>RYWithin its range, Pacific whiting consists of
four reproductively isolated stocks. The majorstock, and the one to which I will limit my re-marks, is the coastal stock found off centralBaja California (27’N lat.) to the Queen Char-lotte Islands (52“N lat.).
Male and female Pacific whiting both ma-ture at a length of approximately 40 cm, whenthey weigh about 0.4 kg (StaufTer 1985). Thismeans that some three-year-old fish and mostfour-year-old fish are mature. Fecundity ap-pears to be approximately 200 eggs per gram offemale body weight (MacGregor 1966).
Pacific whiting spawn from Decemberthrough April, with peak spawning occurringduring January and February. Spawning takesplace in the southern end of their range, be-tween Baja California and San Francisco. Ob-served spawning concentrations of whiting arescat&redsparselv_throu&out a wide expanse of ocean.
Spawning occurs as far as 400km off the coast in dense, well-defined aggregationsbetween 100 and 400 m below the surface.
Pacific whiting undertake a significant an-nual migration from their spawning grounds inthe area between Baja Califomia and SanFrancisco to their feeding grounds off Oregon,Washington, and British Columbia (Bailey etal. 1982) (figure 1). They arrive over the conti-nental slope off the coast of Oregon and Wash-ington by the third week in April and offVancouver Island by late May, travelhng aboutthree to six nautical miles per day (Stauffer1985). The fish move onto the shelf in Juneand remain in these feeding grounds until falLWhiting stratify by length, age, and sex alongthe coast Older, larger fish migrate farthernorth, and females, because they grow to alarger size, dominate the earlier arrivals andmore northerly residents of the summer feed-ing grounds. Whiting also exhibit a diurnalvertical migration, apparently in pursuit oftheir main prey, euphausiids. At dusk whitingascend to the top 20 m, returning abruptly to100250 m at dawn.
Ages of Pacific whiting are determined fromannual rings on the surfaces and cross sectionsof their otoliths. The surface ageing methodhas been found to be accurate through age 11,by which time most growth has been com-pleted (Dark 1975; Beamish 1979). Whitingcomplete about 75% of their growth in lengthand 50% of their growth in weight by 4.5 yearsof age. Following maturation, females outpacemales and grow to an average maximum sizeof 61 cm (1.3 kg) while males grow to onlyabout 56 cm ( 1.0 kg) (figure 2).
Pacific whiting feed primarily on euphausi-ids and fish. They also eat shrimp and squid.Apparently little or no feeding takes place dur-ing their winter spawning. The diet of largerwhiting includes a higher proportion of fish,including smaller whiting, sand lance, Pacificherring, and deep-sea smelt (Livingston andBailey 1985). Within a season, whiting gainweight on the feeding grounds and lose weightduring migration and spawning.
91

Figure 1. Migmtorypatterns of Pacificwhiting (fromBailey et aL 1982).
Figure 2. Pa+whiting meankngth and weightatagebysez
c VANCOUVER
c COLUMBIA
YINTER
VJE
c MONTEREY
riratirtg onshore over slope ’ -’in California oumnt (south) \ \--__w BBS
Spawning
F-ding
Main Bchooling-I
Length (cm) Weight (kg)
6 0 -
5 0 -
40 -
3 0 -
2 0 -
lo-
nu
1.5
51” 3oN
4P3(r
43030
390 30’
350 30’
31’ 30’
2P3ll
- Female length
D --I- Male length1 2 3 4 5 6 7 8 91011121314 I:: Female weight
Age (years) Q Male weight
92
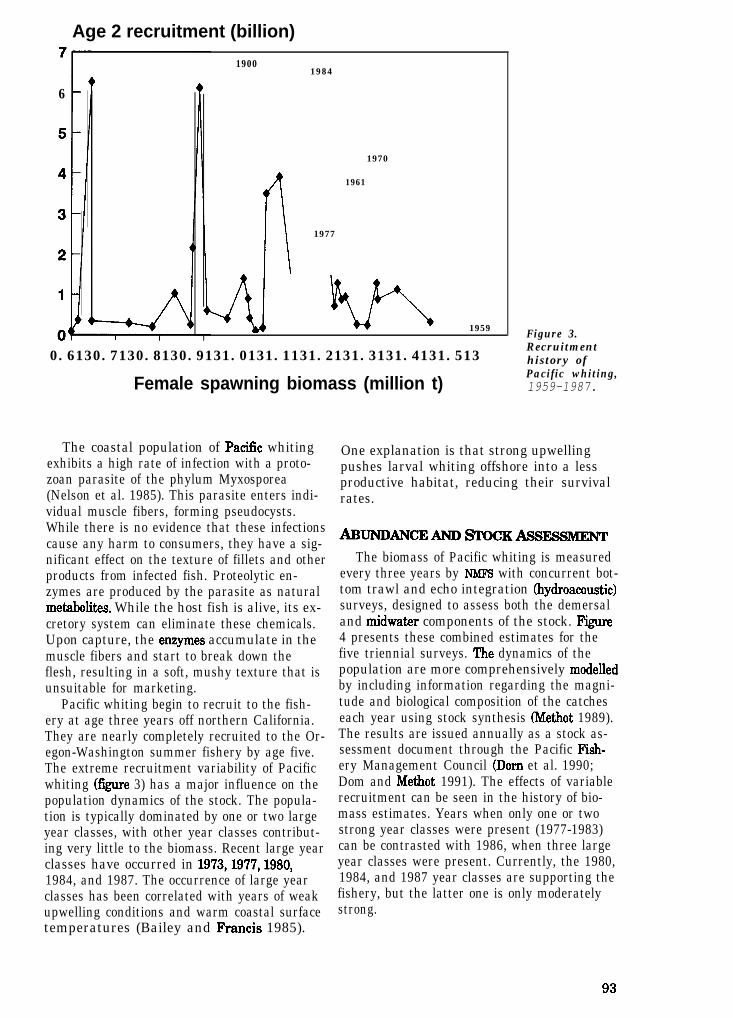
Age 2 recruitment (billion)
6
19001984
1970
1 1961
1977
4 w 1959
0.6130.7130.8130.9131.0131.1131.2131.3131.4131.513
Female spawning biomass (million t)
The coastal population of Pacific whitingexhibits a high rate of infection with a proto-zoan parasite of the phylum Myxosporea(Nelson et al. 1985). This parasite enters indi-vidual muscle fibers, forming pseudocysts.While there is no evidence that these infectionscause any harm to consumers, they have a sig-nificant effect on the texture of fillets and otherproducts from infected fish. Proteolytic en-zymes are produced by the parasite as naturalmetabolites. While the host fish is alive, its ex-cretory system can eliminate these chemicals.Upon capture, the enzymes accumulate in themuscle fibers and start to break down theflesh, resulting in a soft, mushy texture that isunsuitable for marketing.
Pacific whiting begin to recruit to the fish-ery at age three years off northern California.They are nearly completely recruited to the Or-egon-Washington summer fishery by age five.The extreme recruitment variability of Pacificwhiting &ure 3) has a major influence on thepopulation dynamics of the stock. The popula-tion is typically dominated by one or two largeyear classes, with other year classes contribut-ing very little to the biomass. Recent large yearclasses have occurred in 1973,1977,1980,1984, and 1987. The occurrence of large yearclasses has been correlated with years of weakupwelling conditions and warm coastal surfacetemperatures (Bailey and Prancis 1985).
Figure 3.Recruitmenthistory ofPacific whiting,1959-1987.
One explanation is that strong upwellingpushes larval whiting offshore into a lessproductive habitat, reducing their survivalrates.
&HJNDANCEAND~T~CKASSESSMENTThe biomass of Pacific whiting is measured
every three years by NMFS with concurrent bot-tom trawl and echo integration (hydroacoustic)surveys, designed to assess both the demersaland midwater components of the stock. F’igure4 presents these combined estimates for thefive triennial surveys. The dynamics of thepopulation are more comprehensively modelledby including information regarding the magni-tude and biological composition of the catcheseach year using stock synthesis (Methot 1989).The results are issued annually as a stock as-sessment document through the Pacific F’ish-ery Management Council (Dam et al. 1990;Dom and Methot 1991). The effects of variablerecruitment can be seen in the history of bio-mass estimates. Years when only one or twostrong year classes were present (1977-1983)can be contrasted with 1986, when three largeyear classes were present. Currently, the 1980,1984, and 1987 year classes are supporting thefishery, but the latter one is only moderatelystrong.
93

Figure 4. Pacificwhiting meurchsurvqy biomassestinuztex by year andINPlK! are+
Biomass (1,000 metric tons)
25001
1977 1980 1983 1986 1989
Year
IMPLICATIONS FOR FISHERYDEVELOPMENTANDSTABILITY
The three most critical biological character-istics, in terms of the ability of the coastal Pa-cific whiting population to sustain a fishery,are (1) its annual migratory pattern, (2) itshigh rate of parasite infection, and (3) its ex-treme recruitment variability. Since largerfish, and consequently females of an age class,arrive in the area of the fishery earlier thanthe males and stay longer before migratingback to the south, the availability of certaincomponents of the stock vary with the timingand location of fishing. For example, a fisheryoccurring in the INFFC Monterey area wouldcatch mostly immature fish. Such differentialvulnerability can contribute to the instabilityof the population.
The marketing problems caused by the Pa-cific whitings parasitic infection have been animpediment to fishery development in thepast, but appear to have been overcome withinnovative products and processing.
The “boom or bust” nature of Pacific whitingrecruitment seems to be the most difficultproblem facing the development of this re-source. The dependence on strong year classesfor the yields from the population means thatthe long-term stability of the yields is alwaysin doubt Because of a lack of strong recruitment since 1984, the current age structure ofthe fishable Paci6c whiting population is rela-
Cl Can. Vancouver
RI U.S. Vancouver
0 Columbia
Eureka
0 Monterey
tively old. If recruitment continues near aver-age levels, the outlook for the immediate fu-ture is for a continuing slow decline in the an-nual yield. Recruitment of a strong year classwould substantially increase the projectedyields.
REFERENCESBailey, KM., FL Francis, and P. Stevens. 1982.
The life history and fishery of Pacific hake,Merhxiusprodudus. CalX Coop. OceanicFish. Invest. Rep. 23:81-92.
Bailey, KM., and KC. Francis. 1965. Recruitment of Pacific whiting, Merl u&usproductus, and the environment Mar. Fish.Rev. 47(2):8-15.
Beamish, R.J. 1979. Differences in the age ofPacific hake (Merlucciuspmductus) usingwhole otoliths and sections of otoliths. J.Fish. Res. Board Can. 36:141-151.
Dark, T.A 1975. Age and growth of Pa&chake, Merhuxiuspraltlctus. Fish. Bull.,U.S. 73:336-355.
Dom, M.W., and R.D. Methot. 1991. Status ofthe coastal Pacific whiting resource in 1991.Appendix A in Status of the Pa&% coastgroundfish fishery through 1991 and
94

recommended acceptable biological catchesfor 1992. Pac. Fish. Manage. Council, 44 p.
Dom, M.W., RD. Methot, E.P. Nunnallee, andM.E. Wilkins. 1990. Status of the coastalPacific whiting resource in 1990. NOAATech. Memo. NMFS F/NWC-204,97 p.
Francis, RC. 1983. The population and trophicdynamics of the Pacific hake, Merluxxiusproductus. Can. J. Fish. Aquat Sci. 40:1925-1943.
Livingston, PA, and KM Bailey. 1985.Trophic role of the Pacific whiting,Merhxius productus. Mar. Fish. Rev.47(2):16-22.
MacGregor, J.S. 1966. Fecundity of the Pacifichake, Merluccius pmdudus. Calif. FishGame 52:111-116.
Methot, RD. 1989. Synthetic estimates ofhistorical abundance and mortality fornorthern anchovy. Pages 66-82 in E.F.Edwards and BA Megrey (editors), Math-ematical analysis of fish stock dynamics.Am. Fish. Sot. Symp. 6.
Nelson, R.W., H.J. Barnett, and G. Kudo. 1985.Preservation and processing characteristicsof Pacific whiting, Merluccius produdus.Mar. Fish. Rev. 47(2):60-74.
Stauffer, G.D. 1985. Biology and life history ofthe coastal stock of Pacific whiting,Merlucciuspmluctus. Mar. Fish. Rev.47(2):2-7.
Discussion&: (Barry Fisher, from the audience) Yourpresentation seems to indicate that the varia-tion in the population of whiting is not exclu-sively due to overfishing. Has research on theircannibalistic pattern indicated anything aboutmanagement methods?
A: (Wilkins) The cannibalistic nature of thefish means that a large year class will eat moremembers of a younger year class, making thepopulation of the younger year class lower. Thecannibalistic pattern is partly mitigated by thestrati5cation of the species [tendency ofdifferent year classes to feed in differentplaces], so the cannibalistic pattern is not adominant part of their predation. Therefore,there would be no strong reason to basemanagement strategies on this factor.
&: Does the spawning pattern of whiting makethem susceptible to fishing pressure?
A: (Wilkins) As fishing has not been permittedin the spawning areas, this hasn’t been aproblem.
&: What environmental conditions favorrecruitment? Do these conditions affect sur-vival at spawning or later? Could you clarifythe spawning pattern?
A: (Wilkins) Years when there are low upwelling or El Niiio conditions are high recruit+ment years. These environmental conditionsaffect the fish at spawning. During April,spawning fish are off the Northern Californiashew, they move farther north in May or June.
95
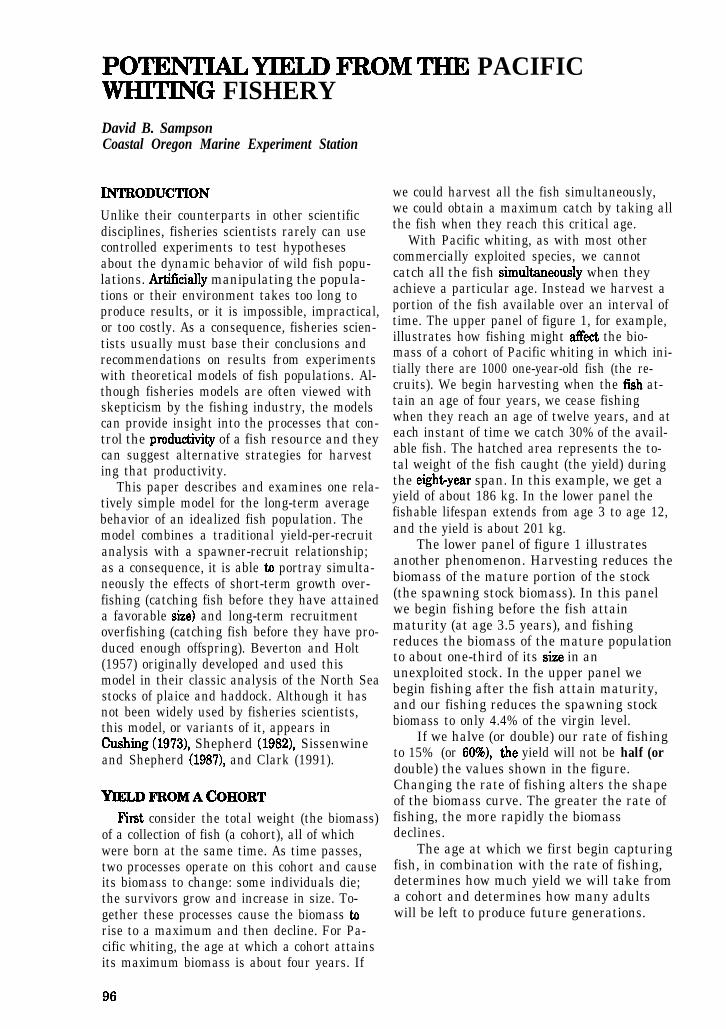
POTENTIALYIELD FROMTHE PACIFICWHITING FISHERYDavid B. SampsonCoastal Oregon Marine Experiment Station
INTRODUCTIONUnlike their counterparts in other scientificdisciplines, fisheries scientists rarely can usecontrolled experiments to test hypothesesabout the dynamic behavior of wild fish popu-lations. Arti&ially manipulating the popula-tions or their environment takes too long toproduce results, or it is impossible, impractical,or too costly. As a consequence, fisheries scien-tists usually must base their conclusions andrecommendations on results from experimentswith theoretical models of fish populations. Al-though fisheries models are often viewed withskepticism by the fishing industry, the modelscan provide insight into the processes that con-trol the productivity of a fish resource and theycan suggest alternative strategies for harvesting that productivity.
This paper describes and examines one rela-tively simple model for the long-term averagebehavior of an idealized fish population. Themodel combines a traditional yield-per-recruitanalysis with a spawner-recruit relationship;as a consequence, it is able to portray simulta-neously the effects of short-term growth over-fishing (catching fish before they have attaineda favorable size) and long-term recruitmentoverfishing (catching fish before they have pro-duced enough offspring). Beverton and Holt(1957) originally developed and used thismodel in their classic analysis of the North Seastocks of plaice and haddock. Although it hasnot been widely used by fisheries scientists,this model, or variants of it, appears inGushing (19731, Shepherd (19821, Sissenwineand Shepherd (19871, and Clark (1991).
First consider the total weight (the biomass)of a collection of fish (a cohort), all of whichwere born at the same time. As time passes,two processes operate on this cohort and causeits biomass to change: some individuals die;the survivors grow and increase in size. To-gether these processes cause the biomass torise to a maximum and then decline. For Pa-cific whiting, the age at which a cohort attainsits maximum biomass is about four years. If
we could harvest all the fish simultaneously,we could obtain a maximum catch by taking allthe fish when they reach this critical age.
With Pacific whiting, as with most othercommercially exploited species, we cannotcatch all the fish simult.aneously when theyachieve a particular age. Instead we harvest aportion of the fish available over an interval oftime. The upper panel of figure 1, for example,illustrates how fishing might affect the bio-mass of a cohort of Pacific whiting in which ini-tially there are 1000 one-year-old fish (the re-cruits). We begin harvesting when the f5sh at-tain an age of four years, we cease fishingwhen they reach an age of twelve years, and ateach instant of time we catch 30% of the avail-able fish. The hatched area represents the to-tal weight of the fish caught (the yield) duringthe eightyear span. In this example, we get ayield of about 186 kg. In the lower panel thefishable lifespan extends from age 3 to age 12,and the yield is about 201 kg.
The lower panel of figure 1 illustratesanother phenomenon. Harvesting reduces thebiomass of the mature portion of the stock(the spawning stock biomass). In this panelwe begin fishing before the fish attainmaturity (at age 3.5 years), and fishingreduces the biomass of the mature populationto about one-third of its size in anunexploited stock. In the upper panel webegin fishing after the fish attain maturity,and our fishing reduces the spawning stockbiomass to only 4.4% of the virgin level.
If we halve (or double) our rate of fishingto 15% (or 60%), the yield will not be half (ordouble) the values shown in the figure.Changing the rate of fishing alters the shapeof the biomass curve. The greater the rate offishing, the more rapidly the biomassdeclines.
The age at which we first begin capturingfish, in combination with the rate of fishing,determines how much yield we will take froma cohort and determines how many adultswill be left to produce future generations.
96
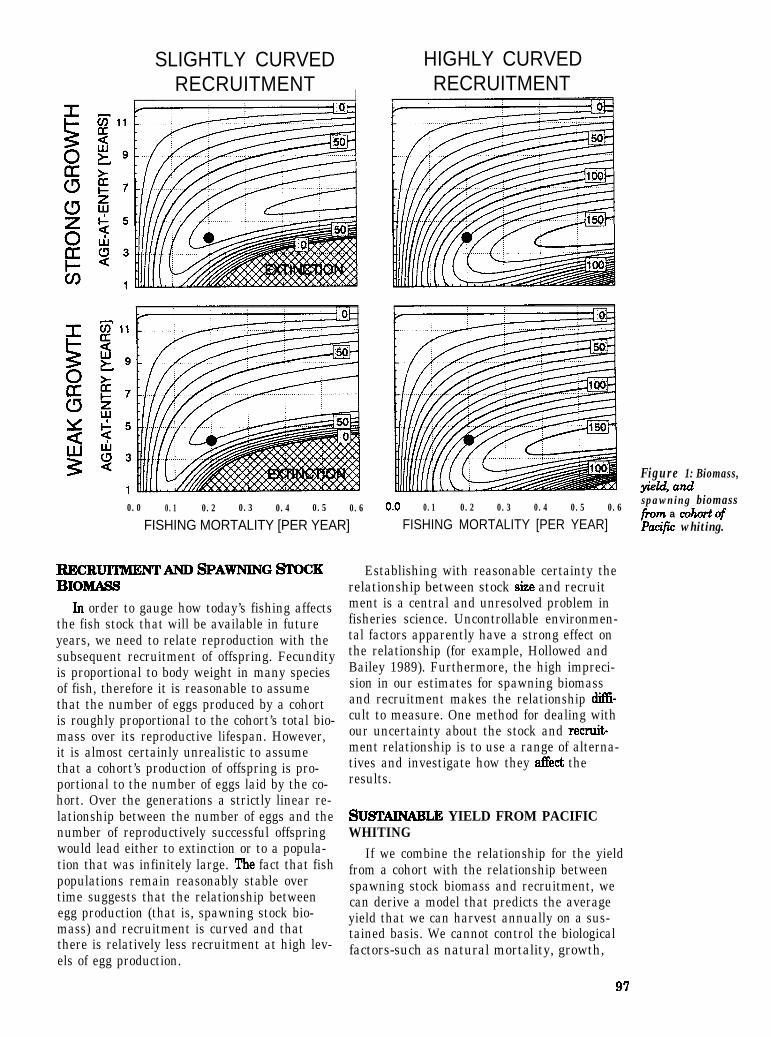
SLIGHTLY CURVEDRECRUITMENT I
HIGHLY CURVEDRECRUITMENT
0.0 0.1 0.2 0.3 0.4 0.5 0.6FISHING MORTALITY [PER YEAR]
lucmmmwmspAwNIN~STocKBIOMASS
In order to gauge how today’s fishing affectsthe fish stock that will be available in futureyears, we need to relate reproduction with thesubsequent recruitment of offspring. Fecundityis proportional to body weight in many speciesof fish, therefore it is reasonable to assumethat the number of eggs produced by a cohortis roughly proportional to the cohort’s total bio-mass over its reproductive lifespan. However,it is almost certainly unrealistic to assumethat a cohort’s production of offspring is pro-portional to the number of eggs laid by the co-hort. Over the generations a strictly linear re-lationship between the number of eggs and thenumber of reproductively successful offspringwould lead either to extinction or to a popula-tion that was infinitely large. The fact that fishpopulations remain reasonably stable overtime suggests that the relationship betweenegg production (that is, spawning stock bio-mass) and recruitment is curved and thatthere is relatively less recruitment at high lev-els of egg production.
0.0 0.1 0.2 0.3 0.4 0.5 0.6FISHING MORTALITY [PER YEAR]
Establishing with reasonable certainty therelationship between stock size and recruitment is a central and unresolved problem infisheries science. Uncontrollable environmen-tal factors apparently have a strong effect onthe relationship (for example, Hollowed andBailey 1989). Furthermore, the high impreci-sion in our estimates for spawning biomassand recruitment makes the relationship difl%cult to measure. One method for dealing withour uncertainty about the stock and recruitment relationship is to use a range of alterna-tives and investigate how they affect theresults.
SUSTAINABLE YIELD FROM PACIFICWHITING
If we combine the relationship for the yieldfrom a cohort with the relationship betweenspawning stock biomass and recruitment, wecan derive a model that predicts the averageyield that we can harvest annually on a sus-tained basis. We cannot control the biologicalfactors-such as natural mortality, growth,
Figure 1: Biomass,yield adspawning biomassfivrn a cohort ofPa.@ whiting.
97
Figure2:Thegrowth clvues andrecruitmentrelationships thatpmduce thesustuinable yieldrelationshipsshown in figure 3.
STRONG GROWTH WEAK GROWTH
0.01. ’ ’ 0 ’ 0 1 ’2 4 6 6 10 12 14
AGE WEARS]
HIGHLY CURVED
0 200 400 600 600 1000 1200 1400SPAWNING BIOMASS [lOOOs TONS]
and the recruitment relationshiI.+that deter-mine the sustainable yield. However, we canmanipulate the rate of fishing (the fishing mor-tality) and the age at which fish are first har-vested (the age-at-entry). The objective in ap-plying this type of model to the stock of Pacificwhiting is to evaluate whether there are com-binations of fishing mortality and age-at-entrythat will produce larger yields or that willmore economically produce a given yield.
Previous studies of Pacific whiting have es-tablished that cohorts born in different yearssometimes follow separate growth schedules(Hollowed, Methot, and Dom 1988; Dom andMethot 1989). In order to see how differencesin growth affect the potential yield of Pacificwhiting, we can compare the results derivedfrom two growth schedules, one for stronggrowth and one for weak growth (shown in theupper panels of figure 2).
Over the observed range of values forspawning biomass, researchers have been un-able to detect any clear relationship betweenspawning stock biomass and recruitment(Dam et al. 1990). This may be due to the scar-98
2 4 6 6 10 12 14
AGE [YEARS]
VIRGIN LEVEL
0 200 400 600 600 100012001400SPAWNING BIOMASS [l 000s TONS]
city and high degree of variability in the data.Alternatively, the absence of a pattern sug-gests that the relationship may be like thehighly curved ones shown in the lower panelsof figure 2. In those relationships there is littlechange in the average number of recruits pro-duced by levels of spawning biomass greaterthan 500,000 metric tons. In order to see howdifferences in the recruitment relationship af-feet potential yield, we can compare the resultsfrom two sets of recruitment relationships, onethat is highly curved and one that is onlyslightly curved (shown in the lower panels offigure 2). Different curves apply, depending onwhether growth is strong or weak. In order tokeep the relationships on the same relativescale, we must choose the recruitment curvesso that for an unexploited stock they all pro-duce the same spawning biomass.
Figure 3 shows how potential yield varieswith fishing mortality and age-at-entry for thedifferent combinations of growth and recruit-ment. The contour lines trace out the combina-tions of fishing mortality and age-at-entry thaton average produce a particular annual yield.

The large dot on each graph represents thecurrent position for the Pacific whiting fishery;the rate of fishing is about 20?6, and fish arefirst vulnerable to capture at about four yearsof age. In the hatched regions, in the lowerright portion of each panel, the rate of remov-als by the fishery exceeds the stock’s biologicalproductivity, and extinction results.
If we compare the upper and lower panels,we can see that changes in growth do not havemuch effect on the sustainable yield of Pacificwhiting. However, if we compare the panels onthe left with those on the right, we can see thatthe amount of curvature in the recruitmentrelationship has a pronounced effect For ex-ample, if growth is strong and the recruitmentrelationship is only slightly curved (shown inthe upper left panel), the current fishing stratiegy (indicatedby the largedot) produces asustainableyield of about84,099 metrictons per year.However, if therecruitmentrelationship ishighly curved(shown in theupper rightpanel), the cur-rent strategyproduces a sus-tainable yieldof about119,009 metrictons per year.
Ifthe truerelationshipbetweenspawning stockbiomass andrecruitment isthe slightlycurved one,then the cur-rent 20% rateof fishing isvery near thelevel that pro-duces themaximum sus-tainable yieldfor an age-at-entry of fouryears. We
r250
2 4 6 8 10 12 14
AGE WRS]
250t
_/. ..--..._: *..*
**._ F = 0.30 / yr, te = 3 yrs I
YIELD = 201.1 kg
SSB = 33% of Virgin
2 4 6 8 10 12 14 year)fromaAGE [YEARS] Fhery fir pa+
Whihg.
could achieve a modest increase in yield by in-creasing the rate of fishing to about 35% if wecoupled this with an increase in the age-at-en-try to about 5.5 years. Note that if we increasethe rate of fishing without raising the age-atentry, then the sustainable yield will decrease!If the true recruitment relationship is thehighly curved one, however, then we are cur-rently underf%ing this stock. By doubling ourrate of fishing, we could significantly increasethe annual yield.
The appendix gives the full details of theparameters and equations of the model for thepotential yield of Pa&c whiting.
F = 0.30 / yr, te = 4 yrs
YIELD = 186.3 kg
UNEXPLOITED
Figure3:contoun? ofsustainuble yield(thousands ofmetrictQnspr
99
DISCUSSION
Most fishermen and fisheries managers arefamiliar with the concept of maximum sustain-able yield (MSY, the largest average rate ofcatch that can be taken on a sustained basis).However, they are probably unaware thatMSY varies with the age-at-entry. For ex-ample, examine the upper left panel of figure3. The lowest point on each contour line repre-sents a combination of age-at-entry and fishingmortality that produces an MSY. For an age-at-entry of two years, we obtain an MSY ofabout 70,000 metric tons per year with a fish-ing mortality rate of just over 0.1 per year. Ifwe increase the age-at-entry to 5.5 years, wecan obtain an MSY of about 90,000 tons peryear with a fishing mortality rate of about 0.36per year.
Figure 3 also illustrates that we can lessenthe risk of causing a year-class failure if wemake the age-atentry large enough to allowyoung fish to spawn. Pacific whiting reach ma-turity at about 3.5 years of age. If we regulatethe age-atentry in the whiting fishery to be 5years or greater, then even extremely highrates of fishing will not reduce the spawningbiomass to dangerously low levels. With Pacificwhiting it should be possible to manipulate theage-at-entry with mesh-size regulations orwith time and area closures.
The greatest uncertainty about how muchPacific whiting we can take on a sustained ba-sis lies in the shape of the recruitment rela-tionship. If we gamble that the relationship ishighly curved and then increase the rate offishing, we will attain higher yields if we arecorrect and lower yields if we are wrong. Withour current policy and its conservative fishingrate, it will take a very long time to collectenough information to establish the recruit-ment relationship. Perhaps we should adopt apolicy of deliberate overfishing for a few yearsso that we can determine more accurately theshape of the recruitment relationship.
Ministry of Agriculture, Fisheries and Food,Fishery Invest. Ser.2, Vol.19: 533 p. HMSO,London.
Clark, W.G. 1991. Ground&h exploitationrates based on life history parameters. Can.J. Fish. Aquat. Sci. 48:734-750.
Cushing, D.H. 1973. The dependence ofrecruitment on parent stock. J. Fish. Res.Bd. Can. 30:1965-1976.
Dom, M. and R. Methot 1989. Status of thePacific whiting resource in 1989 and recom-mendations to management in 1990.Appendix A in Status of the Pacific coastgroundfish fishery through 1989 andrecommended acceptable biological catchesfor 1990. Pacific Fishery ManagementCouncil.
Dom, M.W., RD. Methot, E.P. Nunnallee, andM.E. Wilkins. 1990. Status of the coastalPacific whiting resource in 1990. AppendixA in Status of the Pacific coast groundfishfishery through 1990 and recommendedacceptable biological catches for 1991.Pacific Fishery Management Council.
Hollowed, AB., R Methot, and M. Dom. 1988.Status of the Pacific whiting resource in1988 and recommendations to managementin 1989. Appendix A in Status of the Pacificcoast groundflsh fishery through 1988 andrecommended acceptable biological catchesfor 1989. Pacific Fishery ManagementCouncil.
Hollowed, AB. and KM. Bailey. 1989. Newperspectives on the relationship betweenrecruitment of Pacific hake (Merlucciusproductus) and the ocean environment Can.Spec. Publ. Fish. Aquat. Sci. 108507220.
Sissenwine, M.P. and J.G. Shepherd. 1987. Analternative perspective on recruitmentoverfishing and biological reference points.Can. J. Fish. Aquat Sci. 44:913-918.
Shepherd, J.G. 1982. A versatile new stock-recruitment relationship for fisheries, andthe construction of sustainable yield curves.J. Cons. Int. Explor. Mer 40:67-75.
REFERENCESBeverton, RJ.H. and S.J. Holt. 1957. On the
dynamics of exploited fish populations. U.K.
100

APPENDIX: The Equations of the Model for Whiting Yield
In the following equations the variable t denotes age in years.
GROWTH: W(t) = Wao*[ l-e-k- (t-to) 13
W is the average weight-at-age of a fish.
WOO k toStrong Growth 1.0 kg 0.36 /yr -0.5 yrWeak Growth 0.70 kg 0.42 /yr -0.5 yr
SURVIVAL: N = N(t,F,te)
R-e-M. (t-tr) . . . t 5 te
N = R-e-M* (te-tr)*e-(F+M)* (t-te) . . . te<tIT
Rae-M* (te-tr)*e-(F+M)* (T-te)*e-Ma (t-T) . . . T < t
NRtrteT
M
F
BIOMASS:
W
YIELD:
Y
SPAWNING STOCK
SSB
RECRUITMENT:
is the number of living fish.is the number of one-year-old recruits.is the age at recruitment: tr = 1 year.is the age at entry to the fishery.is the age at which fish cease to be vulnerableto fishing; T = 12 years.is the instantaneous rate of natural mortality:M = 0.237 per year.is the instantaneous rate of fishing mortality.
B(t) = W(t)*N(t,F,te)
is the total weight of the surviving fish.
1T
Y(F,te) =Jte
F*N(r,F,te)*W(r) dr
is the total weight fish caught over the fishablelifespan from age te to age T.
f00
BIOMASS: SSB(F,te) =JtR
N(r,F,te)*W(r) dr
is the total weight of fish over the reproductivelifespan from age tR to final senescence.
SSB(F,te)R(F,te) =
l - a-[ l-SSB(F,te)/B ]
R is the number of one-year-old recruits producedby the given spawning stock biomass (SSB).
101

Strong Growth Weak GrowthSlightly Curved
:0.5 0.5
567,720 mt 856,420 mtHighly Curved
:0.9 0.9
776,610 mt 1,244,090 mt
All four recruitment relationships produce 1.438 millionmetric tons of unexploited spawning stock biomass (Fig.2).
EQUILIBRIUM SPAWNING BIOMASS:
SSBeq(F,te) = (B/a)*[ SSB(F,te)/R - 1 + a ]
SSBeq is the long-run average spawning stock biomass.SSB/R is the short-run spawning biomass per recruit.
EQUILIBRIUM RECRUITMENT:
ReqW,W = SSBeq(F,te) / [ SSB(F,te)/R ]
Req is the long-run average one-year-old recruitment.
EQUILIBRIUM YIELD:
Yeq(F,te) = Req(F,te)*[ Y(F,te)/R ]
Yeq is the long-run average weight of fish caughtfrom a cohort over its fishable lifespan.
Y/R is the short-run yield per recruit.
102

Discussion&: How does it affect your predictions if wedon’t really know what foreign vessels arecatching in our waters?
A: (Sampson) This wouldn’t affect thesemodels because the models consider totalcatches, including foreign ones.
Q: (Barry Fisher, from the audience) Thedata we used to get from the observer pro-gram on the foreign fishing fleet could havebeen useful. Why don’t we use the fishingfleet to gather more data if it could improvethe projections used for management ofstocks?
AI Sampson answered that what we need tobe able to do is to predict environmentalchanges like El Niiio, but this ability seemsunlikely. The session leader interjected thatwhat the questioner was implying is that weneed to improve our projections with betterdata, such as weather cycle data, to improvemanagement decisions. Fisher added that
looking at one species alone is a mistake; weneed to examine the interactions in amultispecies fishery, as part of the overallecology.
Q: What about the economics of this situa-tion? How do you include supply and demandin the model?
AZ (Sampson) These factors can be included.To do so, we need to attach likelihoods toeach recruitment scenario, then do theeconomic analysis based on the situation wethink is most likely to occur.
Several additional comments were made insumming up. Mark Wilkins commented onthe idea of trying to analyze the wholesystem rather than one species alone; this isalready happening up in Alaska and theyhave fallen behind down here. Fisher addedfrom the audience that the scientists need tolet the industry help them where possible,both in gathering data and in raising fundsto support the research.
103
AMULTIP~OBJECIWE BIOECONOMIC POLICYMODEL OF THE PACIFIC WHITING (~auCCmsPRODUCTUS) FISHERY
Roberto R. EnriquezDepartment of Agricultural and Resource Economics, Oregon State University
Gilbert SylviaCoastal Oregon Marine Experiment Station
INTRODUCTION
Modern fishery management embraces a broadrange of biological, economic, and social objec-tives (benefits). The emergence of the conceptof optimum yield as the legislative principle offisheries management in the United States ex-plicitly recognizes the multiple-objective na-ture of fishery management (Healey 1984).The fundamental problem with multiple-objec-tive management, however, is the need to rec-oncile conflicting objectives. Bailey and Jentoft(1990) point out the necessity of making difB-cult choices among policy objectives in fisherymanagement.
Traditionally, the analysis of fishery policyhas centered on single objectives. For example,much of the analysis has focused on the issueof biological conservation. Although this focushas been essential for maintaining the long-term productivity of the resources, as man-dated by the Magnuson Fishery Managementand Conservation Act (MFMCA), it has ne-glected the economic and social aspects of thefishery. In contrast, economists have tended tofavor traditional cost-benefit analysis, whichfocuses on the single objective of maximixingthe present value of net revenues. Althoughthis approach provides valuable insight, it doesnot fully account for the effects of policy regula-tions on other objectives, such as regional em-ployment and income.
Economic analysis based on a single objec-tive is not consistent with the nature of the po-litical process in fisheries management, nordoes it comply with the MFMCA, which man-dates an integrated consideration of biological,social, and economic objectives. To overcomethese problems, Cohon (1978) has suggested amod%ed and refined methodology for theanalysis of multiple-objective decision prob-lems. This methodology is known as multiple-objective programming, a branch of operationsresearch that allows the consideration of mul-tiple objectives explicitly and simultaneously.
104
The purpose of this paper is to summaðe recent developments of a multiple-objectivebioeconomic policy model of the Pa&c whiting(Merluccius productus) fishery. This model in-tegrates biological, marketing, and industrialdata with economic impact and regulatory poli-cies. In particular it draws heavily from Pacificwhiting stock assessments, especially the re-sults of the stock synthesis model by Dorn andMethod (1991 and 19891, Dorn et al. (1990),Method ( 1989), and Hollowed et al. (1987). Thestudy also draws from several other sources,including a market survey by Sylvia and Pe-ters (1991). To illustrate the potential use ofthe model, we present the results from one ap-plication and briefly discuss them.
CONCEPT, SCOPE, AND UMITATIONS OFMULTIPLE-O- MODEIS
Traditional (single-objective) methods offishery policy analysis are designed to searchfor policy regulations that will potentially yieldthe highest value for the objective under con-sideration. In contrast, multiple-objectiveanalysis recognizes that since fishery policyconsists of noncomplementary objectives, a so-lution that simultaneously maximizes all theobjectives does not exist. That is, a manage-ment strategy that maximizes one objectivedoes not necessarily maximixe the other objec-tives. Multiple-objective models attempt toidentify policy alternatives representing fullutilization1 of the resource. A policy alternativerepresents full utilization if, given the objec-tives, the time horizon, and the constraints,there is no other possible alternative that willproduce an increase in one objective withoutcausing a degradation in at least one other ob-jective. Since there are many objectives, and
These solutions are called, alternatively, nondominated,noninferior. or Pareto efficient.
many ways to value these objectives, theremay also be many possible ways to fully utilizethe resource. The principal characteristic offull utilization alternatives is that, in movingfrom one alternative to another, we musttrade-off the objectives. It must be emphasizedthat full utilization refers to all of the objec-tives selected for the analysis. Multiple-objec-tive analysis systematically identifies full utili-zation alternatives and the trade-offs impliedby the selection of these alternatives.
The principal disadvantages of multiple-ob-jective analysis are the large information re-quirements and the high computational cost,which increase exponentially with the numberof objectives under consideration (Willis andPerlack 1980). As the number of objectives in-cluded in the analysis increases, the numberand complexity of the solutions also increase,making the policy information more di&ult tobe evaluated.
Multiple-objective models, as with otherkinds of mathematical models, are useful onlyif their limitations are clearly understood byanalysts and decision makers. The essence ofmathematical modelling is abstraction; there-fore, models provide only a limited view of realsystems. Given the complexity and uncertaintyinvolved in fishery management, the numeri-cal solutions of mathematical models must beinterpreted with caution. Nevertheless, mul-tiple-objective models, ifused in combinationwith other sources of information, includingthe experience of the policymakers and “com-mon sense,” can be valuable tools for the deci-sion-making process.
AN-GEOGRAPH~CACDISTRJBUWCN OF EFTORT
The Policy ProblemPaci& whiting exhibit an extensive north-
erly migration to summer feeding grounds offthe coasts of Northern California, Oregon,Washington, and British Columbia (Bailey1981). The extent of the annual migration isage and size dependent. Older fish and largerfish within a given age class tend to migratefarther north. Because the behavior and suc-cess of the Pacific whiting fishery depend onthe migratory behavior of the species, geo-graphical shifts of effort can not only compli-cate stock assessment, but can affect long-termyields (Dam et al. 1990) and therefore the lev-els of other policy objectives.
Dom (19901, using catch and observer datafrom the period 19781988, identifies three ar-
eas of high Pacific whiting catches in the U.S.zone: (1) the Eureka and Monterey regions(EUFC), consisting of the area south of latitude43”OO’ N, (2) the area from latitude 43”OO’ N tolatitude 46’45’ N, corresponding to the south-em part of the Columbia region (SCOL); and (3)the area north of latitude 46”45’ N to the U.S.-Canada border, consisting of the northern partof the Columbia region and the U.S. portion ofthe Vancouver region (VCN). Because of theirmigratory behavior, Pacific whiting harvestedfrom the different areas have different age,sex, sexual maturity and weight-atrage compo-sitions, with the northernmost regions having,on average, larger, and older fish. In addition,because of their larger size, fishes from thenorthernmost regions have, depending onproduct form, potentially higher value per unitweight (Sylvia and Peters 1991). The northem-most regions are also likely to have a higherproportion of sexually mature females.
The following policy problem considers asituation where the Pacific whiting fishery inthe U.S. is divided, for management purposes,into three subfisheries according to the re-gional classification described in the last para-graph. The main purpose of this exercise wasto analyze the effects of regional distribution ofeffort on the level of benefits.
The Policy ObjectivesConsider a policy decision problem where
the objectives of management are the rev-enues2 accruing from each of the three regions(subfisheries). In addition to revenues, main-taining the long-term productivity of the re-source is also considered an objective of man-agement. This policy problem, therefore, con-sists of four conflicting objectives. The policyinstruments (or decision variables) for thisproblem are the harvests allowed from eachsubfishery.
Methodology, Model Structure, andAssumptions
A dynamic .&&e-dependent), multiple-objec-tive mathematical program was used to ana-lyze the policy problem just described.3 Thebiological dynamics of Pacific whiting were
With the additional assumption that coats are indepen-dent of the geographical pattern of effort, gross revenuesapproximate changes in fishery rent.
*For a full description of the model, see Enriquez,unpublished manuscript.
105
simulated by a generalized age-structuredsubmodel, with an exponential (Baranov) catchequation accounting for the effect of the fisheryon the stock. The model divided the f%heryinto four subfisheries: three in the U.S. zone(as described above) plus the Canadian fishery.The Canadian fishery in this version of themodel was treated as an external variable. Fora detailed description of the model seeEnriquez (unpublished manuscript).
The procedure used to Snd full utilizationsolutions consists of the following steps:’(1) Assign a set of arbitrary weights (that is,relative values) to the various policy objectives;(2) search for the geographical pattern of fish-ing yielding the mazimum level of benefitsgiven the weights assigned; and (3) repeatsteps (1) and (2) for different sets of weights.The solution of each of these parameterizationsrepresents a full utilization solution.
Because of the high computational cost, thelarge number of possible full utilization solu-tions, and the limited scope of this work, werestricted ourselves to the identification anddiscussion of only three solutions. For the sakeof simplicity, the biological objective (that is,securing the long-term productivity of the re-source) was incorporated into the model as aconstraint. The spawning biomass was not al-lowed to fall below the cautionary level of 457thousand tons (the biological objective was notsubject to weighing.)
The analysis considered a 20-year time hori-zon and used the parameters estimated by thestock synthesis for the 1991 assessment of thePacific Coast ground&h fishery (Dom andMethod 1991; in particular, see tables 10 and11). The model assumed a 3.5 oz (.l kg) aver-age individual fish weight difference betweenthe southernmost and northernmost segmentsof the U.S. fishery. This estimate was based onthe 1990 Pacific whiting stock assessment re-port (Dam et al. 1990). Each solution was theresult of 25 replicate runs each with a ran-domly generated 20-year time series of recruit-ment.5 To keep catches within observed levels,we restricted fishing mortalities in the U.S.subfisheries (F,) to an average of no morethan F, = l/2.
We considered two product forms in theanalysis--fillets and surimi. Total fishery pro-
‘This procedure is known as the weighing method forgenerating noninferior solutions (see Cohon 1978).
Variability in recruitment was simulated by randomlyselecting with replacement from the time series ofrecruitment for the period 1958 to 1989 (see table 18 inDom et al. 1990).
106
duction was considered too small to a&& thelevel of prices in the market. However, themodel considered price variations for tillets,according to product size and supply availabil-ity, given by
PRICE ($/LB) - .71+ .0095 FILLET SIZE (02)
This relationship was obtained from a mar-ket survey by Sylvia and Peters (1991). Theprice of surimi was considered constant at$1.28 per lb. The simulation used a 0.25 recov-ery rate for fillets and a 0.14 recovery rate forSUkli.
Three solutions representing full utilizationalternatives were generated. In the first solu-tion called, Option 1, a high relative weight(see table 1) was assigned to the EUR region.This was done to force the model to concen-trate effort in the southern region. In the sec-ond solution, Option 2, all the three regions inthe U.S. received similar weights so as to dis-tribute harvest throughout the three U.S. re-gions. In the third alternative, Option 3, a highrelative weight was assigned to the northern@NC ) portion of the fishery. In all runs, theCanadian fishing mortality (F,) was fixed (atF,= 0.15). The results of the analysis areshown in table 1.
The policy options shown in table 1 repre-sent three different ways of using the resourceto its full capacity given the objectives, con-straints, and time horizon considered in theanalysis. Basing the results only on the levelsof revenue shown in the table (and displayedgraphically in figure l), we could not provethat any one solution was absolutely superiorto the others. That is, none of these solutionsprovides more revenues from every subfishery.For instance, Option 1 provides the highestlevel of revenue from the EUR region but norevenues from either the SCOL or VNC regions.Option 2 gives more revenues from the SCOLand VNC regions than Option 1 but provides$231.6 million less of discounted revenues fromthe EUR region. Similarly, Option 3 providesmore revenues from the VNC region but verylow levels from the other two regions. Theseresults show the nature of the trade-offs in-volved in fishery decision making: increasedbenefits from one region can come only at theexpense of other regions.
A typical multiple-objective problem hasmany full utilization solutions, all of which areequally desirable from the standpoint of mul-tiple-objective analysis. However, only one al-ternative can be actually implemented. A deci-

Option 1 Option 2 Option 3
EUR SCOL VNC EUR SCOL VNC EUFt SCOL VNC
Weights 90% 5% 5% 32% 36% 32% 5% 5% 90%
PV Revenues 726 0 0 494 147 277 14 0 722
St. Dev. 400 - 220 20 61 14 - 178
Catches 2967 0 0 1999 546 1005 76 0 2803
St. Dev. 1289 - 783 12 170 94 - 540
Revenues for each option represent the average (mean) over the 25 replicate runs and are discounted tothe initial period using a 5% interest rate. Catches (totaled for the 20-year period) represent averagesover the 25 replicate runs and are measured in nominal weight. Revenues are in millions of dollars andcatches are in thousand tons. All figures are rounded to the nearest unit.
Table 1. Results of the multiobjective analysis as described in the text
sion has to be made as to which full utilization Comparing Policy Alternativessolution is best for the region or nation. In the In principle, full utilization solutions can bemultiple-objective approach used hero, such compared only by introducing value judgmentsdecisions are not incorporated as part of the regarding the social importance of the objec-model, but are left entirely to the decision tives. Although these value judgments shouldmakers. be left to the decision makers, the analysts can
still play a role in the process. One thing the
1000
900
800
700z.: 600l-lr(; 500
Option 1
726
PV Revenues
917
Option 2 Option 3
Region
ElJR
SCOL
VNC
Total
Figure 1.Discountedrevenues firthethreefll.uUtilixatiQnsolutians asdescribed inthetext.
107

analyst can do is to provide additional criteriafor evaluating policy alternatives. These crite-ria can take many forms; for our example weuse aggregate revenues and variability.
Figure 1 shows aggregate levels of (dis-counted) revenues across subfisheries for eachoption. Aggregated revenues from the fisheryare potentially larger in Option 2, that is,when the effects of the fishery are spread outgeographically. Option 1 is the alternative thatprovides fewer overall revenues because ittakes a larger proportion of smaller, less valu-able fishes (see figure 2). When effort is con-centrated in the northern region (Option 31,catches are likely to consist of larger fishes (fig-ure 2). However, catches from this region prob-ably also will have a higher proportion of ma-ture females. This is likely to affect negativelythe level of spawning biomass. To avoid thiseffect, the model, by constraining the level ofspawning biomass, restricts the levels ofcatches allowed from the northern portion ofthe fishery. This, added to the effects of natu-ral mortality, explains the lower level of rev-enues from Option 3 relative to Option 2.
Variability of discounted revenues is an-other attribute that can be used as a criterionfor evaluation. Figure 2 shows the coefficient ofvariation associated with discounted revenuesand yield for the three policy options. The coef-ficient of variation measures the variability inpotential revenues and can be used as a crudemeasure of economic risk. Option 1 has thehighest level of variability of the options con-sidered. This is because catches in the south-em subfishery have a larger proportion of re-cently recruited individuals. Therefore, yieldsfrom this area are more directly at&ted byvariability in year-class strength. As expected,Option 3 possesses the lowest level ofvariability.
An interesting aspect that surfaced fromthis analysis is the fact that yields from thePacific whiting fishery are less variable thanthe level of discounted revenues. The reasonfor this is that the timing of strong year classes(that is, whether they occur earlier or later inthe period of analysis) affects the discountedlevel of revenues. Therefore variability in rev-enues can be expected to increase as the rate of
Figure 2. Averagecatch in numbers firthe three fullutilization solutionsdescribed in the t&.
Average Catch in Numbers by Age
20
0.06
2 3 4 5 6 7 8 9 1 0 11 12 13 14 15
. Xv=
The standard deviation as a proportion of mean.
108
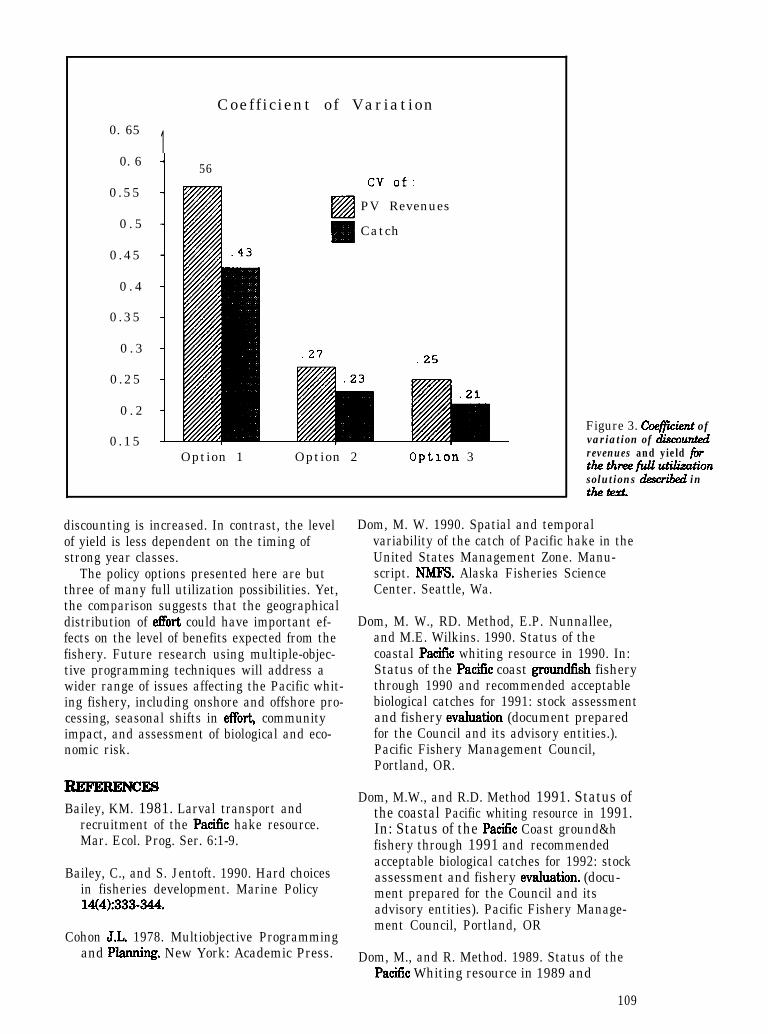
Coefficient of Variation0. 65 1
0. 6 1 56
0 .55
0 . 5
0 .45
0 . 4
0 .35
0 . 3
0 .25
0 . 2
0 .15
PV Revenues
Catch
Option 1 Option 2 Optlon 3
discounting is increased. In contrast, the levelof yield is less dependent on the timing ofstrong year classes.
The policy options presented here are butthree of many full utilization possibilities. Yet,the comparison suggests that the geographicaldistribution of effort could have important ef-fects on the level of benefits expected from thefishery. Future research using multiple-objec-tive programming techniques will address awider range of issues affecting the Pacific whit-ing fishery, including onshore and offshore pro-cessing, seasonal shifts in efFort, communityimpact, and assessment of biological and eco-nomic risk.
R.EFmwwEsBailey, KM. 1981. Larval transport and
recruitment of the Pa&c hake resource.Mar. Ecol. Prog. Ser. 6:1-9.
Bailey, C., and S. Jentoft. 1990. Hard choicesin fisheries development. Marine Policy14(4):333-344.
Cohon J.L. 1978. Multiobjective Programmingand Planning. New York: Academic Press.
Figure 3. f&#.ckn.f ofvariation of diswuntedrevenues and yield firthethmzfullutilizafionsolutions d.esu&d inthetext.
Dom, M. W. 1990. Spatial and temporalvariability of the catch of Pacific hake in theUnited States Management Zone. Manu-script. NMF’S. Alaska Fisheries ScienceCenter. Seattle, Wa.
Dom, M. W., RD. Method, E.P. Nunnallee,and M.E. Wilkins. 1990. Status of thecoastal Pa&% whiting resource in 1990. In:Status of the Pa&c coast ground&h fisherythrough 1990 and recommended acceptablebiological catches for 1991: stock assessmentand fishery evaluation (document preparedfor the Council and its advisory entities.).Pacific Fishery Management Council,Portland, OR.
Dom, M.W., and R.D. Method 1991. Status ofthe coastal Pacific whiting resource in 1991.In: Status of the Pacific Coast ground&hfishery through 1991 and recommendedacceptable biological catches for 1992: stockassessment and fishery evaluation. (docu-ment prepared for the Council and itsadvisory entities). Pacific Fishery Manage-ment Council, Portland, OR
Dom, M., and R. Method. 1989. Status of thePacific Whiting resource in 1989 and
109

recommendations to management in 1990.In: Status of the Pacific coast groundfishfishery through 1989 and recommendedacceptable biological catches for 1990: stockassessment and fishery evaluation ( docu-ment prepared for the council and itsadvisory entities), Pacific Fishery Manage-ment Council, Portland, OR
Enriquez, R.R Unpublished manuscript.Programming: an application to the whiting(Merluocius productus~ khery.
Healey, MC. 1984. Multiattribut.e analysisand the concept of optimum yield. Can. J.Fish. Aquat. Sci. 41:1393-1466.
Hollowed, AB., S. Adlerstein, RC. Francis andM. Saunders. 1987. Status of the Pacificwhiting resource in 1987 and recommenda-tions for management in 1988. In: Status ofthe Pacific coast groundfish fishery in 1987and recommended acceptable biologicalcatches for 1991, Pacific Fishery Manage-ment Council, Portland, OR
Method, R.D. 1989. Synthetic estimates ofhistorical abundance and mortality fornorthern anchovy, Engrauliz mordaz. In:Mathematical analysis of fish stock dynam-ics. E.F. Edwards and B.A Megrey (Edi-tors). American Fisheries Society Sympo-sium 6:66-82.
Sylvia, G. and G. Peters 1991. Market opportu-nities for Pacific whiting. Report preparedfor the Oregon Coastal Zone ManagementAssociation, Newport, Oregon.
Willis, C.E. and RD. Perlack. 1980. A compari-son of generating techniques and goalprogramming for public investment, mul-tiple objective decision making. AmericanJournal of Agricultural Economics 62(1):66-74.
DiscussionQ.z @my Fisher, from the audience) If youstretch the fishery out (lengthen the time overwhich the fish are caught), will this result inan increase in the number of product forms?
A: (Enriquez) Yes, because then larger fish willbe caught on average, and we assume largerfish give more product form options.
&: (Fisher) Does this mean that an “olympic”fishery (one where all the fish is caught in a110
very short period of time) will actually provideless revenue?
A: (Emiquez) My analysis was not intended toaddress this question specifically, but it doesindicate this result, since an earlier fishery willbe further south and take smaller fish.
Q (Fisher) Later in the season, more femalesare caught. Is this fact accounted for in yourmodel?
A: (Enriquez) Yes, it is implicitly included inthe spawning and biomass variables. What ismissing so far is a consideration of how differ-ent costs are affected; that is being done now.
8: When you talk about spreading out thefishery, are you talking about spreading it outover time or area?
A: (Enriquez) Both.
Gil Sylvia intexjected here that this modelprovides information which can be used formanagement by making assumptions aboutdemand for various product forms with differ-ent product quality characteristics. Whencombined with the information from themarketing study done by Sylvia and others,price effects can be included, and the research-ers will be able to draw conclusions on howregulatory systems affect price. The concept ofinventorying the fish in the ocean, that is,letting fish grow in the ocean rather thanpaying to freeze it, is among the many reasonsfor spreading out the fishing season over time.One extension of this analysis would be to lookat the change in risk of a lower female bio-mass, vs. the change in risk to fishermen, ofdifferent management systems.
Q (Steven Freese, from the audience) Themanagement councils will be looking at longer-term models; what kind of long-term data andinformation will be needed to improve thismodel for use by the councils?
A: (Enriquez) The cost information needs to beincluded in the model.
Sylvia added that this approach allows you totest different economic scenarios using sensi-tivity analysis. You need to limit the sensitiv-ity analysis to a reasonable range of assump-tions about what is most likely. The datarequirements increase exponentially as morefactors are included in the analysis.
PANEL DISCUSSION ON BIOLOGY ANDMANAG- OF PACIFIC WHITING
Session leader: Neal Coenen. Panel members: Mark Wilkins, David Sampson, Roberto Enriquez.
8: (Session leader) What about the use ofinterdisciplinary teams to provide informationfor management of this species, given thespecial economic and biological difIlcultiesinvolved?
A: Each panel member responded separately tothis question. David Sampson replied thatusing interdisciplinary approaches is a goodidea, as many of the problems have botheconomic and biological aspects. Mark Wilkinsmentioned that this type of analysis is begin-ning to happen, but needs to be emphasizedmore. Barry Fisher, from the audience, inter-jected that it is important to use Englishrather than technical jargon to communicate.Gil Sylvia remarked that Pacific whiting is aclassic case where an interdisciplinary ap-proach is needed; NMFS’S approach to theproblem has used different disciplines sequen-tially, but not together. Steven Freese of NMFsresponded that the system stretches too fewpeople in too many directions; tasks need to bemore limited. Fisher praised the scientists whohave had the courage to insist that an interdis-ciplinary approach is needed, and to criticizethe council’s approach, which tends to say“Let% hear from the biologists” and then, “Let’shear from the economists.” As long as peopleare stretched too thin, management problemswill continue.
Joe Easley, of the Otter Trawl Commission,commented that it would be a mistake to lookat whiting in isolation; we need to examine thewhole trawl fishery, which is economically,socially, and biologically integrated.
&: (Session leader) What kinds of regulationsare consistent with decreasing risk?
A: Each panel member responded separately tothis question. Sampson responded that therecommended mesh size of three inches shouldbe checked and re-analyzed, as this was onlyan estimate when it was originally set.. Fisherremarked from the audience that this is notenough; we need to look at double bags,chafers, and knotless Kevlan net, which wouldprovide better escapement. Wilkins added thata prohibition against fishing in the southernareas or the use of other seasonal or areaexclusions could be as effective as regulatingmesh size.
Easley, from the audience, commented that themanagement issues between the U.S. andCanada need to be settled. Sampson addedthat science says we shouldn’t focus on Cana-dian fish, as they are older year classes, andthe Canadians claim that we in the U.S.underestimate the biomass. Wilkins respondedthat we are now beginning to work out ourscientific differences with the Canadians.
We must get a handle on the catch by at-seaprocessors, because the current measure is notreliable, Fisher added. Easley then commentedthat many of the council’s managementproblems rest in Washington, D.C. It seems asthough many issues work their way upthrough the system and then get stuck some-where in Washington, D.C. As a result, theynever get resolved.
111

CLOSINGSBarry FisherCommercial Fisherman
Summarized by Ann L. ShriverInternational Institute of Fisheries Economics and Trade
We have been exposed to a great deal ofinformation over the last two days, all of whichhelps us answer the question, What do weneed to do to help to develop the whitingfishery? Among the important conclusions thatwe can draw are the following:
l Quality assurance is crucial to developingmarkets for this product Organization isnecessary in the industry to accomplish this, aswell as to work on related issues, such asmarketing and establishing quality standardsor guidelines.
l There is a need to improve communicationwithin the industry. Fishermen and processorsneed to communicate with each other, the restof the industry, and the markets. Some sugges-tions to improve communication that havecome out of this conference include the estab-lishment of an industry newsletter, which theAstoria Seafood Laboratory has agreed toundertake, and holding more meetings likethis one, in future focussing more on buyers.Government bodies and fishery managers needto be drawn into these activities.
l Continuation of the work done by the AstoriaSeafood Laboratory and OSU in food technol-ogy, and in the marine resource economicsresearch done at the Coastal Oregon MarineExperiment Station, is imperative.
l We can and should focus on the advantagesof Oregon in our marketing and development
efforts. Because we live in a small state, wehave the luxury of knowing one another, aspeople in larger states such as New York andCalifornia do not. We have the Oregon Department of Agriculture, Oregon State University,Oregon Sea Grant, the Coastal Oregon MarineExperiment Station, and the Seafood Labora-tory, which can all provide useful input. TheOregon Department of Fisheries and Wildlifehas a much more practical, cooperative atti-tude than do similar departments in Alaskaand Washington, and we should be able towork with them too.
l It has been suggested that we should formsome sort of a whiting group. We need anindustry grouping of processors and fishermen,with liaison to the Oregon Coastal Manage-ment Association, the Coastal Oregon MarineExperiment Station, and the Oregon Depart-ment of Ag&ulture.
l My advice to fishermen: Get out and find outmore about your product and its internationalmarkets. For example, you might subscribe toZNFOFISH, a publication described by Mr.&no. Continue to be politically astute andkick in financial support when needed. Weneed to change our attitude and accept thekinds of changes in gear and handling proce-dures mandated by the market. We can nolonger say, ‘That’s the way my grandfather didit and it’s good enough for me.”
112