harvard university financial reporthwpi.harvard.edu/files/fad/files/2007fullreport.pdf · harvard...
TRANSCRIPT

harvard universityfinancial report
fiscal year 2007
harvard
un
iversity finan
cial report
2007

PRESIDENT ANDFELLOWS OF HARVARDCOLLEGE
drew gilpin faustPresident
james f. rothenbergTreasurer
james r. houghtonnannerl o. keohanepatricia a. kingrobert d. reischauerrobert e. rubin
BOARD OF OVERSEERS
mitchell l. adamsalan d. bersinhelen m. blauronald cohenmichael f. croninarne s. duncansandra m. faberleila fawazroger w. ferguson, jr.frances d. fergussonlucy fisherann m. fudgemerrick b. garlandgerald r. jordan, jr.william f. leerichard i. melvoinrichard a. meservepenny pritzkeremily rauh pulitzerlisbet rausingrichard r. schrockjaime sepulveda amorrobert n. shapirojoan a. steitzthomas f. stephensonsusan s. wallachleah zell wangerseth p. waxmanstephanie d. wilsonpauline yu
drew gilpin faustex officio
james f. rothenbergex officio
OFFICERS
drew gilpin faustPresident
james f. rothenbergTreasurer
steven e. hymanProvost
marc goodheartSecretary
robert cashionActing Vice President for AlumniAffairs and Development
marilyn hausammannVice President for HumanResources
robert w. iulianoVice President and GeneralCounsel
elizabeth moraVice President for Finance andChief Financial Officer
a. clayton spencerVice President for Policy
alan j. stoneVice President for Government,Community and Public Affairs
sally h. zeckhauserVice President for Administration
photography:
front cover: Archway at Annenberg Hall, model from the
Allston room: Kris Snibbe, Harvard University News Office;
Professor Doug Melton’s laboratory: Gus Freedman; Wind
turbine at Hull, MA: Rose Lincoln, Harvard University
News Office
inside front cover: Jon Chase, Harvard University News Office
concept and design:
Sametz Blackstone Associates, Boston
“I look forward to our future adventures together with immense anticipation.
I can imagine no higher calling than doing all I can to serve this great university
—and helping it, in turn, to serve the world. And I feel singularly fortunate to
have the opportunity to do so in concert with all of you—the faculty, students,
staff, and others without whom there could be no Harvard.
Each of us brings something different, and something significant, to our shared
enterprise. We teach, we study, we discover, we create, we make sure the lights
go on and the bills get paid. We are individual members of a collective whose
opportunity to contribute to the future of learning, and the improvement of
the human condition, knows few equals and few bounds. That opportunity is
ours to make the most of—by aiming relentlessly high, by challenging each
other and ourselves, by bridging our differences, and by drawing strength but
never self-satisfaction from the past on which we are privileged to build.
”
Former President Derek Bok and President DrewGilpin Faust await the June 2007 Commencement DayAlumni Parade on the steps of Widener Library.
—Drew Gilpin Faust, July 2, 2007
tabl
eo
fco
nte
nts
2 message from the president
3 financial highlights
8 annual report of the harvard
management company
14 report of independent auditors
15 financial statements
19 notes to financial statements

2
ha
rva
rd
un
iver
sity
mes
sag
efr
om
the
pres
iden
t
I am pleased to present Harvard University’s financial report for fiscal 2007. Although I didnot assume the presidency until July 1st, I am privileged to convey results that were outstandingacross the board. Under the leadership of Mohamed A. El-Erian, we achieved endowmentreturns of 23.0%, yielding a market value of $34.9 billion and support from the endowmentof a third (over $1.0 billion) of the University’s operating budget. In addition, our alumni and friends contributed $615.0 million during fiscal 2007, the second highest level of fund-raising receipts in the University’s history, and we finished our eighth straight year with operating surpluses.
We are very fortunate to have these resources with which to fund our extraordinarily ambitiousacademic agenda. Planning for Allston is moving forward on a variety of fronts, from trans-portation and infrastructure to academic programming across a range of fields. The design ofthe first science building in Allston is well underway, and we expect to break ground duringthis academic year. In the past few months, we have announced the appointment of threenew deans—in the Faculty of Arts and Sciences, the Medical School and the Design School—all of whom promise to bring energy and creativity to their respective Schools and Faculties,as well as to the increasingly important collaborations across the University. As we welcomenew and returning students this fall, we will continue to explore ways to enhance the under-graduate experience in all of its dimensions and to provide appropriate support for the workof our faculty and graduate students.
Looking ahead, it will be more important than ever to make sound decisions about how weinvest our resources, how we can direct endowment returns to priority areas within theSchools and the University as a whole, and how we can most effectively make the case toHarvard’s generous community of alumni and friends about the importance of continuedinvestment in the University’s work. To these ends, I have launched a comprehensive academicplanning effort, involving all of the Deans, as well as faculty leadership in a variety of cross-cutting areas, to provide a framework for systematic, but flexible, decision making that willallow us to define our goals with greater precision and to align financial and physicalresources with identified priorities.
Success in all of these areas will depend on the continued efforts and engagement of theentire University community. I look forward to our shared endeavors in the years to come.
Sincerely,
Drew Gilpin Faustpresident
September 30, 2007
Message from the President

3
ha
rva
rd
un
iver
sity
fin
anci
alh
igh
lig
hts
Fiscal 2007’s financial results were among the best Harvard has attained, with significant endowment growth,
strong giving from alumni and friends, as well as a healthy operating surplus. This financial success provided
the underpinning for progress on many programmatic fronts: continued planning for the Allston campus;
formation of the Harvard University Science and Engineering Committee (husec), charged with providing
guidance on and governance of the University’s efforts in inter-departmental and inter-School science and
engineering; the transformation of the Division of Engineering and Applied Sciences within the Faculty of Arts
and Sciences (fas) into the School of Engineering and Applied Sciences; significant growth in international
programs; and approval of a new undergraduate general education curriculum.
market value of endowment funds as of june 30, 2007
Financial highlights
While celebrating the fiscal and programmatic achieve-ments of the past year, it is important to recognize several elements of uncertainty that could impactHarvard’s long-term financial stability. Total federalsponsored funding declined in fiscal 2007, reflectingthe impact of federal research budget cuts following
many years of solid growth. Recent volatility in theworldwide credit and investment markets may alsonegatively impact future endowment returns. TheUniversity’s ability to manage and mitigate these andother risks will be crucial in ensuring its continuedfinancial strength.
1974
1977
1997
2007
0
5
15
20
25
$35
10
30
1987
endowment growth
In billions of dollars
Business $2,824
Public Health $1,226
Engineering &Applied Sciences $999
Radcliffe Institute $587
Faculty of Arts &Sciences $14,976
Dental $215
In millions of dollars
Design $426Divinity $620Education $540
Law $1,777
Medical $4,080
Other academic departments $1,406
Central administration $328Auxiliary departments $363
Kennedy School of Government $1,069
President’s funds $3,476
total market value $34,912

4
ha
rva
rd
un
iver
sity
fin
anci
alh
igh
lig
hts
In millions of dollars 2007 2006 2005 2004 2003Total revenue $ 3,210.5 $ 2,999.6 $ 2,800.9 $ 2,597.7 $ 2,472.7Total expenses 3,170.7 2,999.5 2,757.4 2,560.9 2,432.9Total gifts 615.0 595.8 590.7* 549.6* 562.4
Fixed assets, net 4,524.2 4,078.5 3,797.8 3,468.9 3,168.4Total investments 41,832.9 34,249.6 29,938.2* 26,211.0* 22,093.9*
Bonds and notes payable 3,847.0 2,922.2 2,849.1 2,604.7 2,246.9
Net assets–General Operating Account 6,438.6 5,116.1 4,197.6 3,935.5 3,439.4Net assets–endowment funds 34,912.1 29,219.4 25,853.0 22,587.3 19,294.7
Total return on general investments** 23.0% 16.7% 19.2% 21.1% 12.5%
operating resultsThe University’s fiscal 2007 operating surplus of $39.9 million comprised a $2.5 million unrestricteddeficit and a $42.4 million surplus in restricted funds.Revenue rose 7% to $3.2 billion due to steady growthin most revenue categories, and operating expensestotaled $3.2 billion, a 6% increase over the prior year.The University continues to pursue cost savings acrossall expense categories.
Student income Student income increased 7%, totaling $657.6 millionin fiscal 2007. Revenue from undergraduate and grad-uate tuition rose 6% and 7%, respectively, slightlyhigher than the changes in tuition rates. Total studentroom and board income grew 6%, primarily due to theannual increase in the undergraduate room and boardrate. Continuing and executive education revenue rose14%, largely a result of higher enrollment in programs
at Harvard Business School (hbs) and the ExtensionSchool, as well as new programs at hbs and the GraduateSchool of Education (gse).
Sponsored research support Total sponsored revenue increased 1% to $641.9 millionin fiscal 2007. The University received 80% of its spon-sored research funding from the federal government,12% from foundations and 8% from other sources,including corporations; foreign, state and local govern-ments; as well as research institutes.
Total federal funding decreased 1% to $514.8 million.Various agencies of the Department of Health andHuman Services (dhhs), including most notably theNational Institutes of Health (nih), funded $412.0 million or 80% of the University’s federal sponsoredresearch in fiscal 2007. While total dhhs funding
endowment performanceGenerous donors and expert investment managementpropelled the University’s endowment to a record marketvalue of $34.9 billion as of June 30, 2007. HarvardManagement Company (hmc) is responsible for man-aging the investments that comprise the endowment.The endowment’s total return for fiscal 2007 was 23.0%, exceeding the annual performance benchmarkby 5.8% and resulting in a five-year annualized returnof 18.4%.1 The unaudited Annual Report of the Harvard
Management Company, beginning on page 8, discusseshmc’s investment philosophy and further analyzes theendowment’s fiscal 2007 performance.
Mohamed A. El-Erian recently announced his resignationas president and chief executive officer of hmc, effectiveat the end of calendar year 2007. The search for hissuccessor began immediately and is a top priority forfor fiscal 2008.
1 These returns are calculated on a time-weighted basis, net of all fees and expenses, and include the impact of revenue-sharing agreements with certain fund managers.
summary of financial results
* These numbers have been recast to conform with fiscal 2006 presentation.* * Total return on general investments is net of all fees and expenses, and includes the impact of revenue-sharing agreements with certain fund managers.

5
ha
rva
rd
un
iver
sity
fin
anci
alh
igh
lig
hts
increased 2% in fiscal 2007, nih funding fell 5%,reflecting a continued reduction in nih funding thatwas first observed in fiscal 2006. In addition, fundingfrom the National Science Foundation and the Depart-ment of Defense declined 6% and 16%, respectively.Cutbacks in federal funding pose challenges for thecontinued growth of the University’s research activities,particularly for those Schools that are most reliant onfederal funding. These decreases were offset in part byfunding increases in support of the President’sEmergency Plan for aids Relief (pepfar) project inAfrica. In fiscal 2007, the Harvard School of PublicHealth (hsph) entered the fourth year of this five-yearaward. Total pepfar funding was $48.5 million in fiscal2007, increasing 128% from $21.3 million in fiscal 2006.
Non-federal funding grew 9% to $127.2 million. Corp-orate funding was responsible for much of this gain,increasing 71% to $15.6 million. Foundation supportdeclined 2% to $72.9 million.
Gifts for current use Gifts from alumni and friends provide vital funding for the University’s ongoing operations and strategicpriorities, such as faculty development and financial aid.Current use gifts rose 6% in fiscal 2007, totaling$214.0 million.
Investment income Total investment income increased 11% to $1.2 billion.The largest component of investment income, endow-ment income distributed for operations, climbed 12%to $1.0 billion. This increase resulted from plannedgrowth of up to 11% in endowment distributions as wellas the impact of new gifts and other additions to theendowment. The Corporation-approved per unit distri-bution rate as a percentage of endowment marketvalue was 4.3%. The Corporation also approves certainendowment decapitalizations to support strategic, mission-critical activities. For example, a $100.0 milliondecapitalization was approved for the fas in fiscal 2007,primarily to fund construction and other facilities costs.The aggregate spending rate, including both endowmentdistributions as well as approved decapitalizations ofendowment principal, was 4.6%, within the University’shistorically targeted spending rate range of 4.5% to 5.0%.
The University’s endowment operating distributioncomprises a base payout as well as a strategic payout.Implemented in fiscal 2006, the strategic payout component of the operating distribution has been an
important source of funding for the Schools’ key programs and objectives. The University has undertakena systematic planning process to ensure that importantstrategic goals continue to benefit from the endow-ment’s wealth. As a result, and in an effort to accelerateprogress on priority initiatives, the University recentlyincreased its targeted aggregate spending rate range tobetween 5.0% and 5.5% of the endowment’s marketvalue annually.
Endowment income distributed for operations remainedHarvard’s largest source of income in fiscal 2007, representing 33% of total operating income comparedwith 21% ten years ago. This growth has resulted fromthe generous support of our alumni and friends as wellas the endowment’s continued strong performance.
Other income Other income rose 8% to $488.6 million in fiscal2007, largely due to incremental rental and publica-tions income.
Compensation Compensation and benefits costs represented 49% ofthe University’s total expenses in fiscal 2007. Thesecosts totaled $1.5 billion in fiscal 2007, an increase of5% over fiscal 2006. This increase included 7% growthin total salary and wage costs and a 2% decrease inbenefits expenses. The lower benefits expenses resultedprimarily from a reduction in costs associated with theemployee vacation liability, partly offset by higher healthand pension costs.
Rising health costs continue to be a concern, promptingthe University to develop a multi-year strategy thataddresses cost containment in this area. In calendaryear 2007, the University introduced greater cost sharingwith employees through increases in health plancopayments. The next step in this cost containment strategy is negotiation of a new pharmacy vendoragreement, expected to generate cost savings of approxi-mately $6.0 million over the next three years.
Financial aid Enhancing the financial aid programs for both under-graduate and graduate students continues to be one ofthe University’s top priorities. Scholarships and studentawards, including amounts applied against studentincome, rose 11% to $339.2 million in fiscal 2007. Inaddition, the University spent $61.2 million on studentemployment, loaned $30.6 million to students and

6
ha
rva
rd
un
iver
sity
fin
anci
alh
igh
lig
hts
acted as agent on behalf of specific student recipientsfor $12.9 million in aid from outside sponsors.Approximately 65% of scholarships and student awardswas funded through gifts, endowment income andsponsored support, with the remaining 35% providedby other University operating funds.
Supplies and equipment Supplies and equipment expenses increased 8% to$216.5 million. Increased purchases of drugs and labsupplies in support of sponsored activity for the pepfarproject represented $7.7 million of this increase.University-wide contracts with vendor partners togetherwith cost-conscious purchasing practices contained further expense growth.
Space and occupancy Space and occupancy costs totaled $405.2 million infiscal 2007, a 13% increase over the prior year. Intereston bonds and notes payable related to capital projectsrose 19% due to new debt issuances and higher interestrates on variable-rate debt. Space improvement, repairand maintenance expenses increased 24% as a resultof establishing reserves for future environmental remediation and conditional asset retirement obligations.Utility costs remained flat thanks to the implementationof electricity and natural gas purchasing strategies tohelp mitigate the effects of volatility in the energy markets as well as lower usage, partly resulting fromenergy conservation efforts.
Other expenses Other expenses grew 4% to $680.9 million, largely dueto higher interest on working capital debt and losseson building sales and demolition. In addition, interna-tional travel costs climbed 19%, as the University’sglobal presence expanded.
capital activitiesThe University invested $594.7 million in 388 activecapital projects and acquisitions in fiscal 2007. Totalcapital expenditures included 57% new constructionand acquisitions as well as 43% investment in theexisting physical plant. The University’s largest acquisi-tion was the “Harvard at Trilogy” development in theFenway area of Boston, which provides 171 apartmentsfor graduate students and affiliates.
Within Harvard’s existing campus locations, site preparation for the Harvard Law School NorthwestCorner development moved forward, and constructionprogressed on the North Precinct Chilled Water Plantand Electrical Substation. Major fas science buildingprojects continued at the Northwest Science Buildingand the Laboratory for Integrated Science andEngineering. The first of two graduate housing com-plexes in the Riverside area of Cambridge was completedin July 2007. As a related community benefit, theUniversity completed construction on 33 affordablecondominium units in the renovated Switch House onBlackstone Street, which the City of Cambridge will beselling to qualified Cambridge residents. Renovationswere completed at University Operations Services’Blackstone office facility, earning a Platinum Leader-ship in Energy and Environmental Design (leed) rating,
Salaries and wages
Employee benefits
Other expenses
Supplies & equipment
Scholarships & other student awards
Space & occupancy
38%
21%
11%
3%
7%
13%
Research
Auxiliary services
Academic support
Libraries
Scholarships & otherstudent awards
13%
28%
18%
6%
11%
3%
fiscal 2007 operating expenses
fiscal 2007 functional expenses
7%
Depreciation
3%
18% Student services
Institutional support
Instruction
7
ha
rva
rd
un
iver
sity
fin
anci
alh
igh
lig
hts
the highest possible rating for sustainable construction.Renovation and expansion continued at the New CollegeTheatre, and renovations were completed at the mainhouse at Dumbarton Oaks in Washington, D.C. Designreview is in process for the proposed renovation andexpansion of the Fogg Museum and for a landscapemaster plan at the Radcliffe Institute. Other projectscurrently underway include construction of the secondgraduate housing complex in the Riverside Area, plan-ning for the Arnold Arboretum’s Weld Hill Researchand Administration Building, and major renovations ofthe fas Malkin Athletic Center, Byerly Hall at theRadcliffe Institute, Gallatin Hall at hbs and RockefellerHall at Harvard Divinity School (hds), including thecreation of a new hds campus green.
Allston campus planning progressed as well, with several formal filings with the City of Boston launchingthe approval process for the long-range master plan.This plan contains the University’s vision for trans-forming the Harvard-owned properties adjacent to the current campus into a vibrant mix of academic andsupport uses, including the development of the AllstonScience Complex. The design for the complex has beencompleted, and construction is expected to begin in thefirst half of fiscal 2008. The Allston campus masterplan will undergo substantially more review in thecoming year. Sustainable construction, energy, landscapedesign and transportation are key components of themaster plan.
Beyond the master plan and progress on the sciencecomplex, the University is undertaking several impor-tant studies to inform future Allston campus decisions.These studies will identify options and strategies forretail, housing, culture and support services, as well asfor ensuring the best use of available space for potentialusers such as gse, hsph, athletics and the arts. All ofthese efforts will help to realize the University’s visionfor a 21st century interdisciplinary campus in Allston.
Developing the Allston campus, exploring the frontiersof interdisciplinary science, expanding the facultyranks while promoting both diversity and excellence,and continuing to evolve as an international Universitywill demand significant resources in the comingdecades. Attentive and careful stewardship of Harvard’sinvestments and resources, including managing therisks that may jeopardize the federal sponsored andendowment revenue streams, will continue to beessential. These efforts and the crucial continued support of our donors will help to ensure the successof the University’s important strategic initiatives.
Elizabeth Moravice president for finance and chief financial officer
James F. Rothenbergtreasurer
September 30, 2007

8
ha
rva
rd
un
iver
sity
hm
can
nu
alre
port
Annual Report of the Harvard Management Company
Harvard Management Company (hmc) is a wholly owned subsidiary of Harvard University that is governed by
a Board of Directors (the “Board”) appointed by the President and Fellows of Harvard College (the “Corporation”).
Established in 1974, hmc is charged with management of the University’s endowment, pension assets, working
capital, and deferred-giving balances. As of June 30, 2007, hmc managed a total of $42.8 billion, $40.8 billion
of which consisted of the General Investment Account (gia). The gia is a pooled fund consisting primarily of
endowment assets. The information presented in this unaudited report relates to the gia.
performance of the general investment accountThe gia experienced another strong year of absoluteand relative performance in fiscal 2007. Accordingly,hmc was able to meet its objective of preserving andenhancing the real value of the gia after taking intoaccount distributions to support the University’s missionof excellence in teaching and research. hmc also out-performed its “Policy Portfolio,” the long-term neutralasset mix deemed likely to meet the University’s returngoals given the appropriate risk specification.
The total investment return amounted to 23.0%, calcu-lated on a time-weighted basis, net of all fees andexpenses, and including the impact of revenue-sharingagreements with certain fund managers. After includinggifts, distributions, and other changes, the total valueof the gia increased from $33.5 billion as of June 30,2006 to $40.8 billion as of June 30, 2007. The endow-ment, the largest component of the gia, grew from$29.2 billion to $34.9 billion.
Consistent with global developments, the main driversof the gia’s absolute return in the fiscal year endedJune 30, 2007 included exposures to emerging markets,international, and domestic equities (through bothpublic and private vehicles). Emerging markets bondsalso did well, benefiting from both capital appreciationand carry. The absolute return/special situations andreal estate categories had a good twelve months, whilealso offering some diversification during periods ofmarket volatility.
Notwithstanding the fact that hmc is still in a transitionphase, the fiscal 2007 investment return is consistentwith Harvard’s history of superior investment perform-ance. Indeed, as illustrated on the following page, thefiscal 2007 return of 23.0% exceeds various historicalaverages. Relative to the major U.S. indices, theendowment outpaced the 20.6% return registered bythe S&P in fiscal 2007 and the 6.1% return registeredby the Lehman Aggregate (a broad measure of thebond market).
Within the overall investment return, hmc’s efforts toadd value contributed 5.8% (23.0% versus the PolicyPortfolio benchmark return of 17.2%) for fiscal 2007.This translates into $1.9 billion of additional value forthe gia. In the process, hmc maintained its record ofdelivering long-term value added across the eleven(non-cash) asset classes in which it invests.
Traditionally, hmc has measured itself against the tucsmedian (Trust Universe Comparison Service compiledby Wilshire Associates) for peer comparison. On thebasis of this measure, which incorporates available dataon 151 large institutional investors, the gia’s perform-ance exceeded the median return of 17.7%, as well asthe 20.9% return that marks the top five percentile forthis sample.
hmc’s value-added efforts benefited from bottom-upinternal and external portfolio management capabilities,as well as top-down adjustments in overall positioning.

Specifically, the gia’s value was enhanced by:
hmc is also excited about some of the new approachesthat its portfolio managers pursued in fiscal 2007.While the specific opportunities are relatively small atthis point—in absolute terms and relative to more traditional strategies—they have the ability and potentialto grow over time. They involve looking at under-exploited market segments that speak directly to hmc’ssecular themes, helping to develop new investmentvehicles by drawing on modern portfolio tools andtechniques, and seeking incremental value through a deeper and broader set of institutional relationships.
the historical contextThe annualized five- and ten-year performance for thegia, after incorporating the fiscal 2007 results, aresummarized in the graph below. Three historical factorsare worth noting:
9
ha
rva
rd
un
iver
sity
hm
can
nu
alre
port
five- and ten-year annualized average returns
• First, by significantly outperforming the University’slong-term real return target over time, the gia hastaken advantage of the opportunities present in themarket to build an important margin for the future;
• Second, by having access to a mix of both internal andexternal investment management capabilities, the long-term outperformance margin relative to the PolicyPortfolio is solidly ahead of the 1.0% level that has his-torically been deemed a realistic long-term objective; and
• Third, relative to the long-term average for institutionalfunds, the gia has maintained an outperformance margin that continues to exceed the target of 1.5%.
Fiscal 2007 hmc performance is consistent with hmc’s history of superior investment returns
* As measured by the median of 151 institutional funds with assets of over $1.0 billion, based on information compiled by the Trust Universe Comparison Service (tucs).
Fiscal 2007 hmc performance
• The outperformance of the internal portfolio manage-ment group,
• The strong results delivered by some long-standingexternal managers,
• Returns generated by recent additions to the stable ofexternal managers, and
• Asset allocation adjustments driven by intra-year riskmitigation considerations.
average annualized percentage returns for theperiods ended june 30, 2007
Total Policy Portfolio Valuereturn* benchmark added
1 year 23.0% 17.2% 5.8%
5 years 18.4 13.8 4.6
10 years 15.0 10.5 4.5
15 years 16.2 12.2 4.0
20 years 14.0 11.5 2.5
25 years 15.7 13.9 1.8
30 years 14.3 12.6 1.7
Since inception 13.3 11.9 1.4
* Total return is net of all fees and expenses, and includes the impact of revenue-sharing agreements with certain fund managers.

10
ha
rva
rd
un
iver
sity
hm
can
nu
alre
port
investment management philosophyand processhmc’s results were achieved within the context of aninvestment philosophy and approach that has servedthe gia well over the years. The investment philosophyhas been anchored by a disciplined approach thatdraws lessons from experience and monitors changingglobal economic and financial conditions. hmc tries to blend the best of two worlds by leveraging theUniversity’s intrinsic attributes—large, patient pool ofsingle-source capital, aaa credit rating, world-class reputation—to take the long view with direct invest-ments in the capital markets, while also accessingsome of the best external investment managementavailable in the marketplace.
The breakdown of the gia by asset category as of June 30, 2007 and 2006 was (in millions of dollars):
2007 2006Equities:
Domestic equities $ 7,266 $ 5,730Developed foreign equities 5,932 5,189Emerging markets equities 4,595 2,722Private equities 4,156 2,968
Total equities 21,949 16,609
Fixed-income:Domestic bonds 2,694 3,299Foreign bonds 1,351 1,276High-yield bonds 641 1,724
Total fixed-income 4,686 6,299
Real assets:Commodities 5,725 2,887Real estate 2,722 2,518Inflation-indexed bonds 2,679 1,535
Total real assets 11,126 6,940
Absolute return and special situations 5,063 4,917Cash (2,071) (1,293)TOTAL $ 40,753 $ 33,472
annualized ten-year performance by asset class1
1 Returns are calculated on a time-weighted basis with the exception of private equities, real estate, and commodities, which are calculated on a dollar-weighted basis. Returns are net of all fees and expenses, and include the impact of revenue-sharing agreements with certain fund managers. Individual benchmarks are representative of each asset class and are approved by the Board.
2 Inflation-indexed bonds, and absolute return and special situations, have been held for less than ten years. For these asset classes, the hmc return and the benchmark reflect annualized performance of 8.00 years and 8.75 years, respectively.
Similar to what occurred in fiscal 2007, the historicaloutperformance of the gia has been accompanied by consistently solid results at the individual assetclass level, as illustrated above.

11
ha
rva
rd
un
iver
sity
hm
can
nu
alre
port
hmc seeks to add value in every element of the invest-ment stream, starting at the asset allocation level. Each year, hmc’s Board of Directors and managementteam determine an appropriate “neutral” allocation ofHarvard’s capital across various markets given theUniversity’s desired return target and risk tolerance.Currently, capital is allocated across eleven (non-cash)asset classes. While significant changes are not gener-ally made on an annual basis, Harvard’s investmentmix has evolved substantially over time.
Once the neutral allocation guidelines are determined,hmc’s management is charged with the selection ofappropriate implementation vehicles. Both internaland external vehicles are used to optimally deploy capital across all asset classes. This active use of specific investment strategies is aimed at deliveringvalue over and above what can be realized by investingin a passive portfolio.
hmc uses a variety of alpha generators to add value.Examples include absolute return strategies, includingequity and fixed-income arbitrage, enhanced cash management, structural alpha trades, and tacticaladjustments to the asset allocation. All of these alphagenerators help hmc focus on delivering a superior,risk-adjusted return across all of its asset classes (afterall fees required to generate that return). The result is a diversified investment portfolio, managed in aresponsive manner, and backed by effective risk management.
risk managementAppropriate controls and procedures are integral tomitigating risks and effectively managing the gia.Accordingly, hmc maintains an approach aimed atmonitoring and managing the factors pertaining tocredit, liquidity, market and operational risks. (A sum-mary description of these risk factors may be foundbelow.) Since no single indicator can reasonably beexpected to capture the host of risk factors that affectthe gia, hmc utilizes a matrix approach that is subjectto regular reviews both by the Board and managementof hmc.
hmc’s risk mitigating measures include the use of risklimits as they pertain to investment strategies, singlenames, and managers; assessment of correlationsacross investment strategies, managers and asset classes;counterparty credit evaluations; etc. By necessity, thisis a dynamic process that takes into account generalmarket developments, the proliferation of new instru-ments, and the changing nature of linkages acrossasset classes. This process is supported by consistentefforts to ensure that hmc has the required informationinputs and management system, the appropriate analytical tools, and a robust set of checks and balances.
The effectiveness of hmc’s risk management is highlydependent on manager transparency and the quality ofthe data inputs, particularly in terms of completenessand timeliness. In this context, and as hmc deepensand widens its relationships with external managers,an effort is being made to counteract the existing market tendency towards a lower level of informationtransparency.
market risk is defined as the sensitivityof income and capital to variations ininterest rates, foreign exchange rates,equity prices, commodity prices, andother market-driven rates and prices.Market risk also considers the correla-tion risk among investments and theliquidity of the underlying positions.Market risk is measured as the poten-tial gain or loss resulting from a pricechange at a given probability over a specific time period; this is alsodescribed as value at risk. Value
at risk is monitored and reviewed frequently by the Board of Directorsand senior management to ensurethat exposures are consistent withapproved limits and guidelines. Stressand scenario tests are also conductedto determine how potential changesin market conditions could impact themarket value of the portfolio.
credit risk is defined as the risk ofloss arising from a counterparty’s failure or inability to meet payment or
performance terms of a contract. hmc
manages credit risk by establishingstrict credit policies, setting concen-tration limits and approval procedures,and monitoring exposure continuously.hmc enters into arrangements withcounterparties believed to be credit-worthy and requires collateral to themaximum extent possible. Limits areestablished for each counterpartybased on their creditworthiness.
components of risk
(Continued on next page)
12
ha
rva
rd
un
iver
sity
hm
can
nu
alre
port
Finally, and in recognition of the increasing fluidity of the global economy, hmc has placed particularemphasis on potential cross-asset class correlationsand market contagion.
salient organizational developmentsFiscal 2007 saw important institutional changes as hmccompletes its transition phase. Efforts in this area havebeen aimed at establishing conditions for sustainingsuperior investment returns for Harvard Universityover time, including the development of deep organiza-tional and institutional roots.
Of note are several initiatives that, in the context ofongoing changes in the global financial landscape, targetthe appropriate balance between continuity and change:
the road aheadhmc continues to take a multi-faceted approach toasset allocation. First, as has periodically been the case,the composition of the Policy Portfolio has been slightlyaltered for fiscal 2008, consistent with an updatedanalysis of the risk/return prospects for individualasset classes and their likely correlations. In addition to this annual review, hmc has layered elements thatreflect its secular themes, including the realignment inkey components of global growth, the structural weak-ening of global disinflationary pressures, the gradual
liquidity risk considers the risk ofloss arising from the inability to meetfunding commitments. The objectiveof liquidity risk management is toensure the ability to meet the endow-ment’s financial obligations. Effectivemanagement of liquidity risk requiresthe ability to project and understandall cash flows and potential futurecommitments. It also involves theidentification and prioritization ofsources of liquidity. Cash is activelymanaged by a centralized staff
responsible for understanding fundingrequirements and evaluating sourcesof liquidity. Liquidity measures areemployed to ensure that the Universitymaintains adequate liquidity and isprepared for periods of stress.
operational risk is the risk of lossresulting from inadequate or failedinternal processes or systems, errorsby employees, or external events. Themanagement of these risks is primarilythe responsibility of the business line
managers in each functional area.hmc manages operational risk byidentifying areas of risk, monitoringcompliance, promoting best practices,and implementing internal controlsand robust systems. The results ofthese activities are reviewed frequentlyby senior management.
components of risk, continued
• During the course of the year, hmc essentially completedthe process of reconstructing the internal portfoliomanagement platform. It now consists of teams cover-ing five market segments: advanced country equities,emerging markets equities, domestic fixed income,international fixed income, and foreign exchange. Inthe process, hmc hired top talent from the industrythat complements existing staff.
• hmc restructured the allocations to its external man-agers within the confines of various investment lockups.In addition to emphasizing bottom-up manager-relatedissues, this process was influenced by the secularthemes guiding hmc’s overall investment approach.
• Risk management activities benefited from updates inanalytics, scenario formulation, guidelines, and moni-toring mechanisms.
• Progress in these areas was facilitated by ongoingefforts to retool key support functions in compliance,risk, operations and information technology. Whilethese are less visible to the outside world, they arenonetheless important for the sustainability of superior,risk-adjusted investment returns.
• Further steps were taken to enhance hmc’s corporategovernance. The Board committee structure wasexpanded and strengthened, and the self-evaluationprocedures were revised.
• Finally, hmc starts fiscal 2008 with a new organiza-tional task: selecting a new ceo for hmc. The Board ofDirectors has launched an immediate search for mysuccessor.

13
ha
rva
rd
un
iver
sity
hm
can
nu
alre
port
redeployment of windfall reserve gains by emergingeconomies, the institutionalization of alternative invest-ments, and the broader application of risk transfertechnology to balance sheets within and beyond thebanking system.
In addition to understanding the key characteristicsinfluencing the long-term evolution of the global finan-cial landscape, hmc’s future success will depend on its ability to navigate the journey—particularly the extentto which it can discern and respond to an increasinglyfluid and volatile economic, financial and geopoliticallandscape.
The global system is in the midst of important struc-tural changes that offer new opportunities as well as a different configuration of risks. Ever larger pools ofprivate and public investment capital are looking tomimic the “endowment approach.” And while imitationmay be the highest form of flattery, such migration ofcapital will inevitably dilute the potency of the approachand complicate its implementation. This comes at a timewhen global payments imbalances remain large, corre-lations among asset classes and managers are rising,the market robustness of certain new derivative productsis yet to be tested sufficiently, and a certain amount ofhubris seems to influence some market participantswho have confidently moved to a “just-in-time” riskmanagement paradigm.
In view of these factors, hmc is resisting the temptationto extrapolate the recent strong investment performance.Instead, it is more prudent to view it as involving a“windfall gain” component. Indeed, the question is notwhether there will be market pullbacks, but rather theirlikely depth, breadth, and duration. This considerationassumes added importance given the gradual declinein the traditional risk-mitigating characteristics of adiversified asset allocation, thus further emphasizing theimportance of hmc’s hedging and risk managementstrategies. Indeed, as hmc enters fiscal 2008, it has beenreminded of how these strategies can help the gia navi-gate well a challenging combination of sudden marketdisruptions, significant liquidity dislocations, and severedifficulties for an external manager. hmc’s Board ofDirectors is committed to continuing the currentinvestment management approach and strategies.
Mohamed A. El-Erianpresident and ceo
September 30, 2007
1980 1991 1996 2000 2007 2008Equities:
Domestic equities 66% 40% 36% 22% 12% 12%Developed foreign equities 18 15 15 11 12Emerging markets equities 9 9 8 10Private equities 12 15 15 13 11
Total equities 66 70 75 61 44 45
Fixed-income:Domestic bonds 27 15 13 10 7 5Foreign bonds 8 5 5 4 3 3High-yield bonds 2 2 3 3 1
Total fixed-income 35 22 20 17 13 9
Real assets:Commodities 6 3 6 16 17Real estate 7 7 7 10 9Inflation-indexed bonds 7 5 7
Total real assets 0 13 10 20 31 33
Absolute return and special situations 5 17 18
Cash (1) (5) (5) (3) (5) (5)TOTAL 100% 100% 100% 100% 100% 100%
historical evolution of the policy portfolio (selected years)
14
ha
rva
rd
un
iver
sity
repo
rto
fin
dep
end
ent
aud
ito
rsre
port
of
ind
epen
den
tau
dit
ors
To the Board of Overseers of Harvard College:
In our opinion, the accompanying Balance Sheet and the related Statements of Changes inNet Assets with General Operating Account Detail, Changes in Net Assets of the Endowment,and Cash Flows, present fairly, in all material respects, the financial position of HarvardUniversity (the “University”) as of June 30, 2007, and the changes in its net assets of theGeneral Operating Account and endowment funds and its cash flows for the year then ended,in conformity with accounting principles generally accepted in the United States of America.These financial statements are the responsibility of the University’s management. Ourresponsibility is to express an opinion on these financial statements based on our audit. The prior year summarized comparative information has been derived from the University’sfiscal 2006 financial statements, and in our report dated October 6, 2006, we expressed anunqualified opinion on those financial statements. We conducted our audit of these statementsin accordance with auditing standards generally accepted in the United States of America.Those standards require that we plan and perform the audit to obtain reasonable assuranceabout whether the financial statements are free of material misstatement. An audit includesexamining, on a test basis, evidence supporting the amounts and disclosures in the financialstatements, assessing the accounting principles used and significant estimates made by management, and evaluating the overall financial statement presentation. We believe that our audit provides a reasonable basis for our opinion.
As discussed in Note 2 to the financial statements, the University changed the manner inwhich it accounts for defined benefit and other postretirement plans and limited partnershipsheld for investment in 2007 and began recognizing conditional asset retirement obligationsin 2006.
September 30, 2007
Report of Independent Auditors

15
ha
rva
rd
un
iver
sity
fin
anci
alst
atem
ents
fin
anci
alst
atem
ents
balance sheetswith summarized financial information as of June 30, 2006
In thousands of dollars 2007 2006ASSETS:Cash $ 39,800 $ 43,594Receivables, net (Note 4) 207,999 222,793Prepayments and deferred charges 98,718 82,698Notes receivable, net (Note 5) 307,643 286,297Pledges receivable, net (Note 6) 524,972 540,623Fixed assets, net (Note 7) 4,524,162 4,078,536Net retirement assets (Note 11) 303,282 0Interests in trusts held by others (Notes 8 and 12) 358,294 320,990Investment portfolio, at market (Note 3) 46,616,888 37,085,236Market value of securities pledged to counterparties (Note 3) 5,341,587 2,905,867TOTAL ASSETS 58,323,345 45,566,634
LIABILITIES:Accounts payable (Note 19) 370,496 327,697Deposits and other liabilities (Note 7) 478,471 409,775Securities lending and other liabilities associated with the investment portfolio (Note 3) 10,125,587 5,741,473Liabilities due under split interest agreements (Note 9) 906,581 693,383Bonds and notes payable (Note 10) 3,846,978 2,922,247Accrued retirement obligations (Note 11) 545,698 476,600Government loan advances (Note 5) 57,146 56,960TOTAL LIABILITIES 16,330,957 10,628,135
NET ASSETS $ 41,992,388 $ 34,938,499
June 30Temporarily PermanentlyUnrestricted restricted restricted 2007 2006
NET ASSETS:General Operating Account (Note 12) $ 5,201,951 $ 1,150,504 $ 86,156 $ 6,438,611 $ 5,116,072Endowment (Note 8) 5,796,425 24,779,301 4,336,342 34,912,068 29,219,430Split interest agreements (Note 9) 0 196,021 445,688 641,709 602,997TOTAL NET ASSETS $10,998,376 $ 26,125,826 $ 4,868,186 $ 41,992,388 $ 34,938,499
The accompanying notes are an integral part of the financial statements.
June 30

16
ha
rva
rd
un
iver
sity
For the year endedTemporarily Permanently June 30
In thousands of dollars Unrestricted restricted restricted 2007 2006REVENUE:Student income:
Undergraduate program $ 225,690 $ 225,690 $ 212,473Graduate programs 345,443 345,443 323,157Board and lodging 123,892 123,892 116,485Continuing education and executive programs 193,164 193,164 169,963Scholarships applied to student income (Note 13) (230,562) (230,562) (205,957)
Total student income 657,627 0 0 657,627 616,121
Sponsored research support (Notes 14 and 15):Federal government - direct costs 376,415 376,415 378,466Federal government - indirect costs 138,355 138,355 139,526Non-federal sponsors - direct costs 37,493 $ 76,784 114,277 104,942Non-federal sponsors - indirect costs 7,779 5,108 12,887 11,296
Total sponsored research support 560,042 81,892 0 641,934 634,230
Gifts for current use (Note 15) 83,128 130,866 213,994 201,946
Investment income:Endowment income distributed for operations (Note 8) 174,423 869,332 1,043,755 933,337Income on working capital investments distributed for operations 132,672 24,989 157,661 154,009Interest received on student, faculty and staff loans 6,962 6,962 6,075
Total investment income 314,057 894,321 0 1,208,378 1,093,421
Other operating income (Note 16) 488,573 488,573 453,865Net assets released from restrictions 1,064,727 (1,064,727) 0 0TOTAL REVENUE 3,168,154 42,352 0 3,210,506 2,999,583
EXPENSES:Salaries and wages 1,203,209 1,203,209 1,126,322Employee benefits (Note 11) 341,962 341,962 350,575Scholarships and other student awards (Note 13) 108,588 108,588 99,574Supplies and equipment 216,549 216,549 199,779Space and occupancy 405,156 405,156 360,054Depreciation (Note 7) 214,318 214,318 210,964Other expenses (Note 17) 680,868 680,868 652,235TOTAL EXPENSES 3,170,650 0 0 3,170,650 2,999,503
NET REVENUE/(DEFICIT) (2,496) 42,352 0 39,856 80
OTHER PROVISIONS AND CREDITS:Increase in appreciation, net of operating distribution (Note 10) 880,089 4,315 884,404 868,832Change in undistributed general investment income (4,884) (17,976) (22,860) 115,977Other changes (Note 10) 0 (11,316)TOTAL OTHER PROVISIONS AND CREDITS 875,205 (13,661) 0 861,544 973,493
CAPITAL CHANGES:Change in pledge balances (Note 6) 11,536 11,536 (29,020)Increase in interests in trusts held by others (Note 12) 8,856 8,856 21,174Capital gifts for loan funds and facilities (Note 15) 5,062 $ 534 5,596 16,150Transfers between the General Operating Account and endowment 38,745 38,547 (959) 76,333 (34,993)Transfers from split interest agreements (Note 9) 6,970 506 7,476 4,917Non-operating net assets released from restrictions 99,717 (101,538) 1,821 0 0TOTAL CAPITAL CHANGES 138,462 (30,567) 1,902 109,797 (21,772)
GENERAL OPERATING ACCOUNT NET CHANGE DURING THE YEAR 1,011,171 (1,876) 1,902 1,011,197 951,801
Endowment net change during the year 1,088,095 4,382,032 222,511 5,692,638 3,366,382Split interest agreements net change during the year (Note 9) 8,383 30,329 38,712 95,218NET CHANGE BEFORE CUMULATIVE EFFECT OF ACCOUNTING CHANGES 2,099,266 4,388,539 254,742 6,742,547 4,413,401
Cumulative effect of accounting changes (Notes 2, 7 and 11) 311,342 311,342 (33,323)NET CHANGE DURING THE YEAR 2,410,608 4,388,539 254,742 7,053,889 4,380,078
Net assets, beginning of year 8,587,768 21,737,287 4,613,444 34,938,499 30,558,421NET ASSETS, end of year $ 10,998,376 $ 26,125,826 $ 4,868,186 $ 41,992,388 $ 34,938,499
The accompanying notes are an integral part of the financial statements.
fin
anci
alst
atem
ents
statements of changes in net assets with general operating account detailwith summarized financial information for the year ended June 30, 2006

17
ha
rva
rd
un
iver
sity
fin
anci
alst
atem
ents
fin
anci
alst
atem
ents
statements of changes in net assets of the endowmentwith summarized financial information for the year ended June 30, 2006
For the year endedTemporarily Permanently June 30
In thousands of dollars Unrestricted restricted restricted 2007 2006
Gifts for capital (Note 15) $ 25,751 $ 43,918 $ 207,957 $ 277,626 $ 273,381
Investment return (Notes 3 and 8):Income from general investments 75,745 374,433 450,178 474,558Increase in realized and unrealized appreciation 1,046,442 5,002,933 6,049,375 3,639,196
Total investment return 1,122,187 5,377,366 0 6,499,553 4,113,754Endowment income distributed for operations (174,423) (869,332) (1,043,755) (933,337)Change in undistributed general investment income 2,397 21,983 24,380 (102,662)Net investment return after distributions 950,161 4,530,017 0 5,480,178 3,077,755
Transfers between endowment and the General Operating Account:Net transfers to/(from) unexpended endowment income 5,003 (70,201) 9,013 (56,185) 37,818Gifts capitalized 257 3,127 901 4,285 5,818Other transfers (44,005) 28,527 (8,955) (24,433) (8,643)
Total transfers between endowment and the General Operating Account (38,745) (38,547) 959 (76,333) 34,993
Capitalization of split interest agreements (Note 9) 3,265 15,348 18,613 6,897Change in pledge balances (Note 6) 4,083 (30,645) (26,562) (75,603)Increase in interests in trusts held by others (Note 8) 9,449 18,999 28,448 47,899Other changes 2,858 (7,700) (4,490) (9,332) 1,060Net assets released from restrictions 148,070 (162,453) 14,383 0 0NET CHANGE DURING THE YEAR 1,088,095 4,382,032 222,511 5,692,638 3,366,382Net assets of the endowment, beginning of year 4,708,330 20,397,269 4,113,831 29,219,430 25,853,048NET ASSETS OF THE ENDOWMENT, end of year $ 5,796,425 $ 24,779,301 $ 4,336,342 $ 34,912,068 $ 29,219,430
The accompanying notes are an integral part of the financial statements.

18
ha
rva
rd
un
iver
sity
fin
anci
alst
atem
ents
statements of cash flows
In thousands of dollars 2007 2006CASH FLOWS FROM OPERATING ACTIVITIES:Change in net assets $ 7,053,889 $ 4,380,078Adjustments to reconcile change in net assets to net cash provided by/(used in) operating activities:
Cumulative effect of accounting changes (311,342) 33,323Depreciation 214,318 210,964Increase in fair value of interest rate exchange agreements (4,651) (442,888)Increase in interests in trusts held by others (37,304) (69,073)Increase in liabilities due under split interest agreements 213,198 125,271Increase in accrued retirement obligations 77,158 80,201Gain on investments, net (7,286,777) (4,298,785)Gifts restricted for capital purposes (292,645) (302,164)
Changes in operating assets and liabilities:Receivables, net 14,794 (51,177)Prepayments and deferred charges (16,020) (4,888)Pledges receivable, net 15,651 104,220Accounts payable 47,053 (105,582)Deposits and other liabilities 68,696 20,196
NET CASH PROVIDED BY/(USED IN) OPERATING ACTIVITIES (243,982) (320,304)
CASH FLOWS FROM INVESTING ACTIVITIES:Loans made to students, faculty and staff (56,338) (55,325)Payments received on student, faculty and staff loans 34,681 45,203Change in other notes receivable 311 (6,631)Proceeds from the sales and maturities of investments 41,386,657 38,883,059Purchase of investments (43,400,260) (22,814,630)Additions to fixed assets (635,727) (466,858)
NET CASH PROVIDED BY/(USED IN) INVESTING ACTIVITIES (2,670,676) 15,584,818
CASH FLOWS FROM FINANCING ACTIVITIES:Change in overdrafts included in accounts payable (28,471) 7,426Proceeds from the issuance of debt 1,122,628 921,596Debt repayments (197,897) (848,478)Gifts restricted for capital purposes 292,645 302,164Change associated with securities lending agreements 1,721,773 (15,638,182)Increase in government loan advances 186 104
NET CASH PROVIDED BY/(USED IN) FINANCING ACTIVITIES 2,910,864 (15,255,370)
NET CHANGE IN CASH (3,794) 9,144
Cash, beginning of year 43,594 34,450CASH, end of year $ 39,800 $ 43,594
Supplemental disclosure of cash flow information:Change in investments as well as other liabilities associated with the investment portfolio
related to the implementation of eitf 04-5 $ 537,544 $ 0Change in accounts payable related to fixed asset additions 24,217 24,804Cash paid for interest 158,881 119,526
The accompanying notes are an integral part of the financial statements.
For the year ended
June 30

19
ha
rva
rd
un
iver
sity
no
tes
tofi
nan
cial
stat
emen
ts
Harvard University (the “University”) is a private, not-for-profit institution of higher education with approximately7,100 undergraduate and 12,940 graduate students. Establishedin 1636, the University includes the Faculty of Arts andSciences, the School of Engineering and Applied Sciences,the Division of Continuing Education, ten graduate and professional Schools, the Radcliffe Institute for AdvancedStudy, a variety of research museums and institutes, and anextensive library system to support the teaching and researchactivities of the Harvard community. The President and
Fellows of Harvard College (the “Corporation”), a governingboard of the University, has oversight responsibility for all ofthe University’s financial affairs. The Corporation delegatessubstantial authority to the Schools and departments for themanagement of their individual resources and operations.
The University includes Harvard Management Company(hmc), a wholly owned subsidiary founded in 1974 to manage the University’s investment assets. hmc is governedby a Board of Directors that is appointed by the Corporation.
Basis of presentation The consolidated financial statements present the activitiesof Harvard University as a whole, including significant affili-ated organizations controlled by the University.
The financial statements include certain prior year summarizedcomparative information in total, not by net asset classification.This information is not presented in sufficient detail to conform with generally accepted accounting principles.Accordingly, such information should be read in conjunctionwith the University’s financial statements for the year endedJune 30, 2006, from which the summarized informationwas derived. Certain prior year amounts have been reclassifiedto conform to current year presentation.
Funds transferred to the University on behalf of specific beneficiaries (agency funds) are recorded as assets and liabilities in the Balance Sheets and are not included in theStatements of Changes in Net Assets.
Net asset classificationsFor the purposes of financial reporting, the University classifiesresources into three net asset categories pursuant to anydonor-imposed restrictions and applicable law. Accordingly,the net assets of the University are classified in the accompa-nying financial statements in the categories that follow:
unrestricted net assets are not subject to donor-imposedrestrictions. Funds invested in fixed assets and unrestrictedfunds functioning as endowment comprise 65% of theUniversity’s unrestricted net assets as of June 30, 2007. Inaddition, this category includes unrestricted gifts and endow-ment income balances, University-designated loan funds andother unrestricted current funds.
1. university organization
2. summary of significant accounting policies
temporarily restricted net assets are subject to legal ordonor-imposed stipulations that will be satisfied either byactions of the University, the passage of time, or both. Thesenet assets include gifts donated for a particular purpose,amounts subject to time restrictions such as funds pledgedfor future payment, or amounts subject to legal restrictionssuch as portions of otherwise unrestricted capital apprecia-tion, which must be reported as temporarily restricted netassets in accordance with Massachusetts law.
permanently restricted net assets are subject to donor-imposed stipulations that they be invested to provide a perpetual source of income to the University. Generally,donors of these assets require the University to maintain and invest the original contribution in perpetuity, but permitthe use of some or all investment earnings for general orspecific purposes.
Revenues from sources other than contributions are generallyreported as increases in unrestricted net assets. Expenses arereported as decreases in unrestricted net assets. Income earnedby restricted fund and gift accounts is initially classified astemporarily restricted net assets and is reclassified as unre-stricted net assets when expenses are incurred for theirintended purpose.
Unconditional pledges are reported as increases in theappropriate categories of net assets in accordance with donorrestrictions. Gains and losses on investments are reported as increases or decreases in unrestricted net assets unlesstheir use is restricted by explicit donor stipulations or by law. Expirations of temporary restrictions on net assets arereported as reclassifications from temporarily restricted tounrestricted net assets and appear as “Net assets releasedfrom restrictions” and “Non-operating net assets releasedfrom restrictions” in the Statements of Changes in Net Assets.

20
ha
rva
rd
un
iver
sity
no
tes
tofi
nan
cial
stat
emen
ts
Net revenue/(deficit) Revenues earned, expenses incurred and income distributedfor operations for the purpose of conducting research andthe programs and services of the University are presented as“Net revenue/(deficit)” in the Statements of Changes in NetAssets with General Operating Account Detail. Net revenue/(deficit) is the measure of the University’s operating result.
Securities lending transactions The Balance Sheets display both the assets and correspondingliabilities generated by securities lending transactions. Thesetransactions are executed to support the investment activitiesof hmc. The University also separately reports the fair valueof assets for which counterparties have the right to pledge orexchange the collateral they have received; assets of theinvestment portfolio that are unencumbered are reported as“Investment portfolio, at market” in the Balance Sheets.
Collections The University’s vast array of museums and libraries housespriceless works of art, historical treasures, literary works andartifacts. These collections are protected and preserved forpublic exhibition, education, research and the furtherance ofpublic service. They are neither disposed of for financial gainnor encumbered in any manner. Accordingly, such collectionsare not recorded or capitalized for financial statement purposes.
Insurance programs The University, together with the Harvard-affiliated teachinghospitals, has formed a captive insurance company, ControlledRisk Insurance Company (crico), to provide limited profes-sional liability, general liability and medical malpracticeinsurance for its shareholders. The University self insures a portion of its professional liability and general liability programs and maintains a reserve for liability claims. cricoprovides medical malpractice coverage with no deductible forHarvard University Health Services, the Harvard School ofDental Medicine and the Harvard School of Public Health.The University also maintains self-insurance programs andreserves for claims for automobile liability, property andworkers’ compensation; these programs are supplementedwith commercial excess insurance above the University’sself-insured limit. In addition, the University is self insuredfor unemployment, the primary senior health plan and allhealth and dental plans for active employees. The University’sclaims liabilities are recognized as incurred, including claimsthat have been incurred but not reported, and are includedin operating expenses.
Tax-exempt status The University is a tax-exempt organization under Section501(c)(3) of the Internal Revenue Code.
Use of estimates The preparation of financial statements in accordance withgenerally accepted accounting principles requires manage-ment to make estimates and assumptions that affect reportedamounts and disclosures. Actual results could differ fromthose estimates.
New accounting pronouncements The University implemented the requirements of FinancialAccounting Standard 158, Employers’ Accounting for DefinedBenefit Pension and Other Postretirement Plans (fas 158) as of June 30, 2007. Under fas 158, the funded status of eachpension and other postretirement benefit plan as of June 30is required to be reported as an asset (for overfunded plans)or a liability (for underfunded plans). fas 158 requires disclo-sure of the incremental effect of adopting the standard on certain individual line items of the Balance Sheet. In addition,the initial implementation of this standard is recognized as a cumulative effect of a change in an accounting principle inthe fiscal 2007 Statement of Changes in Net Assets with GeneralOperating Account Detail. The effect of fas 158’s adoption isdiscussed in Note 11.
Effective July 1, 2006, the University implemented EmergingIssues Task Force Issue 04-5, Investor’s Accounting for anInvestment in a Limited Partnership When the Investor Is the SoleGeneral Partner and the Limited Partners Have Certain Rights(eitf 04-5). Under eitf 04-5, a general partner is required toconsolidate any partnership that it controls, including thoseinterests in the partnerships in which it does not have owner-ship rights. A general partner is presumed to control a partnership unless the limited partners have certain rights to remove the general partner or other substantive rights toparticipate in partnership operations.
In accordance with eitf 04-5, the University has consolidatedassets held in partnerships controlled by hmc. These assetsare included in “Investment portfolio, at market” in the BalanceSheets. Liabilities of the consolidated entities and the minorityinterest related to the assets not owned by the University areincluded in “Securities lending and other liabilities associatedwith the investment portfolio” in the Balance Sheets. Theeffect of adopting eitf 04-5 is discussed in Note 3.

21
ha
rva
rd
un
iver
sity
no
tes
tofi
nan
cial
stat
emen
ts
The significant accounting policies of the University relatedto investments are as follows:
A) Investments are presented at fair market value based ontrade date positions as of June 30. Instruments listed or tradedon a securities exchange are valued at the last sale price onthe primary exchange where the security is traded. Investmentsin publicly traded securities that are subject to restrictionslimiting their salability are discounted from the current publicmarket price to levels that reflect the estimated cost of thoserestrictions. Non-exchange traded debt instruments are primarily valued using independent pricing services or bybroker/dealers who actively make markets in these securities.Options contracts, forward contracts, interest rate exchangeagreements and interest rate cap and floor agreements are primarily valued using models with externally verifiable inputs,or by using independent broker quotes. Private equities, realassets, and absolute return and special situations consist primarily of investments that are not readily marketable.Investments in these categories, which are managed exter-nally, are valued utilizing the most current information provided by the general partner. Direct private equity andreal asset investments are valued using discounted cash flowand other industry standard methodologies. Where applicable,independent appraisers and engineers assist in the valuation.These values are determined under the direction of, and subject to approval by, the Valuation Committee of the hmcBoard of Directors.
B) The preparation of financial statements requires manage-ment to make estimates and assumptions about the effectsof matters that are inherently uncertain. The accounting policies considered potentially significant in this respect arethe valuation of derivative instruments, absolute return andspecial situations, private equities and certain real assets.Values for these instruments are often estimated using tech-niques such as discounted cash flow analysis and comparisonsto similar instruments. Estimates developed using thesemethods are subjective and require judgment regarding significant matters such as the amount and timing of future
cash flows and the selection of discount rates that appropri-ately reflect market and credit risks. Estimates, by theirnature, are based on judgment and available information.Changes in assumptions could have a significant effect on the fair value of these instruments. Actual results could differfrom these estimates and could have a material impact onthe financial statements.
C) The University amortizes bond premiums and accretesbond discounts.
D) The University utilizes a number of subsidiary entities tosupport its investment activities. The consolidated financialstatements include all assets and liabilities associated withthese entities.
E) The collateral advanced under security borrowing agree-ments is in the form of cash. The minimum collateral theUniversity requires by contract on each stock loan and repur-chase agreement is 100% of the market value of the securityloaned. Collateral is moved as is required by fluctuations inthe market value of the security loaned.
The majority of the University’s investments are managed inthe General Investment Account (gia), a pooled fund thatconsists primarily of endowment assets.
Other investments are managed separately from the gia.These investments consist primarily of fixed-income securities(principally government securities and certificates of depositheld for the University’s working capital needs) and variousmanaged bond and equity portfolios associated with splitinterest agreements.
3. investments
In fiscal 2006, the University adopted Financial AccountingStandards Board (fasb) Interpretation No. 47, Accounting for Conditional Asset Retirement Obligations (fin 47). fin 47requires the initial application of the interpretation to be rec-ognized as a cumulative effect of a change in an accountingprinciple. Specifically, fin 47 requires the recognition of a liability, a cumulative effect, the cumulative accretion and
accumulated depreciation for the period from the date theliability was incurred to the date of adoption of this interpre-tation. The liability is presumed to be incurred on the datethat the legal requirement to perform the asset retirementactivity was enacted. The effect of fin 47’s adoption is discussed in Note 7.

22
ha
rva
rd
un
iver
sity
no
tes
tofi
nan
cial
stat
emen
ts
The University’s investments as of June 30, 2007 and 2006are summarized in the following table (in thousands of dollars):
2007 2006Investment portfolio, at market:
Pooled general investment assets1 $ 45,536,634 $ 36,308,104Other investments2 1,093,529 795,058Fair value of interest rate exchange agreements (13,275) (17,926)
Total investment portfolio, at market 46,616,888 37,085,236
Market value of securities pledged to counterparties 5,341,587 2,905,867Securities lending and other liabilities associated with the investment portfolio (10,125,587) (5,741,473)TOTAL INVESTMENTS3 $ 41,832,888 $ 34,249,630
1 Excludes securities pledged to counterparties.2 Includes split interest agreement assets of $561,384 and $516,478 as of June 30, 2007 and 2006, respectively.3 Includes cash equivalents that consist principally of funds that have maturities of 90 days or less. Cash equivalents classified as investments were $2,627,760
and $1,859,259 as of June 30, 2007 and 2006, respectively.
2007 2006Pooled general investment net assets:
General Operating Account $ 5,264,544 $ 3,904,716Endowment 34,251,729 28,589,702Split interest agreements 986,906 779,902Other internally designated funds 249,455 198,178
Total pooled general investment net assets 40,752,634 33,472,498
Other investments2 1,093,529 795,058Fair value of interest rate exchange agreements (13,275) (17,926)TOTAL INVESTMENTS3 $ 41,832,888 $ 34,249,630
Investments as of June 30, 2007 and 2006 comprised thefollowing (in thousands of dollars):
* Net of all fees and expenses, and including the impact of revenue-sharing agreements with certain fund managers.
2007 2006Return on pooled general investments:
Realized and unrealized gains, net $ 7,135,715 $ 4,290,895Investment income 535,902 558,322
Total return on pooled general investments* 7,671,617 4,849,217
Return on other investments:Realized and unrealized gains, net 151,062 7,890Investment income 35,644 23,941
Total return on other investments 186,706 31,831
Unrealized gain on interest rate exchange agreements 4,651 442,888TOTAL RETURN ON INVESTMENTS $ 7,862,974 $ 5,323,936
A summary of the University’s total return on investments forfiscal 2007 and 2006 is presented below (in thousands of dollars):

23
ha
rva
rd
un
iver
sity
no
tes
tofi
nan
cial
stat
emen
ts
The University employs a unit method of accounting forpooled general investments. Each participating fund entersinto and withdraws from the pooled investment accountbased on monthly unit market values. Changes in the marketvalue of investments are distributed proportionately to eachfund in the investment pool. Net general investment incomedistributed during the year is allocated on a per unit basis.
The changes in the market value and income of partici-pating units for the years ended June 30, 2007 and 2006were as follows:
* Net of all fees and expenses, and including the impact of revenue-sharing agreements with certain fund managers.
2007 2006Unit market value, end of year $ 1,982.64 $1,635.04Unit market value, beginning of year 1,635.04 1,425.68
Increase in unit market value due to realized and unrealized appreciation 347.60 209.36Income earned per unit on general investments 26.12 27.27
TOTAL UNIT RETURN OF POOLED GENERAL INVESTMENTS* $ 373.72 $ 236.63
TOTAL UNIT RETURN PERCENTAGE USING MONTHLY COMPOUNDING* 23.0% 16.7%
The University’s investment strategy incorporates a diversifiedasset allocation approach and maintains, within defined limits,exposure to the movements of the world equity, fixed-income,real estate, commodities and private equity markets. A coreinvestment portfolio is structured to mirror the market expo-sures defined by the Policy Portfolio and is considered to be“unhedged” as represented by “Total investments” in thetable on page 24. The Policy Portfolio is the long-term assetmix that is most likely to meet the University’s long-termreturn goals with the appropriate level of risk. It serves as thebenchmark against which the performance of the pooledgeneral investments is measured. In addition, the Universityseeks to enhance the returns of certain asset classes throughstrategies designed to capture mispricings in specific financialinstruments without changing the fundamental risk profileof the core investment account. These strategies generallyinvolve several distinct but highly correlated financial instru-ments that are weighted to neutralize market risk. Dependingon the characteristics of the financial instruments, the specificpositions within a given strategy may be recorded in theasset or liability sections of the table on page 24.
The table on page 24 delineates securities pledged to counter-parties where the counterparty has the right, by contract orcustom, to sell or repledge the securities. The fair value ofcollateral pledged to counterparties that cannot be sold orrepledged as of June 30, 2007 was $747.0 million and as ofJune 30, 2006 was $906.9 million. The fair value of collateralaccepted by the University as of June 30, 2007 was $2,822.6million and as of June 30, 2006 was $2,096.8 million. Theportion of this collateral that was sold or repledged as of June30, 2007 was $1,046.2 million and as of June 30, 2006 was$1,633.3 million. The cost of the net investments (the sum of
total investments, total financial instruments purchased underhedge transactions and total financial instruments sold, not yetpurchased, under hedge transactions) was $34,872.9 million asof June 30, 2007 and $27,411.0 million as of June 30, 2006.
As discussed in Note 2, the University consolidated assetsand liabilities held in partnerships controlled by hmc in fiscal 2007, in accordance with eitf 04-5. The consolidationof these entities increased both the pooled general invest-ment assets and liabilities shown in the table on page 24.Real asset investments increased by $401.5 million; otherassets, consisting of cash, receivables and fixed assets,increased by $136.0 million; and other liabilities, consistingof accruals, payables, debt and minority interests, increasedby $537.5 million.

24
ha
rva
rd
un
iver
sity
no
tes
tofi
nan
cial
stat
emen
ts
2007 2006POOLED GENERAL INVESTMENT ASSETS:Investments:
Domestic equity and convertible securities $ 6,757,501 $ 5,957,302Securities pledged to counterparties 437,237 $ 7,194,738 295,341 $ 6,252,643
Developed foreign equity and convertible securities 4,162,410 5,427,138Securities pledged to counterparties 4,162,410 525,970 5,953,108
Domestic fixed-income securities 1,399,694 1,691,594Securities pledged to counterparties 1,734,036 3,133,730 801,097 2,492,691
Foreign fixed-income securities 12,428 21,220Securities pledged to counterparties 1,236,639 1,249,067 594,072 615,292
Emerging markets equity, debt and options 2,326,864 2,062,680Securities pledged to counterparties 1,045,380 3,372,244 396,684 2,459,364
High-yield securities 2,000,304 1,237,422Securities pledged to counterparties 2,000,304 43,494 1,280,916
Absolute return funds and special situations 5,487,554 4,431,298Securities pledged to counterparties 5,487,554 25,827 4,457,125
Real assets1 9,724,325 5,839,778Securities pledged to counterparties 279,466 10,003,791 112,951 5,952,729
Private equities 4,178,397 3,072,182Total investments 40,782,235 32,536,050
Financial instruments purchased under hedge transactions:Equity and convertible securities 1,095,684 1,394,026
Securities pledged to counterparties 27,113 1,122,797 45,672 1,439,698
Fixed-income securities 1,772,670 768,074Securities pledged to counterparties 563,070 2,335,740 64,759 832,833
Real assets1 16,030 20,110Securities pledged to counterparties 18,646 34,676 20,110
Options 353,192 38,478Total financial instruments purchased under hedge transactions 3,846,405 2,331,119
Collateral advanced under security borrowing agreements2 2,450,224 1,724,361Cash and short-term investments 2,523,657 1,741,657Other assets3 1,275,700 880,784TOTAL POOLED GENERAL INVESTMENT ASSETS 50,878,221 39,213,971
POOLED GENERAL INVESTMENT LIABILITIES:Financial instruments sold, not yet purchased, under hedge transactions:
Equity and convertible securities 1,044,560 1,416,443Fixed-income securities 1,714,450 410,547Options 300,968 8,819
Total financial instruments sold, not yet purchased, under hedge transactions 3,059,978 1,835,809
Cash collateral held under security lending agreements4 5,128,807 2,681,172Other liabilities5 1,936,802 1,224,492TOTAL POOLED GENERAL INVESTMENT LIABILITIES 10,125,587 5,741,473
TOTAL POOLED GENERAL INVESTMENT NET ASSETS $ 40,752,634 $ 33,472,498
The pooled general investment assets and liabilities as of June30, 2007 and 2006 are summarized as follows (in thousandsof dollars):
1 Real assets include investments in commodities, real estate and inflation-indexed bonds.2 The collateral advanced under security borrowing agreements is in the form of cash.3 As of June 30, 2007, other assets consisted primarily of accounts receivable for the sale of securities of $1,103,913, of which gross receivables related to
off-balance sheet instruments were $294,374. As of June 30, 2006, other assets consisted primarily of accounts receivable for the sale of securities of $817,568, of which gross receivables related to off-balance sheet instruments were $68,946.
4 The minimum collateral the University requires by contract on each stock loan and repurchase agreement is 100% of the market value of the security loaned. Collateral is moved as is required by fluctuations in the market value of the security loaned.
5 As of June 30, 2007, other liabilities consisted primarily of accounts payable for undistributed income and the purchase of securities of $1,363,483, of which gross payables related to off-balance sheet instruments were $117,001. As of June 30, 2006, other liabilities consisted primarily of accounts payable for undistributed income and the purchase of securities of $1,161,276, of which gross payables related to off-balance sheet instruments were $26,466.

25
ha
rva
rd
un
iver
sity
no
tes
tofi
nan
cial
stat
emen
ts
The University uses a variety of financial instruments withoff-balance sheet risk involving contractual or optional commitments for future settlement. These include futures,options, interest rate exchange agreements, interest rate capand floor agreements, and forward purchase and sale agree-ments, which are exchange traded or executed over thecounter. These instruments are used in both the core portfolioto gain exposure to a given asset class (displayed as “unhedged”market exposure in the following tables) and in the arbitragestrategies with the goal of enhancing the returns of certainasset classes without increasing the market risk to the under-lying asset class (displayed as “hedged” market exposure inthe following tables). The market risk of a strategy is influ-enced by the relationship between the financial instruments
with off-balance sheet risk and the offsetting positions recordedin the Balance Sheets. The University manages exposure tomarket risk through the use of industry standard analyticaltools that measure the market exposure of each positionwithin a strategy. The strategies are monitored daily andpositions are frequently adjusted in response to changes inthe financial markets.
The following table summarizes the market exposure(expressed in delta-weighted notional amounts), net endingfair value, net average fair value (an average of the five quartersending June 30, 2007) and credit exposure relative to thefinancial instruments with off-balance sheet risk as of June30, 2007 (in thousands of dollars):
Net ending fair value of NetMarket exposure off-balance sheet positions average
Long Long Short fair Creditunhedged hedged hedged Unhedged Hedged value exposure*
Equity instruments:Equity futures $ 1,314,137 $ (301,633) $ 25,788 $ (96) $ 5,760 $ 52,305Equity options 20,244 $ 7,587 (191,730) 3,861 13,256 29,462 2,859Equity exchange agreements 4,133,959 164 (110,003) 61,896 (2,397) 23,391 7,616
Total equity instruments 5,468,340 7,751 (603,366) 91,545 10,763 58,613 62,780
Fixed-income instruments:Fixed-income futures 1,854,864 (1,164,495) 970 5,578 21,233Fixed-income options 10,222,863 (12,701,397) 1,645 (13,533) 44,628Interest rate exchange agreements 537,119 1,939,938 (1,441,566) (2,881) 11,194 (7,671) 618Interest rate caps and floors 9,883,207 (12,929,576) 55,024 20,228 16,605
Total fixed-income instruments 537,119 23,900,872 (28,237,034) (2,881) 68,833 4,602 83,084
Commodity instruments:Commodity futures 3,968Commodity options (10,280) (10,280) (3,042)Commodity exchange agreements 3,293,716 32,492
Total c0mmodity instruments 3,293,716 0 (10,280) 0 (10,280) (3,042) 36,460
Currency forwards 1,305,209 12,195,924 (13,537,807) 2,334 (39,008) (26,258) 22,717Currency options 259,923 (48,594) (19,330) (4,180) 13,961TOTAL $ 10,604,384 $ 36,364,470 $ (42,437,081) $ 90,998 $ 10,978 $ 29,735 $ 219,002
* Credit exposure represents cash or securities advanced by the University to meet legal margin requirements in connection with future, forward and option contracts, as well as exposure to counterparties where gains on financial instruments with off-balance sheet risk exceeds collateral held by the University.
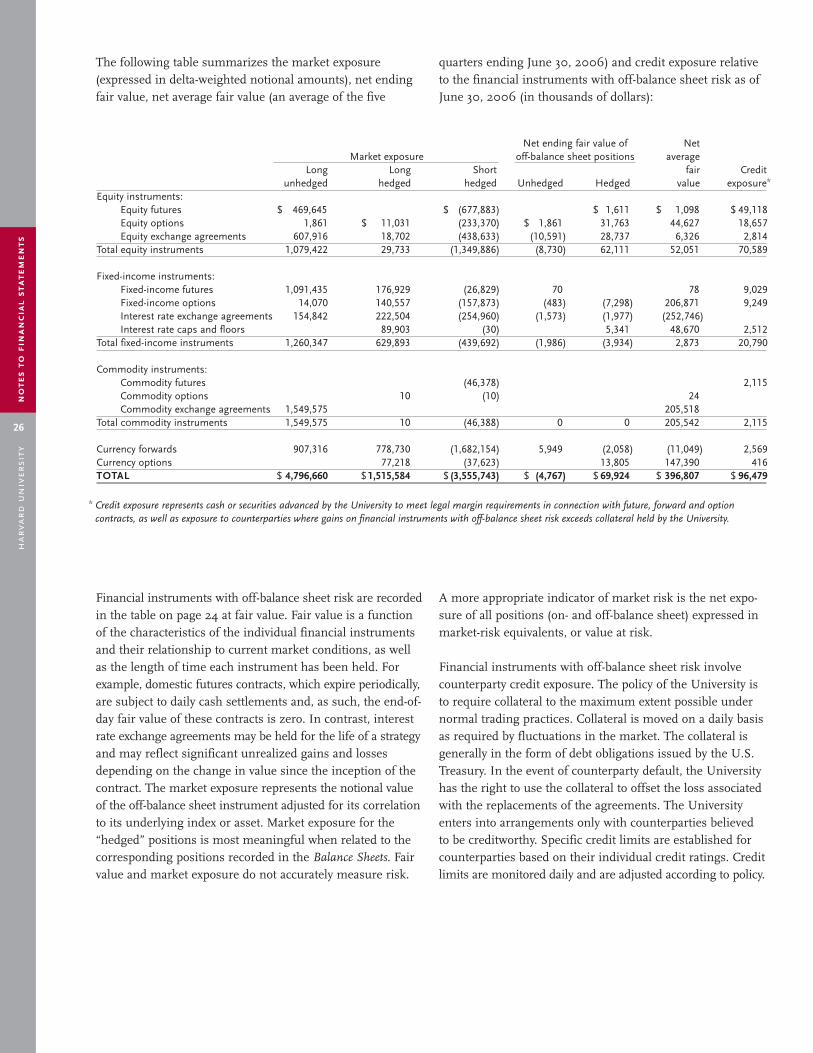
26
ha
rva
rd
un
iver
sity
no
tes
tofi
nan
cial
stat
emen
ts
The following table summarizes the market exposure(expressed in delta-weighted notional amounts), net endingfair value, net average fair value (an average of the five
quarters ending June 30, 2006) and credit exposure relativeto the financial instruments with off-balance sheet risk as ofJune 30, 2006 (in thousands of dollars):
Financial instruments with off-balance sheet risk are recordedin the table on page 24 at fair value. Fair value is a functionof the characteristics of the individual financial instrumentsand their relationship to current market conditions, as wellas the length of time each instrument has been held. Forexample, domestic futures contracts, which expire periodically,are subject to daily cash settlements and, as such, the end-of-day fair value of these contracts is zero. In contrast, interestrate exchange agreements may be held for the life of a strategyand may reflect significant unrealized gains and lossesdepending on the change in value since the inception of thecontract. The market exposure represents the notional valueof the off-balance sheet instrument adjusted for its correlationto its underlying index or asset. Market exposure for the“hedged” positions is most meaningful when related to thecorresponding positions recorded in the Balance Sheets. Fairvalue and market exposure do not accurately measure risk.
A more appropriate indicator of market risk is the net expo-sure of all positions (on- and off-balance sheet) expressed inmarket-risk equivalents, or value at risk.
Financial instruments with off-balance sheet risk involvecounterparty credit exposure. The policy of the University isto require collateral to the maximum extent possible undernormal trading practices. Collateral is moved on a daily basisas required by fluctuations in the market. The collateral isgenerally in the form of debt obligations issued by the U.S.Treasury. In the event of counterparty default, the Universityhas the right to use the collateral to offset the loss associatedwith the replacements of the agreements. The Universityenters into arrangements only with counterparties believedto be creditworthy. Specific credit limits are established forcounterparties based on their individual credit ratings. Creditlimits are monitored daily and are adjusted according to policy.
Net ending fair value of NetMarket exposure off-balance sheet positions average
Long Long Short fair Creditunhedged hedged hedged Unhedged Hedged value exposure*
Equity instruments:Equity futures $ 469,645 $ (677,883) $ 1,611 $ 1,098 $ 49,118Equity options 1,861 $ 11,031 (233,370) $ 1,861 31,763 44,627 18,657Equity exchange agreements 607,916 18,702 (438,633) (10,591) 28,737 6,326 2,814
Total equity instruments 1,079,422 29,733 (1,349,886) (8,730) 62,111 52,051 70,589
Fixed-income instruments:Fixed-income futures 1,091,435 176,929 (26,829) 70 78 9,029Fixed-income options 14,070 140,557 (157,873) (483) (7,298) 206,871 9,249Interest rate exchange agreements 154,842 222,504 (254,960) (1,573) (1,977) (252,746)Interest rate caps and floors 89,903 (30) 5,341 48,670 2,512
Total fixed-income instruments 1,260,347 629,893 (439,692) (1,986) (3,934) 2,873 20,790
Commodity instruments:Commodity futures (46,378) 2,115Commodity options 10 (10) 24Commodity exchange agreements 1,549,575 205,518
Total c0mmodity instruments 1,549,575 10 (46,388) 0 0 205,542 2,115
Currency forwards 907,316 778,730 (1,682,154) 5,949 (2,058) (11,049) 2,569Currency options 77,218 (37,623) 13,805 147,390 416TOTAL $ 4,796,660 $1,515,584 $ (3,555,743) $ (4,767) $ 69,924 $ 396,807 $ 96,479
* Credit exposure represents cash or securities advanced by the University to meet legal margin requirements in connection with future, forward and option contracts, as well as exposure to counterparties where gains on financial instruments with off-balance sheet risk exceeds collateral held by the University.

27
ha
rva
rd
un
iver
sity
no
tes
tofi
nan
cial
stat
emen
ts
The major components of receivables, net of reserves fordoubtful accounts of $3.7 million and $4.1 million as of June30, 2007 and 2006, respectively, were as follows (in thousandsof dollars):
4. receivables2007 2006
Investment income $ 37,724 $ 64,195U.S. Government,
principally related to research 41,072 36,799Non-federal sponsored research 5,677 6,019Tuition and fees 10,246 11,282Publications 23,086 23,162Rent 9,844 17,397Gift receipts 15,246 8,834Executive education 21,615 6,396Other 43,489 48,709TOTAL RECEIVABLES, NET $ 207,999 $ 222,793
The asset allocation of the University’s portfolio involvesexposure to a diverse set of markets. The investments withinthese markets involve various risks such as interest rate,market, sovereign and credit risks. The University antici-pates that the value of its investments may, from time totime, fluctuate substantially as a result of these risks.
The University has also entered into agreements with privateequity and real estate partnerships and external investmentmanagers, which require periodic cash contributions totalingapproximately $8,170.6 million through fiscal 2017.
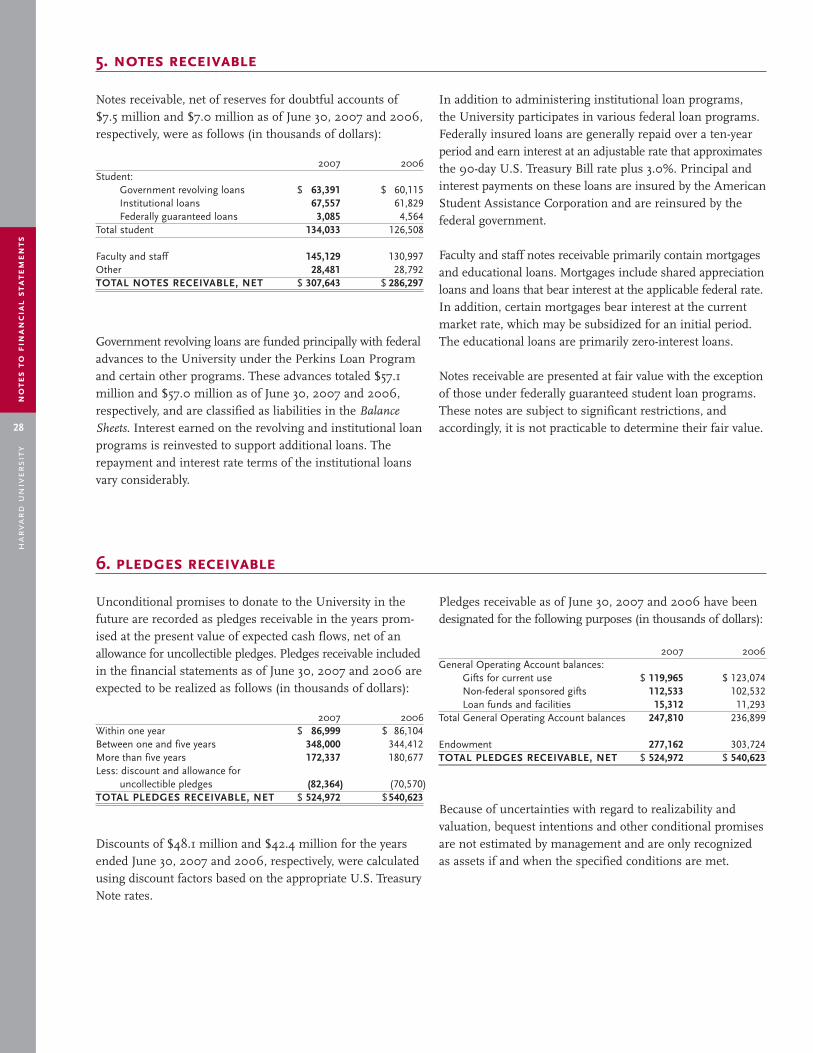
28
ha
rva
rd
un
iver
sity
no
tes
tofi
nan
cial
stat
emen
ts
Notes receivable, net of reserves for doubtful accounts of$7.5 million and $7.0 million as of June 30, 2007 and 2006,respectively, were as follows (in thousands of dollars):
Government revolving loans are funded principally with federaladvances to the University under the Perkins Loan Programand certain other programs. These advances totaled $57.1million and $57.0 million as of June 30, 2007 and 2006,respectively, and are classified as liabilities in the BalanceSheets. Interest earned on the revolving and institutional loanprograms is reinvested to support additional loans. Therepayment and interest rate terms of the institutional loansvary considerably.
In addition to administering institutional loan programs, the University participates in various federal loan programs.Federally insured loans are generally repaid over a ten-yearperiod and earn interest at an adjustable rate that approximatesthe 90-day U.S. Treasury Bill rate plus 3.0%. Principal andinterest payments on these loans are insured by the AmericanStudent Assistance Corporation and are reinsured by the federal government.
Faculty and staff notes receivable primarily contain mortgagesand educational loans. Mortgages include shared appreciationloans and loans that bear interest at the applicable federal rate.In addition, certain mortgages bear interest at the currentmarket rate, which may be subsidized for an initial period.The educational loans are primarily zero-interest loans.
Notes receivable are presented at fair value with the exceptionof those under federally guaranteed student loan programs.These notes are subject to significant restrictions, andaccordingly, it is not practicable to determine their fair value.
5. notes receivable
Unconditional promises to donate to the University in thefuture are recorded as pledges receivable in the years prom-ised at the present value of expected cash flows, net of anallowance for uncollectible pledges. Pledges receivable includedin the financial statements as of June 30, 2007 and 2006 areexpected to be realized as follows (in thousands of dollars):
Discounts of $48.1 million and $42.4 million for the yearsended June 30, 2007 and 2006, respectively, were calculatedusing discount factors based on the appropriate U.S. TreasuryNote rates.
Pledges receivable as of June 30, 2007 and 2006 have beendesignated for the following purposes (in thousands of dollars):
Because of uncertainties with regard to realizability and valuation, bequest intentions and other conditional promisesare not estimated by management and are only recognizedas assets if and when the specified conditions are met.
6. pledges receivable
2007 2006Student:
Government revolving loans $ 63,391 $ 60,115Institutional loans 67,557 61,829Federally guaranteed loans 3,085 4,564
Total student 134,033 126,508
Faculty and staff 145,129 130,997Other 28,481 28,792TOTAL NOTES RECEIVABLE, NET $ 307,643 $ 286,297
2007 2006Within one year $ 86,999 $ 86,104Between one and five years 348,000 344,412More than five years 172,337 180,677Less: discount and allowance for
uncollectible pledges (82,364) (70,570)TOTAL PLEDGES RECEIVABLE, NET $ 524,972 $540,623
2007 2006General Operating Account balances:
Gifts for current use $ 119,965 $ 123,074Non-federal sponsored gifts 112,533 102,532Loan funds and facilities 15,312 11,293
Total General Operating Account balances 247,810 236,899
Endowment 277,162 303,724TOTAL PLEDGES RECEIVABLE, NET $ 524,972 $ 540,623

29
ha
rva
rd
un
iver
sity
no
tes
tofi
nan
cial
stat
emen
ts
Fixed assets are reported at cost or at fair value as of the dateof the gift, net of accumulated depreciation. Depreciation iscomputed using the straight-line method over the estimateduseful lives of the assets.
The major categories of fixed assets as of June 30, 2007 and2006 are summarized as follows (in thousands of dollars):
7. fixed assets
The costs of each research facility are separated into the shell,roof, finishes, fixed equipment and services. These componentsare depreciated separately.
Equipment fixed assets include general and scientific equip-ment, computers, software, furniture and vehicles.
Certain University facilities are subject to restrictions relatedto use, structural modifications and ownership transfer.
Upon adoption of fin 47 on June 30, 2006, the Universityrecognized a conditional asset retirement obligation of $33.3million that is reported as a “Cumulative effect of accountingchanges” in the fiscal 2006 Statement of Changes in Net Assetswith General Operating Account Detail, and as a liability includedin “Deposits and other liabilities” in the Balance Sheets. Theliability is associated with buildings that are fully depreciated,therefore no adjustment was made to the cost of the assets.During fiscal 2007, this obligation was reevaluated, resultingin a $5.2 million increase in the liability.
Estimated useful life2007 2006 (in years)
Research facilities $ 1,480,450 $ 1,323,422 *
Classrooms and offices 1,065,829 1,025,588 35Housing facilities 933,052 844,643 35Libraries 374,231 367,700 35Museums and assembly facilities 254,977 223,637 35Athletic facilities 129,157 127,840 35Service facilities 304,753 294,550 35Other facilities 360,989 374,627 35Land 591,932 558,555 n/aConstruction in progress 585,250 361,056 n/aEquipment 544,314 471,911 **
Total fixed assets, at cost 6,624,934 5,973,529Less: accumulated depreciation (2,100,772) (1,894,993)TOTAL FIXED ASSETS, NET $ 4,524,162 $ 4,078,536
* Estimated useful lives of components range from 10 to 45 years.* * Estimated useful lives of equipment range from 3 to 8 years.

30
ha
rva
rd
un
iver
sity
no
tes
tofi
nan
cial
stat
emen
ts
8. endowment funds
The University’s endowment consists of approximately11,100 separate funds established over many years for a widevariety of purposes. Endowment fund balances, includingfunds functioning as endowment, are classified and reportedas unrestricted, temporarily restricted or permanentlyrestricted net assets in accordance with donor specifications.Net unrealized losses on permanently restricted endowmentfunds are classified as a reduction to unrestricted net assetsuntil such time as the market value equals or exceeds bookvalue. Although funds functioning as endowment are notsubject to permanent donor restrictions, decisions to spendtheir principal require the approval of the Corporation. Allbut a small fraction of the endowment is invested in the gia (Note 3).
The University is also the beneficiary of certain irrevocabletrusts held and administered by others. The estimated fairvalues of trust assets, which approximate the present valuesof expected future cash flows from the trusts, are recognizedas assets and increases in net assets when the required trustdocumentation is provided to the University.
Endowment funds as of June 30, 2007 and 2006 are summarized below (in thousands of dollars):
The University’s endowment distribution policies aredesigned to preserve the value of the endowment in realterms (after inflation) and to generate a predictable stream ofspendable income. Each fall, the Corporation approves theendowment distribution rate (the “endowment distribution”),stated in dollars per unit, for the following fiscal year. Theendowment distribution is not based on a specific formula,nor is it directly tied to current investment returns. Rather, it reflects expectations about long-term returns, inflationrates and the University’s ongoing spending needs. For fiscal2007, the per unit endowment distribution approved by theCorporation (prior to decapitalizations described below) wasequal to 4.3% of market value as of the beginning of the fiscal year.
In addition to the endowment distribution, the Corporationapproves certain decapitalizations from the endowment tosupport strategic, mission-critical activities or objectives thatare typically one-time or time-limited. During fiscal 2007,these additional decapitalizations, in combination with theendowment distribution, resulted in an aggregate spendingrate of 4.6%. The following table displays for each of the pastfive years the total return on endowment, the endowmentdistribution rate per unit and as a percentage of market valueas of the beginning of each fiscal year, and the aggregatespending rate (inclusive of decapitalizations).
Endowment investments are managed to achieve the maxi-mum long-term total return. As a result of this emphasis ontotal return, the proportion of endowment distributionsfunded by dividend and interest income or by capital gainsmay vary significantly from year to year. Amounts withdrawnfrom endowment capital gains to fund the fiscal 2007 and2006 distributions totaled $709.7 million and $685.0 million,respectively.
Endowment income capitalized to endowment principal isavailable to meet future spending needs, subject to the approvalof the Corporation.
2007 2006Temporarily Permanently
Unrestricted restricted restricted Total TotalEndowment funds $ 21,663,975 $ 3,815,240 $ 25,479,215 $ 21,369,630Funds functioning as endowment $ 5,796,425 3,031,002 8,827,427 7,246,260Pledge balances 57,199 219,963 277,162 303,724Interests in trusts held by others 27,125 301,139 328,264 299,816TOTAL ENDOWMENT FUNDS $ 5,796,425 $ 24,779,301 $ 4,336,342 $ 34,912,068 $ 29,219,430
AggregateDistribution rate2 spending rate3
Fiscal Endowment As a % of As a % ofyear total return %1 Per unit market value market value2007 23.0% $ 69.73 4.3% 4.6%2006 16.7 60.99 4.3 4.22005 19.2 54.17 4.5 4.52004 21.1 49.70 4.9 4.92003 12.5 47.11 5.1 5.2
1 The endowment total return % is calculated in relation to pooled general investments, is net of all expenses and fees, and includes the impact of revenue-sharing agreements with certain fund managers.
2 This data is based upon the per unit distribution rate established by the Corporation for each fiscal year.
3 Aggregate spending rate percentages are based upon actual endowment distributions in combination with approved decapitalizations of endowment principal made during the fiscal year.
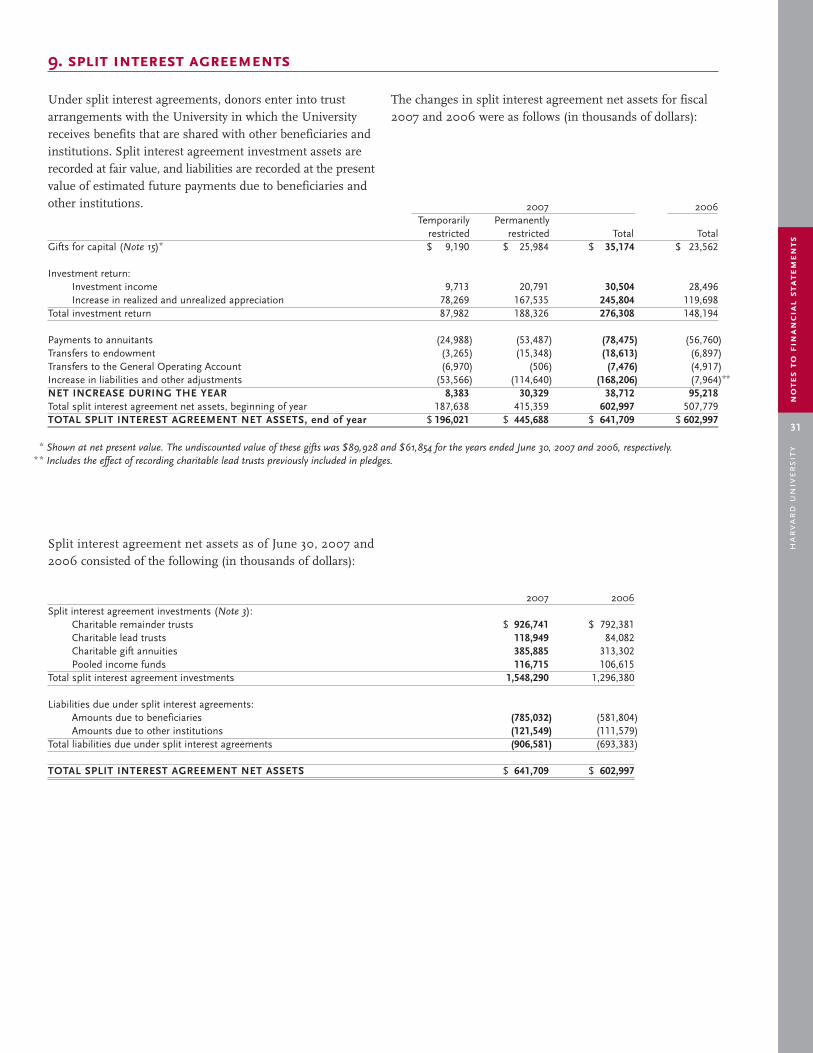
31
ha
rva
rd
un
iver
sity
no
tes
tofi
nan
cial
stat
emen
ts
Under split interest agreements, donors enter into trustarrangements with the University in which the Universityreceives benefits that are shared with other beneficiaries andinstitutions. Split interest agreement investment assets arerecorded at fair value, and liabilities are recorded at the presentvalue of estimated future payments due to beneficiaries andother institutions.
The changes in split interest agreement net assets for fiscal2007 and 2006 were as follows (in thousands of dollars):
9. split interest agreements
Split interest agreement net assets as of June 30, 2007 and2006 consisted of the following (in thousands of dollars):
2007 2006Temporarily Permanently
restricted restricted Total TotalGifts for capital (Note 15)* $ 9,190 $ 25,984 $ 35,174 $ 23,562
Investment return:Investment income 9,713 20,791 30,504 28,496Increase in realized and unrealized appreciation 78,269 167,535 245,804 119,698
Total investment return 87,982 188,326 276,308 148,194
Payments to annuitants (24,988) (53,487) (78,475) (56,760)Transfers to endowment (3,265) (15,348) (18,613) (6,897)Transfers to the General Operating Account (6,970) (506) (7,476) (4,917)Increase in liabilities and other adjustments (53,566) (114,640) (168,206) (7,964)**
NET INCREASE DURING THE YEAR 8,383 30,329 38,712 95,218Total split interest agreement net assets, beginning of year 187,638 415,359 602,997 507,779TOTAL SPLIT INTEREST AGREEMENT NET ASSETS, end of year $ 196,021 $ 445,688 $ 641,709 $ 602,997
2007 2006Split interest agreement investments (Note 3):
Charitable remainder trusts $ 926,741 $ 792,381Charitable lead trusts 118,949 84,082Charitable gift annuities 385,885 313,302Pooled income funds 116,715 106,615
Total split interest agreement investments 1,548,290 1,296,380
Liabilities due under split interest agreements:Amounts due to beneficiaries (785,032) (581,804)Amounts due to other institutions (121,549) (111,579)
Total liabilities due under split interest agreements (906,581) (693,383)
TOTAL SPLIT INTEREST AGREEMENT NET ASSETS $ 641,709 $ 602,997
* Shown at net present value. The undiscounted value of these gifts was $89,928 and $61,854 for the years ended June 30, 2007 and 2006, respectively.* * Includes the effect of recording charitable lead trusts previously included in pledges.

32
ha
rva
rd
un
iver
sity
no
tes
tofi
nan
cial
stat
emen
ts
Bonds and notes payable as of June 30, 2007 and 2006 wereas follows (in thousands of dollars):
10. bonds and notes payable
Interest expense, recorded in both the “Space and occupancy”and “Other expenses” lines of the Statements of Changes inNet Assets with General Operating Account Detail, was $162.8million and $124.9 million for fiscal 2007 and 2006, respec-tively. Excluding maturity of commercial paper and other notespayable, as well as unamortized discounts and premiums,scheduled principal payments are (in thousands of dollars):
Remaining One-yearFiscal year years to effective Outstanding principal
of issue maturity interest rate 2007 2006Tax-exempt bonds and notes payable:
Variable-rate bonds and notes payable:Series L - weekly 1990 17 4.8% $ 71,140 $ 71,140Series R - daily 2000–2006 42 3.5 131,200 131,200Series Y - weekly 2000 28 5.1 117,905 117,905Series BB - weekly 2001 27 3.6 196,700 196,700Series HH - weekly 2004 26 4.8 92,235 92,235Series GG1 - weekly 2005 22 4.4 205,935 205,935Series 2006B1 - daily 2007 29 3.3 112,900Series 2006B2 - weekly 2007 29 3.4 112,900Commercial paper Various Various** 3.6 546,895 189,162
Total variable-rate bonds and notes payable 3.9 1,587,810 1,004,277
Fixed-rate bonds:Series N 1992 13 6.3 79,002* 78,925Series P 1995 n/a 5.0 1,335Series Z 2001 9 5.1 85,413* 93,838Series AA 2001 2 5.5 10,213* 15,171Series DD 2002 28 5.0 134,949* 134,917Series FF 2003 30 5.1 275,984* 275,979Series 2005A 2005 29 5.0 93,877* 94,041Series 2005B 2006 25 5.0 105,234* 105,422Series 2005C 2006 28 5.0 130,155* 130,312
Total fixed-rate bonds 5.2 914,827 929,940
Total tax-exempt bonds and notes payable 4.4 2,502,637 1,934,217
Taxable bonds and notes payable:Commercial paper Various Various** 5.7 807,079 329,224Fixed-rate bonds 1992 n/a 8.1 115,000Series GG2 2005 6 4.5 45,745 52,250Series 2006A 2006 30 6.3 401,350* 401,329
Total taxable bonds and notes payable 6.0 1,254,174 897,803
Other notes payable Various 3-15 Various 90,167 90,227TOTAL BONDS AND NOTES PAYABLE 4.9% $ 3,846,978 $ 2,922,247
Fiscal year Principal payments2008 $ 19,5702009 20,3452010 16,1402011 16,9002012 17,765Thereafter 2,299,460TOTAL PRINCIPAL PAYMENTS $ 2,390,180
* Series N, DD, FF and 2006A principal are net of $1.0 million, $0.9 million, $0.2 million and $0.7 million of discounts, respectively. Series Z, AA, 2005A, 2005B and 2005C principal include premiums of $1.4 million, $0.4 million, $4.8 million, $4.7 million and $4.2 million, respectively.
* * All commercial paper will mature in fiscal 2008.

33
ha
rva
rd
un
iver
sity
no
tes
tofi
nan
cial
stat
emen
ts
In fiscal 2007, the University reauthorized and increased thecapacity of its taxable commercial paper program to $1.0 billion from $650.0 million. In July 2007, the Universitypaid down $238.0 million of taxable commercial paper. As ofJuly 31, 2007, the balance outstanding was $571.3 million.Also in fiscal 2007, the University issued $225.8 million oftax-exempt daily and weekly variable-rate reset Series 2006Bbonds to finance graduate housing.
In fiscal 2006, the University issued $105.6 million of Series2005B bonds. The Series 2005B bonds refunded $102.1 million of Series P bonds and will mature in 2032. Also infiscal 2006, the University issued $130.5 million of tax-exemptfixed-rate Series 2005C bonds and $401.3 million of taxablefixed-rate Series 2006A bonds, which were used in part toredeem the University’s outstanding Series CC bonds.
An $11.3 million loss resulting from the fiscal 2006 refundingof Series P bonds and the refinancing of Series CC bonds isreflected in the “Other changes” line of the Statements ofChanges in Net Assets with General Operating Account Detail.
In fiscal 2006, the seventh tranche of Series R currentrefunding bonds was issued. This tranche totaled $14.0 million and brought the total amount outstanding under thisseries to $131.2 million. These bonds, which are in a dailyvariable-rate reset mode, represent a current refunding oftax-exempt principal payments made throughout the calendaryear. Also in fiscal 2006, the University reauthorized itsexisting tax-exempt commercial paper program. With thisaction, the authorized limit on the program was raised from$650.0 million to $1.0 billion.
Based on quoted market prices, the estimated fair value ofthe University’s outstanding bonds and notes payable,including accrued interest, was $3,813.3 million and $2,887.1million as of June 30, 2007 and 2006, respectively.
In the event that the University receives notice of any optionaltender on its variable-rate bonds, or if the bonds becomesubject to mandatory tender, the purchase price of the bondswill be paid from the remarketing of such bonds. However, ifthe remarketing proceeds are insufficient, the University willhave a general obligation to purchase the bonds tendered.
Interest rate exchange agreements The University has entered into various interest rate exchangeagreements (interest rate swaps) in order to convert variable-rate borrowings to a fixed rate, thereby managing the interestcost and risk associated with its outstanding debt. The interestrate exchange agreements were not entered into for tradingor speculative purposes. Under the terms of these agreements,the University pays a fixed rate, determined at inception, andreceives a variable rate on the respective notional principalamounts. Each of these exchanges is collateralized, as describedin Note 3. The interest rates in the preceding schedule reflectany applicable exchange agreements.
The fair value of interest rate exchange agreements is theestimated amount that the University would have received or(paid), including accrued interest, to terminate the agreementson the dates of the Balance Sheets, taking into account thecreditworthiness of the underlying counterparties. Thenotional amount and fair value of interest rate exchangeagreements were $3,533.9 million and $(13.3) million, respec-tively, as of June 30, 2007 and $3,542.6 million and $(17.9)million, respectively, as of June 30, 2006.
The fair value of these agreements is included in the“Investment portfolio, at market” line in the Balance Sheets.The loss realized from the monthly settling of these agree-ments was $7.9 million and $18.5 million for fiscal 2007 and2006, respectively. All unrealized and realized gains andlosses from interest rate exchange agreements are includedin the “Increase in appreciation, net of operating distribution”line in the Statements of Changes in Net Assets with GeneralOperating Account Detail.

34
ha
rva
rd
un
iver
sity
no
tes
tofi
nan
cial
stat
emen
ts
The University offers current employees a choice of healthplans, a dental plan, short-term and long-term disabilityplans, life insurance, tuition assistance and a variety of otherbenefits, such as subsidized passes for public transportationand for Harvard athletic facilities. In addition, the Universityhas pension plans covering substantially all employees.
The University uses a measurement date of June 30 for itspension and postretirement health plans.
Pension benefitsFaculty members and certain long service administrative officers participate in defined contribution plans that arefunded on a current basis. All staff and hourly employees arecovered by a retirement program that includes a defined benefit component, a defined contribution component, or a combination of the two.
In accordance with erisa requirements, the University hasestablished a trust to hold plan assets for its defined benefitpension plans. The market values of the trust’s assets were
$897.0 million and $776.4 million as of June 30, 2007 and2006, respectively. In addition, the University had internallydesignated and invested $36.7 million and $35.1 million as ofJune 30, 2007 and 2006, respectively, for its defined benefitpension plans. The University recorded expenses for itsdefined contribution plans of $87.4 million and $79.3 millionfor fiscal 2007 and 2006, respectively.
Postretirement health benefits The University provides defined benefit postretirementhealth coverage and life insurance to substantially all of itsemployees. As of June 30, 2007, the University had internallydesignated and invested $206.7 million to fund the postre-tirement health benefit accrued liability of $545.7 million. Asof June 30, 2006, the University had internally designatedand invested $157.9 million to fund an accrued liability of $441.5 million.
The following table provides a reconciliation of the benefitobligation for the University for fiscal 2007 and 2006 (inthousands of dollars):
11. employee benefits
PostretirementPension benefits health benefits2007 2006 2007 2006
Reconciliation of benefit obligation:Benefit obligation, beginning of year $ 583,501 $ 632,362 $ 505,104 $ 520,746Service cost 12,819 14,580 23,353 27,724Interest cost 37,399 33,135 31,822 29,039Plan participants’ contributions n/a n/a 1,819 1,593Federal subsidy on benefits paid n/a n/a 1,231 n/aGross benefits paid (39,298) (38,849) (17,829) (14,332)Actuarial (gain)/loss (739) (57,727) 198 (59,666)
BENEFIT OBLIGATION, end of year $ 593,682 $ 583,501 $ 545,698 $ 505,104
Accumulated benefit obligation $ 511,923 $ 507,476 n/a n/a
Weighted-average assumptions used to determine benefit obligationat end of year:
Discount rate 6.25% 6.25% 6.25% 6.25%Rate of compensation increase 4.00% 4.00% 4.00% 4.00%Health care cost trend rate:
– Initial rate n/a n/a 9.00% 8.00%– Ultimate rate n/a n/a 5.00% 5.00%– Years to ultimate rate n/a n/a 4 3
Effect of one-percentage-point change in assumed health care cost trend rate on postretirement benefit obligation:
– Increase n/a n/a $ 95,593 $ 95,979– Decrease n/a n/a $ (76,066) $ (75,385)
The following table provides a reconciliation of the fair valueof plan assets for the University as of June 30, 2007 and2006 (in thousands of dollars): Postretirement
Pension benefits health benefits2007 2006 2007 2006
Reconciliation of fair value of plan assets:Fair value of plan assets, beginning of year $ 776,442 $ 709,639 $ 0 $ 0Actual return on plan assets 159,820 105,652Gross benefits paid (39,298) (38,849)
FAIR VALUE OF PLAN ASSETS, end of year $ 896,964 $ 776,442 $ 0 $ 0

35
ha
rva
rd
un
iver
sity
no
tes
tofi
nan
cial
stat
emen
ts
The actual asset allocation of the investment portfolio for thepension plan for fiscal 2007 and 2006, along with targetallocations for fiscal 2008, are as follows:
2008 Target 2007 Actual 2006 ActualAsset allocation by category for pension plan:
Equity securities 44.0% 48.1% 53.3%Debt securities 18.0 21.1 20.4Real estate 10.0 6.9 9.6Other 28.0 23.9 16.7
TOTAL OF ALL ASSET CATEGORIES 100.0% 100.0% 100.0%
The University’s investment strategy for the pension portfoliois to manage the assets across a broad and diversified rangeof investment categories, both domestic and international.The objective is to achieve a risk-adjusted return that is inline with the long-term obligations that the University has tothe pension plan beneficiaries. The investment program is also managed to comply with all erisa regulations. The
“Other” asset category consists of absolute return funds,commodities and cash.
The following tables provide the funded status at the end ofthe year and the related amounts recognized in the BalanceSheets for the University for fiscal 2007 and 2006 (in thou-sands of dollars):
PostretirementPension benefits health benefits2007 2006 2007 2006
Funded status and amounts recognized, end of year:Fair value of plan assets $ 896,964 $ 776,442Benefit obligation (593,682) (583,501) $ (545,698) $(505,104)
FUNDED STATUS, end of year 303,282 192,941 (545,698) (505,104)
Unrecognized net actuarial (gain)/loss n/a (204,142) n/a 12,365Unrecognized prior service (credit)/cost n/a (23,911) n/a 8,816Unrecognized transition (asset)/obligation n/a n/a 42,435AMOUNTS RECOGNIZED, end of year $ 303,282 $ (35,112) $ (545,698) $ (441,488)
Amounts recognized in the Balance Sheets consist of:Net retirement assets $ 303,282Accrued retirement obligations $ (35,112) $ (545,698) $(441,488)
TOTAL AMOUNTS RECOGNIZED IN THE BALANCE SHEETS $ 303,282 $ (35,112) $ (545,698) $ (441,488)
Amounts recognized in unrestricted net assets consist of:Net actuarial (gain)/loss $ (320,749) n/a $ (14,521) n/aPrior service (credit)/cost (19,215) n/a 6,770 n/aTransition (asset)/obligation n/a 36,373 n/a
TOTAL AMOUNTS RECOGNIZED IN UNRESTRICTED NET ASSETS $ (339,964) n/a $ 28,622 n/a
There are no expected employer contributions for fiscal 2008 to funded pension or other postretirement health benefitplans. The following table summarizes expected benefit pay-ments and subsidies for pension and other postretirementhealth benefits for the University (in thousands of dollars):
Expected benefit paymentsPostretirement Expected Medicare
Fiscal year Pension health Part D subsidies2008 $ 38,062 $ 22,782 $ 2,8322009 38,780 24,796 3,0892010 39,589 26,819 3,3522011 40,502 28,688 3,6172012 41,349 30,294 3,8952013–2017 221,045 178,321 23,970

36
ha
rva
rd
un
iver
sity
no
tes
tofi
nan
cial
stat
emen
ts
The following table summarizes the net periodic benefit(income)/cost for the University for fiscal 2007 and 2006 (in thousands of dollars):
PostretirementPension benefits health benefits2007 2006 2007 2006
Components of net periodic benefit (income)/cost:Service cost $ 12,819 $ 14,580 $ 23,353 $ 27,724Interest cost 37,399 33,135 31,822 29,039Expected return on plan assets (48,512) (47,434) (10,111) (9,360)Amortization of the:
Actuarial (gain)/loss (2,857) 1,254 (77) 4,602Prior service (credit)/cost (4,696) (5,305) 2,046 2,046Transition (asset)/obligation 6,062 6,062
Net periodic benefit (income)/cost (5,847) (3,770) 53,095 60,113
Additional designated funding 7,417 14,308 22,493 9,550TOTAL NET PERIODIC BENEFIT (INCOME)/COST $ 1,570 $ 10,538 $ 75,588 $ 69,663
Weighted-average assumptions used to determine net periodic benefit (income)/cost:
Discount rate 6.25% 5.25% 6.25% 5.25%Expected long-term rate of return on plan assets 7.50% 8.00% 7.50% 8.00%Rate of compensation increase 4.00% 4.00% 4.00% 4.00%Health care cost trend rate:
– Initial rate n/a n/a 8.00% 9.00%– Ultimate rate n/a n/a 5.00% 5.00%– Years to ultimate rate n/a n/a 3 4
Effect of one-percentage-point change in assumed health care cost trend rate on aggregate service and interest cost:
– Increase n/a n/a $ 12,607 $ 14,270– Decrease n/a n/a $ (9,664) $ (10,758)
The expected long-term rate of return on pension plan assetsis determined by utilizing hmc’s capital markets model,which takes into account the expected real return, beforeinflation, for each of the pension portfolio’s asset classes, aswell as the correlation of any one asset class to every otherasset class. This model calculates the real returns and corre-lations and derives an expected real return for the entireportfolio, given the percentage weighting allocated to eachasset class. After calculating the expected real return, an
assessment is made to accommodate the expected inflationrate for the forthcoming period. The final expected return onassets is the aggregate of the expected real return plus theexpected inflation rate.
The estimated amounts that will be amortized from unrestricted net assets into net periodic benefit cost in fiscal2008 are as follows (in thousands of dollars):
PostretirementPension benefits health benefits
Amounts amortized:Actuarial (gain)/loss $ (4,456) $ (225)Prior service (credit)/cost (4,375) 1,796Transition (asset)/obligation 6,062
TOTAL AMOUNTS AMORTIZED $ (8,831) $ 7,633

37
ha
rva
rd
un
iver
sity
no
tes
tofi
nan
cial
stat
emen
ts
The University’s adoption of fas 158, discussed in Note 2,had the following incremental effect on retirement benefit-related amounts reported in the Balance Sheet as of June 30,2007 (in thousands of dollars):
Balances before Adjustments to Balances afteradopting fas 158 adopt fas 158 adopting fas 158
Impact of fas 158 implementation on the Balance Sheet as of June 30, 2007:
Net retirement assets $ 0 $ 303,282 $ 303,282Accrued retirement obligations 553,758 (8,060) 545,698Unrestricted net assets 10,687,034 311,342* 10,998,376
* The $311.3 million change in unrestricted net assets is included in the “Cumulative effect of accounting changes” line in the fiscal 2007 Statement of Changes in Net Assets with General Operating Account Detail.
The General Operating Account (goa) consists of the generalor current funds of the University as well as the assets andliabilities related to student and faculty loans and facilities.The goa accepts, manages and pays interest on depositsmade by University departments, invests surplus workingcapital, makes loans and arranges external financing for majorcapital projects. It is used to manage, control and execute allUniversity financial transactions, except for those related toinvestment activities conducted by hmc.
The major components of the goa net asset balances as ofJune 30, 2007 and 2006 are summarized as follows (inthousands of dollars):
12. general operating account
2007 2006Temporarily Permanently
Unrestricted restricted restricted Total TotalDepartmental balances:
Unexpended endowment income $ 118,379 $ 554,725 $ 673,104 $ 710,004Unexpended gift balances 59,402 238,318 297,720 289,053Pledge balances 223,469 223,469 212,706Interests in trusts held by others 25,037 25,037 17,043Loan funds 29,960 $ 86,156 116,116 115,963Funds for construction 13,171 13,171 17,756Funds invested in fixed assets 1,360,383 1,360,383 1,229,612Other departmental purposes 666,885 666,885 335,522
Total departmental balances 2,235,009 1,054,720 86,156 3,375,885 2,927,659
University balances* 2,966,942 95,784 3,062,726 2,188,413TOTAL GOA NET ASSET BALANCES $ 5,201,951 $1,150,504 $ 86,156 $ 6,438,611 $ 5,116,072
* Includes interests in trusts held by others of $4,993 and $4,131 for the years ended June 30, 2007 and 2006, respectively.

38
ha
rva
rd
un
iver
sity
no
tes
tofi
nan
cial
stat
emen
ts
Financial aid granted to students in fiscal 2007 and 2006 issummarized as follows (in thousands of dollars):
Approximately 65% of total scholarships and other studentawards was funded by gifts, endowment income and spon-sored support in both fiscal 2007 and 2006.
13. student financial aid
Total expenditures funded by U.S. government sponsors orby institutions that subcontract federally sponsored researchto the University were $514.8 million and $518.0 million infiscal 2007 and 2006, respectively. The University’s principalsource of federal research funds is the Department of Healthand Human Services. The University also has many non-federal sources of sponsored awards and grants, includingcorporations, foundations, state and local governments, foreign governments and research institutes.
Research grants and contracts normally provide for therecovery of direct and indirect costs. The University recognizesrevenue associated with direct costs as the related costs are
incurred. Recovery of related indirect costs is generallyrecorded at fixed or predetermined rates negotiated with thefederal government and other sponsors. Predetermined federalindirect cost rates have been established for the UniversityArea, the Medical School (including the School of DentalMedicine) and the School of Public Health through fiscal2010. Funds received for federally sponsored research activityare subject to audit.
14. sponsored research
Gifts that are available for current purposes are classified aseither “Gifts for current use” or “Non-federal sponsoredresearch grants,” as appropriate. Gifts that have been restrictedby the donor or designated by the Corporation for facilities,loan funds, endowment or similar purposes are classified as“Gifts for capital.” Gifts for current use, non-federal spon-sored research grants and gifts for capital are classified asunrestricted, temporarily restricted or permanently restrictednet assets in accordance with donor specifications.
Gifts received for the years ended June 30, 2007 and 2006are summarized as follows (in thousands of dollars):
15. gifts
2007 2006Scholarships and other student awards:
Scholarships applied to student income $ 230,562 $ 205,957Scholarships and other student awards paid directly to students 108,588 99,574
Total scholarships and other student awards 339,150 305,531
Student employment 61,233 59,260Student loans 30,553 30,315Agency financial aid* 12,887 13,948TOTAL STUDENT FINANCIAL AID $ 443,823 $ 409,054
2007 2006Gifts for current use $ 213,994 $ 201,946Non-federal sponsored research grants 82,656 80,792
Gifts for capital:Endowment funds 277,626 273,381Split interest agreements* 35,174 23,562Loan funds and facilities 5,596 16,150
Total gifts for capital 318,396 313,093TOTAL GIFTS $ 615,046 $ 595,831
* Represents aid from sponsors for which the University acts as an agent for the recipient.
* Shown at net present value. The undiscounted value of these gifts was $89,928and $61,854 for the years ended June 30, 2007 and 2006, respectively.

39
ha
rva
rd
un
iver
sity
no
tes
tofi
nan
cial
stat
emen
ts
The major components of other operating income for the yearsended June 30, 2007 and 2006 were as follows (in thousandsof dollars):
16. other operating income
The major components of other expenses for the years ended June 30, 2007 and 2006 were as follows (in thousandsof dollars):
17. other expenses
Expenses are allocated functionally on a direct basis. Interest,depreciation, and operations and maintenance expenses areallocated based on square footage.
Expenses by functional classification for the years ended June30, 2007 and 2006 were as follows (in thousands of dollars):
18. functional classification of expenses
2007 2006Rental and parking $ 133,977 $ 112,629Publications 86,909 80,819Royalties from patents, copyrights
and trademarks 64,490 64,398Services income 48,188 50,116Sales income 42,148 46,147Non-student health and clinic fees 24,340 23,981Other student income 22,170 21,181Other 66,351 54,594TOTAL OTHER OPERATING INCOME $ 488,573 $ 453,865
2007 2006Services purchased $ 343,160 $ 345,780Subcontract expenses under
sponsored projects 90,304 87,390Travel 66,640 60,315Publishing 51,740 51,583Advertising 28,035 26,045Taxes and fees 21,586 21,128Interest 21,390 10,550Postage 14,948 13,921Insurance 13,554 9,596Telephone 11,408 11,032Other 18,103 14,895TOTAL OTHER EXPENSES $ 680,868 $ 652,235
2007 2006Instruction $ 883,010 $ 788,715Research 559,314 562,827Libraries 197,939 183,611Academic support 349,504 349,071Scholarships and other student awards 108,588 99,574Student services 111,976 104,857Institutional support 562,255 552,376Auxiliary services 398,064 358,472TOTAL EXPENSES $ 3,170,650 $ 2,999,503

40
ha
rva
rd
un
iver
sity
no
tes
tofi
nan
cial
stat
emen
ts
Sponsored supportThe University receives funding from government agenciesand private entities for research and other sponsored activitiesconducted under grants and contracts. These grants and contracts provide for reimbursement of direct and indirectcosts. The costs recovered by the University in support ofsponsored research are subject to audit and adjustment.
Lease commitmentsThe University is the lessee of equipment and land underoperating (rental) and capital leases. Rent expense related tothese leases was $4.5 million and $4.1 million in fiscal 2007and 2006, respectively. Future minimum payments underthese operating and capital leases are as follows (in thousandsof dollars):
Joint ventureIn the spring of 2004, the University together with theHarvard-affiliated teaching hospitals, the MassachusettsInstitute of Technology (mit) and the Whitehead Institute for Biomedical Research established the Eli and Edythe L.Broad Institute (the “Broad Institute”). The Broad Institute isa collaborative biomedical research institute that is jointlygoverned by the University, mit and the Broad Foundation.The Broad Institute is focused on applying knowledge of thehuman genome to clinical medicine and making suchknowledge widely available to the scientific community.
In connection with the founding of the Broad Institute, theUniversity and mit agreed to strive to jointly raise $20.0 million per year in gifts and non-federal grants and awardsto support the Broad Institute’s endeavors. In the event thisfundraising goal is not reached, the University has agreed toprovide mit with a portion of the shortfall, subject to certainconditions. The University will make payments and recordthe corresponding expenses as these conditions are met. TheUniversity’s obligation for such payments will not exceed$32.5 million over the initial five-year term, or $60.0 millionin total if the term is extended for a second five years. TheUniversity had a commitment of $6.5 million and $9.0 millionas of June 30, 2007 and 2006, respectively, which wasrecorded in “Accounts payable” in the Balance Sheets.
Operating Capital2008 $ 4,603 $ 5822009 3,344 5822010 1,955 2,1942011 1,320 4612012 973 499Thereafter 17,862TOTAL FUTURE MINIMUM PAYMENTS $ 12,195 $ 22,180
The University and mit will equally share certain laboratoryconstruction fit-out costs for the Broad Institute’s building.The University’s portion of these costs is limited to $13.0million. Payments to mit under this commitment totaled$1.2 million and $6.8 million in fiscal 2007 and 2006,respectively. If the University’s participation in the collabora-tion terminates under certain circumstances, the Universitymay also be obligated to pay mit up to $5.0 million to com-pensate mit for expenses incurred in connection with thelease for the new building. In addition, the Universityexpects to share with mit in ongoing facilities improvementcosts of approximately $4.0 million per year for up to tenyears. Payments to mit under this commitment totaled $1.1million and $2.8 million in fiscal 2007 and 2006, respec-tively. Some of the University’s contributions to the fit-outand ongoing capital costs have been and will continue to bereimbursed in the future through indirect cost recoveriesassociated with the Broad Institute’s grant funding.
Future constructionThe University has various commitments for capital projectsrelated to its ongoing campus planning, academic andother initiatives.
Environmental remediationThe University is subject to laws and regulations concerningenvironmental remediation and has established reservesfor potential obligations that management considers to beprobable and for which reasonable estimates can be made.These estimates may change substantially depending on newinformation regarding the nature and extent of contamination,appropriate remediation technologies and regulatory approvals.Costs of future expenditures for environmental remediationhave not been discounted to their net present value. Manage-ment is not aware of any existing conditions that it currentlybelieves are likely to have a material adverse effect on theUniversity’s financial position, changes in net assets or cash flows.
GeneralThe University is a defendant in various legal actions arisingout of the normal course of its operations. While it is notpossible to predict accurately or determine the eventual outcome of such actions, management believes that the out-come of these proceedings will not have a material adverseeffect on the University’s financial position, changes in netassets or cash flows.
19. commitments and contingencies

PRESIDENT ANDFELLOWS OF HARVARDCOLLEGE
drew gilpin faustPresident
james f. rothenbergTreasurer
james r. houghtonnannerl o. keohanepatricia a. kingrobert d. reischauerrobert e. rubin
BOARD OF OVERSEERS
mitchell l. adamsalan d. bersinhelen m. blauronald cohenmichael f. croninarne s. duncansandra m. faberleila fawazroger w. ferguson, jr.frances d. fergussonlucy fisherann m. fudgemerrick b. garlandgerald r. jordan, jr.william f. leerichard i. melvoinrichard a. meservepenny pritzkeremily rauh pulitzerlisbet rausingrichard r. schrockjaime sepulveda amorrobert n. shapirojoan a. steitzthomas f. stephensonsusan s. wallachleah zell wangerseth p. waxmanstephanie d. wilsonpauline yu
drew gilpin faustex officio
james f. rothenbergex officio
OFFICERS
drew gilpin faustPresident
james f. rothenbergTreasurer
steven e. hymanProvost
marc goodheartSecretary
robert cashionActing Vice President for AlumniAffairs and Development
marilyn hausammannVice President for HumanResources
robert w. iulianoVice President and GeneralCounsel
elizabeth moraVice President for Finance andChief Financial Officer
a. clayton spencerVice President for Policy
alan j. stoneVice President for Government,Community and Public Affairs
sally h. zeckhauserVice President for Administration
photography:
front cover: Archway at Annenberg Hall, model from the
Allston room: Kris Snibbe, Harvard University News Office;
Professor Doug Melton’s laboratory: Gus Freedman; Wind
turbine at Hull, MA: Rose Lincoln, Harvard University
News Office
inside front cover: Jon Chase, Harvard University News Office
concept and design:
Sametz Blackstone Associates, Boston
“I look forward to our future adventures together with immense anticipation.
I can imagine no higher calling than doing all I can to serve this great university
—and helping it, in turn, to serve the world. And I feel singularly fortunate to
have the opportunity to do so in concert with all of you—the faculty, students,
staff, and others without whom there could be no Harvard.
Each of us brings something different, and something significant, to our shared
enterprise. We teach, we study, we discover, we create, we make sure the lights
go on and the bills get paid. We are individual members of a collective whose
opportunity to contribute to the future of learning, and the improvement of
the human condition, knows few equals and few bounds. That opportunity is
ours to make the most of—by aiming relentlessly high, by challenging each
other and ourselves, by bridging our differences, and by drawing strength but
never self-satisfaction from the past on which we are privileged to build.
”
Former President Derek Bok and President DrewGilpin Faust await the June 2007 Commencement DayAlumni Parade on the steps of Widener Library.
—Drew Gilpin Faust, July 2, 2007

harvard universityfinancial report
fiscal year 2007
harvard
un
iversity finan
cial report
2007