financial report - harvard...
TRANSCRIPT

financial reportFISCAL YEAR 2016

tabl
e o
f co
nte
nts 2 messagefromthepresident
3 financialoverview
8 aletterfromthepresidentandceo
ofharvardmanagementcompany
13 reportofindependentauditors
14 financialstatements
18 notestofinancialstatements

2
ha
rva
rd
un
iver
sity
mes
sag
e fr
om
th
e pr
esid
ent
I write to report on Harvard University’s financial results for fiscal year 2016.
The past year was one of great progress in pursuit of our academic mission and shared goals as a community. Investments in Harvard’s intellectual resources and physical spaces have strengthened the institution and positioned us well for the future.
Yet we must situate our achievements, as always, in a broader context. American higher education is entering an era of constrained financial circumstances. Colleges and universities across the country are facing challenging endowment returns and intense pressures on both federal research funding and tuition revenue. Long-anticipated shifts across the sector have arrived, and they have the potential to alter fundamentally the ways in which teaching, learning, and research are accomplished.
In recent years, prudent financial management and better processes for budget planning have strengthened the University, and The Harvard Campaign, now in its fourth year, has been an outstanding success. While it will not shield us from emerging financial realities, it has played an important role in the pursuit of our teaching and research mission. It has energized alumni and friends, and attracted the extraordinary generosity of more than 133,000 donors around the world.
Our efforts have made the University more accessible not just for would-be students, but for eager learners across the globe. We have increased support for financial aid for students across campus by more than $820 million, ensuring that talented students from around the world have every opportunity to learn from and work alongside our remarkable faculty. At the same time, we have expanded our global reach through HarvardX, attracting some three million registrations in open online courses and modules in fields from computer science to poetry.
We continue to affirm the value of living and working together—and the value of Harvard as a “commonwealth of the mind.” Common spaces such as the new Richard A. and Susan F. Smith Campus Center are designed to enhance those purposes, and House renewal has breathed new life into Stone Hall, Leverett House, Dunster House, and Winthrop House, creating
more opportunities for the serendipitous interactions that contribute to an extraordinary residential experience for our undergraduates. Progress in Allston continues apace with the Ruth Mulan Chu Chao Center and Klarman Hall, and the first stages of construction of the Science and Engineering Complex, the future home of the majority of faculty from the Harvard Paulson School of Engineering and Applied Sciences, are under way.
Investments that advance the pursuit of knowledge, including funding for some ninety professorships, have allowed our research ecosystem to thrive, generating insights, inventions, and solutions. Harvard researchers are analyzing the Zika virus, tracking global violence’s downward trend, mapping the human brain, rebuilding ancient artifacts, and revealing what America thinks about American competitiveness. They are exploring the factors that make for successful K-12 schools and examining the past and future of global capitalism. Our capital campaign effort, combined with the efforts of previous generations, has enabled our faculty and our students to address the significant issues of our time.
Ours will be a future filled with important choices. The years ahead will demand redoubled attention to changing circumstances and an even keener focus on assuring long-term financial strength. We must be prepared to think creatively and act decisively so that Harvard may be for future generations what it is for us today. I am confident that our community of faculty, staff, students, alumni, and friends will meet this challenge. With thanks to them, I present the financial report for fiscal year 2016.
Sincerely,
Drew Gilpin Faust
president
November 1, 2016
Message from the President
3
ha
rva
rd
un
iver
sity
fi
nan
cia
l o
verv
iew
Financial OverviewFrom the Vice President for Finance and the Treasurer
The University had solid operating results for fiscal year 2016 and achieved our goal of managing operating expenses at a level equal to or less than revenues. The operating surplus for the year was $77 million or 1.6% of revenue, slightly higher than last year’s operating surplus of $62 million or 1.4% of revenue. Overall operating revenues increased 5.6% to $4.78 billion, and expenses were up 5.3% to $4.70 billion.
The positive operating results for the University reflect the consolidated effort of careful resource management at each of Harvard’s schools, affiliates, and allied institutions. Every year, each of Harvard’s operating units undertakes extensive planning with rolling five-year “multi-year financial plans,” as well as annual operating and capital budgets, including liquidity and facilities renewal targets. These plans are monitored and tested throughout the year to maintain the financial health that ultimately supports Harvard’s mission in teaching, learning, and research.
The balance sheet reflects mixed results for the year. Liquidity remains sufficient for operating needs as well as unexpected requirements, and debt levels were reduced during the year by 7% to a manageable $5.2 billion. Our most fundamental measure of financial resources, however, net assets (the equivalent of a net worth), shrank 5% during the year from $44.6 billion to $42.4 billion. Given the challenging investment climate, this was not a surprise, with the decrease due to the withdrawal of the annual distribution from the endowment for operations of $1,706 million, as well as endowment investment losses of $626 million. In most years, and over time, investment gains from the endowment generally outweigh distributions with the purposeful aim of maintaining the necessary inflation-adjusted purchasing power of the endowment in order to balance current needs with future requirements. The investment losses in 2016 reflect a 2% negative investment return during the year as discussed in the Harvard Management Company letter included in this report. It was a very difficult investment year
for all endowments and pensions, the worst since the 2008-09 financial crisis. Nonetheless, Harvard’s financial condition continues to earn a AAA-rating by the leading rating agencies, due in large part to the overall strength and size of our endowment, manageable debt profile and operating surpluses.
It is hard to overstate the importance of philanthropy to the University. Tuition alone does not cover the costs of educating our students and research grants do not cover the full cost of the research enterprise. Thanks to the generosity of past donors, endowment distributions this year made up our largest source of operating revenues at 36% of the total, and thanks to the generosity of current donors, current-use gifts represented an additional 9% of revenues. The combined force of these two philanthropic sources represented 45% of the year’s operating revenues and made possible the realization of Harvard’s aspirations: an exceptional and affordable education for our students, access to incomparable collections in our museums and libraries, and continuing leadership in scholarship and research by our faculty. Harvard is fortunate to have so many generous donors and friends who enable us both to preserve the key elements of our world-class teaching and research, and invest in the future.
The Harvard Campaign is making an enormous difference to the health and vitality of the University. Since the start of the Campaign, current-use giving has increased by 46% from $289 million in fiscal year 2012, prior to the launch of the Campaign, to $421 million in fiscal year 2016, and now comprises 9% of our revenues (as compared with 7% in fiscal year 2012). Gifts to the endowment, split interest agreements, and gifts to capital projects of $628 million in fiscal year 2016 are up 130% since fiscal year 2012, and are fortifying our ability to fulfill the University’s core mission while also creating a campus for the 21st century. These large numbers should not obscure the truth that small gifts make a meaningful difference for individual students and faculty. In the current year, for example,

4
ha
rva
rd
un
iver
sity
fin
anc
ial
ove
rvie
w
a $1,000 donation can fund half of a start-up grant for a freshman from a low-income family or fund a subscription to a leading academic journal at the Harvard Library, available to everyone on campus as well as those beyond.
At a time when the costs of higher education are understandably under scrutiny, some point to endowments as repositories of underutilized and excess wealth. This thinking is misguided. Harvard’s endowment is actively deployed every year as the University’s largest source of revenue for operations, and it is distributed in amounts that propel current programs while preserving capacity for the long term. The endowment should be understood and celebrated as the very mechanism that reduces the cost of education for Harvard students at both the undergraduate and graduate levels through financial aid programs that are among the nation’s most generous. For example, one in five undergraduate families are not required to contribute toward the cost of their child’s Harvard College education, as they have annual incomes of less than $65,000. More than half of undergraduates receive financial aid and pay on average $12,000 a year. Harvard only awards grants and never requires undergraduates to take out loans to cover the cost of their education. As a result, more than 75% of Harvard College’s Class of 2016 graduated debt-free.
The outlook for the traditional sources of revenue for higher education in the United States in the next few years, as well as for Harvard, are likely to be constrained: Tuition revenue growth will continue to be limited by affordability pressures, federal research funding faces an increasingly uncertain political climate, and most financial market experts agree that investment results for endowments will be modest due to low interest rates, low risk premiums and muted worldwide economic growth.
Harvard is responding to these economic realities. First, on the expense side, each of the schools and operating units is adjusting their spending plans to the new environment. If, as some expect, higher education revenue growth rates are in the 2-3% range in the next few years, down from 4-5% in the recent past, it will significantly constrain the University’s
ability to increase budgets. In order to maintain balance between our annual revenues and expenses—and continue to support and invest in our mission—we must carefully analyze our expense ledger for any opportunities for improvement. Subsequent to year end, given the historically low interest rate environment, Harvard refinanced $2.5 billion of existing bond indebtedness, achieving annual interest cost savings of $35 million that will be reinvested in University priorities. On the revenue side, many schools are rapidly expanding their offerings to lifelong learners through continuing and executive education programs. This is an area of pedagogical excitement as students of all ages and geographic locations have access to Harvard faculty through new in-person programs as well as blended and on-line programs. In the face of waning federal research funding, Harvard faculty members and principal investigators have broadened their relationships with foundations, individual donors and corporations, and are working with the Harvard Office of Technology Development with increasing success in venture creation and licensing royalties.
In closing, we want to acknowledge that a review of the highlights of the financial statements of the University does not begin to tell the underlying real story of Harvard’s transforming impact on students or its essential contributions to the world’s challenges and opportunities. We want to thank our faculty, staff, administrators and students for making Harvard vital and alive every day.
Thomas J. Hollister vicepresidentforfinance
Paul J. Finnegan treasurer
November 1, 2016

5
ha
rva
rd
un
iver
sity
fi
nan
cia
l o
verv
iew
fiscal 2016 sources of operating revenue
University
17%
17%
36%
21%
Education
11%
23%
12%
21%
33%
KennedySchool
6%
23%
18%
27%
26%
Engineering& AppliedSciences
21%
8%
36%
35%
Dental
23%
25%
21%
PublicHealth
Law
46%
6%
4%
11%
33%
Divinity
14%
4%
5%
76%
Medicine
14%
42%
9%
27%
8%
Design
12%
11%
39%
5%
33%
Facultyof Arts &Sciences
6%
7%
13%
23%
Business
33%
3%
10%
5%
67%
18% 15%
39%
10%
Radcliffe
11%
87%
1%
1%
1%
9%
51%
29%
2%
financial overviewThe University ended fiscal year 2016 with an operating surplus of $77 million compared to an operating surplus of $62 million in fiscal year 2015. The University’s net assets decreased by $2.2 billion to $42.4 billion at June 30, 2016, reflecting the impact of investment returns and the annual distribution from the endowment.
operating revenueTotal operating revenue increased 6% to $4.8 billion. The largest drivers were the annual endowment distribution, revenue from continuing and executive education programs and sponsored revenues.
In fiscal year 2016, the endowment distribution increased 7% to $1.7 billion. Growth in the endowment distribution was a result of the annual Corporation-approved increase, as well as the impact of new gifts.
In the aggregate, Harvard’s endowment payout rate (i.e., the dollars withdrawn annually for operations and for one-time or time-limited strategic purposes, as a percentage of the endowment’s prior year-end market value) was 5.1%, consistent with the fiscal year 2015 payout rate, and in line with the University’s targeted payout rate range of 5.0-5.5%.
More than halfway through the five year-long Campaign, the generosity of our donor community continues to positively impact the University’s contribution revenue. Gifts for current use were $421 million in fiscal year 2016, while total cash receipts from giving, including gifts designated as endowment, grew to a record $1.2 billion (see Note 16 of the audited financial statements). We are extremely grateful to our donor community for their continued support.

6
ha
rva
rd
un
iver
sity
fin
anc
ial
ove
rvie
w
In aggregate, revenue from federal and non-federal sponsored sources increased by 5% to $845 million in fiscal year 2016. Federal funding, which accounted for approximately 71% of total sponsored revenue in fiscal year 2016, increased 3% to $597 million while non-federal funding increased by 9% to $248 million. Fiscal year 2016 represents the first year since 2011 that the University’s federal revenue increased and was driven by several agencies including the National Institute of Health and the Department of Defense. The University continues to build relationships with foundations, corporations and other non-federal sponsors resulting in the increase in non-federal revenue over the prior year.
Net student revenue increased approximately 7% to $998 million in fiscal 2016, driven by 10% growth in revenue from continuing and executive education programs. The expansion of programs and enrollment across the University continues to positively impact student revenue. Net graduate tuition increased 6% with new graduate course offerings and annual rate changes. Net undergraduate tuition increased 4% as a result of modest tuition increases offset by a continued commitment to student financial aid. Since launching the Harvard Financial Aid Initiative in fiscal year 2005, Harvard has awarded almost $1.6 billion in grant aid to undergraduates, with annual financial aid increasing from $80 million in fiscal year 2005 to more than $170 million in 2016. More than half of Harvard undergraduates receive financial aid and in fiscal year 2016 these students paid an average of $12,000 a year.
operating expensesTotal operating expenses increased by 5% to $4.7 billion. Compensation expense (i.e. salaries, wages and benefits), which represents approximately half of the University’s total operating expense, increased 6% to $2.3 billion. Non-compensation expenses increased 5%, with increases in expenses such as services purchased for investment in information technology and professional services supporting sponsored programs.
Salaries and wages increased by 6%, or $96 million, to $1.8 billion in fiscal year 2016 due to the University’s merit increase programs as well as additional faculty and staff to support strategic areas of focus such
as academic programs, technology investments, continuing and executive education programs, online learning and sponsored research.
Employee benefits expense increased 6% to $530 million. The increase was predominantly driven by growth in post-retirement and defined benefit costs due to the impact of adopting a modified mortality table offset by the change in discount rate. Active employee health plan expense increased 3% due to increased claims costs and enrollment.
balance sheet
InvestmentsIn fiscal year 2016, the return on the endowment was (2%) and its value (after the net impact of distributions from the endowment for operations and the addition of new gifts to the endowment during the year) decreased from $37.6 billion at the end of fiscal year 2015 to $35.7 billion at the end of fiscal year 2016. More information can be found in the Message from the CEO of Harvard Management Company (HMC), found on page [8] of this report.
The University’s holdings of liquid investments (e.g., cash and treasuries) outside of the General Investment Account (GIA) decreased from $1.6 billion at June 30, 2015 to $1.2 billion at June 30, 2016. The University has a policy of maintaining a cash reserve floor of $800 million outside the GIA.
Scholarships & other student awards $142
Supplies & equipment $257
Interest $235
Depreciation $338
fiscal 2016 operating expenses
In millions of dollars
Space & occupancy $345
Services purchased $583
Other expenses $464
total operating expenses $4,700
50%
3%
10%
7%
6%
7%
12%
5%
Salaries, wages, &employee benefits $2,336
7
ha
rva
rd
un
iver
sity
fi
nan
cia
l o
verv
iew
DebtOutstanding debt decreased from $5.5 billion at June 30, 2015, to $5.2 billion at June 30, 2016 down from a high of $6.3 billion in fiscal year 2011. In July 2015, the University paid down $316 million of callable debt (bond series’ 2005A, B and C).
The University is rated AAA by S&P Global Ratings (re-affirmed in July 2016) and Aaa by Moody’s Investors Service (re-affirmed in September 2016). Additional detail regarding the University’s debt portfolio can be found in Note 12 of the audited financial statements.
Accrued Retirement ObligationsThe University’s accrued retirement obligations increased by $287 million or 30% to $1.2 billion at June 30, 2016. The major driver of the increase was a reduction in the discount rate used to calculate the obligation for both the pension and post-retirement plans.
Capital ExpendituresThe University invested $597 million in capital projects and acquisitions during fiscal year 2016 as compared to $467 million in fiscal year 2015. This enabled progress on several significant projects including:
• Completion of the Ruth Mulan Chu Chao Center to support the Business School’s portfolio of executive education programs;
• On-going construction of the Kennedy School’s transformative Pavilions project which includes expansion, new buildings and a raised, pedestrian-only courtyard;
• Progress on the renovation and addition to Winthrop House for the undergraduate long-term house renewal initiative;
• Start of construction on the Smith Campus Center to support the University’s goal of creating new and programmable common space for the entire community;
• Commencement of construction on Klarman Hall which will allow the Business School to accommodate large-scale events for approximately 1,000 individuals;
• Completion of a combined heat and power plant which reduces the University’s greenhouse gas footprint and increases capacity to generate electric power; and
• Early capital activity for Allston including the Science and Engineering Complex.
This concludes the summary of the key financial highlights for fiscal year 2016. We encourage you to read the audited financial statements and related notes for more information regarding the financial position and results of the University.
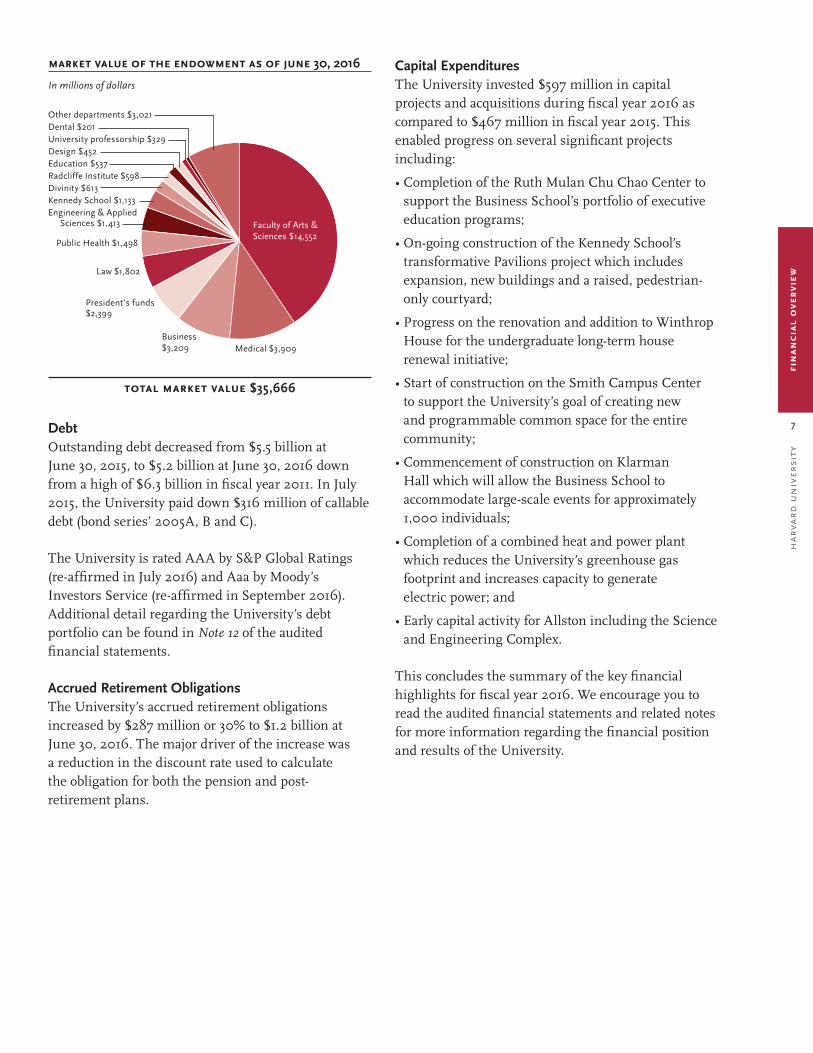
Other departments $3,021 Dental $201 University professorship $329 Design $452 Education $537 Radcliffe Institute $598Divinity $613Kennedy School $1,133 Engineering & Applied
Sciences $1,413
market value of the endowment as of june 30, 2016
In millions of dollars
Faculty of Arts &Sciences $14,552
Business$3,209 Medical $3,909
Public Health $1,498
President’s funds$2,399
Law $1,802
total market value $35,666

8
ha
rva
rd
un
iver
sity
ha
rva
rd m
anag
emen
t co
mpa
ny
Bill
ions
$40
$30
$25
$20
$15
$10
$5$0
1996 2000 2004 2008 2012 2016
$35
Fiscal Year
September 2016Annual Endowment ReportMessage from Robert A. Ettl, President and CEO
Introduction I write to share with you the endowment’s investment results for fiscal year 2016, and to report on HMC’s activities to reposition the portfolio and to strengthen HMC as an organization. I also provide an update on our strategic asset allocation process and conclude with comments about our outlook for the future.
For the fiscal year ended June 30, 2016, the return on the Harvard endowment was (2.0)%, resulting in a relative return to its benchmark of (300) basis points. The value of the endowment on June 30, 2016, was $35.7 billion. The low interest rate environment and market volatility of the past fiscal year presented a number of challenges to generating returns. However, we recognize that execution was also a key factor in this year’s disappointing results. The last ten years, inclusive of the global financial crisis,
have been challenging for the Harvard endowment. However, over the last twenty years the endowment has returned 10.4% annualized, exceeding the average annual return on the benchmark portfolio of 7.7%. The value of $1,000 invested in the Harvard endowment has significantly outpaced both a traditional US and Global 60/40 mix of stock and bonds over the same time period.
Total Value of the Endowment(after distributions)
Asset class performance was mixed in fiscal year 2016. The endowment’s investment return was primarily driven by underperformance in our natural resources and public equities portfolios. We have taken several steps to improve performance in these portfolios over the long term, which I detail later in the Organizational Update.
The real estate portfolio continued its multi-year run as our highest performing asset class, driven primarily by the success of our direct investment strategy, which now comprises more than half of the overall real estate portfolio. Our internal real estate team and joint venture partners have developed a direct investment program that has delivered outstanding results since its inception in 2010.
One-Year Five-Year Ten-Year Twenty-Year
9%
6%
3%
0%
12%
-3%
1.0%
2.3%
-2.0%
5.0%5.9% 5.4%
3.9%
8.9%
5.7%4.8% 4.6%
6.9%
10.4%
7.7%
5.6%
7.3%
Retu
rn
Global 60/40 Stock/Bond Portfolio US 60/40 Stock/Bond PortfolioHarvard Endowment Benchmark Portfolio
6/30/96 6/30/00 6/30/04 6/30/08 6/30/12 6/30/16
$9,000
$7,000
$5,000
$3,000
$1,000
Harvard Endowment Benchmark Portfolio US 60/40 Global 60/40 CPI
The endowment distributed $1.7 billion to Harvard University in fiscal year 2016—contributing more than one-third of the University’s total operating revenue. Since inception, HMC has distributed more than $25 billion to Harvard University, enabling industry-leading financial aid programs, groundbreaking discoveries in scientific research, and hundreds of professorships across a wide range of academic fields.
Cumulative Annualized Returns
Growth of $1,000 Invested in Harvard Endowment20-year cumulative returns

9
ha
rva
rd
un
iver
sity
h
arv
ard
man
agem
ent
com
pan
y
Strategic Asset Allocation ProcessHMC’s strategic asset allocation process seeks to identify appropriate asset class allocations that best suit the long-term risk and return objectives of the University. This framework is designed to expose the endowment to primary drivers of long-term market returns and risk premia, while ensuring proper diversification of our investment strategies. In our factor-based approach, we first select a set of macro factors and measure our asset class exposure to these factors. This analysis produces an allocation range for each asset class. With these ranges determined, HMC chooses an optimal portfolio and a corresponding target allocation for each asset class, while also taking into account liquidity considerations.
The resulting asset class target allocations form the strategic asset allocation, which aims to balance the long-term objectives of return generation, risk management, and liquidity provision. The actual asset allocation at a particular point in time may deviate from the strategic asset allocation, within the defined ranges.
Fiscal Year 2016
Asset Class Strategic Asset Allocation
Domestic Equity 10.5%
Foreign Equity 7.0%
Emerging Market Equity 11.5%
Private Equity 20.0%
Absolute Return 14.0%
Real Estate 14.5%
Natural Resources 10.0%
Domestic Bonds 9.0%
Foreign Bonds 1.0%
Inflation-Linked Bonds 2.0%
High-Yield Bonds 0.5%
Total 100%
Risk and Liquidity Risk management is an essential and integral part of the endowment’s investment management process. With low interest rates across the world, many traditional liquid asset classes have experienced diminished returns, and asset managers are challenged to find high-growth/high-return assets. Our Risk team monitors the portfolio on a continuous basis to ensure that the volatility of the portfolio is within acceptable limits. Additionally, in order to provide continuous and reliable funding to the University in various market conditions, we need to manage our liquidity carefully, especially under stress scenarios, to ensure that at least 5% of the endowment can be realized in liquid form within 30 days.
Discussion of Fiscal Year 2016Market OverviewFiscal year 2016 was a bumpy ride for most investors. Equity markets, in particular, displayed increasing volatility with significant sell-offs in August 2015 and January 2016. However, in the last few months of the fiscal year, equities regained their footing and recovered some of their losses amid increasingly accommodative central bank policies. Over the course of the fiscal year, the Federal Reserve abandoned its path of raising interest rates after one hike in December. Chinese authorities unleashed a range of stimulative policies and central banks outside the US, particularly in Japan and Europe, expanded their asset-buying programs.
Domestic equity markets continued their recent pattern of outperforming foreign and emerging equity markets, with the S&P 500 rising 4.0% for the fiscal year. However, S&P 500 earnings declined by 4.0% during the fiscal year, largely attributable to reduced earnings in the energy sector as commodity prices dropped to multi-decade lows. With the domestic equity market near all-time highs, a further decline in earnings growth would leave it vulnerable to reduced valuation levels.
International markets had a rough start to the fiscal year, fueled by increasing concerns around slowing Chinese growth and deflation in Europe. The MSCI EAFE Index returned (9.3)% and emerging markets equities returned (12.1)%, with Europe, Japan, and China experiencing the most severe declines. On a P/E basis, emerging markets equities are as cheap relative to developed markets as they have been since the global financial crisis. However, most of the emerging markets economies face their own set of fundamental challenges, whether around economic rebalancing (China), politics (Brazil), or poor growth and nonperforming loan cycles (China, India).

10
ha
rva
rd
un
iver
sity
ha
rva
rd m
anag
emen
t co
mpa
ny
The biggest market surprise of fiscal year 2016 might very well have been that foreign bonds were the best performing asset class (the benchmark was up 12.4%). Over the twelve month period, the proportion of global sovereign debt trading at negative yields increased from approximately 10% to 25%. Domestic bonds also returned an impressive 6.2%. Credit markets experienced significant volatility during the course of the fiscal year, ending the year with spreads wider relative to the beginning of the fiscal year but narrower than their February highs.
The trend for global growth seems likely to remain subdued, with both demographics and productivity improvements languishing in many developed economies and China remaining the most critical unknown. These forces have combined with new and untested market structures evolved from regulatory changes and have affected liquidity in many markets, particularly credit. With few of these factors likely to change in the near term, it appears we might be living with bursts of volatility and whipsawing markets for some time.
Portfolio OverviewFiscal Year 2016 Performance
Fiscal Year 2016 Return
5-Year Annualized
Return
HMC Benchmark Relative Relative
Public Equity (10.2)% (6.1)% (4.1)% 0.5%
Private Equity 2.6 2.2 0.4 (0.3)
Fixed Income 5.5 6.2 (0.7) 3.8
Absolute Return (1.2) (0.3) (0.9) 2.2
Real Estate 13.8 9.4 4.4 3.3
Natural Resources (10.2) 1.4 (11.6) (2.1)
Total Endowment (2.0)% 1.0% (3.0)% 0.5%
Fiscal year 2016 performance was disappointing on both an absolute and relative basis. The endowment portfolio’s 300 bps of underperformance relative to our benchmark was driven primarily by losses in our public equity and natural resources portfolios. Deviations from our strategic asset allocation also detracted from performance. Our real estate portfolio had material outperformance and private equity also exceeded its benchmark.
Our public markets equity portfolio returned (10.2)%, trailing the blended public equity benchmark of (6.1)%. Developed markets underperformed with both domestic and foreign equity trailing their benchmarks significantly. In emerging markets equities, our performance was relatively flat to the benchmark. As I will detail in the Organizational Update, we have repositioned our public equity strategy to rely more heavily on external managers.
Unfortunately, a number of our domestic equity external managers underperformed for the first time in many years amid a difficult period for active management overall, particularly for value-oriented strategies. Several of our external managers also held closely correlated portfolios, particularly in underperforming healthcare stocks, further impacting the performance of the asset class. This will be a key area of focus for our team going forward.
Public Equity
Fiscal Year 2016 Return
5-Year Annualized
Return
HMC Benchmark Relative Relative
Domestic Equity (4.9)% 2.5% (7.4)% 1.7%
Foreign Equity (14.2) (9.3) (4.9) (0.4)
Emerging Markets (12.0) (12.1) 0.1 0.1
Total Public Equity (10.2)% (6.1)% (4.1)% 0.5%
Private Equity
Fiscal Year 2016 Return
5-Year Annualized
Return
HMC Benchmark Relative Relative
US Corporate Finance 8.3% 4.8% 3.5% (2.0)%
Intl Corporate Finance 1.0 6.5 (5.5) (0.9)
Venture Capital (1.5) (0.2) (1.3) 6.2
Total Private Equity 2.6% 2.2% 0.4% (0.3)%
Private equity generated modest relative outperformance for the fiscal year but performance varied by subsector. US corporate finance was the strongest performer while venture capital returns moderated after several years of very strong performance. We are actively concentrating the portfolio by scaling our commitments to a core group of top managers, and selectively adding new relationships to address gaps in the portfolio.

11
ha
rva
rd
un
iver
sity
h
arv
ard
man
agem
ent
com
pan
y
Our absolute return portfolio was down modestly and trailed its benchmark by 90 bps for the fiscal year. Event-driven and credit-oriented strategies underperformed while systematic and uncorrelated strategies outperformed. While the hedge fund space has become more competitive over the last decade, we continue to believe that partnering with best-in-class managers will lead to attractive risk-adjusted returns in excess of our benchmarks.
severe drought during the crop season as well as an unusually high cost of production. The valuation of the second asset declined as a result of a challenging economic and political environment that made it increasingly difficult to secure financing. As I detail in the Organizational Update, we have hired a new head of our natural resources portfolio and are optimistic we can improve performance in this asset class going forward.
Our fixed income portfolio, managed entirely internally, had mixed performance for the fiscal year. Our credit strategies suffered losses, while our relative value strategies performed well as we continued to capitalize on opportunities globally.
Our real estate portfolio encompasses direct activities and external fund investments. Over half of our real estate portfolio is now in direct investments—a strategy HMC began in 2010. The direct strategy continued to perform especially well, earning a total return in fiscal year 2016 of 20.2%. This approach also provides the benefits of enhanced transparency, control over entry and exit, better risk control, and lower overall cost structure.
Fixed Income
Fiscal Year 2016 Return
5-Year Annualized
Return
HMC Benchmark Relative Relative
Domestic 6.7% 6.2% 0.5% 1.4%
Foreign 10.9 12.4 (1.5) 6.8
TIPS 1.6 4.4 (2.8) 2.2
High Yield 2.1 0.9 1.2 (0.6)
Total Fixed Income 5.5% 6.2% (0.7)% 3.8%
Absolute Return
Fiscal Year 2016 Return
5-Year Annualized
Return
HMC Benchmark Relative Relative
Total Absolute Return (1.2)% (0.3)% (0.9)% 2.2%
Natural Resources
Fiscal Year 2016 Return
5-Year Annualized
Return
HMC Benchmark Relative Relative
Total Natural Resources (10.2)% 1.4% (11.6)% (2.1)%
Real Estate
Fiscal Year 2016 Return
5-Year Annualized
Return
HMC Benchmark Relative Relative
Total Real Estate 13.8% 9.4% 4.4% 3.3%
The macro environment for direct natural resources investments was challenging as commodity prices continued to decline for much of the fiscal year. Market transactions for timber and agricultural land in many regions were limited, impacting portfolio liquidity in the short term. The portfolio trailed its benchmark by over 1100 bps, primarily driven by unfavorable market and business conditions across two assets in South America. One asset experienced
Investment ObjectivesIn fiscal year 2015, HMC set forth three investment objectives that we believe are essential to delivering superior long-term risk-adjusted returns. These investment objectives, which measure our performance against real, relative, and peer returns, are ambitious goals set to serve the University over the long-term. As such, we will measure our performance relative to these objectives over five- and ten-year market cycles. In any given year we may not achieve each of the stated objectives, as was the case in fiscal year 2016. However, as discussed in the Organizational Update, we have taken several steps to improve performance and are confident that the endowment is well-positioned to achieve our goals over the long-term.
CompensationIn fiscal year 2016, we redesigned our compensation system to further align the interests of HMC’s investment professionals with those of the University. Starting in fiscal year 2017, compensation paid to internal investment managers will tie a meaningful share of variable compensation to HMC’s performance relative to our three investment objectives. The new compensation plan retains important features of the previous plan, including: the majority of total compensation is directly linked to performance relative to appropriate industry benchmarks and incentive payments are made over a multi-year period with a significant portion held back and subject to forfeiture to ensure sustained performance.

12
ha
rva
rd
un
iver
sity
ha
rva
rd m
anag
emen
t co
mpa
ny
Organizational UpdateThe past several months have been a time of transition for HMC. After serving the organization for eight years as chief operating officer and a member of HMC’s executive leadership team, it has been my pleasure to serve as interim president and CEO since May. The HMC Board of Directors has engaged David Barrett, a prominent executive search firm, to conduct the search for a CEO, following Stephen Blyth’s resignation in July. We are grateful to Stephen for his many contributions during his nearly ten-year career at HMC.
In June 2016 we reduced the size of our internal equity team and refined our strategy to emphasize deeper and broader relationships with managers for whom HMC can be a partner of choice. This portfolio will be managed by a new head of absolute return and public markets funds who we expect to hire later this year. Our remaining internal equity activities in emerging and foreign markets have been combined with fixed income, credit, and commodities to form a cross-asset public markets platform.
I am pleased to report that Colin Butterfield has been appointed managing director, head of natural resources, and will join HMC in early October 2016. Colin brings significant investment leadership experience in agriculture and timber investing. He will oversee and develop HMC’s natural resources investment team and continue to evolve HMC’s suite of manager relationships for its direct natural resources investments. We will look to Colin to refine our natural resources investment strategy and to bring the best opportunities at scale to our portfolio.
The HMC Investment Committee formed in fiscal year 2015 has been an important forum to develop a deeper understanding of, and gain greater conviction in, investments across the portfolio. Committee members explore opportunities between asset classes, allowing constructive feedback and comparable analysis.
HMC continues to be guided by a distinguished Board of Directors, under the leadership of Paul J. Finnegan. In fiscal year 2016, Glenn H. Hutchins and Martin L. Leibowitz retired from the Board after reaching their term limits, and Robert S. Kaplan resigned upon his appointment to serve as the president and CEO of the Federal Reserve Bank of Dallas. Over the course of the fiscal year we welcomed four new Directors: Amy C. Falls, Joshua S. Friedman, Robert Jain, and Jeremy C. Stein. Ex officio member Thomas J. Hollister also joined the Board in his capacity as chief financial officer of Harvard University. The Board skillfully informs the investment debate that advances the mission of HMC and keeps all of us at HMC focused on the long-term objectives that support Harvard University.
Sustainable Investment UpdateAs a signatory to the United Nations-supported Principles for Responsible Investment (PRI), the Harvard endowment is required to complete the PRI’s mandatory reporting framework on an annual basis. HMC filed its first reporting framework on March 31, 2016, and the Transparency Report based on that filing is available on the PRI’s website: www.unpri.org. The report details HMC’s progress toward integrating material environmental, social, and governance (ESG) risk factors into the endowment portfolio, including the establishment of responsible investment policies, procedures, and strategies; recent shareholder engagement initiatives; the integration of ESG risk factor analysis in our direct investing portfolio; and collaboration efforts with external managers to integrate material ESG risk factors into their portfolios.
We are conducting a search for a senior vice president of sustainable investing who will have responsibility for integrating material ESG risk factors into due diligence, investment analysis, monitoring, and asset management at HMC.
Looking AheadAs we enter fiscal year 2017, the investment landscape continues to be full of uncertainty. With a backdrop of slowing growth and rich valuations, endowment returns could be muted for some time to come. Still, the endowment’s liquidity position is solid, and we feel confident about the moves we have made to reposition the portfolio. We continuously evaluate how we can best allocate capital and leverage HMC’s comparative advantages to maximize performance over the long term. Investing with best-in-class managers, properly allocating assets, thoughtfully structuring our portfolio, and collaborating across asset classes will be critical to our success.
HMC is fortunate to have a strong and deep leadership team, supported by a fully engaged Board of Directors, to build on the progress that has been made this year. I am honored to serve as interim president and CEO, and remain confident in the leadership and direction of the organization to support the goals of Harvard University.

13
ha
rva
rd
un
iver
sity
in
dep
end
ent
aud
ito
r’s
repo
rt
PricewaterhouseCoopers LLP, 101 Seaport Blvd, Suite 500, Boston, MA 02210T: (617) 530 5000, F: (617) 530 5001, www.pwc.com/us
Independent Auditor's Report
To the Board of Overseers of Harvard College:
We have audited the accompanying consolidated financial statements of Harvard University (the “University”), which comprise the consolidated balance sheet as of June 30, 2015, and the related consolidated statements of changes in net assets with general operating account detail, changes in net assets of the endowment, and cash flows for the year then ended.
Management's Responsibility for the Consolidated Financial Statements
Management is responsible for the preparation and fair presentation of the consolidated financial statements in accordance with accounting principles generally accepted in the United States of America; this includes the design, implementation, and maintenance of internal control relevant to the preparation and fair presentation of consolidated financial statements that are free from material misstatement, whether due to fraud or error.
Auditor's Responsibility
Our responsibility is to express an opinion on the consolidated financial statements based on our audit. We conducted our audit in accordance with auditing standards generally accepted in the United States of America.Those standards require that we plan and perform the audit to obtain reasonable assurance about whether the consolidated financial statements are free from material misstatement.
An audit involves performing procedures to obtain audit evidence about the amounts and disclosures in the consolidated financial statements. The procedures selected depend on our judgment, including the assessment of the risks of material misstatement of the consolidated financial statements, whether due to fraud or error. In making those risk assessments, we consider internal control relevant to the University's preparation and fair presentation of the consolidated financial statements in order to design audit procedures that are appropriate in the circumstances, but not for the purpose of expressing an opinion on the effectiveness of the University's internal control. Accordingly, we express no such opinion. An audit also includes evaluating the appropriateness of accounting policies used and the reasonableness of significant accounting estimates made by management, as well as evaluating the overall presentation of the consolidated financial statements. We believe that the audit evidence we have obtained is sufficient and appropriate to provide a basis for our audit opinion.
Opinion
In our opinion, the consolidated financial statements referred to above present fairly, in all material respects, the financial position of the University at June 30, 2015, and the changes in their net assets and their cash flows for the year then ended in accordance with accounting principles generally accepted in the United States of America.
Other Matters
We have previously audited the University’s 2014 consolidated financial statements, and we expressed an unmodified audit opinion on those audited financial statements in our report dated November 7, 2014. In our opinion, the summarized comparative information presented herein as of and for the year ended June 30, 2014is consistent, in all material respects, with the audited financial statements from which it has been derived.
October 29, 2015
PricewaterhouseCoopers LLP, 125 High Street, Boston, MA 02110 T: (617) 530 5000, F: (617) 530 5001, www.pwc.com/us
Report of Independent Auditors
To the Board of Overseers of Harvard College:
We have audited the accompanying consolidated financial statements of Harvard University, which comprise the consolidated balance sheet as of June 30, 2016, and the related consolidated statements of changes in net assets with general operating account detail, changes in net assets of the endowment and of cash flows for the year then ended.
Management’s Responsibility for the Consolidated Financial StatementsManagement is responsible for the preparation and fair presentation of the consolidated financial statements in accordance with accounting principles generally accepted in the United States of America; this includes the design, implementation and maintenance of internal control relevant to the preparation and fair presentation of consolidated financial statements that are free from material misstatement, whether due to fraud or error.
Auditors’ ResponsibilityOur responsibility is to express an opinion on the consolidated financial statements based on our audit. We conducted our audit in accordance with auditing standards generally accepted in the United States of America. Those standards require that we plan and perform the audit to obtain reasonable assurance about whether the consolidated financial statements are free from material misstatement.
An audit involves performing procedures to obtain audit evidence about the amounts and disclosures in the consolidated financial statements. The procedures selected depend on our judgment, including the assessment of the risks of material misstatement of the consolidated financial statements, whether due to fraud or error. In making those risk assessments, we consider internal control relevant to the University’s preparation and fair presentation of the consolidated financial statements in order to design audit procedures that are appropriate in the circumstances, but not for the purpose of expressing an opinion on the effectiveness of the University’s internal control. Accordingly, we express no such opinion. An audit also includes evaluating the appropriateness of accounting policies used and the reasonableness of significant accounting estimates made by management, as well as evaluating the overall presentation of the consolidated financial statements. We believe that the audit evidence we have obtained is sufficient and appropriate to provide a basis for our audit opinion.
OpinionIn our opinion, the consolidated financial statements referred to above present fairly, in all material respects, the financial position of Harvard University as of June 30, 2016, and the changes in its net assets and its cash flows for the year then ended in accordance with accounting principles generally accepted in the United States of America.
Other MatterWe previously audited the consolidated statement of financial position as of June 30, 2015, and the related consolidated statements changes in net assets with general operating account detail, changes in net assets of the endowment and of cash flows for the year then ended (not presented herein), and in our report dated October 29, 2015, we expressed an unmodified opinion on those consolidated financial statements. In our opinion, the information set forth in the accompanying summarized financial information as of June 30, 2015 and for the year then ended is consistent, in all material respects, with the audited consolidated financial statements from which it has been derived.
November 1, 2016

14
ha
rva
rd
un
iver
sity
fin
anci
al
stat
emen
ts
balance sheetswith summarized financial information as of June 30, 2015
June 30In thousands of dollars 2016 2015ASSETS:Cash $ 113,738 $ 109,698Receivables, net (Note 6) 248,204 239,962Prepayments and deferred charges 151,053 132,483Notes receivables, net (Note 7) 381,191 377,837Pledges receivables, net (Note 8) 2,134,220 2,245,199Fixed assets, net (Note 9) 6,529,540 6,184,352Interests in trusts held by others (Notes 4) 355,835 363,175Investment portfolio, at fair value (Notes 3, 4 and 5) 51,632,578 54,659,156Securities pledged to counterparties, at fair value (Notes 3, 4 and 5) 15,357,995 10,874,966TOTAL ASSETS 76,904,354 75,186,828
LIABILITIES:Accounts payable $ 343,289 $ 313,737Deposits and other liabilities 824,244 807,318Securities lending and other liabilities associated with the investment portfolio (Notes 3, 4, 5 and 12) 25,057,362 21,183,731Liabilities due under split interest agreements (Note 11) 791,202 910,084Bonds and notes payable (Note 12) 5,176,702 5,543,398Accrued retirement obligations (Note 13) 1,243,846 957,002Government loan advances (Note 7) 70,296 69,432TOTAL LIABILITIES 33,506,941 29,784,702
NET ASSETS, attributable to non-controlling interests in the pooled general investment account (Notes 3 and 4 ) 986,083 833,583
NET ASSETS,attributable to the University 42,411,330 44,568,543
TOTAL LIABILITIES AND NET ASSETS $ 76,904,354 $75,186,828
Temporarily Permanently June 30 Unrestricted restricted restricted 2016 2015NET ASSETS, attributable to the University:General Operating Account (GOA) (Note 10) $ 3,738,877 $ 2,406,861 $ 97,983 $ 6,243,721 $ 6,494,452Endowment (Note 10) 5,847,379 22,482,876 7,335,488 35,665,743 37,615,545Split interest agreements (Note 11) 51,640 450,226 501,866 458,546TOTAL NET ASSETS, attributable to the University $ 9,586,256 $ 24,941,377 $ 7,883,697 $ 42,411,330 $ 44,568,543
The accompanying notes are an integral part of the consolidated financial statements.

15
ha
rva
rd
un
iver
sity
fi
nan
cia
l st
atem
ents
statements of changes in net assets with general operating account detailwith summarized financial information for the year ended June 30, 2015 For the year ended Temporarily Permanently June 30In thousands of dollars Unrestricted Restricted Restricted 2016 2015OPERATING REVENUE:Student income: Undergraduate program $ 300,691 $ 300,691 $ 291,865 Graduate and professional degree programs 530,978 530,978 504,344 Board and lodging 183,185 183,185 172,440 Continuing education and executive programs 381,068 381,068 345,488 Scholarships applied to student income (Note 14) (397,524) (397,524) (384,208)Total student income 998,398 0 0 998,398 929,929
Sponsored support (Note 15) Federal government – direct costs 435,778 435,778 418,832 Federal government – indirect costs 161,458 161,458 159,133 Non-federal sponsors – direct costs 88,698 $ 124,119 212,817 194,969 Non-federal sponsors – indirect costs 23,737 11,665 35,402 32,887Total sponsored support 709,671 135,784 0 845,455 805,821
Gifts for current use (Note 16) 147,335 273,834 421,169 435,649
Investment income: Endowment returns made available for operations (Note 10) 301,007 1,405,237 1,706,244 1,594,227 GOA returns made available for operations 133,351 133,351 124,805 Other investment income 12,707 3,865 16,572 16,119Total investment income 447,065 1,409,102 0 1,856,167 1,735,151
Other income (Note 17) 655,700 655,700 619,000Net assets released from restriction 1,773,434 (1,773,434) 0 0TOTAL OPERATING REVENUE 4,731,603 45,286 0 4,776,889 4,525,550
OPERATING EXPENSES:Salaries and wages 1,806,280 1,806,280 1,710,768Employee benefits (Note 13) 530,047 530,047 499,793Services purchased 582,583 582,583 503,331Space and occupancy 345,345 345,345 330,066Depreciation (Note 9) 338,173 338,173 323,149Supplies and equipment 256,826 256,826 252,838Interest (Note 12) 235,303 235,303 251,657Scholarships and other student awards (Note 14) 142,070 142,070 135,693Other expenses (Note 18) 463,598 463,598 455,794TOTAL OPERATING EXPENSES 4,700,225 0 0 4,700,225 4,463,089
NET OPERATING SURPLUS 31,378 45,286 0 76,664 62,461
NON-OPERATING ACTIVITIES:Income from GOA Investments 18,707 18,707 21,838GOA realized and change in unrealized (depreciation)/appreciation, net (Note 3) (115,457) (115,457) 194,942GOA returns made available for operations (133,351) (133,351) (124,805)Change in pledge balances (Note 8) (67,866) (67,866) 33,477Change in interests in trusts held by others (8,430) (8,430) (7,975)Gifts for facilities and loan funds (Note 16) 116,911 $ 313 117,224 134,133Change in retirement obligations (Note 13) (245,722) (245,722) (84,105)Net loss from discontinued operations (Note 2) 0 (50,753)Other changes 5,245 5,245 (21,787)Transfers between GOA and endowment (Note 10) 24,356 67,806 (934) 91,228 152,958Transfers between GOA and split interest agreements (Note 11) 10,942 85 11,027 20,891Non-operating net assets released from restrictions 113,934 (114,868) 934 0 0TOTAL NON-OPERATING ACTIVITIES (332,288) 4,495 398 (327,395) 268,814
GENERAL OPERATING ACCOUNT NET CHANGE DURING THE YEAR (300,910) 49,781 398 (250,731) 331,275Endowment net change during the year (335,960) (2,021,296) 407,454 (1,949,802) 1,186,289Split interest agreements net change during the year (Note 11) 10,824 32,496 43,320 (160,251)NET CHANGE DURING THE YEAR, attributable to the University (636,870) (1,960,691) 440,348 (2,157,213) 1,357,313NET ASSETS CHANGE DURING THE YEAR, attributable to non-controlling interests in the pooled general investment account 152,500 152,500 187,154NET CHANGE DURING THE YEAR1 (484,370) (1,960,691) 440,348 (2,004,713) 1,544,467Net assets, beginning of year1 11,056,709 26,902,068 7,443,349 45,402,126 43,857,659NET ASSETS, END OF YEAR1 $ 10,572,339 $ 24,941,377 $ 7,883,697 $ 43,397,413 $ 45,402,126
The accompanying notes are an integral part of the consolidated financial statements.
1 Net assets attributable to the University and non-controlling interests in the pooled general investment account.

16
ha
rva
rd
un
iver
sity
fin
anci
al
stat
emen
ts
statements of changes in net assets of the endowmentwith summarized financial information for the year ended June 30, 2015
For the year ended Temporarily Permanently June 30In thousands of dollars Unrestricted Restricted Restricted 2016 2015Investment Return (Note 3): Income from general investments $ 22,568 $ 108,507 $ 131,075 $ 199,156 Realized and change in unrealized (depreciation)/appreciation, net (143,981) (613,086) (757,067) 1,757,498Total investment return (121,413) (504,579) 0 (625,992) 1,956,654Endowment returns made available for operations (Note 10) (301,007) (1,405,237) (1,706,244) (1,594,227)Net investment return (422,420) (1,909,816) 0 (2,332,236) 362,427
Gifts for endowment (Note 16) 10,396 166,693 $ 314,894 491,983 338,487Transfers between endowment and the GOA (Note 10) (24,356) (67,806) 934 (91,228) (152,958)Capitalization of split interest agreements (Note 11) 3,562 17,409 20,971 24,720Change in pledge balances (Note 8) (90,890) 48,012 (42,878) 621,163Change in interests in trusts held by others (Note 10) 6,674 (5,584) 1,090 (5,376)Other changes (7,154) (22,139) 31,789 2,496 (2,174)Net assets released from restrictions 107,574 (107,574) 0 0 0NET CHANGE DURING THE YEAR (335,960) (2,021,296) 407,454 (1,949,802) 1,186,289Net assets of the endowment, beginning of year 6,183,339 24,504,172 6,928,034 37,615,545 36,429,256NET ASSETS OF THE ENDOWMENT, end of year $ 5,847,379 $ 22,482,876 $ 7,335,488 $ 35,665,743 $ 37,615,545
The accompanying notes are an integral part of the consolidated financial statements.

17
ha
rva
rd
un
iver
sity
fi
nan
cia
l st
atem
ents
statements of cash flowswith summarized financial information for the year ended June 30, 2015
For the year ended June 30In thousands of dollars 2016 2015CASH FLOWS FROM OPERATING ACTIVITIES:Change in net assets $ (2,004,713) $ 1,544,467Adjustments to reconcile change in net assets to net cash (used in) operating activities: Change in non-controlling interests in the pooled general investment account (152,500) (187,154) Depreciation 338,173 323,149 Depreciation for discontinued operations 2,152 Realized and change in unrealized depreciation/(appreciation), net 905,297 (1,982,970) Change in fair value of interest rate exchange agreements 19,118 9,058 Change in interests in trusts held by others 7,340 13,351 Change in liabilities due under split interest agreements (118,882) 151,093 Gifts of donated securities (200,806) (117,075) Proceeds from the sales of gifts of unrestricted securities 80,363 16,297 Gifts of donated securities in other investments 5,882 Gifts for restricted purposes (501,319) (331,896) Loss on disposal of assets 11,408 30,684 Write-off of assets and liabilities for discontinued operations 15,806 Gain on sale of property (10,347) Forgiveness of notes payable (10,000) Change in accrued retirement obligations 286,844 119,641Changes in operating assets and liabilities: Receivables,net (8,242) 6,520 Prepayments and deferred charges (18,570) (631) Pledges receivable, net 110,979 (654,441) Accounts payable 18,556 (17,355) Deposits and other liabilities 16,926 64,198NET CASH (USED IN) OPERATING ACTIVITIES (1,214,493) (1,005,106)
CASH FLOWS FROM INVESTING ACTIVITIES: Loans made to students, faculty, and staff (51,311) (48,982) Payments received on student, faculty, and staff loans 47,423 44,979 Change in other notes receivable 534 2,642 Proceeds from the sales and maturities of investments 88,023,222 87,914,830 Purchase of investments (91,802,151) (89,347,046) Change associated with repurchase agreements (94,950) 214,444 Additions to fixed assets (692,798) (560,493) Proceeds from sale of property 10,790NET CASH (USED IN) INVESTING ACTIVITIES (4,559,241) (1,779,626)
CASH FLOWS FROM FINANCING ACTIVITIES: Change in overdrafts included in accounts payable 8,582 5,348 Proceeds from issuance of debt 5,707 260 Debt repayments (372,403) (46,371) Proceeds from the sales of gifts of restricted securities 120,443 100,778 Gifts for restricted purposes 501,319 331,896 Non-controlling interests in the pooled general investment account contributions and distributions, net (38,293) 17,754 Change in repurchase and reverse repurchase agreements 5,551,555 2,396,492 Change in government loan advances 864 569NET CASH PROVIDED BY FINANCING ACTIVITIES 5,777,774 2,806,726
NET CHANGE IN CASH 4,040 21,994Cash, beginning of year 109,698 87,704CASH, end of year $ 113,738 $ 109,698
Supplemental disclosure of cash flow information: Accounts payable related to fixed asset additions $ 72,474 $ 70,060 Cash paid for interest $ 246,464 $ 255,345
The accompanying notes are an integral part of the consolidated financial statements.

18
ha
rva
rd
un
iver
sity
no
tes
to f
inan
cia
l st
atem
ents
1. university organization
Harvard University (the “University”) is a private, not-for-profit institution of higher education with approximately 7,330 undergraduate and 14,460 graduate students. Established in 1636, the University includes the Faculty of Arts and Sciences, the John A. Paulson School of Engineering and Applied Sciences, the Division of Continuing Education, ten graduate and professional Schools, the Radcliffe Institute for Advanced Study, a variety of research museums and institutes, and an extensive library system to support the teaching and research activities of the Harvard community. The President and Fellows of
Harvard College (the “Corporation”), a governing board of the University, has oversight responsibility for all of the University’s financial affairs. The Corporation delegates substantial authority to the Schools and departments for the management of their resources and operations.
The University includes Harvard Management Company (HMC), a wholly owned subsidiary founded in 1974 to manage the University’s investment assets. HMC is governed by a Board of Directors that is appointed by the Corporation.
2. summary of significant accounting policies
Basis of presentationThe accompanying consolidated financial statements have been prepared on the accrual basis of accounting and include the accounts of the University and affiliated organizations controlled by the University. Significant inter-affiliate accounts and transactions have been eliminated.
Funds transferred to the University on behalf of specific beneficiaries (agency funds) are recorded as assets and liabilities in the Balance Sheets and are not included in the Statement of Changes in Net Assets with General Operating Account Detail.
The financial statements include certain prior year summarized comparative information in total, not by net asset classification. This information is not presented in sufficient detail to conform to generally accepted accounting principles (GAAP). Accordingly, such information should be read in conjunction with the University’s financial statements for the year ended June 30, 2015, from which the summarized information is derived.
Discontinued operationsOn May 31, 2015, the New England Primate Research Center (NEPRC) ceased operations following a two-year wind down period during which primates were moved to other sites, including the other National Primate Research Centers. The closure of the Southborough, MA facility resulted in a $50.8 million loss from discontinued operations, which includes a $15.8 million loss on impairment of fixed assets, for the year ended June 30 2015. These losses are classified as “Net loss from discontinued operations” in the non-operating section of the accompanying Statement of Change in Net Assets with General Operating Account Detail. There are no comparable losses in fiscal year 2016.
Net asset classificationsFor the purposes of financial reporting, the University classifies resources into three net asset categories pursuant to any donor-imposed restrictions and applicable law. Accordingly, the net assets of the University are classified
in the accompanying financial statements in the categories that follow:
unrestricted net assets are not subject to donor-imposed restrictions. Funds invested in fixed assets and unrestricted endowment funds comprise 95% of the University’s unrestricted net assets as of June 30, 2016. In addition, this category includes unrestricted gifts and endowment income balances, University-designated loan funds, and other unrestricted current funds.
temporarily restricted net assets are subject to legal or donor-imposed stipulations that will be satisfied either by actions of the University, the passage of time, or both. These net assets include gifts donated for a particular purpose, amounts subject to time restrictions such as funds pledged for future payment, or amounts subject to legal restrictions such as portions of otherwise unrestricted capital appreciation and income, which must be reported as temporarily restricted net assets until appropriated for spending in accordance with Massachusetts law.
permanently restricted net assets are subject to donor-imposed stipulations that they be invested to provide a perpetual source of income to the University. Generally, donors of these assets require the University to maintain and invest the original contribution in perpetuity, but permit the use of some or all investment returns for general or specific purposes.
Revenues from sources other than contributions are generally reported as increases in unrestricted net assets. Expenses are reported as decreases in unrestricted net assets. Gains and losses on investments are reported as increases or decreases in unrestricted net assets, unless their use is restricted by donor stipulations or by law. Investment returns earned by restricted donor funds are initially classified as temporarily restricted net assets and then reclassified to unrestricted net assets when expenses are appropriated or incurred for their intended purpose. Expirations of temporary restrictions on net assets are

19
ha
rva
rd
un
iver
sity
n
ote
s to
fin
anc
ial
stat
emen
ts
reported as reclassifications from temporarily restricted to unrestricted net assets and appear as “Net assets released from restrictions” and “Non-operating net assets released from restrictions” in the Statements of Changes in Net Assets.
Unconditional pledges are reported as increases in the appropriate categories of net assets in accordance with donor restrictions.
Net operating surplusRevenues earned, expenses incurred, and returns made available for operations for the purpose of teaching, conducting research, and the other programs and services of the University are the components of “Net operating surplus” in the Statement of Changes in Net Assets with General Operating Account Detail.
CollectionsThe University’s vast array of museums and libraries contains priceless works of art, historical treasures, literary works, and artifacts. These collections are protected and preserved for public exhibition, education, research, and the furtherance of public service. They are neither disposed of for financial gain nor encumbered in any manner. Accordingly, such collections are not recorded for financial statement purposes.
Insurance programsThe University, together with the Harvard-affiliated teaching hospitals, has formed a captive insurance company, Controlled Risk Insurance Company (CRICO), to provide limited professional liability, general liability, and medical malpractice insurance for its shareholders. The University self-insures a portion of its professional liability and general liability programs and maintains a reserve for incurred claims, including those related to Harvard Medical School activities occurring away from the affiliated teaching hospitals. The CRICO provided malpractice coverage applies with no deductible for medical professionals practicing within Harvard’s University Health Services department, the School of Dental Medicine, and the T.H. Chan School of Public Health. The University also maintains reserves for the self-insured portion of claims related to automobile liability, property damage, and workers’ compensation; these programs are supplemented with commercial excess insurance above the University’s self-insured limit. In addition, the University is self-insured for unemployment, the primary retiree health plan, and all health and dental plans for active employees. The University’s claims liabilities are recognized as incurred, including claims that have been incurred but not reported, and are included in operating expenses.
Tax-exempt statusThe University is a tax-exempt organization under Section 501(c)(3) of the Internal Revenue Code.
Use of estimatesThe preparation of financial statements in accordance with GAAP in the United States of America requires management to make estimates and assumptions that affect reported amounts and disclosures. Actual results could differ from those estimates.
New accounting pronouncementsEffective July 1, 2015, the University adopted Accounting Standard Update (ASU) No. 2014-11, Transfers and Servicing (Topic 860) – Repurchase-to-Maturity Transactions, Repurchase Financings, and Disclosures, which changes the accounting for repurchase- and resale-to-maturity agreements by requiring that such agreements be recognized as financing arrangements, and requires that a transfer of a financial asset and a repurchase agreement entered into contemporaneously be accounted for separately. ASU No. 2014-11 also requires additional disclosures about certain transferred financial assets accounted for as sales and certain securities financing transactions. The effects of adopting this amendment are addressed in Note 3.
Effective July 1, 2015, the University adopted ASU 2015-03, Interest – Imputation of Interest (Subtopic 835-30): Simplifying the Presentation of Debt Issuance Costs. The new guidance requires that debt issuance costs be netted against the carrying value of the liability, consistent with debt discounts or premiums. The effects of adopting this amendment are addressed in Note 12, and the 2015 presentation has been adjusted to conform to this new presentation.
Effective July 1, 2015, the University elected to retroactively adopt ASU No. 2015-07, Fair Value Measurement (Topic 820): Disclosures for Investments in Certain Entities That Calculate Net Asset Value per Share (or Its Equivalent). Under the new guidance, investments measured at net asset value (NAV), as a practical expedient for fair value, are excluded from the fair value hierarchy. In addition, when the NAV as practical expedient is not applied to eligible investments, certain other disclosures regarding nature and risks of investments are no longer required. The effects of adopting this amendment are addressed in Notes 4 and 13.
In January 2016, the Financial Accounting Standards Board (FASB) issued ASU 2016-01, Recognition and Measurement of Financial Assets and Financial Liabilities, which address certain aspects of recognition, measurement, presentation and disclosure of financial instruments. This guidance allows an entity to choose, investment-by-investment, to report an equity investment that neither has a readily determinable fair value, nor qualifies for the practical expedient for fair value estimation using NAV, at its cost minus impairment (if any), plus or minus changes resulting from observable price changes in orderly transactions for the identical or similar investment of the same issue.

20
ha
rva
rd
un
iver
sity
no
tes
to f
inan
cia
l st
atem
ents
3. investments
Investments are presented at fair value in accordance with GAAP. The University’s investment valuation policies and procedures are discussed in detail in Note 4.
Cash and short-term investments are recorded at cost, which approximates fair value, and include cash in bank accounts, institutional money market funds, and other temporary investments held for working capital purposes with maturities of three months or less. Cash and short-term investments do not include cash balances held as collateral by the University. Cash and short-term investment balances designated for investment purposes are included in the “Investment portfolio, at fair value” in the Balance Sheets.
Dividend income is recognized net of applicable withholding taxes on the ex-dividend date. Non-cash dividends are recorded at the fair value of the securities received. Interest income and expenses are recorded net of applicable withholding taxes on the accrual basis of accounting. The University amortizes bond premiums and accretes bond discounts using the effective yield method and when cash collection is expected.
The University utilizes a number of wholly owned subsidiary entities to support its investment activities. The consolidated financial statements include all assets, liabilities, income, and expenses associated with these entities. All intercompany accounts and transactions have been eliminated during consolidation.
The University separately reports the fair value of assets for which counterparties have the right to pledge or exchange the collateral they have received; investment portfolio assets that are unencumbered are included in “Investment portfolio, at fair value” in the Balance Sheets.
The majority of the University’s investments are managed by HMC in the GIA, a pooled fund that consists primarily of endowment assets. Certain other investments are managed separately from the GIA. These other investments consist primarily of cash, short-term investments, and fixed income securities (principally US government securities) held for the University’s working capital and liquidity needs; publicly traded securities associated with split interest agreements; and public and private investments donated to the University.
Impairment of such investments must be assessed qualitatively at each reporting period. Entities must disclose their financial assets and liabilities by measurement category and form of asset either on the face of the statement of financial position or in the accompanying notes. The ASU is effective for fiscal year 2020 for the University. The provision to eliminate the requirement to disclose the fair value of financial instruments measured at cost (such as the fair value of debt) has been early adopted by the University for fiscal 2016. The University is currently evaluating the impact of the new guidance on the consolidated financial statements.
In May 2014, the FASB issued ASU 2014-09, Revenue from Contracts with Customers at the conclusion of a joint effort with the International Accounting Standards Board to create common revenue recognition guidance for U.S. GAAP and international accounting standards. This framework ensures that entities appropriately reflect the consideration to which they expect to be entitled in exchange for goods and services, by allocating transaction price to identified performance obligations, and recognizing that revenue as performance obligations are satisfied. Qualitative and quantitative disclosures will be required to enable users of financial statements to understand the nature, amount, timing, and uncertainty of revenue and cash flows arising from contracts with customers. The original standard was effective for fiscal years beginning after December 15, 2016; however,
in July 2015, the FASB approved a one-year deferral of this standard, with a new effective date for fiscal years beginning after December 15, 2017, which is fiscal year 2019 for the University. The University is evaluating the impact this will have on the consolidated financial statements.
In February 2016, the FASB issued ASU 2016-02, Leases, which, requires a lessee to recognize a right-of-use asset and a lease liability, initially measured at the present value of the lease payments, in its balance sheet. The guidance also expands the required quantitative and qualitative disclosures surrounding leases. The ASU is effective for fiscal year 2020 for the University. Early adoption is permitted. The University is evaluating the impact of the new guidance on the consolidated financial statements.
In August 2016, the FASB issued ASU 2016-14, Presentation of Financial Statements for Not-for-Profit Entities, which makes targeted changes to the not-for-profit financial reporting model. The new ASU marks the completion of the first phase of a larger project aimed at improving not-for-profit financial reporting. Under the new ASU, net asset reporting will be streamlined and clarified. The ASU is effective for fiscal year 2019 for the University and early adoption is permitted. The University is evaluating the impact of the new guidance on the consolidated financial statements.

21
ha
rva
rd
un
iver
sity
n
ote
s to
fin
anc
ial
stat
emen
ts
The University’s investment strategy incorporates a diversified asset allocation approach and maintains, within defined limits, exposure to the movements of the global equity, fixed income, real estate, commodities, and private equity markets. The pooled GIA assets and liabilities on
page 22 have been disaggregated based on the exposure of the investment to these markets. Exposure to each asset class is achieved through investments in individual securities, direct investments in special purpose vehicles, and/or through vehicles advised by external managers.
A summary of the University’s total return on investments for fiscal 2016 and 2015 is presented below (in thousands of dollars):
1 Net of all internal and external management fees and expenses. 2 Includes total return on consolidated investments of $307.8 million and $624.2 million of which the University’s portion was $117.0 million and $454.7 million at
June 30, 2016 and 2015, respectively.
2016 2015Return on pooled general investment account: Realized and change in unrealized (depreciation)/appreciation, net $ (945,217) $ 2,003,651 Net investment income 150,843 225,532Total return on pooled general investment account 1, 2 (794,374) 2,229,183Return on other investments: Realized and change in unrealized appreciation/(depreciation), net 39,920 (20,681) Net investment income 27,816 27,869Total return on other investments 67,736 7,188Realized and change in unrealized (depreciation) on interest rate exchange agreement, net (22,767) (12,744)TOTAL RETURN ON INVESTMENTS $ (749,405) $ 2,223,627
2016 2015Investment portfolio, at fair value:
Pooled general investment account assets1 $ 64,994,597 $ 62,961,440Other investments2 1,995,976 2,572,682
Investment assets3 66,990,573 65,534,122
Pooled general investment account liabilities 25,021,206 21,166,693Interest rate exchange agreement 36,156 17,038Investment liabilities 25,057,362 21,183,731
TOTAL INVESTMENTS 41,933,211 44,350,391
Non-controlling interests attributable to the pooled general investment account 986,083 833,583TOTAL INVESTMENTS, NET $ 40,947,128 $ 43,516,808
1 Includes securities pledged to counterparties of $15,357,995 and $10,874,966 at June 30, 2016 and 2015, respectively. 2 As of June 30, 2016, other investments consisted primarily of repurchase agreements and US government securities of $1,025,559 and split interest agreement
assets outside of the GIA of $535,218. As of June 30, 2015, other investments consisted primarily of repurchase agreements and US government securities of $1,459,301 and split interest agreement assets outside of the GIA of $558,434.
3 Investment assets include cash and cash equivalents that consist principally of deposits that have maturities of 90 days or less. Cash and cash equivalents classified as investments were $1,001,104 and $711,186 at June 30, 2016 and 2015, respectively.
The University’s investment holdings as of June 30, 2016 and 2015 are summarized in the following table (in thousands of dollars):

22
ha
rva
rd
un
iver
sity
no
tes
to f
inan
cia
l st
atem
ents
1 Certain prior year amounts have been reclassified to better align with investment exposure and conform to current year presentation. 2 Includes collateral advanced under securities borrowing agreements of $100,848 and $691,240 as of June 30, 2016 and 2015, respectively. 3 Includes pending repurchase agreements that settled subsequent to the balance sheet date of $122,520 as of June 30, 2015. 4 As of June 30, 2016, other assets consisted primarily of receivables for transactions that settled subsequent to the balance sheet date of $480,039, before
eliminating inter-company balances, and assets consolidated under ASC 810 of $485,147. As of June 30, 2015, other assets consisted primarily of receivables for transactions that settled subsequent to the balance sheet date of $693,016, before eliminating inter-company balances, and assets consolidated under ASC 810 of $626,322.
5 Includes collateral held under securities lending agreements of $55,029 and $66,004 as of June 30, 2016 and 2015, respectively. 6 Includes pending reverse repurchase agreements that settled subsequent to the balance sheet date of $27,185 as of June 30, 2015. 7 As of June 30, 2016, other liabilities consisted primarily of payables for the purchase of securities of $721,172, before eliminating inter-company balances, and
liabilities consolidated under ASC 810 of $4,122,246. As of June 30, 2015, other liabilities consisted primarily of payables for the purchase of securities of $471,500, before eliminating inter-company balances, and liabilities consolidated under ASC 810 of $3,230,275.
8 The cost of the total investment assets, net of proceeds received from short positions, was $46,283,649 and $39,499,150 as of June 30, 2016 and 2015, respectively.
2016 2015POOLED GENERAL INVESTMENT ACCOUNT ASSETS:Investment assets:1
Domestic common and convertible equity $ 5,303,559 $ 6,313,333 Foreign common and convertible equity 1,828,114 2,591,172 Domestic fixed income 12,006,907 8,557,087 Foreign fixed income 3,625,651 3,206,849 Emerging market equity and debt 2,950,409 3,743,452 High yield 341,553 477,832 Absolute return 6,064,707 6,164,896 Private equities 7,125,969 7,257,750 Natural resources 3,955,384 4,283,935 Real estate 10,654,489 8,653,859 Inflation-indexed bonds 1,950,290 1,105,023 Due from brokers2 430,715 1,106,554Total investment assets 56,237,747 53,461,742Repurchase agreements3 6,938,860 7,621,408Cash and short-term investments 861,949 597,076Other assets4 956,041 1,281,214POOLED GENERAL INVESTMENT ACCOUNT ASSETS 64,994,597 62,961,440
POOLED GENERAL INVESTMENT ACCOUNT LIABILITIES:Investment liabilities: Equity and convertible securities sold, not yet purchased 94,104 611,107 Fixed income securities sold, not yet purchased 4,520,021 5,670,279 Due to brokers5 254,798 96,777Total investment liabilities 4,868,923 6,378,163Reverse repurchase agreements6 14,900,986 10,581,215Other liabilities7 5,251,297 4,207,315POOLED GENERAL INVESTMENT ACCOUNT LIABILITIES 25,021,206 21,166,693
Non-controlling interests attributable to the pooled general investment account 986,083 833,583POOLED GENERAL INVESTMENT ACCOUNT NET ASSETS8 $ 38,987,308 $ 40,961,164
1 Includes only the portion of the endowment invested in the GIA and excludes pledges, interests in trusts held by others, other non-GIA investments, and GIA income.
As of June 30, 2016 and 2015, the GIA was comprised of the following components (in thousands of dollars):
2016 2015POOLED GENERAL INVESTMENT ACCOUNT Endowment1 $ 33,863,945 $35,703,136 General Operating Account 3,788,288 3,893,044 Split interest agreements 755,923 806,219 Other internally designated funds 579,152 558,765TOTAL POOLED GENERAL INVESTMENT ACCOUNT NET ASSETS $ 38,987,308 $ 40,961,164
The pooled GIA assets and liabilities as of June 30, 2016 and 2015 are summarized as follows (in thousands of dollars):

23
ha
rva
rd
un
iver
sity
n
ote
s to
fin
anc
ial
stat
emen
ts
The asset allocation of the University’s investment portfolio involves exposure to a diverse set of markets. The investments within these markets involve various risks such as price, interest rate, market, sovereign, currency, liquidity, and credit risks. Additionally, the GIA’s direct investments in natural resources and real estate expose the University to a unique set of risks such as operational, environmental, and political risks. Furthermore, as of June 30, 2016, 20% of the GIA NAV was made up of four diversified fund managers and one direct investment manager. The University anticipates that the value and composition of its investments may, from time to time, fluctuate substantially in response to any or all of the risks described herein.
The University has various sources of liquidity at its disposal within its investment pools, including approximately $3.6 billion in cash and cash equivalents (including repurchase agreements of $2.7 billion) at June 30, 2016 in the GIA and the GOA. In addition, the University estimates that as of June 30, 2016, it could liquidate additional unencumbered US government securities of $2.9 billion within one business day (typical settlement terms) to meet any immediate short-term needs of the University.
The University Balance Sheets display both the assets and corresponding liabilities generated by repurchase, reverse repurchase, securities borrowing, and securities lending transactions. The University enters into these transactions under agreements containing master netting arrangements. The University requires the fair value of the collateral exchanged under these agreements to be equal to or in excess of the total amount of the agreement, including interest where applicable. Collateral is exchanged as required by fluctuations in the fair value of these instruments. In the event of a counterparty default, the University generally has the right to close out all transactions traded under such agreements and to net amounts owed or due across all transactions and offset such net payable or receivable with collateral posted by one party or the other.
The following table presents information about the offsetting of these instruments and related collateral amounts as of June 30, 2016 and 2015 (in thousands of dollars):
1 The University does not offset repurchase and securities borrowing agreements and reverse repurchase and securities lending agreements that are subject to master netting arrangements or similar arrangements on the University’s Balance Sheets. Refer to Note 5 for information related to offsetting of derivatives.
2 Net exposure excludes any over-collateralized amounts. 3 Includes securities in transit of $124,221 as of June 30, 2015, that settled within one to two business days subsequent to the transaction date. 4 Includes securities in transit of $27,134 as of June 30, 2015, that settled within one to two business days subsequent to the transaction date.
As of June 30, 2016 As of June 30, 2015
Gross asset Net Gross asset Net amounts1 Collateral exposure2 amounts1 Collateral3 exposure2
Repurchase agreements $ 7,443,773 $ 7,443,773 $ 0 $ 8,580,607 $ 8,580,607 $ 0Securities borrowing agreements 100,848 100,848 0 691,240 691,240 0TOTAL REPURCHASE AND SECURITIES BORROWING AGREEMENTS $ 7,544,621 $ 7,544,621 $ 0 $ 9,271,847 $ 9,271,847 $ 0
Gross liability Net Gross liability Net amounts1 Collateral exposure2 amounts1 Collateral4 exposure2
Reverse repurchase agreements $ 14,900,986 $ 14,900,986 $ 0 $ 10,581,215 $ 10,581,215 $ 0Securities lending agreements 55,029 55,029 0 66,004 66,004 0TOTAL REVERSE REPURCHASE AND SECURITIES LENDING AGREEMENTS $ 14,956,015 $ 14,956,015 $ 0 $ 10,647,219 $ 10,647,219 $ 0

24
ha
rva
rd
un
iver
sity
no
tes
to f
inan
cia
l st
atem
ents
The University has consolidated, under ASC 810, certain non-controlling interests relating to its investments in natural resources and real estate assets. These non-controlling interests represent the minority interest portion of these assets controlled by the University that are required to be presented on the University’s balance sheet under GAAP. The net increase in non-controlling interests year over year of $152.5 million is due to $190.8 million in appreciation on existing non-controlling interests and $50.7 million of contributions made by minority partners offset by $89.0 million in distributions to the minority partners.
Other liabilities on page 22 include debt outstanding on consolidated portfolio investments of $3,429.9 million and $2,629.0 million as of June 30, 2016 and 2015, respectively. This debt is categorized as Level 3 in the ASC 820 fair value hierarchy as defined in Note 4. Based on the structure, duration, and nature of the debt being consolidated, the amounts approximate the fair value of the debt as of each reporting period. This debt is utilized for purposes specific to natural resources and real estate assets held by the investment portfolio, and is non-recourse to any other assets held by the University.
The following table presents information about the collateral pledged and maturity dates for reverse repurchase and securities lending transactions as of June 30, 2016 (in thousands of dollars):
As of June 30, 2016 Remaining contractual maturity of agreements Overnight and Continuous Up to 30 days TotalReverse repurchase agreements: Domestic fixed income $ 3,292,021 $ 7,228,071 $ 10,520,092 Foreign fixed income 3,531,153 3,531,153 High yield 59,550 59,550 Inflation-indexed bonds 68,846 721,345 790,191TOTAL REVERSE REPURCHASE AGREEMENTS 3,420,417 11,480,569 14,900,986
Securities lending agreements: Emerging market equity and debt 27,564 27,564 High yield 27,465 27,465TOTAL SECURITIES LENDING AGREEMENTS 55,029 55,029
TOTAL REVERSE REPURCHASE AND SECURITIES LENDING AGREEMENTS $ 3,475,446 $ 11,480,569 $ 14,956,015
The University endeavors to utilize all relevant and available information in measuring fair value. Investments are valued in accordance with ASC 820, and under the guidelines prescribed by the HMC investment valuation policy, which is reviewed and approved by the HMC Board of Directors on an annual basis.
Instruments listed or traded on a securities exchange are valued at the last quoted price on the primary exchange where the security is traded. Where there is no readily available closing price on the valuation date, long positions are valued at the bid price and short positions are valued at the ask price. Restrictions that are attached to a security are factored into the valuation of that security, reflective of the estimated impact of those restrictions. Investments in non-exchange traded debt and equity instruments are primarily valued using inputs provided by independent pricing services or by broker/dealers who actively make markets in these securities.
Over the counter (OTC) derivative products classified as due to/from brokers include option, swap, credit default, interest rate, and forward contracts. These types of instruments are primarily valued using industry standard models with independent market inputs, or by broker quotes. Inputs such as prices, spreads, curves, and/or broker quotes are evaluated for source reliability and consistency with industry standards. Counterparty marks obtained and utilized to determine daily collateral requirements are also used to corroborate input reasonability. The University considers current market conditions including interest rate and credit risks in its evaluation of inputs, pricing methodologies, and models utilized to determine fair values.
Investments managed by external advisors include investments in private equity, real estate, natural resources, absolute return, and other externally managed funds. The majority of these investments are not readily marketable and are reported at fair value utilizing the most current
4. fair value of investment assets and liabilities

25
ha
rva
rd
un
iver
sity
n
ote
s to
fin
anc
ial
stat
emen
ts
information provided by the external advisor, subject to assessments that the information is representative of fair value and in consideration of any additional factors deemed pertinent to the fair value measurement. The University evaluates its external advisors through a manager due-diligence program executed by HMC, which includes an analysis of an advisor’s use of and adherence to fair value principles. In situations where the information provided by the external advisor is deemed to not be representative of fair value as of the measurement date, the University will evaluate specific features of the investment and utilize supplemental information provided by the external advisor along with any relevant market data to measure the investment’s fair value as of that date.
Direct investments in real estate, natural resources, specifically timberland and agriculture, as well as private equity are primarily valued using a combination of independent appraisals and/or one or more industry standard valuation techniques (e.g., income approach, market approach, or cost approach). The income approach is primarily based on the investment’s anticipated future income using one of two principal methods: the discounted cash flow method or the capitalization method. Inputs and estimates developed and utilized in the income approach may be subjective and require judgment regarding significant matters such as estimating the amount and timing of future cash flows and the selection of discount and capitalization rates that appropriately reflect market and credit risks. The market approach derives investment value through comparison to recent and relevant market transactions with similar investment characteristics. The cost approach is utilized when the cost of the investment is determined to be the best representation of fair value. This method is typically used for newly purchased or undeveloped assets. The valuation process encompasses a wide range of procedures that in the aggregate allow the University to assert as to the adequacy of the fair values reported as of the measurement date. The HMC Board of Directors discusses the valuation process and results with HMC management, and makes determinations on significant matters impacting valuation that may arise from time to time.
The University’s investments have been categorized based upon the fair value hierarchy in accordance with ASC 820, which prioritizes the inputs to valuation techniques used to measure fair value of investment assets and liabilities into three levels:
level 1 Unadjusted quoted prices in active markets that are accessible at the measurement date for identical, unrestricted assets or liabilities;
level 2 Quoted prices in markets that are not considered to be active or financial instruments for which all significant inputs are observable, either directly or indirectly;
level 3 Prices or valuations that require inputs that are significant to the fair value measurement, unobservable and/or require the University to develop its own assumptions.
Per ASU No. 2015-07 investments measured at net asset value, as reported by external managers, as a practical expedient for the fair value, are excluded from the fair value hierarchy.
The level of an asset or liability within the fair value hierarchy is based on the lowest level of any input that is significant to the fair value measurement. Transfers between levels are recognized at the beginning of the year.

26
ha
rva
rd
un
iver
sity
no
tes
to f
inan
cia
l st
atem
ents
1 Total change in unrealized appreciation/(depreciation) relating to Level 3 investment assets and investment liabilities still held by the University at June 30, 2016 is $(341,862) and is reflected in “Realized and change in unrealized (depreciation)/appreciation, net” in the Statements of Changes in Net Assets.
2 During the fiscal year, certain transfers into Level 3 represent instances of deviation from the practical expedient whereas certain transfers out of Level 3 represent a return to the practical expedient. Certain securities, included in Due from/to brokers, valued using single broker quotes were transferred into Level 3. Certain securities, included in Due from brokers, no longer valued using single broker quotes were transferred out of Level 3.
The following is a rollforward of Level 3 investments for the year ended June 30, 2016 (in thousands of dollars): Net change Beginning Net realized in unrealized Transfers Transfers Ending balance as of gains/ appreciation/ Purchases/ Sales/ into out of balance as of July 1, 2015 (losses) (depreciation)
1 contributions distributions Level 3
2 Level 3
2 June 30, 2016
INVESTMENT ASSETS:Domestic fixed income $ 10,000 $ 10,000High yield $ 35,197 $ 165 $ 15,032 40,887 $ (84,657) 6,624Absolute return 175,556 217 (74,544) 2,265 (4,565) 98,929Private equities 278,042 141,859 (234,546) 205,002 (205,002) $ 17 185,372Natural resources 3,946,937 103,991 (364,940) 210,422 (258,849) 3,637,561Real estate 5,465,543 116,483 1,520,446 1,026,030 (627,409) $ (5,434) 7,495,659Due from brokers 103,444 13,638 93,091 155,469 (195,575) 14,326 (111) 184,282Other investments 20,326 296 (17,475) 3,147Interests in trusts held by others 363,175 (7,340) 355,835TOTAL ASSETS SUBJECT TO FAIR VALUE LEVELING $ 10,388,220 $ 376,649 $ 929,724 $ 1,650,075 $ (1,376,057) $ 14,343 $ (5,545) $ 11,977,409
INVESTMENT LIABILITIES:Due to brokers $ 462 $ (24,287) $ 78,662 $ (133,739) $ 83,222 $ 14,326 $ 18,646Other liabilities subject to fair value 2,629,035 (28,944) (452,725) 1,282,521 3,429,887TOTAL LIABILITIES SUBJECT TO FAIR VALUE LEVELING $ 2,629,497 $ (24,287) $ 49,718 $ (586,464) $ 1,365,743 $ 14,326 $ 3,448,533
2016 2015 Level 1 Level 2 Level 3 Total Level 1 Level 2 Level 3 TotalINVESTMENT ASSETS:1
Cash and short-term investments $ 1,001,104 $ 1,001,104 $ 711,186 $ 711,186Domestic common and convertible equity 86,354 86,354 1,018,938 $ 86,958 1,105,896Foreign common and convertible equity 119,179 119,179 830,074 830,074Domestic fixed income 12,561,479 $ 53,242 $ 10,000 12,624,721 9,128,709 28,110 9,156,819Foreign fixed income 778,927 2,874,363 3,653,290 1,512,530 1,727,753 3,240,283Emerging market equity and debt 1,687,492 66,367 1,753,859 2,255,442 254,636 2,510,078High yield 132,983 197,236 6,624 336,843 54,208 374,841 $ 35,197 464,246Absolute return 98,929 98,929 175,556 175,556Private equities 185,372 185,372 278,042 278,042Natural resources 1,393 3,637,561 3,638,954 1,406 3,946,937 3,948,343Real estate 37,840 7,495,659 7,533,499 5,465,543 5,465,543Inflation-indexed bonds 1,966,233 1,966,233 1,117,971 1,117,971Due from brokers 7,839 154,281 184,282 346,402 45,913 298,823 103,444 448,180Other investments 21,621 3,306 3,147 28,074 10,893 2,631 20,326 33,850Repurchase agreements 7,443,773 7,443,773 8,580,607 8,580,607Interests in trusts held by others2 355,835 355,835 363,175 363,175INVESTMENT ASSETS SUBJECT TO FAIR VALUE LEVELING $ 18,402,444 $ 10,792,568 $ 11,977,409 41,172,421 $ 16,687,270 $ 11,354,359 $ 10,388,220 38,429,849Investments measured using the practical expedient 24,949,883 25,262,493Securities borrowing agreements 100,848 691,240Other assets not subject to fair value 1,139,793 1,546,581TOTAL ASSETS3 $ 67,362,945 $ 65,930,163
INVESTMENT LIABILITIES:Equity and convertible securities sold, not yet purchased $ 94,104 $ 94,104 $ 611,107 $ 611,107Fixed income securities sold, not yet purchased 4,264,293 $ 255,729 4,520,022 3,924,873 $ 1,745,406 5,670,279Due to brokers4 57,079 176,736 $ 18,646 252,461 13,295 66,920 $ 462 80,677Reverse repurchase agreements 14,900,986 14,900,986 10,581,215 10,581,215Liabilities due under split interest agreements2 791,202 791,202 910,084 910,084Other liabilities subject to fair value 3,429,887 3,429,887 2,629,035 2,629,035INVESTMENT LIABILITIES SUBJECT TO FAIR VALUE LEVELING $ 4,415,476 $ 16,124,653 $ 3,448,533 23,988,662 $ 4,549,275 $ 13,303,625 $ 2,629,497 20,482,397Securities lending agreements 55,029 66,004Other liabilities not subject to fair value 1,821,410 1,578,280TOTAL LIABILITIES3 $ 25,865,101 $ 22,126,681
1 Certain prior year amounts have been reclassified to better align with investment exposure and conform to current year presentation. 2 Amounts excluded from investments and included separately on the University’s Balance Sheets. 3 For purposes of reporting by level under the fair value hierarchy, some assets and liabilities are shown gross that are otherwise reported net in the table on page 22. 4 Includes fair value of interest rate exchange agreement on the University’s debt portfolio of $36,156 and $17,038 as of June 30, 2016 and 2015, respectively.
The following is a summary of the levels within the fair value hierarchy for those investment assets and liabilities subject to fair value measurement as of June 30, 2016 and 2015 (in thousands of dollars):

27
ha
rva
rd
un
iver
sity
n
ote
s to
fin
anc
ial
stat
emen
ts
1 Total change in unrealized appreciation/(depreciation) relating to Level 3 investment assets and investment liabilities still held by the University at June 30, 2015 is $1,302,246 and is reflected in “Realized and change in unrealized (depreciation)/appreciation, net” in the Statements of Changes in Net Assets.
2 During the fiscal year, the University changed the asset class designation for certain Level 3 investments to better align with investment exposure. Additionally, certain transfers into Level 3 represent instances of deviation from the practical expedient whereas certain transfers out of Level 3 represent a return to the practical expedient. Certain securities, included in Due from brokers, valued using single broker quotes were transferred into Level 3.
3 Certain prior year amounts have been reclassified to better align with investment exposure and conform to current year presentation.
The following is a rollforward of Level 3 investments for the year ended June 30, 2015 (in thousands of dollars):
Net change Beginning Net realized in unrealized Transfers Transfers Ending balance as of gains/ appreciation/ Purchases/ Sales/ into out of balance as of July 1, 2014 (losses) (depreciation)
1 contributions distributions Level 3
2 Level 3
2 June 30, 2015
INVESTMENT ASSETS:3
Domestic fixed income $ 3,932 $ (159) $ 73 $ (1,296) $ (2,550) $ 0High yield 12,483 (2,670) 1,533 $ 53,673 (32,372) $ 2,550 35,197Absolute return 199,609 500 (76,553) 77,565 (25,565) 175,556Private equities 191,011 15,613 (25,935) 130,001 (14,476) (18,172) 278,042Natural resources 4,415,026 528,660 (388,171) 493,836 (1,102,414) 3,946,937Real estate 4,053,221 58,686 1,124,028 827,627 (461,756) 11,909 (148,172) 5,465,543Due from brokers 7,984 (593) (9,305) 108,438 (63,313) 60,233 103,444Other investments 20,511 42 (227) 20,326Interests in trusts held by others 376,526 (13,351) 363,175TOTAL ASSETS SUBJECT TO FAIR VALUE LEVELING $ 9,280,303 $ 600,079 $ 612,092 $ 1,691,140 $ (1,701,192) $ 74,692 $ (168,894) $ 10,388,220
INVESTMENT LIABILITIES:Due to brokers $ 17,196 $ 1,464 $ (39,011) $ (16,811) $ 37,624 $ 462Other liabilities subject to fair value 2,018,829 (38,507) (138,439) 787,152 2,629,035TOTAL LIABILITIES SUBJECT TO FAIR VALUE LEVELING $ 2,036,025 $ 1,464 $ (77,518) $ (155,250) $ 824,776 $ 2,629,497
Investments that trade in inactive markets, but are valued based on quoted market prices, broker/dealer quotations, or independent pricing services supported by observable inputs are primarily classified within Level 2. These may include non-exchange traded equity and fixed income securities, securities subject to restriction, and certain OTC derivatives. Other investments, including OTC derivatives valued using broker quotes or other industry standard models, where unobservable inputs may have been obtained
from third parties, have been classified as Level 3 in accordance with the fair value hierarchy under ASC 820.
The University is a limited partner in private equity and real estate partnerships, and other external investment managers, which include commitments to make periodic contributions in future periods. The amounts of these expected disbursements as of June 30, 2016 and 2015 are disclosed below (in thousands of dollars):
As of June 30, 2016 As of June 30, 2015 Remaining Remaining unfunded Estimated unfunded Estimated Fair value1 commitments remaining life2 Fair value1 commitments remaining life2
Private equities $ 5,670,822 $ 4,084,380 4–10 $ 5,945,381 $ 2,886,558 4–10Real estate 2,424,358 1,714,591 4–10 2,178,485 1,409,809 4–10Other externally managed funds3 2,266,998 1,416,297 2–8 1,658,033 1,569,692 2–8TOTAL $ 10,362,178 $ 7,215,268 $ 9,781,899 $ 5,866,059
1 Represents the fair value of the funded portion of investments with remaining unfunded commitments. 2 The estimated remaining lives of these funds, expressed in years, are forward-looking projections based on the University’s estimates and could vary significantly
depending on the investment decisions of external managers, changes in the University’s investment portfolio, and other circumstances. 3 Investments in externally managed funds primarily include exposures to absolute return and natural resources.
The nature of these partnership interests is that distributions are received through the liquidation of the underlying assets of the partnership over its remaining life. The fair value of the investments in these asset classes has generally been estimated using the University’s capital account balance with each partnership, unless the University has deemed the NAV to be an inappropriate representation of fair value. To evaluate the fair value of the University’s externally managed investments, the
University has assessed factors including, but not limited to, the external advisor’s adherence to fair value principles in calculating the capital account balance, the existence of transactions at NAV at the measurement date, and the existence or absence of certain restrictions at the measurement date. Investments in externally managed funds generally have limited redemption options for investors and, subsequent to final closing, may or may not permit subscriptions by new or existing investors. These

28
ha
rva
rd
un
iver
sity
no
tes
to f
inan
cia
l st
atem
ents
entities may also have the ability to impose gates, lockups, and other restrictions on an investor’s ability to readily redeem out of their investment interest in the partnership.
The valuation procedures performed on direct investments are based on industry standard processes for each respective asset class. The inputs utilized in any valuation model may be significant and unobservable, and require a certain degree of judgment. The University examines market data and collaborates closely with industry experts to attempt to arrive at the best estimation of fair value for each respective asset. While the inputs described below represent the range of inputs utilized as of the measurement date, these inputs
may change over time, which may have a material effect on the valuation of these types of investments in the future. Additionally, there may be interrelationships between the unobservable inputs utilized in any valuation model, and significant changes in any of those inputs, in isolation or in the aggregate, may trigger changes in other inputs or in the estimated fair value for each respective investment asset. The University has not assessed the sensitivity to unforeseeable changes in significant unobservable inputs; rather the range of inputs described below illustrate those inputs utilized by management in arriving at fair value for these direct investments as of the measurement date.
5. derivatives
The University uses a variety of financial instruments with off-balance sheet risk involving contractual or optional commitments for future settlement, which are exchange traded or executed OTC. Certain instruments are cleared and settled through central clearing counterparties, while others are bilateral contracts between two counterparties. These instruments are used to increase or decrease exposure to a given asset class, with the goal of enhancing the returns of these asset classes. The market risk of a particular strategy is influenced by the relationship between the financial instruments with off-balance sheet risk and the offsetting positions recorded in the Balance Sheets. The University manages exposure to market risk through the
use of industry standard analytical tools that measure the market exposure of each position within a strategy. The strategies are monitored daily, and positions are frequently adjusted in response to changes in the financial markets.
In connection with its derivative activities, the University generally maintains master netting agreements and collateral agreements with its counterparties. These agreements provide the University the right, in the event of default by the counterparty (such as bankruptcy or a failure to pay or perform), to net a counterparty’s rights and obligations under the agreement and to liquidate and offset collateral against any net amount owed by the counterparty.
As of June 30, 2016 As of June 30, 2015 Level 3 investments Range of Level 3 investments Range of subject to fair value inputs utilized in subject to fair value inputs utilized in Significant unobservable input by asset class1 (in thousands of dollars)2 valuation model3 (in thousands of dollars)2 valuation model3
Natural resources: $ 3,637,561 $ 3,845,097 Income approach discount rate 5.5%–18.0% 5.5%–15.0% Price per planted hectare $2,106–$161,206 $3,673–$132,207 Price per gross hectare $447–$33,855Real estate: 7,479,377 5,230,378 Income approach discount rate 5.8%–19.8% 5.8%–20.4% Capitalization rate 2.5%–10.0% 2.8%–10.0% Net operating income growth rate 2.1%–5.6% 2.0%–7.7% Recent financing – discount 20.0% Private equities: 147,571 Income approach discount rate 6.0%–15.25% EBITDA multiple 8.0x–10x Equity valuation multiple 6.0x–8.5x Net income multiple 7.0x Revenue per unit $0.40 Absolute return: 78,789 87,128 Book value multiplier 0.7x 1xOther liabilities subject to fair value (3,429,887) (2,629,035) Loan to value 3.7%–87.7% 2.3%–86.3% Market interest rate 2.0%–18.7% 1.7%–10%NET AMOUNT $ 7,913,411 $ 6,533,568
1 The fair value of investments may be determined using multiple valuation techniques. 2 Included within Level 3 investments is $615,465 and $1,225,155 as of June 30, 2016 and 2015, respectively, which were valued using other inputs including, but not
limited to single source broker quotations, third party pricing and prior transactions. 3 The range of inputs encompasses a variety of investment types within each asset class.

29
ha
rva
rd
un
iver
sity
n
ote
s to
fin
anc
ial
stat
emen
ts
1 For the year ended June 30, 2016, includes a gross derivative liability of $36,156 and a net loss of $22,767, related to an interest rate exchange agreement on the University’s debt portfolio. For the year ended June 30, 2015, includes a gross derivative liability of $17,038 and a net loss of $12,744, related to an interest rate exchange agreement on the University’s debt portfolio. These positions are further discussed in Note 12.
2 GAAP permits the netting of derivative assets and liabilities and the related cash collateral received and paid when a legally enforceable master netting agreement exists between the University and a derivative counterparty. Refer to Note 3 for information related to offsetting of certain other collateralized transactions.
3 Included within the “Investment portfolio, at fair value” and “Securities lending and other liabilities associated with the investment portfolio” line items of the Balance Sheets.
4 Included within “Realized and change in unrealized (depreciation)/appreciation, net” within the Statements of Changes in Net Assets. 5 Includes securities posted to meet initial margin requirements on exchange traded futures and centrally cleared derivatives. 6 Includes collateral in transit of $106,960 and $87,598 as of June 30, 2016 and 2015, respectively, that settled within one to two business days subsequent to the
transaction date. 7 Excludes any over-collateralized amounts in accordance with ASC 210.
The following table presents information about the University’s derivatives by primary risk exposure for the years ended June 30, 2016 and 2015 (in thousands of dollars):
For the For the year ended year ended As of June 30, 2016 June 30, 2016 As of June 30, 2015 June 30, 2015 Gross Gross Gross Gross derivative derivative Net profit/ derivative derivative Net profit/Primary risk exposure assets liabilities (loss)4 assets liabilities (loss)4
Equity instruments: Equity futures $ 1,778 $ 11,111 $ (47,007) $ 25,676 $ 3,537 $ (5,529) Equity options 157,782 141,404 (41,090) 88,398 29,119 2,869 Equity exchange agreements 195,941 125,851 (231,112) 84,286 112,477 (132,958)TOTAL EQUITY INSTRUMENTS 355,501 278,366 (319,209) 198,360 145,133 (135,618)
Fixed income instruments: Fixed income futures 28,780 83,232 (26,753) 15,851 22,710 3,817 Fixed income options 8,270 2,470 13,067 2,200 7,419 13,705 Interest rate exchange agreements1 2,103,301 2,078,179 (303,236) 1,707,173 1,470,383 (37,044) Interest rate caps and floors 61,628 69,614 (10,547) 220,138 179,050 7,018TOTAL FIXED INCOME INSTRUMENTS 2,201,979 2,233,495 (327,469) 1,945,362 1,679,562 (12,504)
Commodity instruments: Commodity futures 50,233 48,100 (15,476) 18,525 17,029 71,047 Commodity options 13 (673) 3,600 22,570 Commodity exchange agreements 87 1,680 28,358 3,318 10,191TOTAL COMMODITY INSTRUMENTS 50,333 48,100 (14,469) 50,483 20,347 103,808
Currency instruments: Currency forwards 10,874,893 10,861,727 26,263 3,443,981 3,436,484 141,823 Currency options 35,316 33,441 11,570 101,529 82,340 14,156 Currency exchange agreements 6,329 3,366 (1,284) 10,819 3,544 12,708TOTAL CURRENCY INSTRUMENTS 10,916,538 10,898,534 36,549 3,556,329 3,522,368 168,687
CREDIT INSTRUMENTS 70,338 42,252 30,181 51,169 66,790 9,971
SUBTOTAL 13,594,689 13,500,747 $ (594,417) 5,801,703 5,434,200 $ 134,344
Counterparty netting2
Exchange traded (89,271) (89,271) (40,076) (40,076) Centrally cleared (349,572) (349,572) (218,265) (218,265) Bilateral OTC (12,862,135) (12,862,135) (5,145,086) (5,145,086)TOTAL COUNTERPARTY NETTING (13,300,978) (13,300,978) (5,403,427) (5,403,427)
NET AMOUNTS INCLUDED IN THE BALANCE SHEETS3 293,711 199,769 398,276 30,773
Collateral Cash collateral received/posted 10,007 129,670 80,842 8,689 Securities collateral received/posted5,6 226,359 329,801 318,734 289,330TOTAL COLLATERAL 236,366 459,471 399,576 298,019
NET AMOUNT 57,345 (259,702) (1,300) (267,246)
NET AMOUNT IN ACCORDANCE WITH ASC 2107 $ 57,345 $ 0 $ 0 $ 0

30
ha
rva
rd
un
iver
sity
no
tes
to f
inan
cia
l st
atem
ents
The following section details the accounting for each type of derivative contract, as well as the University’s intended purpose for entering into each type of derivative instrument.
OptionsThe University purchases and sells put and call options to take advantage of expected volatility in the price of underlying instruments. When purchasing an option, the University pays a premium, which is recorded as an asset and subsequently marked-to-market to reflect the current value of the option. When the University sells (writes) an option, the premium received is recorded as a liability and subsequently marked-to-market to reflect the current fair value of the option written. Premiums paid or received from options that expire unexercised are treated as realized losses and gains, respectively. When an option is closed before expiration or exercise, the University records a realized gain or loss equal to the difference between the proceeds paid/received upon closing and the original premium paid/received.
During fiscal years 2016 and 2015, the University transacted approximately 2,100 and 1,500 equity and fixed income option trades with an average transaction size of approximately 108,500 and 12,700 contracts, respectively. During the same period the University transacted approximately 300 and 400 currency option contracts with average USD equivalent notional amounts of approximately $40.7 million and $36.7 million per contract, respectively. Additionally, the University transacted approximately 100 and 300 commodity option trades with an average transaction size of approximately 300 and 1,100 contracts, respectively.
Swap contractsThe University enters into swap contracts, which are contracts between two parties to exchange future cash flows at periodic intervals based on a notional principal amount, to increase or decrease its exposure to changes in the level of interest rates, underlying asset values and/or credit risk. Payments are exchanged at specified intervals, accrued daily commencing with the effective date of the contract and recorded as realized gains or losses. Gains or losses are realized in the event of an early termination of a swap contract. Risks of loss may include unfavorable changes in the returns of the underlying instruments or indexes, adverse fluctuations of interest rates, failure of the counterparty to perform under the terms of the agreement, and lack of liquidity in the market.
Collateral in the form of securities or cash may be posted to or received from the swap counterparty in accordance with the terms of the swap contract. Realized gains or losses are
recorded relating to periodic payments received or made on swap contracts and with respect to swaps that are closed prior to termination date. When the University enters into a swap transaction, it may make or receive a payment equal to the value of the swap on the entry date and amortizes such payments to realized gain or loss over the outstanding term of the swap. The terms of the swap contracts can vary, and they are reported at fair value based on a valuation model or a counterparty provided price.
In the normal course of its trading activities, the University enters into credit default, interest rate, and total return swap contracts.
Credit default contractsThe University enters into credit derivatives to simulate long and short bond exposure that is either unavailable or considered to be less attractively priced in the bond market, or to hedge exposure obtained in the bond market. The University also uses these derivatives to reduce risk where it has exposure to the issuer, or to take an active long or short position with respect to the likelihood of an event of default. The underlying debt security on which the derivative is structured can be based on a single issuer, a “basket” of issuers, or an index. During fiscal years 2016 and 2015, the University transacted approximately 1,100 and 700 credit default contracts, respectively. These contracts had average notional amounts of approximately $8.0 million and $18.0 million in fiscal years 2016 and 2015, respectively.
In instances where the University has purchased credit protection on an underlying debt security, the University is obligated to pay the seller of the credit protection a periodic stream of payments over the term of the contract in return for a contingent payment upon the occurrence of a credit event with respect to the issuer of the debt security. The contingent payment may be a cash settlement or a physical delivery of the debt security in return for payment of the face amount of the obligation. The amount paid for purchased protection is typically a nominal percentage of the notional amount. In instances where the University has sold credit protection on an underlying debt security, the University receives a fixed rate of income throughout the term of the contract, which typically is between one month and five years, and in some instances up to ten years. In the case where the University sold credit protection, if a credit event occurs, the University may cash settle the contract or pay the purchaser of credit protection the full notional value of the contract in exchange for the debt security.
As of June 30, 2016, the University’s purchased and written credit derivatives had gross notional amounts of $1,157.8 million and $1,565.9 million, respectively, for total net written protection of $408.1 million in notional value.

31
ha
rva
rd
un
iver
sity
n
ote
s to
fin
anc
ial
stat
emen
ts
Credit ratings on the underlying debt security, together with the period of expiration, are indicators of payment/performance risk. For example, the seller of credit protection is least likely to pay or otherwise be required to perform where the credit ratings are AAA and the period of expiration is “< 5 years”. The likelihood of payment or performance is generally greater as the credit ratings fall and period of expiration increases.
Interest rate contractsThe University enters into interest rate swaps to hedge certain investment positions against interest rate fluctuations; to benefit from interest rate fluctuations; to obtain better interest rate terms than it would have been able to get without the swap; or to manage the interest, cost, and risk associated with its outstanding and/or future debt. Interest rate swaps involve the exchange by the University with another party of its respective commitments to pay or receive interest at specified intervals based on a notional amount of principal. During fiscal years 2016 and 2015, the University transacted approximately 3,200 and 4,700 interest rate swap and cap/floor contracts with average notional amounts of approximately $248.0 million and $251.0 million, respectively.
Total return swapsThe University enters into total return swaps to manage its exposure to market fluctuations in various asset classes. Total return swaps involve commitments to pay interest in exchange for a market linked return, both based on notional amounts. To the extent the total return of the security or index underlying the transaction exceeds or falls short of the offsetting interest rate obligation, the University will receive a payment from or make a payment to the counterparty, respectively. During fiscal years 2016 and 2015, the University transacted approximately 50 and 200 commodity swap contracts with average notional amounts of approximately $1.8 million and $5.9 million; 1,800 and 1,500 equity swap contracts with average notional amounts of approximately $7.9 million and $5.2 million; and 100 and 200 currency swap contracts with average notional amounts of approximately $29.0 million and $30.0 million, respectively. In addition, during fiscal year 2016, the University transacted approximately 60 credit swaps with average notional amounts of approximately $27.0 million.
As of June 30, 2015, the University’s purchased and written credit derivatives had gross notional amounts of $1,935.7 million and $1,761.3 million, respectively, for total net purchased protection of $174.4 million in notional value.
The table below summarizes certain information regarding credit protection purchased and written as of June 30, 2016 and 2015 (in thousands of dollars):
As of June 30, 2016 Purchased protection Written protection Years to maturity – notional Total Offsetting Net NetCredit rating Purchased Purchased written purchased written writtenon underlying notional1 fair value < 5 years 5-10 years notional notional2 notional fair valueA- to AAA $ 221,250 $ (4,278) $ 65,000 $ 65,000 $ 12,000 $ 53,000 $ 494BBB- to BBB+ 566,524 (8,076) 756,390 756,390 43,000 713,390 11,940Non-investment grade 218,553 (4,299) 727,000 $ 17,500 744,500 96,500 648,000 4,908TOTAL $ 1,006,327 $ (16,653) $ 1,548,390 $ 17,500 $ 1,565,890 $ 151,500 $ 1,414,390 $ 17,342
As of June 30, 2015 Purchased protection Written protection Years to maturity – notional Total Offsetting Net NetCredit rating Purchased Purchased written purchased written writtenon underlying notional1 fair value < 5 years 5-10 years notional notional2 notional fair valueA- to AAA $1,201,179 $ (27,837) $ 105,000 $ 105,000 $ 5,000 $ 100,000 $ 770BBB- to BBB+ 451,340 (3,669) 834,764 834,764 5,000 829,764 (3,632)Non-investment grade 125,599 5,195 821,568 821,568 147,568 674,000 1,167TOTAL $ 1,778,118 $ (26,311) $ 1,761,332 $ 1,761,332 $ 157,568 $ 1,603,764 $ (1,695)
1 Amounts shown are net of purchased credit protection that directly offsets written credit protection, as discussed in the note (2) below. 2 Offsetting purchased credit derivatives represent the notional amount of purchased credit derivatives to the extent they hedge written credit derivatives with
identical underlying debt securities.

32
ha
rva
rd
un
iver
sity
no
tes
to f
inan
cia
l st
atem
ents
The major components of receivables, net of reserves for doubtful accounts of $11.3 million and $12.8 million as of June 30, 2016 and 2015, respectively, were as follows (in thousands of dollars):
6. receivables
2016 2015Federal sponsored support $ 63,773 $ 62,831Publications 51,072 47,865Executive education 40,468 28,163Tuition and fees 19,504 21,119Non-federal sponsored support 15,842 14,323Gift receipts 8,333 19,458Other 49,212 46,203TOTAL RECEIVABLES, NET $ 248,204 $ 239,962
Forward currency contractsThe University enters into forward currency contracts in connection with settling planned purchases or sales of securities, or to hedge the currency exposure associated with some or all of the University’s portfolio securities. A forward currency contract is an agreement between two parties to buy and sell a currency at a set price on a future date. The value of a forward currency contract fluctuates with changes in forward currency exchange rates. Forward currency contracts are marked-to-market daily and the change in fair value is recorded by the University as an unrealized gain or loss. During fiscal years 2016 and 2015, the University transacted approximately 17,700 and 12,400 forward currency contracts with average USD equivalent notional amounts of approximately $4.6 million and $2.8 million, respectively.
Futures contractsThe University uses futures contracts to manage its exposure to financial markets, including hedging such exposures. Buying futures tends to increase the University’s exposure to the underlying instrument, while selling futures tends to decrease exposure to the underlying instrument. Upon entering into a futures contract, the University is required to deposit an amount of cash or securities with its prime broker in accordance with the initial margin requirements of the broker or exchange. Futures contracts are marked-to-market daily based on settlement prices established by the board of trade or exchange on which they are traded, and an appropriate payable or receivable for the change in fair value is recorded by the University. Gains and losses are realized when the contracts expire or are closed. During fiscal years 2016 and 2015, the University transacted approximately 15,900 and 23,500 futures trades with an average transaction size of approximately 160 and 170 contracts, respectively.
Counterparty credit exposureFinancial instruments with off-balance sheet risk involve counterparty credit exposure. The policy of the University is to require collateral to the maximum extent possible under normal trading practices. Collateral, generally in the form of debt obligations issued by the US Treasury, is exchanged on a daily basis as required by fluctuations in the market. In the event of counterparty default, the University has the right to use the collateral held to offset any losses ensuing from the default event. Specific credit limits are established for counterparties based on their individual credit ratings. Credit limits are monitored daily by the University and are adjusted according to policy, as necessary. Some of the financial instruments entered into by the University contain credit-risk-related contingency features that allow the parties to the agreement to demand immediate payment for outstanding contracts and/or collateral. If material credit-risk-related contingency features were triggered on June 30, 2016 no additional collateral would have been due to counterparties whereas at June 30, 2015, $2.6 million in additional collateral would have been due to counterparties for derivative contracts.

33
ha
rva
rd
un
iver
sity
n
ote
s to
fin
anc
ial
stat
emen
ts
Notes receivable are recorded initially at face value plus accrued interest, which approximates fair value. Notes receivable, and related allowance for doubtful accounts, were as follows (in thousands of dollars):
Unconditional promises to donate to the University in the future are initially recorded at fair value (pledge net of discount) and subsequently amortized over the expected payment period, net of an allowance for uncollectible pledges. The University’s indicative 1- to 5-year taxable unsecured borrowing rate is used to discount pledges receivable upon receipt. Discounts of $77.2 million and $95.0 million for the years ended June 30, 2016 and 2015, respectively, were calculated using rates ranging from 1.1% to 1.8%.
Pledges receivable included in the financial statements as of June 30, 2016 and 2015 are expected to be realized as follows (in thousands of dollars):
8. pledges receivable
2016 2015 Receivable Allowance Net Receivable Allowance NetStudent Loans: Government revolving $ 77,846 $ 2,033 $ 75,813 $ 78,743 $ 2,165 $ 76,578 Institutional 88,115 2,207 85,908 88,105 2,384 85,721 Federally insured 389 389 425 425Total student loans $ 166,350 $ 4,240 $ 162,110 $ 167,273 $ 4,549 $ 162,724Faculty and staff loans 207,096 179 206,917 202,837 422 202,415Other loans 18,763 6,599 12,164 18,204 5,506 12,698TOTAL $ 392,209 $ 11,018 $ 381,191 $ 388,314 $ 10,477 $ 377,837
Government revolving loans are funded principally with federal advances to the University under the Perkins Loan Program and certain other programs. These advances totaled $70.3 million and $69.4 million as of June 30, 2016 and 2015, respectively, and are classified as liabilities in the Balance Sheets. Interest earned on the revolving and institutional loan programs is reinvested to support additional loans. The repayment and interest rate terms of the institutional loans vary considerably.
Faculty and staff notes receivable primarily consists of mortgage and educational loans. Mortgages include shared appreciation loans and loans that bear interest at the applicable federal rate. In addition, certain mortgages bear interest at the current market rate, which may be subsidized for an initial period. The educational loans are primarily zero-interest loans.
The University assesses the adequacy of the allowance for doubtful accounts by evaluating the loan portfolio, including such factors as the differing economic risks associated with each loan category, the financial condition of specific borrowers, the economic environment in which the borrowers operate, the level of delinquent loans, the value of any collateral, and, where applicable, the existence of any guarantees or indemnifications. In addition to these factors, the University reviews the aging of the loans receivable and the default rate in comparison to prior years. The allowance is adjusted based on these reviews. The University considers the allowance at June 30, 2016 and 2015 to be reasonable and adequate to absorb potential credit losses inherent in the loan portfolio.
7. notes receivable
2016 2015Within one year $ 313,278 $ 327,074Between one and five years 1,253,113 1,308,295More than five years 732,062 780,981Less: discount and allowance for uncollectible pledges (164,233) (171,151)TOTAL PLEDGES RECEIVABLE, NET $ 2,134,220 $ 2,245,199

34
ha
rva
rd
un
iver
sity
no
tes
to f
inan
cia
l st
atem
ents
Fixed assets are reported at cost or, if a gift, at fair value as of the date of the gift, net of accumulated depreciation. Depreciation is computed using the straight-line method over the estimated useful lives of the assets.
The major categories of fixed assets as of June 30, 2016 and 2015 are summarized as follows (in thousands of dollars):
Estimated useful life 2016 2015 (in years)Research facilities $ 2,235,809 $ 2,181,191 *
Classroom and office facilities 1,776,972 1,734,276 35Housing facilities 1,729,232 1,556,081 35Other facilities 406,626 386,686 35Service facilities 686,274 629,851 35Libraries 479,899 465,673 35Museums and assembly facilities 740,647 667,451 35Athletic facilities 198,559 192,347 35Land 783,864 671,582 n/aConstruction in progress 680,602 682,452 n/aEquipment 1,224,016 1,160,853 **
SUBTOTAL AT COST 10,942,500 10,328,443Less: accumulated depreciation (4,412,960) (4,144,091)
FIXED ASSETS, NET $ 6,529,540 $ 6,184,352
9. fixed assets
Pledges receivable as of June 30, 2016 and 2015 have been designated for the following purposes (in thousands of dollars):
Because of uncertainties with regard to realizability and valuation, bequest intentions and other conditional promises are only recognized as assets if and when the specified conditions are met. Non-bequest conditional pledges totaled $65.8 million and $76.9 million as of June 30, 2016 and 2015, respectively.
2016 2015General Operating Account balances: Gifts for current use $ 638,719 $ 689,841 Non-federal sponsored awards 131,368 108,272 Facilities and loan funds 240,283 280,358Total General Operating Account balances 1,010,370 1,078,471
Endowment 1,123,850 1,166,728TOTAL PLEDGES RECEIVABLE, NET $ 2,134,220 $ 2,245,199
* Estimated useful lives of components range from 10 to 45 years. ** Estimated useful lives of equipment range from 3 to 8 years.
Certain University facilities are subject to restrictions as to use, structural modifications, and ownership transfer. Included in the fixed asset balances are restricted facilities with a net book value of $255.6 million and $226.4 million as of June 30, 2016 and 2015, respectively.
The costs of research facilities are separated into the shell, roof, finishes, fixed equipment, and services. These components are separately depreciated.
Equipment includes general and scientific equipment, computers, software, furniture, and vehicles.
The University has asset retirement obligations of $101.3 million and $86.6 million, which are included in “Deposits and other liabilities” in the Balance Sheets as of June 30, 2016 and 2015, respectively.

35
ha
rva
rd
un
iver
sity
n
ote
s to
fin
anc
ial
stat
emen
ts
10. endowment and general operating account net assets
The University’s endowment consists of approximately 13,212 separate funds established over many years for a wide variety of purposes. Endowment fund balances, including funds functioning as endowment, are classified and reported as unrestricted, temporarily restricted, or permanently restricted net assets in accordance with donor specifications and state law. Net unrealized losses on permanently restricted endowment funds are classified as a reduction to unrestricted net assets until such time as the fair value equals or exceeds historic dollar value. Unrestricted net assets were reduced by $5.4 million and $1.1 million for such losses in fiscal 2016 and 2015, respectively. Although funds functioning as endowment are not subject to donor restrictions, decisions to spend their principal require the approval of the Corporation. All but a small fraction of the endowment is invested in the GIA (Note 3).
The University is also the beneficiary of certain irrevocable trusts held and administered by others. The estimated fair values of trust assets, which include the present values of expected future cash flows from outside trusts and the fair value of the underlying assets of perpetual trusts, are recognized as assets and increases in net assets when the required trust documentation is provided to the University.
The fair values of these trusts are provided by the external trustees and are adjusted annually by the University. These are included as Level 3 investments in the fair value hierarchy table in Note 4.
The endowment consisted of the following as of June 30, 2016 and 2015 (in thousands of dollars):
The University’s endowment distribution policies are designed to preserve the value of the endowment in real terms (after inflation) and generate a predictable stream of available income. Each fall, the Corporation approves the endowment distribution for the following fiscal year.
The endowment distribution is based on presumptive guidance from a formula that is intended to provide budgetary stability by smoothing the impact of annual investment gains and losses. The formula’s inputs reflect expectations about long-term returns and inflation rates. For fiscal 2016, the endowment distribution approved by the Corporation (prior to decapitalizations) was equal to 4.8% of the fair value of the endowment invested in the GIA as of the beginning of the fiscal year. The total endowment distribution made available for operations was $1.7 billion and $1.6 billion in fiscal 2016 and 2015, respectively.
Each year the Corporation also approves certain decapitalizations from the endowment to support strategic, mission-critical activities or objectives that are typically one-time or time-limited and therefore, are excluded from net operating surplus. These decapitalizations totaled $128.4 and $192.9 million in fiscal 2016 and 2015, respectively. These additional decapitalizations, in combination with the endowment distribution, resulted in an aggregate payout rate of 5.1% in both fiscal 2016 and 2015.
General 0perating accountThe GOA consists of the general or current funds of the University as well as the assets and liabilities related to student and faculty loans and facilities. The GOA accepts, manages, and pays interest on deposits made by University departments; invests surplus working capital; makes loans; and arranges external financing for major capital projects. It is used to manage, control, and execute all University financial transactions, except for those related to investment activities conducted by HMC.
2016 2015 Temporarily Permanently Unrestricted restricted restricted Total TotalEndowment funds $ (5,362) $ 19,016,581 $ 6,494,018 $ 25,505,237 $27,005,421Funds functioning as endowment 5,852,741 2,861,228 8,713,969 9,121,799Pledge balances 588,794 535,056 1,123,850 1,166,728Interests in trusts held by others 16,273 306,414 322,687 321,597TOTAL ENDOWMENT $ 5,847,379 $ 22,482,876 $ 7,335,488 $ 35,665,743 $ 37,615,545

36
ha
rva
rd
un
iver
sity
no
tes
to f
inan
cia
l st
atem
ents 11. split interest agreements
Under split interest agreements, donors enter into trust arrangements with the University in which the University receives benefits that are shared with other beneficiaries and institutions. Split interest agreement (SIA) investment assets are invested primarily in the GIA and publicly traded securities, a small segment is managed by an external advisor, and all are recorded in the “Investment portfolio, at fair value” in the University’s Balance Sheets. Additional disclosures are included in Notes 3 and 4. The publicly traded securities are included as Level 1 and externally managed investments are included in investments
measured using the practical expedient in the fair value hierarchy table in Note 4. Associated liabilities are recorded at the present value of estimated future payments due to beneficiaries and other institutions. These liabilities are calculated using the University’s current taxable unsecured borrowing rate of 1.4% and 1.8% as of June 30, 2016 and 2015, respectively.
The changes in split interest agreement net assets for fiscal 2016 and 2015 were as follows (in thousands of dollars):
Split interest agreement net assets as of June 30, 2016 and 2015 consisted of the following (in thousands of dollars):
1 Shown at net present value. The undiscounted value of these gifts was $34,597 and $39,478 for the years ended June 30, 2016 and 2015, respectively.
2016 2015 Temporarily Permanently restricted restricted Total TotalInvestment return: Investment income $ 2,956 $ 9,305 $ 12,261 $ 16,237 Change in realized and unrealized appreciation, net (13,308) (41,898) (55,206) 17,399Total investment return (10,352) (32,593) (42,945) 33,636
Gifts (Note 16) 1 11,679 7,153 18,832 14,797Payments to annuitants (15,190) (47,822) (63,012) (62,861)Transfers to endowment (3,562) (17,409) (20,971) (24,720)Transfers between SIA and the GOA (10,942) (85) (11,027) (20,891)Change in liabilities and other adjustments 39,191 123,252 162,443 (100,212)NET CHANGE DURING THE YEAR 10,824 32,496 43,320 (160,251)Total split interest agreement net assets, beginning of year 40,816 417,730 458,546 618,797TOTAL SPLIT INTEREST AGREEMENT NET ASSETS, end of year $ 51,640 $ 450,226 $ 501,866 $ 458,546
2016 2015 Temporarily Permanently Unrestricted restricted restricted Total TotalGeneral Operating Account $ 3,738,877 $ 2,406,861 $ 97,983 $ 6,243,721 $ 6,494,452
The GOA consisted of the following as of June 30, 2016 and 2015 (in thousands of dollars):
The temporarily restricted net assets consist primarily of unexpended income, gifts, and pledges. The permanently restricted net assets are loan funds.
2016 2015Split interest agreement investments (Note 3) Charitable remainder trusts $ 847,850 $ 901,990 Charitable lead trusts 116,896 118,751 Charitable gift annuities 213,262 227,770 Pooled income funds 115,060 120,119Total split interest agreement investments 1,293,068 1,368,630
Liabilities due under split interest agreements: Amounts due to beneficiaries (742,808) (780,566) Amounts due to other institutions (48,394) (129,518)Total liabilities due under split interest agreements (791,202) (910,084)
TOTAL SPLIT INTEREST AGREEMENT NET ASSETS, end of year1 $ 501,866 $ 458,546
1 The fiscal year 2016 amount includes an out-of-period adjustment, which is recorded in the “Split Interest Agreements Net Change during the Year” line in the Statement of Changes in Net Assets with General Operating Account Detail.

37
ha
rva
rd
un
iver
sity
n
ote
s to
fin
anc
ial
stat
emen
ts
Bonds and notes payable as of June 30, 2016 and 2015 were as follows (in thousands of dollars):
12. bonds and notes payable
1 The weighted average maturity of the portfolio on June 30, 2016 was 14.6 years. 2 Exclusive of interest rate exchange agreement. Inclusive of this agreement, the overall portfolio rate was 0.07% higher (4.66% vs. 4.59%). 3 Series N, 2008A, 2008D, 2009A and 2010C principal amounts are net of $0.4 million, $0.1 million, $2.0 million, $18.4 million and $1.6 million of discounts,
respectively. Series 2008B, 2010A and 2010B principal amounts include premiums of $5.9 million, $30.9 million and $41.9 million, respectively. Series 2009A, 2010A, 2010B, 2008A, 2008C, 2008D, 2010C and 2013A principal amounts are net of underwriter’s discounts of $3.0 million, $1.5 million, $2.2 million, $0.8 million, $0.3 million, $2.9 million, $2.1 million and $1.4 million, respectively. Series Y, EE, N, 2009A, 2010A, 2010B, 2008C, 2010C and 2013A principal amounts are net of cost of issuance fees of $0.1 million, $0.3 million, $0.1 million, $0.5 million, $0.3 million, $0.8 million, $0.1 million, $0.1 million and $0.3 million, respectively.
4 Series N, 2008A, 2008D, 2009A and 2010C principal amounts are net of $0.5 million, $0.1 million, $2.3 million, $18.2 million and $1.8 million of discounts, respectively. Series 2005A, 2005B, 2005C, 2008B, 2010A and 2010B principal amounts include premiums of $3.4 million, $3.2 million, $3.1 million, $6.2 million, $33.8 million and $45.6 million, respectively. Series 2005A, 2005B, 2005C, 2009A, 2010A, 2010B, 2008A, 2008C, 2008D, 2010C and 2013A principal amounts are net of underwriter’s discounts of $0.2 million, $0.2 million, $0.4 million, $3.3 million, $1.6 million, $2.3 million, $0.8 million, $0.5 million, $3.3 million, $2.2 million and $1.5 million, respectively. Series Y, EE, N, 2005A, 2005B, 2005C, 2009A, 2010A, 2010B, 2008C, 2010C and 2013A principal amounts are net of cost of issuance fees of $0.1 million, $0.3 million, $0.1 million, $0.1 million, $0.1 million, $0.2 million, $0.6 million, $0.3 million, $0.8 million, $0.1 million, $0.1 million and $0.4 million, respectively.
Fiscal year Years to One-year Outstanding principal of issue final maturity1 yield2 20163 20154
Tax-exempt bonds and notes payable:
Variable-rate demand bonds and CP: Series R – daily 2000-2006 16 0.1% $ 131,200 $ 131,200 Series Y – weekly 2000 19 0.2% 117,792 117,786 Commercial paper 2016 <1 0.2% 284,475 289,021Total variable-rate bonds and notes payable 0.2% 533,467 538,007
Fixed-rate bonds: Series N 1992 4 6.3% 79,549 79,432 Series 2005A 2005 20 4.8% 92,216 Series 2005B 2006 16 4.8% 103,398 Series 2005C 2006 19 4.9% 128,449 Series 2008B 2008 22 4.9% 214,772 215,036 Series 2009A 2009 20 5.5% 917,975 947,894 Series 2010A 2010 18 4.6% 481,512 493,055 Series 2010B 2011 24 4.7% 639,956 643,509Total fixed-rate bonds 5.1% 2,333,764 2,702,989
Total tax-exempt bonds and notes payable 4.2% 2,867,231 3,240,996
Taxable bonds and notes payable:
Variable-rate bonds and notes payable: Commercial paper 2012 <1 0.3% 164,622 158,915Total variable-rate bonds and notes payable 0.3% 164,622 158,915
Fixed-rate bonds: Series 2008A 2008 22 5.6% 242,058 242,015 Series 2008C 2008 2 5.3% 124,780 124,597 Series 2008D 2009 23 6.3% 995,078 994,393 Series 2010C 2011 24 4.9% 296,134 295,975 Series 2013A 2013 21 3.4% 400,302 400,199Total fixed-rate bonds 5.4% 2,058,352 2,057,179
Total taxable bonds and notes payable 5.0% 2,222,974 2,216,094
Other notes payable Various Various Various 86,497 86,308TOTAL BONDS AND NOTES PAYABLE 4.6% $ 5,176,702 $ 5,543,398

38
ha
rva
rd
un
iver
sity
no
tes
to f
inan
cia
l st
atem
ents
Interest expense related to bonds and notes payable was $233.8 million and $249.2 million for fiscal 2016 and 2015, respectively. The interest expense in the Statement of Changes in Net Assets with General Operating Account Detail includes additional components related to capital leases. Excluding maturity of commercial paper, unamortized discounts and premiums, underwriter’s discounts and cost of issuance fees, scheduled principal payments are (in thousands of dollars):
In July 2015, the University redeemed the full outstanding par amount of $315.6 million of the Series 2005 bonds using cash on hand.
In August 2015, the University obtained reauthorization of its tax-exempt commercial paper program.
In fiscal 2016, the University entered into a $1.0 billion unsecured, revolving credit facility with a syndicate of banks, which expires in January 2017. In fiscal 2015, the University entered into a $1.0 billion unsecured, revolving credit facility with the same syndicate of banks, which remains in place and expires in January 2020. There was no outstanding balance on either of these credit facilities at June 30, 2016.
The University is rated Aaa by Moody’s Investors Service and AAA by Standard & Poor’s Global Ratings. The Standard & Poor’s rating was re-affirmed in July 2016 and the Moody’s Investors Service rating was re-affirmed in September 2016.
As of June 30, 2016, the University had $249.0 million of variable-rate demand bonds outstanding (excluding commercial paper) with either a daily or weekly interest rate reset, as noted in the bonds and notes payable table on page 37. In the event that the University receives notice of any optional tender on its variable-rate demand bonds, or if the bonds become subject to mandatory tender, the purchase price of the bonds will be paid from the remarketing of such bonds. However, if the remarketing proceeds are insufficient, the University will have a general obligation to purchase the bonds tendered with cash on hand.
Interest rate exchange agreementsIn fiscal 2016, the University had in place one interest rate exchange agreement, used to manage the interest cost and risk associated with a portion of its outstanding debt.
The fair value of the interest rate exchange agreement was $(36.2) million and $(17.0) million as of June 30, 2016 and 2015, respectively and is recorded in “Securities lending and other liabilities associated with the investment portfolio” on the University’s Balance Sheets.
13. employee benefits
The University offers current employees a choice of health plans, a dental plan, short-term and long-term disability plans, life insurance, tuition assistance, and a variety of other benefits such as subsidized passes for public transportation and for Harvard athletic facilities. In addition, the University has retirement plans covering substantially all employees.
The University uses a measurement date of June 30 for its pension and postretirement health plans.
Pension benefitsAll eligible faculty members and staff are covered by retirement programs that include a defined benefit component, a defined contribution component, or a combination of the two.
In accordance with the Employee Retirement Income Security Act (ERISA) requirements, the University has
established a trust to hold plan assets for its defined benefit pension plans. The fair value of the trust’s assets was $803.7 million and $814.4 million as of June 30, 2016 and 2015, respectively. During fiscal years 2016 and 2015, the University made cash contributions to the defined benefit pension plan of $11.4 million and $11.0 million, respectively. The University recorded expenses for its defined contribution plans of $131.2 million and $124.1 million for fiscal 2016 and 2015, respectively.
Postretirement health benefitsThe University provides postretirement health coverage and life insurance to substantially all of its employees. As of June 30, 2016, the University had internally designated and invested $571.6 million to fund the postretirement health benefit accrued liability of $941.8 million. As of June 30, 2015, the University had internally designated and invested $550.9 million to fund the postretirement health benefit accrued liability of $809.5 million.
Fiscal year Principal payments2017 $ 29,7242018 29,7162019 654,8572020 122,0592021 92,080Thereafter 3,759,721TOTAL PRINCIPAL PAYMENTS $ 4,688,157

39
ha
rva
rd
un
iver
sity
n
ote
s to
fin
anc
ial
stat
emen
ts
The accumulated pension benefit obligation (ABO) is a measurement of the University’s pension benefit obligation, based on past and present compensation levels and does not include assumed salary increases. The ABO was $928.3 million and $801.9 million at June 30, 2016 and 2015, respectively. The funded status disclosed above has been prepared in accordance with pension accounting rules. When measured on an IRS funding basis, which informs the University’s required cash contribution amount, the plan was overfunded at January 1, 2016.
Net periodic benefit costComponents of net periodic benefit cost recognized in operating activity and other amounts recognized in non-operating activity in unrestricted net assets in the Statements of Changes in Net Assets with General Operating Account Detail are summarized as follows for the years ended June 30, 2016 and 2015 (in thousands of dollars):
1 The postretirement plan change of $(26.4) million reflects plan changes for union employees, effective January 1,2016, that increased cost-sharing and the length of service needed for the maximum subsidy.
2 Measurement of the University’s pension benefit obligation including assumed salary increases (required by GAAP).
Pension benefits Postretirement health benefits 2016 2015 2016 2015Change in projected benefit obligation: Projected benefit obligation, beginning of year $ 961,868 $ 943,176 $ 809,499 $ 731,957 Service cost 10,254 10,577 35,292 35,494 Interest cost 44,069 41,842 39,644 34,840 Plan participants’ contributions 3,477 3,165 Plan change1 (26,369) Gross benefits paid (45,388) (45,305) (25,542) (20,708) Actuarial loss 134,887 11,578 105,814 24,751PROJECTED BENEFIT OBLIGATION, end of year2 1,105,690 961,868 941,815 809,499
Change in plan assets: Fair value of plan assets, beginning of year 814,365 837,772 Actual return on plan assets 23,282 10,898 Employer contributions 11,400 11,000 Gross benefits paid (45,388) (45,305) FAIR VALUE OF PLAN ASSETS, end of year 803,659 814,365 0 0
UNFUNDED STATUS $ (302,031) $ (147,503) $ (941,815) $ (809,499)
The following table sets forth the pension and postretirement plans’ funded status that is reported in the Balance Sheets as of June 30, 2016 and 2015 (in thousands of dollars):
1 These amounts totaling $245.7 million in fiscal 2016 and $84.1 million in fiscal 2015 include gains and losses and other changes in the actuarially determined benefit obligations arising in the current period but that have not yet been reflected within net periodic benefit cost/(income) and are included in the “Change in Retirement Obligations” line in the Statements of Changes in Net Assets with General Operating Account Detail.
Pension benefits Postretirement health benefits 2016 2015 2016 2015Components of net periodic benefit cost: Service cost $ 10,254 $ 10,577 $ 35,292 $ 35,494 Interest cost 44,069 41,842 39,644 34,840 Expected return on plan assets (49,529) (50,168) Amortization of: Actuarial loss/(gain) 3,656 2,964 (4,604) (7,351) Prior service (credit)/cost 288 364 (4,483) (4,483)Total net periodic benefit cost recognized in operating activity 8,738 5,579 65,849 58,500
Other amounts recognized in non-operating activity in unrestricted net assets: Current year net actuarial loss 161,134 50,848 105,814 24,751 Current year net prior service cost (26,369) Amortization of: Prior service (cost)/credit (288) (364) 4,483 4,483 Actuarial (loss)/gain (3,656) (2,964) 4,604 7,351Total other amounts recognized in non-operating activity1 157,190 47,520 88,532 36,585Total recognized in Statements of Changes in Net Assets with General Operating Account Detail $ 165,928 $ 53,099 $ 154,381 $ 95,085

40
ha
rva
rd
un
iver
sity
no
tes
to f
inan
cia
l st
atem
ents
As an indicator of sensitivity, a one percentage point change in assumed health care cost trend rate would affect 2016 as shown in the following table (in thousands of dollars):
The estimated net actuarial loss and prior service cost for the defined benefit plan that will be amortized from unrestricted net assets into net periodic benefit (income)/ cost in fiscal 2017 are $15.7 million and $0.3 million, respectively. The estimated net actuarial gain and estimated prior service credit for the postretirement health benefit that will be amortized from unrestricted net assets into net periodic benefit (income)/cost in fiscal 2017 are ($0.0) million and ($6.7) million, respectively.
In fiscal year 2015, the University updated its mortality assumption to determine the June 30, 2015 year end obligation for the pension and postretirement health plans. Other assumptions and health care cost trend rates used in determining the year end obligation as well as the net periodic benefit (income)/cost of the pension and postretirement health plans are summarized as follows for fiscal 2016 and 2015:
1% point 1% point increase decreaseEffect on 2016 postretirement health benefits service and interest cost $ 18,643 $ (14,032)Effect on postretirement health benefits obligation as of June 30, 2016 297,865 (162,050)
The expected return on pension plan assets is determined by utilizing HMC’s capital markets model, which takes into account the expected real return, before inflation, for each of the pension portfolio’s asset classes, as well as the correlation of any one asset class to every other asset class. This model calculates the real returns and correlations and derives an expected real return for the entire portfolio,
given the percentage weighting allocated to each asset class. After calculating the expected real return, an assessment is made to accommodate the expected inflation rate for the forthcoming period. The final expected return on assets is the aggregate of the expected real return plus the expected inflation rate.
Cumulative amounts recognized as non-operating changes in unrestricted net assets are summarized as follows for the years ended June 30, 2016 and 2015 (in thousands of dollars):
Pension benefits Postretirement health benefits 2016 2015 2016 2015Net actuarial loss/(gain) $ 228,266 $ 70,788 $ (35,665) $ (146,083)Prior service cost/(credit) 2,043 2,331 (62,111) (40,225)Cumulative amounts recognized in unrestricted net assets $ 230,309 $ 73,119 $ (97,776) $ (186,308)
Postretirement Pension benefits health benefits 2016 2015 2016 2015Weighted-average assumptions used to determine benefit obligation as of June 30: Discount rate 3.85% 4.65% 3.90% 4.75% Compensation increase trend: Initial rate 3.00% 3.00% 3.00% 3.00% Ultimate rate 4.00% 4.00% 4.00% 4.00% Years to ultimate rate 5 1 5 1
Health care cost trend rate: Initial rate n/a n/a 6.00% 6.50% Ultimate rate n/a n/a 4.75% 4.75% Years to ultimate rate n/a n/a 7 8
Weighted-average assumptions used to determine net periodic benefit (income)/cost: Discount rate 4.65% 4.50% 4.75% 4.60% Expected long-term rate of return on plan assets 6.75% 7.00% n/a n/a Compensation increase trend: Initial rate 3.00% 3.00% 3.00% 3.00% Ultimate rate 4.00% 4.00% 4.00% 4.00% Years to ultimate rate 0 1 0 1
Health care cost trend rate: Initial rate n/a n/a 6.50% 7.00% Ultimate rate n/a n/a 4.75% 4.75% Years to ultimate rate n/a n/a 8 9
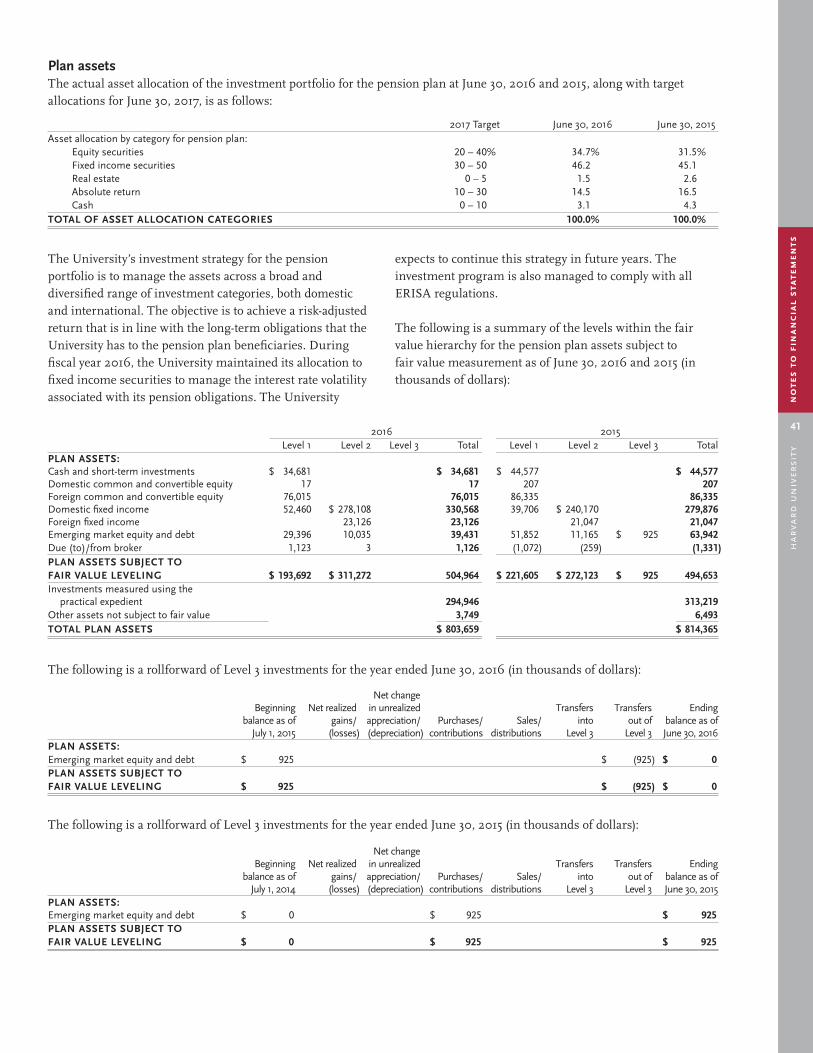
41
ha
rva
rd
un
iver
sity
n
ote
s to
fin
anc
ial
stat
emen
ts
2017 Target June 30, 2016 June 30, 2015Asset allocation by category for pension plan: Equity securities 20–40% 34.7% 31.5% Fixed income securities 30–50 46.2 45.1 Real estate 0–5 1.5 2.6 Absolute return 10–30 14.5 16.5 Cash 0–10 3.1 4.3TOTAL OF ASSET ALLOCATION CATEGORIES 100.0% 100.0%
Plan assetsThe actual asset allocation of the investment portfolio for the pension plan at June 30, 2016 and 2015, along with target allocations for June 30, 2017, is as follows:
The University’s investment strategy for the pension portfolio is to manage the assets across a broad and diversified range of investment categories, both domestic and international. The objective is to achieve a risk-adjusted return that is in line with the long-term obligations that the University has to the pension plan beneficiaries. During fiscal year 2016, the University maintained its allocation to fixed income securities to manage the interest rate volatility associated with its pension obligations. The University
expects to continue this strategy in future years. The investment program is also managed to comply with all ERISA regulations.
The following is a summary of the levels within the fair value hierarchy for the pension plan assets subject to fair value measurement as of June 30, 2016 and 2015 (in thousands of dollars):
2016 2015 Level 1 Level 2 Level 3 Total Level 1 Level 2 Level 3 TotalPLAN ASSETS: Cash and short-term investments $ 34,681 $ 34,681 $ 44,577 $ 44,577Domestic common and convertible equity 17 17 207 207Foreign common and convertible equity 76,015 76,015 86,335 86,335Domestic fixed income 52,460 $278,108 330,568 39,706 $240,170 279,876Foreign fixed income 23,126 23,126 21,047 21,047Emerging market equity and debt 29,396 10,035 39,431 51,852 11,165 $ 925 63,942Due (to)/from broker 1,123 3 1,126 (1,072) (259) (1,331)PLAN ASSETS SUBJECT TO FAIR VALUE LEVELING $ 193,692 $ 311,272 504,964 $ 221,605 $ 272,123 $ 925 494,653Investments measured using the practical expedient 294,946 313,219Other assets not subject to fair value 3,749 6,493TOTAL PLAN ASSETS $ 803,659 $ 814,365
The following is a rollforward of Level 3 investments for the year ended June 30, 2016 (in thousands of dollars):
Net change Beginning Net realized in unrealized Transfers Transfers Ending balance as of gains/ appreciation/ Purchases/ Sales/ into out of balance as of July 1, 2015 (losses) (depreciation) contributions distributions Level 3 Level 3 June 30, 2016PLAN ASSETS:Emerging market equity and debt $ 925 $ (925) $ 0PLAN ASSETS SUBJECT TO FAIR VALUE LEVELING $ 925 $ (925) $ 0
Net change Beginning Net realized in unrealized Transfers Transfers Ending balance as of gains/ appreciation/ Purchases/ Sales/ into out of balance as of July 1, 2014 (losses) (depreciation) contributions distributions Level 3 Level 3 June 30, 2015PLAN ASSETS: Emerging market equity and debt $ 0 $ 925 $ 925PLAN ASSETS SUBJECT TO FAIR VALUE LEVELING $ 0 $ 925 $ 925
The following is a rollforward of Level 3 investments for the year ended June 30, 2015 (in thousands of dollars):

42
ha
rva
rd
un
iver
sity
no
tes
to f
inan
cia
l st
atem
ents
Expected future benefit paymentsEmployer contributions of $14.3 million are expected for fiscal 2017 to fund the pension benefit plan.
The following table summarizes expected benefit payments and subsidies for pension and other postretirement benefits for the University (in thousands of dollars):
Expected benefit paymentsFiscal year Pension Postretirement health2017 $ 51,664 $ 22,0092018 51,919 24,2492019 54,596 26,3822020 57,214 28,6182021 59,764 30,896Thereafter 329,218 193,924
Financial aid granted to students in fiscal 2016 and 2015 is summarized as follows (in thousands of dollars):
14. student financial aid
2016 2015Scholarships and other student awards: Scholarships applied to student income $ 397,524 $ 384,208 Scholarships and other student awards paid directly to students 142,070 135,693Total scholarships and other student awards 539,594 519,901
Student employment 73,723 70,322Student loans 25,975 26,527Agency financial aid* 19,164 18,550TOTAL STUDENT FINANCIAL AID $ 658,456 $ 635,300
* Represents aid from sponsors for which the University acts as an agent for the recipient.
Total expenditures funded by US government sponsors or by institutions that subcontract federally sponsored projects to the University were $597.2 million and $578.0 million in fiscal 2016 and 2015, respectively. The University’s principal source of federal sponsored funds is the Department of Health and Human Services. The University also has many non-federal sources of sponsored awards and grants, including corporations, foundations, state and local governments, foreign governments, and research institutes.
Sponsored grants and contracts normally provide for the recovery of direct and indirect costs. The University recognizes revenue associated with direct costs as the related costs are incurred. Recovery of related indirect costs is generally recorded at fixed or predetermined rates negotiated with the federal government and other sponsors. Predetermined federal indirect cost rates have been established for the University Area, T.H. Chan School of Public Health and the Medical School (including the School of Dental Medicine) through fiscal year 2019. Funds received for federally sponsored activity are subject to audit.
15. sponsored support
16. gifts
Gifts are classified as unrestricted, temporarily restricted, or permanently restricted net assets in accordance with donor specifications.
Additionally gifts are categorized by purpose as “Current use”, “Non-federal sponsored grants”, “Endowment funds”, “Split interest agreements”, or “Facilities and loan funds”.

43
ha
rva
rd
un
iver
sity
n
ote
s to
fin
anc
ial
stat
emen
ts
The major components of other income for the years ended June 30, 2016 and 2015 were as follows (in thousands of dollars):
17. other income
2016 2015Publication and royalties from copyrights $ 215,176 $ 208,374Rental and parking1 143,412 143,930Services income 101,660 105,599Health and clinic fees 50,292 45,722Sales income 34,940 38,806Interest income 10,031 9,724Other student income 5,625 5,865Other 94,564 60,980TOTAL OTHER INCOME $ 655,700 $ 619,000
1 The University is the lessor of space and facilities under operating leases, the income from which is included in rental and parking.
The major components of other expenses for the years ended June 30, 2016 and 2015 were as follows (in thousands of dollars):
18. other expenses
2016 2015Subcontract expenses under sponsored projects $ 156,286 $ 142,852Travel 94,158 90,644Publishing 47,103 45,913Taxes and Fees 31,263 30,583Advertising 28,099 26,485Postage 18,987 19,884Telephone 13,742 13,618Insurance 12,466 16,471Other 61,494 69,344TOTAL OTHER EXPENSES $ 463,598 $ 455,794
* Gift receipts include non-cash gifts of $5.9 million for the year ended June 30, 2016. ** Shown at net present value. The undiscounted value of these gifts was $34,597 for the year ended June 30, 2016.
2016 Donor redesignations/ Gifts received other changes TotalCurrent use $ 424,685 $ (3,516) $ 421,169Non-federal sponsored grants 137,900 (2,116) 135,784Endowment funds* 488,599 3,384 491,983Split interest agreements** 18,832 18,832Facilities and loan funds 117,418 (194) 117,224TOTAL GIFTS $ 1,187,434 $ (2,442) $ 1,184,992
Gifts received for the year ended June 30, 2016 are summarized as follows (in thousands of dollars):
* Gift receipts include non-cash gifts of $0.8 million for the year ended June 30, 2015. ** Shown at net present value. The undiscounted value of these gifts was $39,478 for the year ended June 30, 2015.
2015 Donor redesignations/ Gifts received other changes TotalCurrent use $ 418,875 $ 16,774 $ 435,649Non-federal sponsored grants 123,492 (1,746) 121,746Endowment funds* 360,986 (22,499) 338,487Split interest agreements** 14,797 14,797Facilities and loan funds 128,565 5,568 134,133TOTALGIFTS $ 1,046,715 $ (1,903) $ 1,044,812
Gifts received for the year ended June 30, 2015 are summarized as follows (in thousands of dollars):

44
ha
rva
rd
un
iver
sity
no
tes
to f
inan
cia
l st
atem
ents
Lease commitmentsThe University is the lessee of equipment and space under operating (rental) and capital leases. Rent expense related to leases was $64.7 million and $61.7 million in fiscal 2016 and 2015, respectively.
Future minimum lease payments under these operating and capital leases (in thousands of dollars):
Fixed asset-related commitmentsThe University has various commitments for capital projects involving construction and renovation of certain facilities, real estate acquisitions, and equipment purchases, for which the outstanding commitments as of June 30, 2016 totaled approximately $644.1 million.
Environmental remediationThe University is subject to laws and regulations concerning environmental remediation and has established reserves for potential obligations that management considers to be probable and for which reasonable estimates can be made. These estimates may change substantially depending on new information regarding the nature and extent of contamination, appropriate remediation technologies, and regulatory approvals. Costs of future environmental remediation have been discounted to their net present value. Management is not aware of any existing conditions that it believes are likely to have a material adverse effect on the University’s financial position, changes in net assets, or cash flows.
Utilities purchase commitmentsThe University has entered into Power Purchase Agreements (PPAs) with a series of utilities providers to purchase natural gas and electricity for various quantities and time periods. As of June 30, 2016, future obligations under the PPAs are as follows (in thousands of dollars):
GeneralThe University is a defendant in various legal actions arising from the normal course of its operations. While it is not possible to predict accurately or determine the eventual outcome of such actions, management believes that the outcome of these proceedings will not have a material adverse effect on the University’s financial position, changes in net assets, or cash flows.
The University has evaluated subsequent events through November 1, 2016, the date the financial statements were issued. Subsequent to year end, the University issued Tax-Exempt Series 2016A in the par amount of $1.5 billion and Taxable Series 2016B in the par amount of $1.0 billion for the purpose of refinancing existing debt. This is not accounted for in the accompanying financial statements or disclosed in the accompanying notes.
19. functional classification of operating expenses
20. commitments and contingencies
2017 $ 23,0382018 18,8272019 15,0222020 7,9752021 6,234Thereafter 16,945TOTAL UTILITY FUTURE PURCHASE OBLIGATIONS $ 88,041
Operating expenses are allocated functionally on a direct basis. Interest, depreciation, and operations and maintenance expenses are allocated based on square footage.
Operating expenses by functional classification for the years ended June 30, 2016 and 2015 were as follows (in thousands of dollars):
2016 2015Instruction $ 1,255,694 $1,193,258Research 918,257 875,900Institutional support 779,006 735,606Academic support 579,671 541,309Auxiliary services 577,487 547,275Libraries 251,334 239,255Student services 196,706 194,793Scholarships and other student awards 142,070 135,693TOTAL EXPENSES $ 4,700,225 $ 4,463,089
Operating Capital2017 $ 66,683 $ 9,7992018 58,792 9,7202019 52,616 13,7562020 41,248 8,9292021 32,407 8,147Thereafter 270,184 153,159TOTAL FUTURE MINIMUM PAYMENTS $ 521,930 $ 203,510

PRESIDENT AND FELLOWS
OF HARVARD COLLEGE
drewgilpinfaustPresident
paulj.finneganTreasurer
lawrences.bacow
jamesw.breyer
kennethi.chenault
susanl.graham
nannerlo.keohane
williamf.lee
jessicatuchmanmathews
karengordonmills
josephj.o’donnell
shirleym.tilghman
theodorev.wells,jr.
BOARD OF OVERSEERS
scotta.abellflaviabuarquedealmeidamichaelbrownsusanl.carneyp.lindsaychase-lansdaler.martinchávezfernander.v.dufflychristopherb.fieldrichardw.fisherhelenabuonannofoulkesvernac.gibbsbriangreenenicoleparenthaugheyjamese.k.hildrethketanjibrownjacksonjamese.johnsonbethy.karlandeannaleejanelubchencomichaellyntontracyp.palandjiansanjayh.patelswatia.piramalalejandroramírezmagañalesleyfriedmanrosenthalkathryna.taylorkentwalkerjohnsilvanuswilson,jr.gwille.yorkkenjiyoshino
OFFICERS
drewgilpinfaustPresident
paulj.finneganTreasurer
alanm.garberProvost
katherinen.lappExecutive Vice President
robertw.iulianoSenior Vice President and General Counsel
paulandrewVice President for Public Affairs and Communications
marcgoodheartVice President and Secretary of the University
marilynhausammannVice President for Human Resources
thomasj.hollisterVice President for Finance and Chief Financial Officer
anneh.marguliesVice President and Chief Information Officer
tamaraelliottrogersVice President for Alumni Affairs and Development
leahrosovskyVice President for Strategy and Programs
sarahe.thomasVice President for the Harvard Library
meredithweenickVice President for Campus Services