harvard forest summer student research...
TRANSCRIPT

HARVARD FOREST
SUMMER STUDENT RESEARCH ASSISTANTS
~
c~;'°:~f~ii7.~Jc~~:~~~--
Abstracts from the 5th Annual Haf1Jard Forest Summer Student Symposium
6 August 1997

FIFTH ANNUAL HARV ARD FOREST SUMMER STUDENT SYMPOSIUM
6 August 1997
HARV ARD FOREST, FISHER MUSEUM
Introduction to Harvard Forest 2
Summer Research Programs 2
Symposium Program 4
Abstracts 6
Summer Seminar Schedule 19
IES Forum on Opportunities in Ecology 21
Student Committees 23
Summer Students 24
Personnel at the Harvard Forest 26

INTRODUCTION TO THE HARV ARD FOREST
Since its establishment in 1907 the Harvard Forest has served as a center for research and education in forest biology. Through the years researchers at the Forest have focussed on silviculture and forest management, soils and the development of forest site concepts, the biology of temperate and tropical trees, forest ecology, forest economics and ecosystem dynamics. Today, this legacy of research and education continues as faculty, staff, and students seek to understand historical and modem changes in the forests of New England and beyond resulting from human and natural disturbance processes, and to apply this information to the conservation, management, and appreciation of forest ecosystems. This activity is epitomized by the Harvard Forest Long Term Ecological Research (HF L TER) program, which was established in 1988 through funding by the National Science Foundation (NSF).
Physically, the Harvard Forest is comprised of approximately 3000 acres of land in Petersham, Massachusetts that include mixed hardwood and conifer forests, ponds, extensive spruce and maple swamps, and diverse plantations. Additional land holdings include the 25-acre Pisgah Forest in southwestern New Hampshire (located in the 5000-acre Pisgah State Park), a virgin forest of white pine and hemlock that was 300 years old when it blew down in the 1938 Hurricane; the 100-acre Matthews Plantation in Hamilton, Massachusetts, which is largely comprised of plantations and upland forest; and the 90-acre Tall Timbers forest in Royalston, Massachusetts. In Petersham a complex of buildings that includes Shaler Hall, the Fisher Museum, and the John G. Torrey Laboratories provide office and laboratory space, computer and greenhouse facilities, and a lecture room and lodging for seminars and conferences. An additional nine houses provide accommodation for staff, visiting researchers, and students. Extensive records including long-term data sets, historical information, original field notes, maps and photographic collections are maintained in the Harvard Forest Archives.
Administratively, the Harvard Forest is a department of the Faculty of Arts and Sciences (FAS) of Harvard University, with the Director reporting to the Dean of FAS. The Harvard Forest administers the Graduate Program in Forestry that awards a Masters degree in Forest Science. Faculty at the Forest offer courses through the Department of Organismic and Evolutionary Biology (OEB), which awards the PhD degree, and through the Freshman Seminar Program. Close association is maintained with the Department of Earth and Planetary Sciences (EPS), Kennedy School of Government (KSG) and the Graduate School of Design (GSD) at Harvard and with the Department of Forestry and Wildlife Management at the University of Massachusetts, the Ecosystems Center of the Marine Biological Laboratory, Woods Hole, and the Complex Systems Research Center at the University of New Hampshire.
The staff and visiting faculty of approximately 50 work collaboratively to achieve the research, educational and management objectives of the Harvard Forest. A management group comprised of the Director, Administrator, Coordinator of the Fisher Museum and Forest Manager meets monthly to discuss current activities and to plan future programs. Regular meetings with the HF L TER science team provide for an infusion of outside perspectives. Forest management and physical plant activities are undertaken by our four-member Woods Crew and directed by the Forest Manager. The Coordinator of the Fisher Museum oversees many of our educational and outreach programs.
Funding for the operation of the Harvard Forest is derived from endowments and University support, whereas research activities are conducted with grants primarily from the federal government. Major research support comes from the National Science Foundation, Department of Energy (National Institute for Global Environmental Change), the U.S. Department of Agriculture, and the Andrew W. Mellon Foundation. Our summer Program for Student Research is supported by the National Science Foundation, the A. W. Mellon Foundation, and the R. T. Fisher Fund of Harvard Forest.
Summer Research Program
The Harvard Forest Summer Student Research program attracted a diverse group of students to receive hands-on training in scientific investigations, and to gain experience in working on long-term ecological research. The program, coordinated by Chris Kruegler, Administrator at the Harvard Forest, was supported by NSF Research Experience for Undergraduates, National Institute for Global Environmental Change, Mellon Foundation and the Harvard Forest. Students work closely with faculty and scientists, and many conduct their own independent research studies. The
2

program includes weekly seminars from resident and visiting scientists, discussions on issues pertinent to careers in science (e.g. career decisions, diversity in the scientific community, ethics in science), and field trips on soils, land-use history and vegetation of the forest. An annual field trip is made to the Institute of Ecosystem Studies (Millbrook, NY) to participate in a Forum on Jobs in Ecology, which includes discussion of environmental occupations with students and professionals employed in the field. The summer program culminates in the Annual Summer Student Research Symposium, in which students present major results of their summer work. The Collaborative Research for Undergraduate Institutions (CRUI) program with nine students and three faculty from Mount Union College, Allegheny College and Gustavus Adolphus College joined the Harvard Forest Summer Research program for the second year.
3
9:00A.M.
9:15
9:30
9:45
10:00
10:15
10:30
11:00
11 :15
11:30
11:45
12:00 P.M.
12:15
12:30
1:30
1:45
2:00
FIFTH ANNUAL HARVARD FOREST SUMMER STUDENT SYMPOSIUM
6 August 1997
HARVARD FOREST, FISHER MUSEUM
Introduction
Influence of canopy type on understory environment: vegetation composition and seedling regeneration
Effect of land-use history on clonal shrub distribution in the Montague sand plain
An investigation of the effects of the April I, 1997 ice storm on Pitch Pine and mixed hardwood stands located on the Montague Sand Plain in central Massachusetts
C02 flux influence on herbaceous species composition
Photosynthetic response to light and C02 of four herbaceous species in a temperate forest
COFFEE BREAK
Ground-level C02 concentrations in a temperate forest developing on abandoned 19th C agricultural lands
Nitrogen mineralization and nitrification: variability in sites subjected to previous agricultural activity
Soil respiration in three former agricultural land-use legacies in a Massachusetts temperate forest
Forest productivity in three prior agricultural land-use legacies in a New England temperate forest
Seedling and herbaceous patterns in relationship to soil conditions in in three prior agricultural land-use sites
Soil moisture variability in prior agricultural land-use types at the Harvard Forest
LUNCH
Concentrations of dissolved C02 in stream water and their effect on photosynthesis by aquatic plants
Subterranean obstructions to seedling root growth in central New England soils subjected to three historical agricultural uses
A limnological comparison of the Spectacle Ponds, New Salem, MA
4
David Foster
Chrissy Frederick
Samuel Gale
Nicole Lavelle
Evan Kane
Amanda Lodge
Brett Danner
Richard Bakker
Cindee Giffen
Heather Frankland
Jessica Graham
Christy Meredith
Cristi Braun
Calli Braun
Kevin Clarke

2:15
2:30
2:45
3:00
3:15
3:30
3:45
4:00
4:15
4:30
6:00
Landscape-level distribution and damage patterns of the Hemlock Woolly Adelgid in hemlock forests of central Connecticut
Structure, composition and dynamics of hemlock forests following Hemlock Woolly Adelgid infestation in central Connecticut
BREAK
Structure, composition and recruitment dynamics of old-growth forests on Wachusett Mountain, Massachusetts
Shiver me timbers!
Getting the bubbles out. Stem anatomy and repair of cavitation
Environmental Monitoring
The soil warming experiment control plots - interannual variation of C02 flux
Compartmentalizing soil respiration in a northern hardwood forest
Summer Evaluation Handout
BARBECUE
5
DavdMausel
Jesse Bellemare
Sarah Picard
Will Sloan Anderson
Trina Roberts
Young-Soo Lim
Nina Wurzburger
Jon Sanderman
Chris Kruegler

Topographic Protection of Pinus strobus from Hurricane Winds in North Central Massachusetts
William Sloan Anderson
Past research has shown that catastrophic hurricanes have occurred every 100-150 years in southern and central New England. In 193 8 a catastrophic hurricane impacted Harvard Forest in Petersham Massachusetts. Previous analysis, done at Harvard Forest, of surveyed damage for the area determined that vegetation height, composition and site exposure controlled spatial patterning of wind damage. It was found that Pinus strobus > 13.5 min height were highly susceptible to damage in exposed sites. It is the hypothesis of this study that the rare occurrence of large individuals of Pinus strobus occur on the landscape in areas of topographic protection from the 1938 Hurricane.
Using a 1994 conifer survey of Petersham as a base map, stands of large Pinus strobus were selected to be sampled. Selected individuals >65 cm dbh. were cored for their age and measured for dbh. and height. Site index curves for Pinus strobus in New England were used to determine 1938 heights of those individuals that had been cored. Individuals and stands that were found to be > 13 .5 m tall were located and entered into a GIS system. They were then analyzed through an exposure model (EXPOS) to determine their exposure to hurricane winds.
To date, the western half of Petersham has been surveyed. Twenty-nine large individuals and/or stands oflarge individuals have been found. After being subjected to EXPOS winds from the northeast to the south, it has been shown that all entered plots were protected from east-southeast (112 degrees) hurricane winds (Fig. 1). This agrees with the direction the most devastating winds were believed to have come from in 1938 (116 degrees), based on previous survey work which looked at the orientation of blown down stems.
Nitrogen Mineralization and Nitrification: Influence of Agricultural Land Use History
Richard G. Bakker
At sites used until the 1830s for agriculture, measurements were made of mineralization, net nitrification, and net mineralizations, using a buried bag technique with a one month (June-July) in field incubation. Samples were extracted in 2 m KCI for two days, and then analyzed using a Latchat Auto-analyzer. Results indicate soil continues to demonstrate the impact of historical land use. In mineral soil the highest rates were found of mineralization and nitrification in woodlots, and a close correlation between the amount of organic matter in the mineral soil, net mineralization and net nitrification exists. Interestingly, litter fall across sites was essentially constant and therefore not the determining factor in the organic carbon gradient. A similar but much less pronounced pattern in organic carbon was found in the forest floor that did not correlate with the mineralization data.
These results imply the forest floor has essentially recovered from the disturbance. Because there was no pattern across sites, there seems to be little lingering effect of the disturbance (Fig. 1). Net mineralization and net nitrification showed no pattern in the forest floor even though mineralization rates fluctuated from 17 .6 to 42.5 kg N/ha/month, and nitrification fluxed from -0.029 to 0.385 kg N/ha/month (Fig. 1). When the organic carbon numbers are considered there is very little correlation (Fig. 2). Figure 2 shows the linear regression of organic matter vs net mineralization which has an R2 of 0.1649 and net nitrification 0.3639. Because leaflittler inputs are similar across sites, the forest floor probably cycles nitrogen so quickly that it has recovered.
In mineral soil, a distinct pattern in line with disturbance history forms (Fig. 1 ). When these rates are correlated to the soil organic carbon one observes high R2 values of .8078 and .7424. If mineralization and nitrification correlate to organic carbon, the amount of time it takes organic carbon to filter down to mineral soil has allowed effects of the disturbance to linger. Therefore, the land use legacy appears in our mineral soil data. Our data indicates that there remains an impact on the rates of mineralization and nitrification from previous agricultural land use, and these rates
6

Exposure of plots from east-southeast, hurricane winds.
Grid
Feet
10,000.46
Fig. 1. Pinus strobus plots within areas of varying protection, within the town of Petersham, from eastsoutheast (112 degrees) winds. From highly protected in black (inflection angle of > 10 degrees), to exposed in white.
W. Sloan Anderson

Nitrogen Mineralization vs. Nitrogen Mineralization vs. Organic Matter in the Mineral Soil Organic Matter in the Forest Floor
12 45
• • 40
10 y = 0.2275x - 18.114 35
= -1.1719x + 43.361 ~
R2 =0.8078 R2 =0.1649
= 8 = 30
~ c c e e 25 I'll 6 I'll = = 20 z z • en en .¥ 4 .¥ 15
10 2
5
0 0 0 50 100 150 0 5 10 15 20
Organic Matter in metic tonnes Organic Matter in metic tonnes
Nitrification vs. Organic Matter in Nitrification vs. Organic Matter in the Mineral Soil the Forest Floor
2.5 0.4 •
0.35 2
y = 0.0517x - 4.3991 = 0.0299x - 0.2794
R2 =0.7424 0.3 R2 =0.3639 = c 1.5 = 0.25 e c
I'll e 0.2 = I'll z = 0.15 en .:.: z en .¥ 0.1
0.5 0.05
0 o. 5 1~ 15
0 50 100 150 -0.05
Organic Matter in metic tonnes organic Matter in metlc tonnes
R. Bakker

2.5
2
.r: c ~ 1.5
"' ~ 0.5
~
50
40
cu 30 ,..c:; ....... z ~
20
IO
0
0
R. Bakker
p1min ff
pl ff min
Nitrification in the Mineral Soil and Forest Floor
p2min ff s1min ff s2 min ff w1min ff
~ Mineral Soil ~ Standard Error
Average N Mineralization Data for
Mineral Soil and Forest Floor
p2ffmin sl ff min s2 ff min wl ff min
W2 min ff
w2 ff min
seem to be closely correlated to the amount of organic carbon. This legacy now appears only in the deep layers of the soil column as the upper layers now have largely recovered.
Structure, Composition and Dynamics of Hemlock (Tsuga canadensis) Forests Following Hemlock Woolly Adelgid Infestation in Central Connecticut
Jesse Bellemare
In 1985 the Hemlock Wooly Adelgid (HWA) was blown across Long Island Sound to southern Connecticut by Hurricane Gloria. Since its arrival, the HWA has been having major impacts on the hemlock forests of southern Connecticut.
After preliminary studies of the ecological impacts ofHW A on hemlock forests in southern Connecticut, a 5900 km/\2 transect running from Long Island Sound through central Connecticut to the Massachusetts border was established in the summer of 1997. Areal photographs were used to delineate all hemlock stands greater than 3 ha and these were then classified into groupings of those with more than 50% hemlock in the canopy or less than 50% hemlock. We are currently in the process of sampling the stands comprised of 50% or more hemlock and greater than 12 ha in size. In order to determine what, if any, environmental factors influence HWA spread and impact, we have examined site characteristics such as slope, aspect, basal area, humus depth, average DBH, elevation and structure. Roughly 60 stands have been examined and 36 sampled.
Average slope of the hemlock stands sampled was 25%, with a range from 0-54%. Nearly 50% of the stands were located on NW facing slopes, 25% were on NE slopes and the final 25% was split between SE and SW slopes. This distribution was not surprising in that hemlocks prefer the cooler and moister microclimates associated with north facing slopes. Average basal area in the stands was 48 m/\2/ha, with a spread from 34.8-79.8 m/\2/ha. Humus depth was also measured due to the fact that earlier studies have indicated that humus may prove to be a factor in facilitating or inhibiting regeneration as hemlocks deteriorate. Average humus depth was 4 cm, and ranged from 1-6 cm.
Percent hemlock mortality was also ascertained in each stand by measuring the amount of recently dead hemlock basal area encountered in the basal cruise plots. A third of the stands showed mortality of 10% or higher with some approaching 80%, while another third showed elevated levels of mortality apparently related to HWA infestation. The distribution of hemlock mortality showed a clear N to S gradient of increasing amounts of dead hemlock basal area, probably due to longer periods of HWA infestation in the southern portion of the transect.
Vegetative understory response was also examined in 20x20 m plots. In stands with higher hemlock mortality, species such as Betula lenta, Dennstaedtia punctilobu/a, Rubus spp. and Phyto/acca spp. became established in the understory.
This coming fall our data will be incorporated into a GIS model for analysis of the trends and patterns which we are already beginning to see in our data.
Subterranean Obstructions to Seedling Root Growth in New England Soils Subjected to Three Agricultural Land Uses
Callie E. Braun
Quantifying and mapping subterranean obstructions, such as rocks and large roots, in soils is important because
7

J. Bellemare
80
60
c ~ 40 Ql
Cl.
20
0
Hemlock Mortality & Betula lenta response
win2 sla1 win1 cov3 roc3 roc1 gla3 moo3 mha1 moo5 moo10 mha2 mha5 mha4 dee7 ham1 dee2 ess1 ell1 sta2 sla3 cov1 roc2 gla1 mar1 mha6 moo4 moo6 moo? moo8 moo9 dee5 dee6 dee1 had2 ess2
N site
..,... % Hemlock mortality • % Betula lenta seed/sap cover
Figure 1: Comparison of% Hemlock mortality and% Betula lenta seedling and sapling regenerative response. Sites are arranged north to south.
s

1) they take up area that could consist of essential elements for plants like water, air, and fine soil containing nutrients; and 2) they can determine the space in a stand that is available for seedlings to take root and grow into large trees, therefore influencing the structure of the forest. It is especially important in New England soils because up to 50% of the soils can consist ofrocks. It is well known that rocks were removed from the soils in New England for historical agricultural uses, but are today's forests still seeing those differences between land that was previously plowed and land that wasn't? The purpose of this study is to determine the average depth to obstruction in two formerly plowed, pastured, and woodlot sites, and to determine ifthere is any difference in the pattern of obstruction based on rock sizes between the six sites.
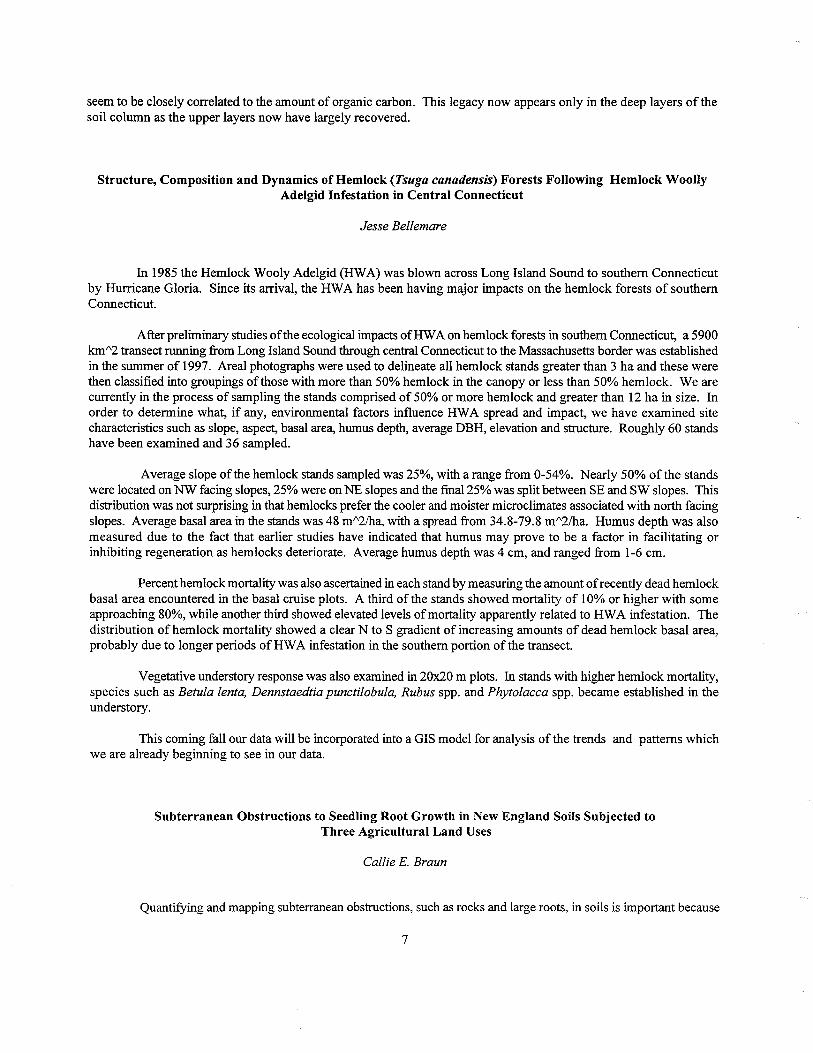
Two separate methods of data collection were used. The first was a coarse-grained study in which nine measurements were taken at each of27 interior points in each site. In the second, eight 1 x 2 m plots were randomly chosen from each site and measurements were taken every 10 cm. The instruments used to collect the data were 3 .5 mm diameter metal dowel probes with 25 cm marked off on the shaft. The average depth and amount of unobstructed area were calculated, and a cluster analysis was performed for each 1 x 2 m plot at a depth of 15 cm. Three dimensional maps of each plot were created using Idrisi.
Average depths ranged from 9.13 cm in Woodlot 2 to 10.87 cm in Plowed 1. Preliminary results show that there is significant difference between the average depths for Plowed 1 and Pastured 2, and those of Plowed 1 and Woodlot 2. However, no significant difference was found in any of the other variables. This suggests that at a depth of 15 cm, the sites are too spatially diverse to give significant results. This was confirmed with the maps that were created. Future study will include a comparison of the same variables at different cut-off depths. These data will also be correlated with spatial data collected on herbs and seedlings in the same sites.
Concentrations of Dissolved C02 in Stream Water and Their Effects on Photosynthesis by Aquatic Plants
Cristi L. Braun
Dissolved C02 was measured in a small stream flowing through a bog at Harvard Forest, Petersham, Massachusetts. Approximately 500 ml of water and 50 ml of air were collected in half-liter bottles at one site above and five sites below the bog. After at least two hours equilibration, C02 was analyzed by injecting 10 ml of air from each bottle into a LiCor 6250 infrared gas analyzer. These measurements were then compared against injection of a gas of known C02 concentration. Bunsen coefficients were used to calculate C02 concentrations in water from measured values for air. C02 was consistently lowest above the bog (average= 2046 µl/l) and highest just below the bog (average= 6312 µl/l). Sites further downstream from the bog showed steadily decreasing C02 concentrations, but C02 concentration was higher at all sites below the bog versus above the bog. The effects on aquatic plants of increased levels of C02 in the stream water were investigated by determining the effect of C02 concentration on photosynthesis of a moss, genus Fontinalis, which was abundant in the stream, by measuring the rate ofC02 decrease in an illuminatedjar with a known amount of Fontinalis. The moss was exposed to 125 µmo1m-2s·1 of photosynthetically active radiation (PAR) which was the average of the highest ten minute mean PAR value for each day during a two week period. It was found that moss growing above the bog has a maximum photosynthesis rate of2.04 µls- 1g·1
; while moss collected below the bog has an optimum photosynthetic rate of 2.82 µ1s· 1g·1
• Both of the samples reached these optimum rates at C02 concentrations above 3000 µl/l.
8
Pasture 1 (18,22) Ortho
Fig. 1. 'Three dimensional map of a plot in Pasture 1 on Prospect Hill showing a tree and large rock.
Callie Braun

A Limnological Comparison of the Spectacle Ponds, New Salem, MA
Kevin R. Clarke
The Spectacle Ponds are glacial kettle-hole lakes located along Route 122 in New Salem, MA. Due to the sharp contrast in wetland area between the two ponds, they provide an excellent opportunity to determine what effects, if any, the wetlands are having on the entire lake. North Spectacle Pond has very little wetland area while South Spectacle Pond is entirely surrounded by a large wetland area. Any inflow of water to South Spectacle Pond must pass through the wetland fringe. Since wetlands are known for their ability to remove nutrients, heavy metals, pollutants, and particulates from inflow, decreased nutrient availability may occur in South Spectacle, resulting in a lower productivity than North Spectacle. A limnological comparison of the two lakes was undertaken to determine whether there were differences in chemistry or biota.
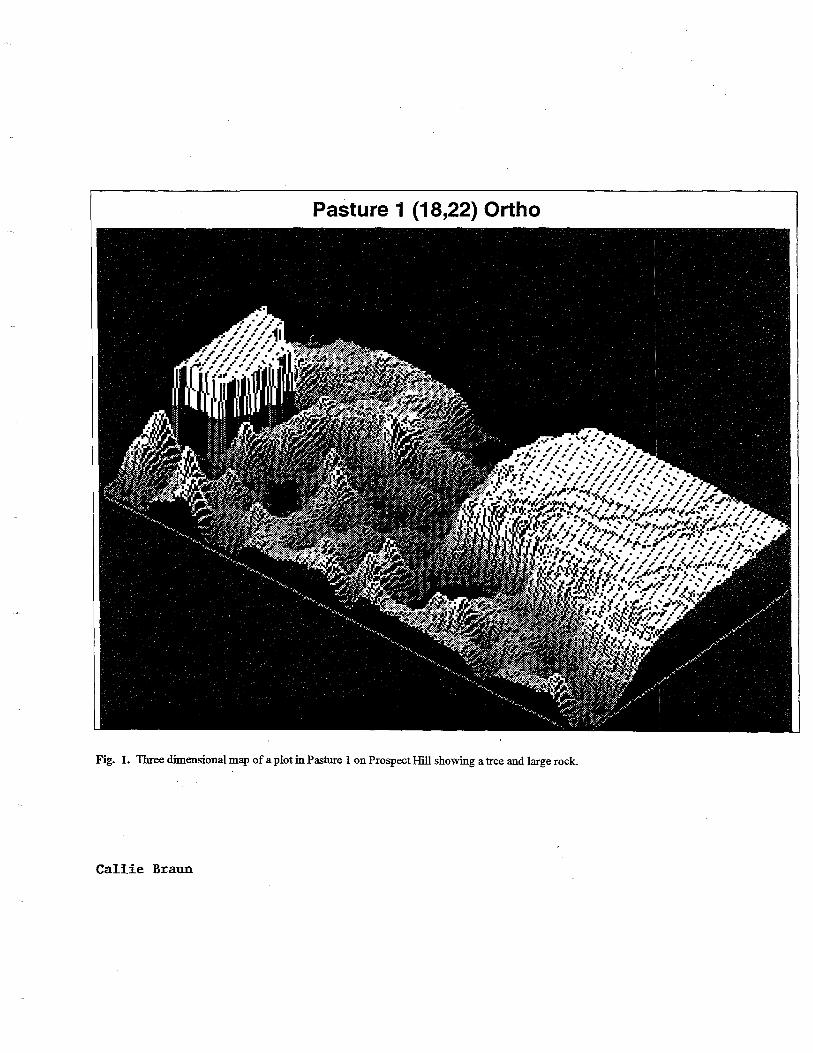
Benthos samples were collected once during the summer using an Ekman grab sampler. Twelve samples were collected from a range of depths and substrate type in each lake. Of the benthos samples analyzed so far, the sensitivity of species composition to depth and sediment type has been observed. Chironomids are a major component of the benthos and are useful indicators of productivity and other environmental factors.
Water samples were collected monthly at three depths. Temperature/dissolved oxygen profiles indicate that both ponds are well stratified with very low oxygen concentrations at the bottom. Analysis of chlorophyll a concentrations indicate highest concentration in both ponds at the middle depth in the month of June, while in July, greatest concentrations occurred at the bottom depth. Examination of plankton samples from this depth indicated a high concentration of cyanobacteria. South Spectacle Pond had a chlorophyll concentration at the bottom (23 micro g/L) in July that was about double that ofNorth Spectacle (12.5 micro g/L). Other analyses performed included pH, alkalinity, conductivity, and total suspended solids. Alkalinity and conductivity were very low in both ponds, pH ranged from 5.65 to 6.47 in June and increased to 5.75 to 6.73 in July. Both ponds had similar pH values. Total suspended solids were low and corresponded to chlorophyll concentrations, indicating that plankton was the major component of the total suspended solids.
With the exception of chlorophyll a concentrations, the majority of the data collected so far indicate that North and South Spectacle Ponds are similar. Chlorophyll a data suggest that South Spectacle Pond is more productive than North Spectacle Pond, which would not be expected ifthe fringing wetland is acting as a filter for nutrient input to South Spectacle Pond. Further analyses of nutrients, plankton, and benthos are required to gain a better understanding of these ponds.
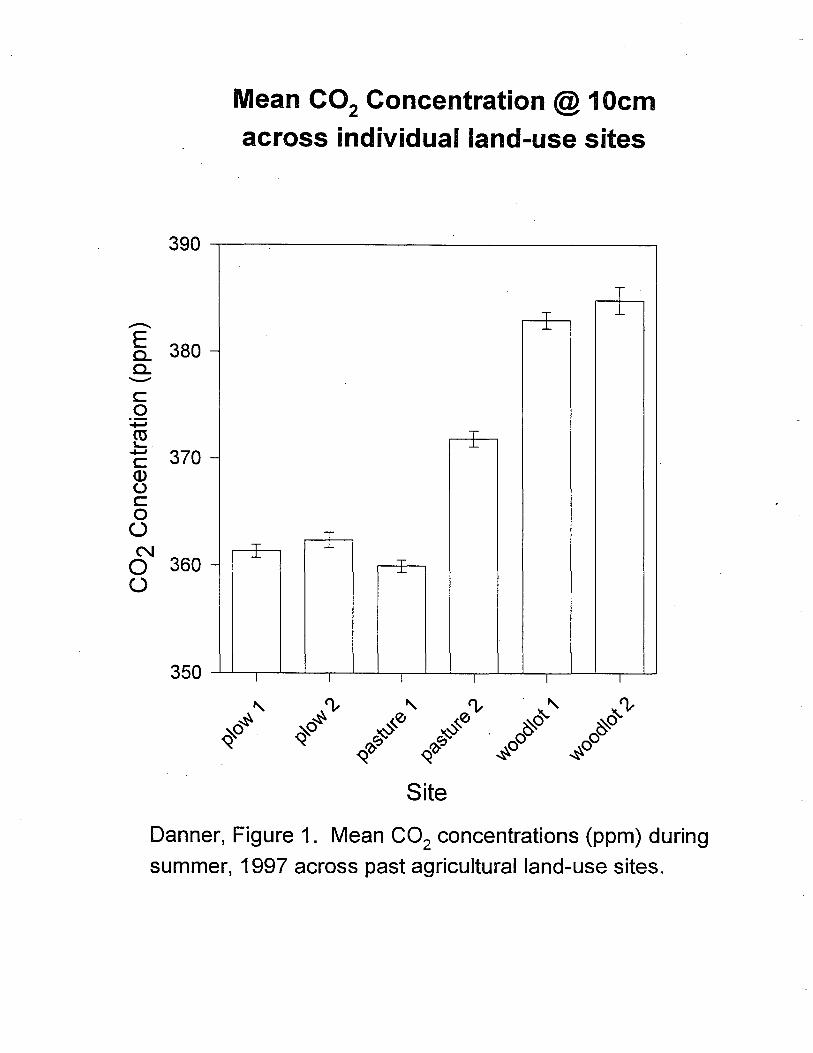
Ground-level C02 Concentrations in a Temperate Forest Developing on Abandoned 19th Century Agricultural Lands
Brett Danner
In terrestrial systems, C02 is generated from two main sources: soil respiration, which includes root respiration and microbiotic activity, and dark respiration from plants. With C02 concentrations slowly rising in the atmosphere, it's effects range from the large-scale processes and events (greenhouse effect, global carbon cycle) to smaller scales where C02 acts as a limiting resource for plants. Past agricultural land-use has altered soil properties and characteristics and may have affected the properties driving ground-level C02 concentrations. The goal of this research is to study the spatial heterogeneity in ground-level C02 concentrations across former agricultural lands and how C02 acts as a limiting resource for herbs and seedlings in the forest understory.
To understand spatial heterogeneity, C02 concentration measurements were taken at 35 points, 5 m apart at each
9
N Spectacle Benthos #2 collected near the shore (2.0 m) and sandy sediment.
N.SPeCtacl8 Polid Sainple-#2
(56.1 %) chironomidae \
Community Percentages
(1.8%) ceratopogonidae
(7.9°/o) amphipoda
(0.9%) tartigrade
(5.3%) ostracod
(11.4%) oligochaeta
(0.9%) cladocera (1.8%) nematoda
(14.0%) misc.
K. Clarke

N. Spectacle Benthos 119 collected from deepest water (3. 7 m) and rich organic sediment . . -·--------~-----·--- - ------ -------'---·------------------------
N orf h-·s-pe-cta cl e-~ F'orid ;-sample_ #_9 Community percentages
(33.7%) Chaoboridae
(31.6%) Chironomidae
(4.7%) Ostracod
(6.3%) Oligochaeta
(10.0%) Nematoda
(13.7%) Misc.
K. Clarke

land-use site (plowed, pastured, woodlot). Measurements were taken in the morning when C02 concentrations are highest. Analysis of C02 was made at 10 cm above the forest floor using an adapted Li-Cor 6200 portable photosynthesis system and Li-Cor 6250 infrared gas analysis system. In addition, vertical profiles of C02 were measured at 5 cm intervals between 0 and 40 cm in the forest understory where light and C02 response curves were generated for specific herb species.
Our results indicate that there are significant (P<0.05) differences in C02 across land-use sites with the woodlot values approximately 25 ppm higher than concentrations in the plowed and pastured sites (Fig. 1 ). Strong spatial heterogeneity within all sites at each measurement date was observed, however plowed sites show the least heterogeneity across both time and space. Results from the vertical profiles indicate that C02 concentrations are highest at ground-level (~ 390 ppm) but reach atmospheric levels between IO to 20 cm off the forest floor.
Further analysis found there to be no correlation between C02 concentration and flux. This suggests that concentrations are related to other environmental and soil conditions (e.g., wind speed, vegetation density, litterfall).
Forest Productivity in Three Prior Agricultural Land-use Legacies in a New England Temperate Forest
Heather Frankland
Prior agricultural land use often plays an important role in the present condition of forests. This research was conducted to find any productivity differences among previously plowed, pastured, and woodlot sites. There are six sites, two from each of the land use types. With this research we wanted to estimate the productivity for each of the six stands and test the hypothesis that rates of annual aboveground biomass and annual litter fall in recovering forests would decline in the order logged >pastured> plowed.
Twenty-five trees, of various diameters and species, were cored at each site. The cores were analyzed and the radial growth was calculated for the most recent 5 and 10 year intervals. Biomass increments were also calculated for the same time span using published equations. Productivity was calculated for diameter classes within species and semi-log relationships of productivity per diameter were used to calculate the productivity of all trees in the stand that were not cored. Site-specific and species-specific equations were used.
Red oaks and red maples were the major contributors of biomass and litter fall in all six of the stands, accounting for about seventy percent of the total aboveground biomass. Although woodlots had higher total biomass there was not a significant difference in productivity across the six sites. The range of productivity was from 7524-9014 Kg/ha (Fig. 1 ). This fell into the range for temperate forests according to results published by the International Biological Program. Production per unit biomass was greater in the plowed stand and least in the woodlots.
Influence of Canopy Type on Understory Environment:Vegetation Composition and Seedling Regeneration
Chrissy Frederick
The influence of canopy type (i. e., hardwood dominated versus hemlock dominated) on the composition and density of understory species was assessed via a demographic study. An attempt was made to determine if differences in understory composition were a result of variations in the understory environment between canopy types. A significantly greater number of understory species were found in the hardwood dominated stands than in the hemlock dominated stands. Understory species density distributions differed between canopy types. In the hardwood sites, some plots
IO
390
--E 380 c.. -c.. _... c 0
-+-' ro s.....
-+-' 370 c -(]) (.) c 0
(_)
N 0 360 -(_)
350
Mean C02 Concentration @ 1 Ocm
across individual land-use sites
T T 1 ..L
T ..L
T
' I ...L ...,..
...L
I I I I I I
Site
Danner, Figure 1. Mean C02 concentrations (ppm) during
summer, 1997 across past agricultural land-use sites.

co I ........
10000
8000
6000
Total Perennial· Aboveground Productivity and Litterfall
C)
4000 ~
2000
0 P1 P2 T1 T2 W1
Site
Frankland, Figure I. Total aboveground productivity across three land use legacies. P=Plowed, T= Pastured, W= Woodlot

hemlock dominated stands. Understory species density distributions differed between canopy types. In the hardwood sites, some plots contained few individuals of a variety of understory species, while other plots contained a large number of only one species, resulting in patchy vegetation composition. The species density distribution in the hemlock sites was found to be more uniform, with the understory consisting of a few individuals of a variety of species (Fig. 1 ).
Herbaceous species composition and density affected the number of tree seedlings present. The hemlock sites had low herbaceous cover and contained many tree seedlings, while the hardwood sites had higher herbaceous cover and contained fewer tree seedlings. Perhaps this finding can be attributed to reduced light levels reaching the tree seedlings because of the dense herbaceous cover, or as a result of competition for nutrients between the herbaceous species and the tree seedlings. Tree seedling age distribution varied between the two canopy types. In the hardwood sites the age of the seedlings was evenly distributed; seedlings were found in all age classes. In contrast, the age distribution of seedlings in the hemlock sites was uneven, with most seedlings being new germinates (Fig. 2). Tree seedlings in the hemlock sites seemed to be capable of germination, but were unable to maintain growth, thus resulting in few tree seedlings in the upper age classes.
The understory environment under each canopy type was characterized in terms of soil pH, humus depth, and gravimetric soil moisture. No significant differences were found between the canopy types for any of these variables. Future investigation of soil water potential, available nitrate, rate of nitrogen mineralization, and light availability may reveal differences between the canopy types and explain variations in understory density.
The Effect of Land-Use History on Clonal Plant Distributions in the Montague Sand Plain
Samuel W Gale
The spatial pattern of clonal plant distribution with respect to past land-use (plowed vs. unplowed) was investigated on the Montague Sand Plain, located in the Connecticut Valley of central Massachusetts. The study species present in the oak-pine forest understory appear to be limited in their recolonization of previously plowed land.
The Montague Sand Plain is an outwash delta composed primarily of sand and gravel deposits. Typical of New England agricultural history, 82% of the approximately 775 hectare area had been cultivated by the early part of this century, at which point the land was subsequently abandoned and allowed to revegetate naturally. Because the area is relatively homogeneous with respect to topography and soil characteristics, such as texture and drainage, it is a model natural system in which to study the effects of past land-use on plant distribution and population demography.
The study site consists of a triangular 3.85 hectare plot including contiguous formerly plowed and unplowed areas. Location and density of eight clonal species, Chimaphila maculata, Chimaphila umbellata, Epigaea repens, Gaultheria procumbens, Gaylussacia baccata, Mitchella repens, Vaccinium angustifolium, and Vaccinium vacillans were mapped throughout the study site. Shrub density was significantly higher in the understory of the unplowed area with a sharp drop in density at the plow boundary. Although all species are producing fruit it appears that there has been no recent seedling establishment. Patch size and distance from unplowed source population may be useful in determining the extent of past sexual reproduction at this site. Also, comparisons of dispersal patterns and population demography among species as well as groups of species representing different plant families will be made to investigate the range of responses to past disturbance found in this plant community.
11

. Hemlock 1 II Medeola virginiana ~ Trientalis borealis (illJ Gaultheria procumbens ~ Lycopodium spp. tj Maianthemum canadense &1 Dennsteadia punctiloba [fl Other
5 1015 20 25 30 35 40 45 50 55 60 65 70 75 80 85 90 951cml+
Density
Hemlock 2
100.., I !
i 801
I
'°1 40-1
I 201
MitcheUa repens Medeola virginiana Lycopodium spp. Gaultheria procumbens Maianthemum canadense Other
llm.~== 0 I ' ' ' ' - I I I I I I~ I 1-=1 I I I
5 1015 20 25 30 35 40 45 50 55 60 65 70 75 80 85 90 9511JXX)+
Hemlock.3
'J 60i
~j
Density
Mitchella repens Other
w~ .. _ 0 I I 1-i I I I i I t l i I I I I I I l I I
5 1015 20 25 30 35 40 45 50 55 60 65 70 75 80 85 90 95lcml+
Density
C. Frederick

• Aralia nudicaulis Hardwood 1 la Maianthemum canadense.
ml] Vaccinium angustifolium
~ c: QI :II
i' ... u.
100 [] Uviiaria sessilifolia · ~ Gaultheria procumbens lSI Mitchella repens [Ill Trientalis borealis
80 l'2 Dennsteadia punctiloba 0 Hamameiis vUginiana • Vaccinium corymbosum [II Medeoia Virginiana ~ Osmunda spp. ~ Amelanchier laevis m llex verticullata
40 ~ Theiypteris noveboracensis ~ Lycopodium spp.
20
O~l,i.lSl,~.~~. ~~~.~.S!.l,5!i!,!1~~,.,c:;~,-.!:<~~.li51i~ 5 IO 15 20 25 30 35 40 45 50 55 60 65 70 75 80 8.5 90 951(18)+
Density ..-~~~~~~~~~~-.
• Maianthemum canadense Hardwood2 ~ Uvilaria sessilifolia
m Smilacina racemosa 100 ~ Denmteadia pu2ldilCJba
81 Aralia nudicaulis ~ Osmund.a spp.
80 '• [IJ Trientalis borealis 0 Mit.cheUa repms 0 Viola spp .
~ • Ondea sensibilis c: 60 !Ill Trillium undulatum Cl :II ~ Vibamum acerifolium i' 0 Vaccinium angustifolium ... u. Ii Impatiens capensis 40
~ Rubus flageliaris ~ Chimaphila umbeliata ~ Lycopodium spp.
20 • Other
0 . . ' ' 5 IO 15 20 25 30 35 40 45 50 55 60 65 70 75 80 8.5 90 951<1m+
Density
Hardwood3 • Lycopodium spp. ea Trientalis borealis 100
80
40
20
~ Gauitheria procumbens ~ Maianthemum canadense [] Den.nsteadia punctiloba lSJ Viburnum cassanoides m Vaccinium angustifolium 1'.a Ameianchier laevis 0 Other
Q..j!-!.E::\pca,lail,£~~. :3,=¥B~.-:"'~..,_.,_.p::i,.._,~:=:i,..-fi,~
5 10 15 20 25 30 35 40 45 50 55 60 65 70 75 80 8.5 90 951 OllOO+
C. Frederick Density

e-c <:.> :I g" .. ~
>. <..> c a. :I g" .. ~
5001 I
4001 I
300 I
200
100
0
500
400
300
200
100
500
400
200
1
Hemlock 1 Seedling Age Distribution
2 3
II Tsuga canadensis ~ Betula alleghaniensis/lenta lilil Acer rubrum 0 Pinus strobus
4 5 5+
Age
Hemlock. 2 Seedling Age Distribution
11 Tsuga canadensis ~ Betula alleghaniensis/lenta lilil Quercus rubra [J Acer rubrum ~ Pinus strobus
............
1 2 3 4 5 5+
Age
Hemlock 3 Seedling Age Distribution
Tsuga canadensis Betula alleghaniensis /I en ta Acerrubrum Pinus strobus
C. Frederick Age

soo,
i
~ :1 t I
200
100
Hardwood 1 Seedling Age Distribution
Age
B Acer saccharum ~ Tsugacanadensis !ill] Betula alleghaniensis/lenta 0 Quercus rubra 0 Acer rubrum &1 Pinus strobus ill Prunus serotina 0 Fagus americana 0 Fraxinus americana
Hard woo d 2 Seedling Age Distribution I Ifill 0 Q
Acer saccharum Tsuga canadensis
500 1
400 J
I ~ c 300 -I ~ ::I
I go .. I a. 200 I
-t
I 100-1 ,~. -. -. ·""'
.l1W1i111 1 2 3
Age
&1 ID
Betula alleghaniensis/lenta Quercus rubra Acerrubrum Pinus strobus Prunus serotina Fraxinus americana
···············=·
1111111111 5 5+
Hardwood 3 Seedling Distribution
500
400
200
100
1 2 3
C. Frederick Age
B Tsuga canadensis ~ Betula alleghaniensis/lenta Ifill Quercus rubra ~ Acer rubrum 18 Pinus strobus ~ Prunus serotina
t\<<s3 ' I
4 s 5+

Soil Respiration in Three Former Agricultural Land-use Legacies in a Massachusetts Temperate Forest
Cindee Giffen
Soil Respiration is an important global process, as it is part of the global carbon cycle. C02, which is a result of soil respiration, is a significant green house gas indicative of ecosystem productivity. The two main components of soil respiration are root respiration and microbial decomposition of organic matter. The purpose of this study is to determine what effects land use has had on soil respiration.
Last summer, six sites were chosen on the Prospect Hill tract at Harvard Forest, two from each of three land-use types. The three former agricultural land-use legacies are plowed (thoroughly mixed soil), pastured (moderately mixed soil), and woodlot (little or no soil mixing). Soil respiration was measured weekly at each of the sites in the afternoon and under relatively constant weather conditions. Thirty-five locations were sampled at each site using a Li-Cor 6200 portable gas analyzer to determine spatial heterogeneity over the sites.
Mean rates of C02 flux over the sites ranged from 150 to 200 mg C/m2/hour. Our results show no difference in C02 flux among the sites (Fig. I). There is also no correlation between C02 flux and organic matter mass (r2=.030), soil temperature ( r 2=5e-4), or nitrogen mineralization (r 2=J.4e-3). There is little difference in litterfall across the six sites, which may explain why there is no relationship between soil organic matter and C02 flux. The lack of a relationship between soil temperature and flux can be explained by our sampling period thus far wherein we sampled only over a two month period and a small range of soil temperatures.
Seedling and Herbaceous Patterns in Relationship to Soil Conditions in Three Prior Agricultural Land Use Sites
Jessica L. Graham
An investigation was conducted on seedling and herbaceous patterns using a multivariate approach to soil conditions in three prior agricultural land use sites. It was hoped to improve knowledge of plant preferences in their habitat. The sites were compared between themselves and land uses. ldrisi, Quattro Pro, and Pro Stat were used to run statistical tests about the stands. The variables were soil moisture capacity, nitrogen availability, and forest floor depth. An index was created to assign all the values of the variable numbers between one and eighty. Through several regressions it was found that none of the variables were statistically similar.
T-tests were also conducted to see if there was any correlation between the prominent vegetation species and all four soil variables in one site from each land use. It was found that Epigaea was statistically attracted to areas with relatively less nitrogen. The other species tested, Smilacina, Medeola, Mitchella, Q. alba, A. rubrum, P. serotina, and P. strobus, had no significant difference between the areas where they did and did not grow. The student's T-test on each variable between each land use was run along with Duncan's LSD from Pro Stat on each variable among all sites.
The results of these tests showed many differences between the sites. For instance, our second plowed site has significantly greater nitrogen availability than does any of the other sites (Fig. A.). Plowed two also has significantly Jess soil moisture capacity and a less thick forest floor (Figs.Band C.). However, the index value is similar to the other plowed and pastured sites (Fig. D). Our second pasture site had significantly more soil moisture than did Pasture one (Fig. B) The woodlot sites were statistically the same as one another but had significantly higher forest floor depth and total index than the other sites (Figs. C and D).
When looking for differences among the three land uses, the plowed sites had more nitrogen available to them then did the pasture sites. They were also higher than the woodlots but this difference was not significant (Fig. E). The
12

240 -
220 -
Average C02 Flux at Six Land-Use Sites
~- T
'C' 180 - T T ~ T 0 160 - -, T ..c
~ :::- I .s 100 -x ~ u.. 80 -
60 -
40 -
20 -
:j~jjJ1l~l~l~l~~~~~~~~~~~~ll 0-+-----"=¥""=--==f'==-,-=~.==------=~'---'>=;=,=--==~.='----"
P1 P2 S1 S2 W1 W2
Site
Giffen, Fig. 1: Average C02 flux (mg C/m2/hour) during summer, 1997, among former agricultural land-use sites.

Figures A through H. Showing soil variables between sites.
0
~50 e <;: 40 8. c: 30
!'20 z E 10
I o :::;
80
60 !! .l!! !40 ':ll
20
0
Nitrogen Availability: Figure A
Forest Floor Depth Figure C.
Nitrogen Availability Figure E.
Forest Floor Depth Figure G.
P = Plowed sites T = Pasture Sites
Jessica Graham
100
80
60
40
20
'5 4 "' E ~3
~2 .. "!ii s: 1 E ~o
100
80
60
40
20
0
0
Soil Moisture Figures.
Index Figure D.
Soil Moisture Figure F.
Index Figura H.
W = Woodlot Sites - Marks sites that are statistically similar.

plowed sites had statistically less soil moisture and forest floor than the pasture and woodlot tracts (Figs. F and G). The index value between the plowed and woodlot sites was also significant (Fig. H). The pasture plots were significantly lower in all variables than the woodlot sites.
The results are not successful in finding seedling patterns; however, there is a surprising amount of differences between our sites. The fact that the second plowed site is so different from the others in most aspects is incredible. The project is based on the differences between land uses. It is our general feeling that the woodlot sites have had a lot of time for niches to form. The fact that the woodlot has not been seriously disturbed but rather has been allowed to accumulate organic material and has reached old growth status is reflected in the results of this study.
Correlation Between Herbaceous Species Composition and C02 Flux at Harvard Forest
Evan Kane
The rate of soil respiration has been measured at 6 sites since June of 1995 and 8 since June of 1996 at Harvard Forest. The first 6 sites represent 2 transects, one running NW of the EMS tower and the other SW; the sites range from moderately well drained to poorly drained. The second 2 sites represent different past land-uses, one being farmed and the other left as a permanent woodlot. An assessment of the ground vegetation surrounding the C02 sample collars was done and correlated to the respective soil carbon fluxes.
2 m/\2 stem count sample plots were set up around each C02 collar (6 at each site) and 3 sample plots were set up in undisturbed parts representative of that site to test for trampling effects (Fig. 1). This species abundance data was then entered into a statistical ordination program (CANOCO) with C02 flux (mg m/\-2h/\-l) as the environmental variable (Fig. 2). This was done to try to decipher certain species assemblages and the respective carbon fluxes of their native sites.
The moisture gradient of Figure 2 can be seen from the majority of the species in the positive y axis being National Indicators OBL and FACW (wetland), whereas the negative y axis is composed mainly ofFAC and FACU (upland) species. The C02 gradient was obtained by comparing the species at the highest flux sites with their location along the x axis. The highest concentration of species from the site with the highest carbon fluxes (SWN) is located in the upper right quadrant and is denoted by such species as Viburnum dentatum, Thelypteris noveboracensis, Viburnum cassinoides, and Medea/a virginiana. The species at the far left on the x axis, Lycopus uniflorus, !lex verticillata, and Carex intunescens, were endemic to the site with the lowest carbon fluxes (NWF). The fact that the spatial relationships of the species on the ordination without C02 flux as an environmental variable varies from Figure 2 suggests that flux does have an influence on composition. This interpretation of the ordination suggests that a certain species or assemblage may be indicative of a certain flux in carbon dioxide.
An Investigation of the Effects of Winter 1996-1997 Storms on Pinus rigida and Mixed Hardwood Stands Located on the Montague Sand Plain in Central Massachusetts
Nicole Lavelle
The overall goal of this study is to understand the effects of natural disturbance on the structure and function of Pinus rigida and mixed hardwoods on the forested ecosystem of the Montague Sand Plain. This study is important because while there is a fair amount of literature on the effects of storm damage on forested ecosystems, there has not been a study which evaluates the effects of storm damage on the forests of a sand plain environment. Sand plains are very unique environments. For example, the Montague Sand Plain is an outwash delta of sand and gravel that was
13

2.25
2
1.75
1.5
1.25
0.75
N 00 0.5 ·x QI
0.25
0
-0.25
Atri -0.5
-0.75
-1
-1.25
1r::o2 Flux Vs. Sp. Composition
Csttril
Luni
EMS Tract
NWF Flux avg. 97.7
rnar - Cca'1. Iver
Aste
Aqui
Tpa~le Tcan
Intermediate Cbor
Flux avg.170 Viol
Ocin
Cgro
SWN Flux avg. 260.1
Vcas
r p 0 b§gra PliitFP ~gd0ru
~~ Vace \
Ltri Cden
)
-2.5 -2.3 -2 -1.8 -1.5 -1.3 -1 -0.8 -0.5 -0.3 0 0.25 0.5 0.75 1.25
Figure 2
Figure 1
E. Kane
axis 1
Trample Effects Vs. Shannon Diversity Alpha .05
0.9
0.8
0.7
0.6
0.5
0.4
0.3
0.2
~
"'7 ~ .. I_
r~ ~ , ... __.:...., /t/• ~ .I "-: ',\\ .IJ, 'l.
'"'' '\\ u_' \' '\ ,\ ,,,,. , B I \,
N. '' /!/, tt '\' \
,,, 'il
"\ //.' I '.\ ,,
. \
\ I
SWFSWMSWNNWNNWMNWF H F Site
---Flag --Collar
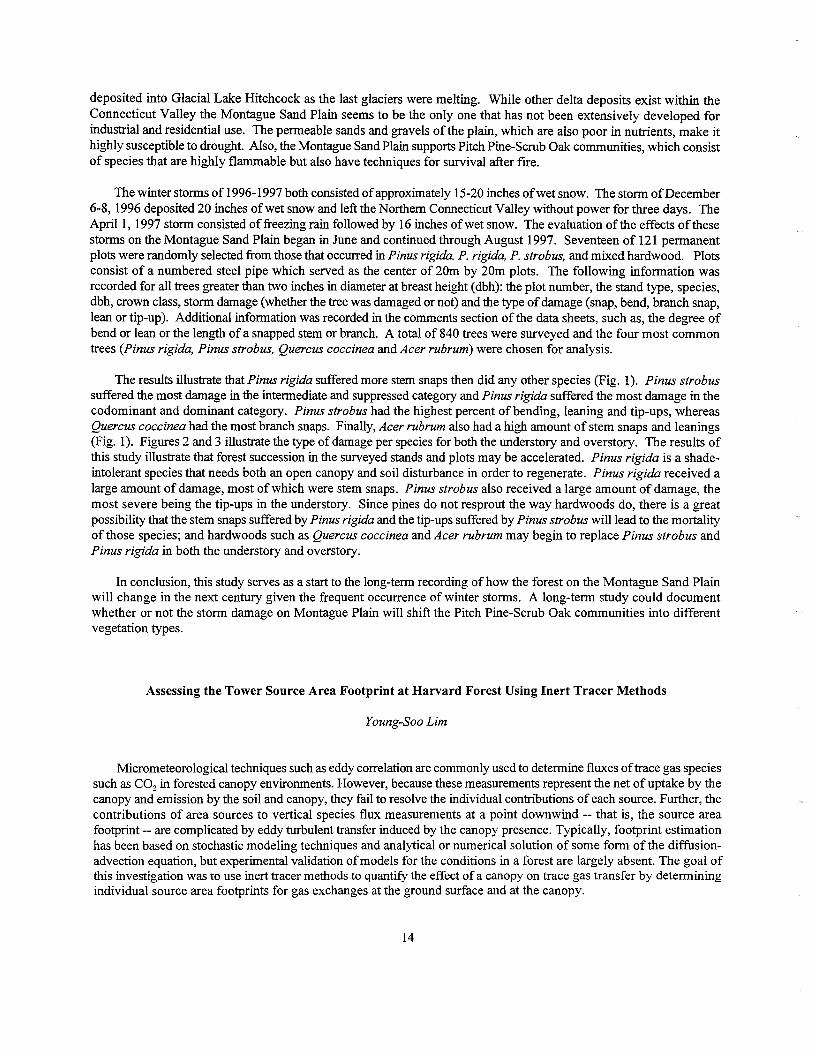
deposited into Glacial Lake Hitchcock as the last glaciers were melting. While other delta deposits exist within the Connecticut Valley the Montague Sand Plain seems to be the only one that has not been extensively developed for industrial and residential use. The permeable sands and gravels of the plain, which are also poor in nutrients, make it highly susceptible to drought. Also, the Montague Sand Plain supports Pitch Pine-Scrub Oak communities, which consist of species that are highly flammable but also have techniques for survival after fire.
The winter storms of 1996-1997 both consisted of approximately 15-20 inches of wet snow. The storm of December 6-8, 1996 deposited 20 inches of wet snow and left the Northern Connecticut Valley without power for three days. The April 1, 1997 storm consisted of freezing rain followed by 16 inches of wet snow. The evaluation of the effects of these storms on the Montague Sand Plain began in June and continued through August 1997. Seventeen of 121 permanent plots were randomly selected from those that occurred in Pinus rigida. P. rigida, P. strobus, and mixed hardwood. Plots consist of a numbered steel pipe which served as the center of 20m by 20m plots. The following information was recorded for all trees greater than two inches in diameter at breast height ( dbh): the plot number, the stand type, species, dbh, crown class, storm damage (whether the tree was damaged or not) and the type of damage (snap, bend, branch snap, lean or tip-up). Additional information was recorded in the comments section of the data sheets, such as, the degree of bend or lean or the length of a snapped stem or branch. A total of 840 trees were surveyed and the four most common trees (Pinus rigida, Pinus strobus, Quercus coccinea and Acer rubrum) were chosen for analysis.
The results illustrate that Pinus rigida suffered more stem snaps then did any other species (Fig. 1 ). Pinus strobus suffered the most damage in the intermediate and suppressed category and Pinus rigida suffered the most damage in the codominant and dominant category. Pinus strobus had the highest percent of bending, leaning and tip-ups, whereas Quercus coccinea had the most branch snaps. Finally, Acer rubrum also had a high amount of stem snaps and leanings (Fig. 1). Figures 2 and 3 illustrate the type of damage per species for both the understory and overstory. The results of this study illustrate that forest succession in the surveyed stands and plots may be accelerated. Pinus rigida is a shadeintolerant species that needs both an open canopy and soil disturbance in order to regenerate. Pinus rigida received a large amount of damage, most of which were stem snaps. Pinus strobus also received a large amount of damage, the most severe being the tip-ups in the understory. Since pines do not resprout the way hardwoods do, there is a great possibility that the stem snaps suffered by Pinus rigida and the tip-ups suffered by Pinus strobus will lead to the mortality of those species; and hardwoods such as Quercus coccinea and Acer rub rum may begin to replace Pinus strobus and Pinus rigida in both the understory and overstory.
In conclusion, this study serves as a start to the long-term recording of how the forest on the Montague Sand Plain will change in the next century given the frequent occurrence of winter storms. A long-term study could document whether or not the storm damage on Montague Plain will shift the Pitch Pine-Scrub Oak communities into different vegetation types.
Assessing the Tower Source Area Footprint at Harvard Forest Using Inert Tracer Methods
Young-Sao Lim
Micrometeorological techniques such as eddy correlation are commonly used to determine fluxes of trace gas species such as C02 in forested canopy environments. However, because these measurements represent the net of uptake by the canopy and emission by the soil and canopy, they fail to resolve the individual contributions of each source. Further, the contributions of area sources to vertical species flux measurements at a point downwind -- that is, the source area footprint -- are complicated by eddy turbulent transfer induced by the canopy presence. Typically, footprint estimation has been based on stochastic modeling techniques and analytical or numerical solution of some form of the diffusionadvection equation, but experimental validation of models for the conditions in a forest are largely absent. The goal of this investigation was to use inert tracer methods to quantify the effect of a canopy on trace gas transfer by determining individual source area footprints for gas exchanges at the ground surface and at the canopy.
14

I • 8noP 2 • Bond 3 • Bunch Snnp 4 • Lean 5 • Tip-up
PINUS RIGIDA
10
z 3 0
2
DAMTYPE
39% 22%
PINUS RIGIDA
5
I- 4
a 0 3
0 2
DAMT\'PE
33% 67%
10
I-z 3 0
j 5
0 3
39%
15
10
~ 0
5
0
N. Lavalle
Figure 1. .
TYPE OF DAMAGE PER' SPECIES
QUERCUS COCCINEA ACER RUBRUM PINUS STROBUS
10 20
z B u
I-z a o.
L~' 0 __LJ
2 3 3
10 _.J_. 0
3 5
OAMTYf'E DAM TYPE DAM TYPE
13% j2% 42% 10% 3% 29% 31% 24% 16% 16% 45% 9% 20% 10%
Figure 2.
Type Of Damage In lntermedia te And Suppressed Trees
QUERCUS COCCINEA f.CER RUBRUM PINUS STROBUS
1e 30
10 20
... ~ ~
0 0
a 10
2 3 4 a 0 0 2 3 4 ~
OAMTYPE DAMT\'PE DAMTYPE
11% S6% 11% 17% 5% 32% 35% 24% 9% 18% 50% . 22% 10%

N. Lavalle
Figure 3.
Type Of Damage In Codominant And Dominant Trees
PINUS RIGIDA QUERCUS COCCINEA
·~ 0
3 3
DAM TYPE OAMTYPE
41% 5% 54% 15% 85%
ACER RUBRUM PINUS STROBUS
5
4
2 3
!z ~ a 0 0 2
J_ J l • Snap
D 0 · 2 • Bend
3 3 3 • Branch Snap
OAMT\'PE OAMTYPE 4 • Lean 5 • Tip-up
20% 20% 40% 20% 100%

Measurements in this study were made at a 30-m tall instrumented tower on the Prospect Hill tract of Harvard Forest. Line source releases were installed at both ground-level height and canopy height at IOO m and 400 m radii from the tower in the northwest and southwest directions. The tracer used, sulfur hexafluoride (SF 6), was released continuously at a steady rate from a single line source during favorable wind conditions. Determining the source area footprints for ground and canopy surfaces involved measuring vertical fluxes resulting from independent line source releases at the two radii at that particular surface. Vertical fluxes were calculated using eddy correlation, in which the covariance of concurrent instantaneous measurements of vertical wind velocity and tracer concentration are multiplied and integrated. Wind velocities were continuously measured above and below the canopy using sonic anemometers positioned at varying heights on the tower, while continuous tracer concentrations were logged for each height by drawing sampling air down a length of polyethylene tubing past a fast-response electron-capture analyzer housed in a hut near the tower. All data were logged at IO Hz using a CRIO data logger (Campbell Scientific, Inc.) and QNX-based PC data acquisition system.
Tracer releases conducted during periods with NW or SW winds covered more than 50 hours during July I997. However, due to frequent instrument failure and difficulty in effectively correlating digital sonic anemometer inputs with the analog data stream from the tracer analyzer, usable logged data has thus far been limited to two periods on 27 July, when 100 m releases were deployed at ground level during a northwest wind. Preliminary results show considerable channeling of subcanopy air, suggesting that the canopy has an appreciable dampening effect on ground surface emissions. A scatter plot of tracer concentration versus vertical wind velocity at canopy height shows that higher tracer concentrations are associated with downward vertical winds at that height, providing a partial glimpse into the nature of turbulent transfer caused by the canopy presence. Further data collection and processing will be performed before source area footprints are determined or comprehensive conclusions drawn.
Photosynthetic Response to Light and C02 of Four Forest Floor Herbaceous Species
Amanda Lodge
Light and C02 are essential resources for photosynthesis and plant survival. Light levels decrease when approaching the forest floor due to above canopy cover. C02, concentrations, however, increase due to soil respiration. Therefore a herbaceous plant is exposed to different levels of light and C02 depending on its height. This study explored the affect of these differing vertical environments on the photosynthetic rates of four herbaceous species which differ in heights at maturity; Clintonia borealis (6 cm), Trientalis borealis (I I cm), Medeola virginiana (25 cm), Aralia nudicaulis (30 cm). Two different land-use legacy sites were chosen, a woodlot and a pasture.
A Li-Cor 6400 was used to measure the photosynthetic responses of the herbs to a range oflight levels and a range of C02 concentrations. The photosynthetic rates were then compared at light saturation levels,C02 saturation levels, and when the intercellular C02 is equal to 300 µmol CO/ mol air. All of these comparisons displayed significant differences between species and between sites.
At light saturation levels the species with the highest photosynthetic rate was the Aralia, approximately 8.5 µmol CO/m2/s, followed by Clintonia (6.5 µmol CO/m2/s), then Trientalis and Medeola (5 µmol CO/m2/s). Similar rates were found when the intercellular C02 is equal to 300 µmol CO/ mo! air. However, when the plants were saturated with C02 , photosynthetic rates increased: Aralia, I 4 µmol CO/m2/s; Clintonia, 13 µmol CO/m2/s; Trientalis and Medeola, I 0 µmol CO/m2/s. This demonstrates that C02 is normally a limiting resource and increases of C02 will affect how well the plant photosynthesizes.
Higher photosynthetic rates were found in the tallest and shortest plants, Aralia and Clintonia. The two middle sized herbs showed similar and lower photosynthetic rates. This could show that there is a tradeoffbetween light and C02 at different heights of the herbaceous layer. Higher levels of photosynthesis were found in the pasture site which could be due to the higher levels of light available in this site.
15

--Cl.. Cl.. -c: .2 ca ..... c
CD (J c: 0
(.) CD u.
(/)
Level3
10000 Level4
Level2
1000
Level 1 (top)
········~················· ··················································
100 0
1800
1600
1400
Z" 1200 Cl.. s c: .2 ca ,_ c CD (J c: 0 (.)
CD u. (/)
1000
800
600
400
200
-2.0
100
•
• • •
-1.5
200 300 400
Time (sec)
... ,. I')\ ••
, .... f:I~·: . ; •.. • • • •• . . ~ . . ' . \ . ~ ~ . -. . ... . .•. -·.' .... .. . •• •• A ... .. ~ ~
.~ .-""'· : .
500
-~. ... 'ti!..~~ 1· •• ~- , ·-;. . ' .. ' ,: ~.,. ,. 1': -..i.J: ·. . . : . . . ' ... :- ~ ... ~ •.
.:-: •-pt! '\I··«~ ii."S - ·-,.=r-(• ·~ ... ,~~11·::·1~!f=-.. -.. :-'-g .AR.. '" ...... ., . .. :
-1.0 -0.5 0.0 0.5
Vertical Wind Velocity (mis)
Young-Soo Lim
Background Air
600 700
1.0

Landscape Level Distribution and Damage Patterns of the Hemlock Woolly Adelgid (Adelgis tsugae) in Eastern Hemlock (Tsuga canadensis) Forests of Central Connecticut
David Mausel
The forest pest, HWA, is presently a pest of Carolina hemlock ( T. caroliniana) and Eastern Hemlock throughout its range on the eastern seaboard. From ecologists to urban foresters, there is great concern about the temporal and spatial spread of this insect inland and into northern New England. The HWA causes extreme damage that can render perfectly healthy, late successional hemlock forests and ornamental trees into standing dead timber within years.
The HWA has the potential to seriously reduce or even eliminate hemlock from its eastern range. HWA has no natural predators and hemlock has no effective resistance. Also, the pest feeds in the lower vertical stratifications with the same ferociousness as canopy trees. This eliminates any hope for future release of hemlock seedlings and saplings upon overstory mortality.
This summer we located stands delineated from 1981 aerial photos to define their basic structure, composition, ecological components, damage levels, and infestation levels. We frequently encountered sites that were delineated as one forest type but varied internally, or were logged. Therefore, out of 60 stands visited, only 37 were sampled. Of the stands sampled to date, 19% were salvaged logged since 1981, 27% did not fit our sampling criterion, and 1.66% of the stands were located on atomic testing grounds in which we did not sample.
The spatial spread of the HWA at this time shows a significant increasing trend of damage from northern Connecticut to Long Island Sound consistent with its spread north. This intuitively supports the observation that increases in mortality and decreases in crown vigor relate to length of infestations. Also, increasing HWA presence levels were statistically related to the decreasing crown vigor data we gathered. An R-squared value of .56 and a low p-value (.000) suggests that the damage we are seeing in the corridor of Central Connecticut is related to the density of the HWA infestation, probably more than any other factor (Fig. 1 ). With more sampling and data analysis, we will be better able to determine the extent and timing of HWA spread and hemlock damage, and which factors are important in causing these patterns.
Soil Moisture Variability in Past Agricultural Land-use Types at the Harvard Forest
Christy Meredith
Soil moisture can be important for a number of reasons, including plant productivity, trace gas flux, nutrient availability, and soil biota. This study looked at the effects of land-use on moisture (g H20/g dry soil) in the field and on the moisture-holding capacity of the soil, and also correlations between the two.
As part of the National Science Foundations's Collaborative Research for Undergraduate Institutions (CRUI) project at the Harvard Forest, six sites were established representing three land-use legacies, two each of plowed, pastured, and woodlot.
Measurements of gravimetric moisture were first taken in June 1996 at 27 points in each of the 6 CRUI plots. Results showed a significant difference in the ability of the mineral and forest floor soils in the woodlot sites to hold moisture, both on a gram g H20/g dry soil basis and on a g H20/cm2 dry soil basis, the latter being an expected result given the greater thickness of the woodlot forest floor soil. The significant difference in the mineral soil was unexpected.
The significant difference on a g Hp!g dry soil basis seemed to indicate a difference in the quality of soil found in the woodlot sites and prompted a 1997 study of the soil mosture holding capacity of both the mineral soil and forest
16

Table I. Linear regression of Hemlock Woolly Adelgid ( Adelges tsugae ) infest~tion levels and crown damage from stands in Central Connecticut.( 95% confidence intervals and 95% prediction bands included).
7 J 1:
6
0::: 5 0 4 (9 -> 3 ~ 2 I
1
0
-1
X-Axis
Regression Fit Y = ·1.46581 + 1.19905X
R-Squared = 0.561 95.0% Confidence Baflds--- 95.0°4 Prediction Bands
---· --•' -... ..--· • - ... - ., ' .--- •·· -- ..
---~ .. ·•:· -- ---- I -- . --- --- •.
·.•
--- . -- -. -- 1 -.. _ ......... -· . -- ----• -· . :-.-·... . ,._ .... . -•· ··:..----------I
0 1 2 3
HWADENS
HW ADENS= Hemlock Woolly Adelgid infestation levels determined by egg mass per unit
Y-axis
foliage ratios. O= No Adelgids present 1 = Light presence
2= Moderate presence 3= Heavy presence
HK VIGOR= Crown vigor of Hemlock trees based on% of foliar loss. 1 = Healthy tree 4= 51-75% Foliar loss 2= 1-25% Foliar loss 5= 76-99% Foliar loss 3= 26-50% Foliar loss 6= Dead Tree
D. Mausel 1997

Table 1. Linear regression of Hemlock Woolly Adelgid ( Adelges tsugae ) infestation levels and crown damage from stands in Central Connecticut.( 95% confidence intervals and 95% prediction bands included).
7 J 1:
6
0:: 5 0 4 (9
> 3 ~ 2 I I
1 ] 0
-1
X-Axis
Regression Fit Y = ·1.46581 + 1.19905X
R-Squared = 0.561 95.0% Confidence Baflds--- 95.0% Prediction Bands
------· . ___.. _: _____ ... • --- •: ' - •·· .,-----r- ,· ·•:: ---- • --- --· .--- ...
-l -.. -. - -.. ----. ._ :· .. -· --
.• -----• _;:._.----------0 1 2 3
HWADENS
HW ADENS= Hemlock Woolly Adelgid infestation levels determined by egg mass per unit
Y-axis
foliage ratios. O= No Adelgids present 1 = Light presence
2= Moderate presence 3= Heavy presence
HK VIGOR= Crown vigor of Hemlock trees based on% of foliar loss. 1= Healthy tree 4= 51-75% Foliar loss 2= 1-25% Foliar loss 5= 76-99% Foliar loss 3= 26-50% Foliar loss 6=Dead Tree
D. Mansel 1997

floor soil at each of these sites. Thirty-five cores were taken from each of the six CRUI sites and analyzed in the laboratory by reconstructing the soil profiles and placing them into containers with mineral soil from each of the six sites. The soil moisture-holding capacity was obtained by saturating reconstructed cores and determining gravimetric moisture content. These results showed a small significant difference in the ability of woodlot mineral soil to hold moisture but none in the ability of forest floor soil to do this (Fig. 1). In July 1997 gravimetric soil moisture measurements were also taken. Both these and the 1996 measurements were compared with the moisture capacity data and no significant correlations were found for our data set, indicating that capacity could not be an adequate predictor of moisture in the field. This lack of correlation could best be explained by heterogeneity differences across the sites and because so few measurements were taken of moisture in the field. Because a significant difference was found in the ability of woodlot mineral soil to hold moisture in both the capacity and gravimetric data, statistical tests were run to see if this might be due to differences in% organic matter in the mineral soil. A small r2 of .204 was found (Fig. 2).
In conclusion, both moisture in the field and soil moisture holding capacity are affected by environmental factors, which vary across the sites. More moisture data need to be obtained across larger time spans to see if moisture in the field is correlated to soil moisture-holding capacity. Also, the mineral soil seems to be a better indicator of past land-use, perhaps due to the slow cycling of organic matter which is a good indicator of past inputs to the soil.
Structure, Composition, and Recruitment Dynamics of Old-growth Forests on Wachusett Mountain, Massachusetts
Sarah E. Picard
In 1995 fifty hectares of old-growth forest were discovered on Wachusett Mountain. Three of four designated oldgrowth sites were examined to determine the age and vegetation structure as well as the disturbance history of each. In each stand, five 20 X 20 meter permanent plots were placed along a transect. Within each plot the vegetation was sampled and eight trees were cored randomly. Additional trees outside of the plots were cored in each stand.
Tsuga canadensis was the most important overstory species and had the greatest basal area in one stand, Quercus rubra was the most important species on the southern talus slope, and Betula alleghaniensis was the most important species on the eastern talus slope. Q. rubra, Betula, and Acer rubrum were among the most important species in all stands. Q. rubra fell into the largest size classes in all stands while Acer was found in the smaller size classes. T. canadensis spanned all size classes in the Hemlock stand and B. alleghaniensis spanned all size classes on the eastern and southern talus slopes. In all stands, Q. rubra had early establishment dates with trees over 250 years old while Acer had more recent recruitment (Fig. 1). In the Hemlock stand, T. canadensis recruitment continued from 1740 to 1890 where all recruitment ended. B. alleghaniensis recruitment on the southern slope overlapped with Q. rubra and A. rubrum. On the eastern talus slope it preceded Q. rubra recruitment in 1630 and continued to the present. The southern slope had a decade of recruitment peak just following 1940 which may have been a response to the 1938 hurricane, while the talus slope had a peak in 1960 which may have been a result of many strong wind storms in the 1950's. All stands had high recruitment in 1800 suggesting some form of widespread disturbance on the mountain during this time period.
The Effects of Heating on Root and Microbial Respiration in a Hardwood Forest
Jonathan Sanderman
Globally, soil respiration accounts for the release of 50 to 75 Pg of carbon annually (Raich, 1992). This figure is more than 10 times the total annual release due to the combustion of fossil fuels. The Soil Warming experiment, established in 1991, has shown on average a 20% increase in soil respiration with a 5°C increase in soil temperature.
17

Soil Moisture-Holding Capacity
:::::- 3.00 ·5 rn
I
§2.50 I N
I I :::r: S2.00 >--·c:;
I ~ 1.50 C'O (.)
I I ~ 1.00 ::J -
1:>01' I rn
1·.111 ~ 0.50 I I\(!\ I I· ·cs I·>) ~·· I CJ) 0.00 ~ ........
P1 P2 51 52 W1 W2 Site
- Forest Floor Mineral Soil
Fi1wre 1.
Soil Moisture-Holding Capacity of forest floor and mineral soils at each of the six CRUI sites. Mineral soil in both woodlots was found to have significantly more moisture-holding capacity than the other sites.
% Organic Matter vs. Soil MoistureHofding Capacity
5.00-r-----------------.-
4.00
~ 3.00 (I)
Cl a C\I :::c Cl 2.00
1.00
• • -- -- - - -•
· 0.00-t------,~---.------r-----r------.----l 0 5 10 . 15 20 30
% Loss on Ignition
Figure 2.
% Organic Matter vs. Soil Moisture-Holding Capacity in mineral soil at the CRUI sites. A weak rof .204 was found, indicating that% organic matter may be a factor in predicting the ability of mineral soil to hold moisture.
C. Meredith

U>
E Q)
iii -0 =!:!:
U>
E Q)
(ii -0 =!:!:
U>
E 2 U>
0 =!:!:
10
8
6
4
2
0
10
8
6
4
2
0
10
8
6
4
0
Hemlock
n=65
1630 1670 1710 1750 1790 1830 1870 1910 1950 1990 1650 1690 1730 1770 1810 1850 1890 1930 1970
Decade of recruitment
m Hemlock 1111111111 Red M. - Red Oak - B.Birch
Southern Talus
n=66
1630 1670 1710 1750 1790 1830 1870 1910 1950 1990 1650 1690 1730 1770 1810 1850 1890 1930 1970
Decade of recruitment
I GW Beech 1i11111ii1 RedM. - Red Oak • Sugar M. o Y. Birch 1111111 Other
Eastern Talus
n=66
1630 1670 1710 1750 1790 1830 1870 1910 1950 1990 1650 1690 1730 1770 1810 1850 1890 1930 1970
Decade of recruitment
11B11 RedM. - Red Oak c:a Striped M. CJ Y. Birch 11D1D1D1 Other
S. Picard

Peterjohn et al. (1994) postulate that this "increased release of C02 could be the result of increased microbial decomposition, increased root respiration, or a combination of both of these processes."
In 1994, the TR.ench Un Trench Heat (TRUTH) experiment was established to quantify the effects of a 5 °C increase in soil temperature on these two components of soil respiration. Trenching around a plot and removing all vegetation will, theoretically, eliminate the root component of soil respiration leaving only microbial activity. The experimental design consists of3 replicates of 4 treatments: I) untrenched, unheated; 2) untrenched, heated; 3) trenched, unheated; and 4) trenched, heated.
Data from 1997 indicate that root respiration accounts for 20 percent of total soil respiration in the unheated plots and 28 percent in heated plots. Heating affects root and microbial respiration differentially. Root respiration increased 42 percent and microbial respiration increased only 3 percent with a 5°C increase in soil temperature. Heating depresses 0 10 values for total soil respiration (untrenched) from 3.6 to 2.3, but has only a minimum effect on microbial respiration (trenched), decreasing the 0 10 values from 2.1to1.9.
Several factors may be influencing these results. First, a moisture difference of nearly 25 percent between trenched control and heated plots may be suppressing the percent increase due to heating in the trenched treatment. By modeling out the temperature difference between these treatments, the drier conditions in the heated plots seems to decrease the microbial respiration by nearly 20 percent. A second factor is that the carbon-pool structure may be changing in the trenched plots due to an inability of these plots to hold fresh litter inputs. The effect of this change on soil respiration has not yet been fully explored.
Peterjohn, W.T., J.M. Melillo, P.A. Steudler, K.M. Newkirk, F.P. Bowles, and J.D. Aber. 1994. Responses of trace gas fluxes and N availability to experimentally elevated soil temperatures. Ecological Applications. 4(3). 616-625.
Raich, J.W. and W.H. Schlesinger. 1992. The global carbon dioxide flux in soil respiration and its relationship to vegetation and climate. Tel/us, 44B, 81-99.
The Soil Warming Experiment Control Plots lnterannual Variations in C02 Flux
Nina Wurzburger
The purpose of the Soil Warming experiment is to monitor the effects of soil warming on trace gas fluxes at the Harvard Forest. With a rise in global temperatures predicted within the next century, the effects of higher soil temperatures on soil processes has stimulated interest. Knowledge of the response of trace gas flux to warmed soils can be extrapolated into larger scale models which can predict the effects of increased temperatures at the global level.
Initial results of the Soil Warming experiment confirmed that warmer soil temperatures would increase rates of soil respiration. However, results which were not expected and gave rise to further research were the variations of gas fluxes between years. It has thus been determined that a better understanding of the factors which cause interannual variation in C02 flux is crucial before the effects of increasing soil temperatures can be explained. Work is now being focused on examining the causes of yearly variability. Strong yearly correlations exist between temperature and C02 flux rates while further interannual variations appear to be related to soil moisture. Creation of a water balance for the Soil Warming site would be a useful tool for the prediction of C02 flux. Evaluation of specific site variables such as surface water vapor flux, plant water uptake, precipitation, and runoff will lead to a better understanding of the site's water balance variations with time. Combined with our understanding of temperature effects of C02 flux, a water balance evaluation will be essential in order to create a carbon cycling model for the region.
18

N. Wurzburger
201
C02 Flux
18
21.74731 NOAA Air Temp
Ppt. Diff
Temp dlff
Theta
·1U541
17
-B
4
-4
D.4
0.07
Soil Warming Control Plots Yearly Trends 1992-1997
.• 1111._ .11111 .. .. I 111_ ll..1. .111111.
••.• 11111 •. , '1'1111111., ir11lll 1 •. •1''111111.1 .... 111111..
~
'•1111 ) •• 11·····'···1 . 'r 1,1 .. 1 1,1 .. ,h.I' • 1., .. .1,1 •. 1 '--
~
l.ll'l'Tll -,, .. •,•--,1 "II .. - -p Ir' .,, .. --··r- l" ... 1. _11
'--
" 11111111 1111111 11111111 11_.11 ll11i111
1111
1··'111
··-··r
.1 .. , ••
1111
1992 1993 1994 1995 1996 1997

1997 HARV ARD FOREST SUMMER SEMINAR SCHEDULE
Seminars Held Wednesday evenings at 7:00 PM Unless Otherwise Noted
June 3 - Tuesday - Research Seminar
"Forest landscape dynamics in central New England: ecosystem structure and function as a consequence of 1000 years of change"
David Foster, Director, Harvard Forest
June 11 - Wednesday- Research Seminar
"When does old become old-growth? Long-term studies of stability and change in the Michigan Big Woods" Kerry Woods, Bennington College, Bennington Vermont
June 18 - Wednesday - Research Seminar
"If there's a disturbance in the forest, and we can't really see it, does it really matter."
Richard Bowden, Allegheny College
July 2 - Wednesday- Research Seminar
"Bubbles, toils, troubles - how does water get to the top of tall trees?" Ann Lewis, University of Massachusetts
July 8 - Tuesday - Research Seminar
"Long-term forest dynamics in eastern North America" Janice Fuller, Harvard Forest
July 16 - Wednesday- Research Seminar
"The origin of the Hubbard Brook ecosystem study" F. Herbert Bormann, Yale University
July 23 - Wednesday - Research Seminar
"Carbon dioxide exchange by the understory of an old-growth hemlock forest" Julian Hadley, Harvard Forest"
July 30 - Wednesday - Research Seminar
"Paleolimnology" Donna Francis, Harvard Forest
August 4 - Monday - Research Seminar
"The U. S. Fish and Wildlife Service - Recovering Endangered Plants" Molly B. Sperdute, U.S. Fish and Wildlife Service, Concord, NH
19

August 13 - Wednesday - No seminar this week due to ESA meeting participation
August 20 - Wednesday- Research Seminar
"Seedling dynamics of Sierran conifers" Ruth Kern, Harvard Forest
20

The Institute of Ecosystem Studies presents:
FORUM ON OPPORTUNITIES IN ECOLOGY
July 22, 1997
Morning Sessions: Rewards and Motivations in Ecology Careers
Session One: 9:30-11:10 A.M.
9:35 Jon Polishook
9:48 Jerry Sherman
10:01 Shabazz Jackson
10:14 Elizabeth Farnsworth
10:27 Dr. Fred Lubnow
10:40 Barbara Murphy
10:53 David Stern
Break: 11:10-11:25 A.M.
Staff Microbiologist (Industry) Merck Research Laboratories, Rahway, NJ
Science Teacher (Education) Millbrook High School, Poughkeepsie, NY
Municipal Recycling S_pecialist (City Government) Greenway Marketing, Beacon, NY
Stewardship Ecologist (Applied Ecology) The Nature Conservancy, Middletown, CT
Senior Scientist ( Consul1ing) Coastal Environmental Services, Princeton, NJ
Assistant to the Executive Director (Environmental Activism) Scenic Hudson, Poughkeepsie, NY
Supervisor of the Pathogen Program (Jnvironmental Research) Department of Environmental Protection, Valhalla, NY.
Session Two: 11 :25 A.M.- 12:30 P .M.
11 ;25 Dr. Charles Nilon
11 :38 Thomas Lally
11 : 51 Felecia Keesing
12:04 Louis Sorkin
12:17 Drayton Grant
Associate Professor ofNatural Resources (Academia) The University of Missouri, Columbia, MO
Producer, The Environmental Show (Science Jvfedia) W AMC, Northeast Public Radio Albany, NY
Small Mammal Ecol9gist (Research Abroa~ Doctoral Candidate, University of California Berkeley, CA
Senior Scientist, Entomology & Arachnology (Museums) American Museum of Natural History, New York, NY
Environmental Lawyer (Law) Rhinebeck, NY
21

Afternoon Sessions: Small Discussion Groups
First Discussion Session: 1:30-2:10 P.M.
Group A - PSB Conference Room Group B - PSB Lobby Group C - PSB Classroom
Second Discussion Session: 2!10-2:50 P.M.
Group A - PSB Classroom Group B - PSB Conference Room Group C - PSB Lobby
Third Discussion Session: 2:50-3:30 P.M.
Group A - PSB Lobby Group B - PSB Classroom Group C - PSB Conference Room
Speaker Assignments:
Lobby - Beth Farnsworth, Fred Lubnow, Louis Sorkin, Barbara Murphy
Classroom - Shabazz Jackson, Drayton Grant, Thomas Lally, Jerry Sherman
Conference Room - Charlie Nilan, David Stern, Felicia Keesing, Jon Polishook
Facilitator Assignments:
GroupA
Group B
Group C-
Dr. Alan Berkowitz
Jill Cadwallader
Dr. Steward Pickett
22

1997 SUMMER PROGRAM COMMITTEE ASSIGNMENTS
Recycling
John Edwards*
Dax Bennett Brett Danner Amanda Lodge Nina Wurzburger
(Gets all student/common area materials to recycling shed)
Social/Recreational
Callie Braun Cristi Braun Kevin Clarke Sarah Picard
(Organizes events with all students' input)
Vehicles
John Edwards·
Jack McFarland Evan Kane Dave Mausel
(Car pooling; polices vehicles weekly)
23
Kitchen/Food
Lisa Marselle •
Richard Bakker Heather Frankland Jessica Graham Young Soo-Lim
(Works with Lisa on menus)
Graduate School Info.
Dottie Recos-Smith •
Jesse Bellemare Chrissy Frederick Cindee Giffen Nicole Lavelle Young Soo-Lim Jon Sanderman
(Obtains materials on grad schools)
Discussion Groups
Chris Kruegler •
Christy Meredith Will Sloan Anderson
(Solicits topics/organizes dinner discussions)

SUMMER RESEARCH ASSISTANTS 1997
William A. B. Sloan Anderson - UMASS P.O. Box 584 Ashfield, MA 01330
Richard Bakker Mount Union College Box85 Alliance, OH 44601 [email protected]
Jesse Bellemare 151 Conway Road Haydenville, MA 01039
Dax Bennett 15982 Harmony Way Apple Valley, MN 55124
Callie Braun Gustavus Adolphus College 800 W. College Avenue St. Peter, MN 56082 [email protected]
Christi Braun Box 261 Hampshire College Amherst, MA 01002 [email protected]
Kevin Clarke 60 Stafford A venue, #C5 Durham, NH 03824 [email protected]
Brett Danner Gustavus Adolphus College 800 College A venue St. Peter, MN 56082 [email protected]
Heather Frankland Box 550 Mount Union College Alliance, OH 44601 [email protected]
Christine L. Frederick 1376 Faucett Drive West Chester, PA 19382 cxfl [email protected]
- Mount Union College
- UMASS
- Gustavus Adolphus College
- Gustavus Adolphus College
- Hampshire College
- Univ. New Hampshire
- Gustavus Adolphus College
- Mt. Union College
- Penn State Univ.
24
Samuel W. Gale 18473 Heathcote Lane Deephaven, MN 55391 [email protected]
Cindee Giffin Box 1171 520 N. Main Street Allegheny College Meadville, PA 16335 [email protected]
Jessica Graham 58 W. Oxford Alliance, OH 44601 [email protected]
Evan S. Kane 116 W. White Street Alpena, MI 49707 [email protected]
Matthew Kizlinski 17 Lonesome Pine Road Cumberland, RI 02864 [email protected]
Nicole Lavelle 373 Stebbins Street Belchertown, MA 01007 [email protected]
- Univ. of Minnesota
- Allegheny College
- Mount Union College
- Michigan Tech. Univ.
Univ. New Hampshire
- Mt. Holyoke College
Delphis Levia, Jr. - Clark University 3 82 Barr Road New Braintree, MA 01531 [email protected]
Young-Soo Lim - Harvard University Harvard University 269 Pforzheimer House Mail Center Cambridge, MA 02138-7529 [email protected]
Amanda Lodge - Allegheny College Box 1636 Allegheny College 520 N. Main Street Meadville, PA 16335 [email protected]
David Mausel - UMASS 61 Baker Road Shutesbury, MA 01072 [email protected]

Jack W. McFarland - Univ. Virginia Department of Biology & Wildlife University of Alaska Fairbanks, AK 99775
Christy Meredith Box492 Allegheny College 520 N. Main Street Meadville, PA 16335 [email protected]
Sarah E. Picard 20 Coppergate, Box D E. Granby, CT 06026
Trina Roberts 21Harrison Street, #2 Somerville, MA 02144 [email protected]
Jonathan Sanderman Box 2761 Brown University Providence, R102912
-Allegheny College
- Bates College
- Harvard University
- Brown University
Jonathan_ [email protected]
Nina Wurzburger 481 Gibson A venue Pacific Grove, CA 93950 [email protected]
- Univ. California, Davis
25

PERSONNEL AT THE HARVARD FOREST 1996-97
John Aber Bullard Fellow Joan Kraemer . Clerk Typist, part time
Michael Binford Associate Christopher Kruegler Administrator
Emery Boose Computer Scientist Oscar P. Lacwasan Custodian
Jeannette M. Bowlen Accountant Richard A. Lent Data Manager
John S. Burk Research Assistant Anita Locksmith Summer Cook Susan L. Clayden Research Assistant Harri Lorenzi Bullard Fellow
Willard Cole Woods Crew Lisa Marselle Summer Cook Sarah Cooper-Ellis Research Assistant Jason McLachlan Research Assistant
Elaine D. Doughty Laboratory Assistant Ellen G. Moriarty Graphic Artist, part time Natalie Drake Palynologist Glenn Motzkin Plant Ecologist John A. Edwards Forest Manager Sarah Neelon Research Assistant
Barbara J. Flye Librarian/Secretary John F. O'Keefe Museum Coordinator
Charles H.W. Foster Associate David Orwig Research Associate
David R. Foster Director Dorothy Recos-Smith Secretary
Donna Francis Research Associate Emily Russell Visiting Scholar
Eldon Franz Bullard Fellow Earl Saxon Bullard Fellow
Janice Fuller Research Associate Mayra Serrano Research Assistant
Jennifer Garrett Research Assistant Margaret Silk Bullard Fellow
Julian Hadley Research Associate Benjamin Slater Research Assistant
Donald E. Hesselton Woods Crew Charles C. Spooner Woods Crew
Guy D'Oyly Hughes MFS Candidate P. Barry Tomlinson E. C. Jeffrey Professor of
Dennis Knight Bullard Fellow Biology
Ruth Kern Research Associate John Wisnewski Woods Crew
Keith Kirby Bullard Fellow Steven Wofsy Associate
Matthew L. Kizlinski Research Assistant Kerry Woods Bullard Fellow
26


